Article

Trace Gas Monitoring by Hollow-Core Anti-Resonant Fiber-Enhanced Raman Spectroscopy with Sub-ppm Sensitivity

1
China Electric Power Research Institute, Beijing 100192, China
2
Key Laboratory of Specialty Fiber Optics and Optical Access Networks, Joint International Research Laboratory of Specialty Fiber Optics and Advanced Communication, Shanghai Collaborative Innovation Center for Intelligent Sensing Chip Technology, Shanghai Institute for Advanced Communication and Data Science, Shanghai University, Shanghai 200444, China
3
Electric Power Research Institute, State Grid Corporation of China, Fuzhou 350007, China
*
Authors to whom correspondence should be addressed.
These authors contributed equally to this work.
Photonics 2025, 12(11), 1133; https://doi.org/10.3390/photonics12111133
Submission received: 19 October 2025 / Revised: 8 November 2025 / Accepted: 12 November 2025 / Published: 17 November 2025
(This article belongs to the Special Issue Advanced Optical Fiber Sensors for Harsh Environment Applications)

Abstract

The demand for accurate and sensitive trace gas detection in environmental monitoring and industrial diagnostics has driven the development of compact, high-performance Raman-based sensing systems. In this study, a hollow-core anti-resonant fiber (HC-ARF)-enhanced Raman spectroscopy system was developed to improve detection sensitivity. A double-lens signal collection module coupled with a small-core multimode fiber (MMF) was designed to improve Raman signal collection efficiency while mitigating background interference. Together with the CCD row-selective integration strategy, this configuration effectively minimized spatially nonuniform noise and enhanced the overall signal-to-noise ratio of the system. The system performance was systematically evaluated under varying integration times, demonstrating linearity, repeatability, and long-term stability. Under optimized conditions, sub-ppm detection limits were achieved for CO2 isotopic species (12CO2: 5.13 ppm, 13CO2: 0.82 ppm) and multiple hydrocarbons including CH4 (2.5 ppm), C2H2 (2.7 ppm), C2H4 (2.84 ppm), and C2H6 (0.57 ppm). These results confirm the performance of the proposed configuration for multi-component gas detection. Overall, this work provides an effective strategy for noise suppression in HC-ARF-based fiber-enhanced Raman systems and demonstrates their potential for real-time, high-precision environmental and industrial gas analysis.

1. Introduction

Trace gas detection has become increasingly important in various fields, such as environmental monitoring, industrial process control, and medical diagnostics. With its expanding applications, higher accuracy and sensitivity requirements have been imposed on detection systems. Compared with conventional techniques such as semiconductor sensors, electrochemical sensors, and gas chromatography [1,2], optical spectroscopic methods offer distinct advantages including non-contact measurement, high selectivity, and high sensitivity. Various optical spectroscopic techniques have been extensively investigated and applied. Tunable diode laser absorption spectroscopy (TDLAS) provides excellent selectivity and sensitivity, but it typically relies on specific absorption lines and is therefore limited in simultaneous multi-component detection [2,3,4]. Photoacoustic spectroscopy (PAS) and photothermal spectroscopy (PTS) offer extremely high sensitivity, with detection limits reaching the ppb level, but are limited by their single-component detection capability and complex system configuration [5,6,7,8,9]. In contrast, Raman spectroscopy exhibits unique advantages in multi-component gas detection, as it enables the simultaneous identification of various gas species using a single excitation laser and can effectively detect infrared-inactive homonuclear diatomic molecules such as N2 and O2 [10]. Nevertheless, Raman-based gas sensing remains limited by the inherently weak scattering cross-section and the low molecular density of gases.
Various enhancement strategies have been developed to overcome the inherently low Raman scattering cross-section and weak signal intensity of gas molecules [11], thereby improving the detection sensitivity of Raman spectroscopy. Among these methods, cavity-enhanced Raman spectroscopy (CERS) [12], waveguide-enhanced Raman spectroscopy (WERS) [13], and fiber-enhanced Raman spectroscopy (FERS) [14] have demonstrated remarkable potential in signal enhancement. Compared with CERS and WERS, FERS offers superior compactness, optical stability, and integration capability, as it enables long-distance light–gas interactions within the optical fiber, effectively enhancing the Raman signal intensity [15,16]. In particular, hollow-core fiber (HCF) structures provide a highly promising platform for gas-phase Raman detection, as light predominantly propagates through the hollow core filled with the target gas, thereby maximizing the light–molecule interaction and significantly suppressing background noise originating from the silica material.
Typical HCF types include metal-coated capillary (MCC), hollow-core photonic bandgap fiber (HC-PBF), and hollow-core anti-resonant fibers (HC-ARF). William et al. [17] first proposed a MCC system for Raman gas detection, achieving a 30-fold signal enhancement for ambient N2. The large core diameter enables fast gas exchange, but high transmission loss and fluorescence from the silver layer limit sensitivity. HC-PBF achieves efficient light confinement and high signal collection efficiency through the photonic bandgap effect. Khannanov et al. [18,19] developed portable Raman gas sensing systems coupled to hollow-core photonic crystal fibers (HC-PCFs) with 532 nm excitation, enabling rapid and accurate multi-component analysis of natural gas and gas mixtures, including infrared-inactive species such as H2, O2, and N2. Although HC-PBF enables efficient light confinement and signal collection via the photonic bandgap effect, their small core size results in poor coupling stability, slow gas diffusion, and limited effective sensing length. In contrast, HC-ARF, based on the anti-resonant reflection mechanism, offers low-loss, broadband single-mode transmission and effectively suppress silica background interference, thereby significantly improving the signal-to-noise ratio and detection sensitivity. Knebl et al. [20,21,22] were the first to employ newly developed HC-ARF for Raman gas sensing, successfully demonstrating their applicability in environmental analysis. Overall, these advantages make HC-ARFs an ideal candidate for hollow-core fiber-enhanced Raman gas sensing and a promising direction for achieving high-sensitivity, low-detection-limit Raman spectroscopy.
In this work, a hollow-core anti-resonant fiber (HC-ARF)-enhanced Raman gas detection system incorporating a double-lens signal collection module, a small-core multimode fiber (MMF), and CCD row-selective integration was successfully developed, achieving high spectral fidelity and detection sensitivity. The optimized double-lens coupling configuration effectively enhanced Raman signal collection while suppressing background interference from the fiber and spectrometer. Combined with the CCD row-selective integration strategy, the system significantly improved the signal-to-noise ratio and overall detection stability. Under optimized operating conditions, ppm-level detection limits were achieved for CO2 isotopic species (12CO2: 5.13 ppm, 13CO2: 0.82 ppm) and multiple hydrocarbons, including CH4 (2.5 ppm), C2H2 (2.7 ppm), C2H4 (2.84 ppm), and C2H6 (0.57 ppm). These results demonstrate the sensitivity, stability, and multi-component detection capability of the proposed configuration, confirming its strong potential for real-time environmental monitoring, industrial process diagnostics, and compact field-deployable Raman sensing systems.

2. Experimental Setup

A compact forward-collection fiber-enhanced Raman spectroscopy system based on a hollow-core anti-resonant fiber (HC-ARF) was constructed, as illustrated in Figure 1. The system primarily consists of a laser coupling module, a compact gas chamber integrating both optical and gas flow paths, and a double-lens signal collection module. A continuous-wave (CW) all-solid-state 532 nm laser (Cobolt Samba 08-DPL, 0–150 mW, HÜBNER Photonics, Danderyd, Sweden) is first spectrally cleaned by a bandpass filter (BF, Semrock LL01-532E-12.5, Semrock (a part of IDEX Health & Science), Rochester, NY, USA) to remove stray light. The filtered beam is focused by an achromatic lens (AL1, JCOPTIX OLD2436-T2, f = 50 mm, Ningbo JCOPTIX Technology Co., Ltd., Ningbo, China) directly into the hollow-core anti-resonant fiber, where the excitation light interacts with the gas sample. A power meter (S120C, PM100USB, Thorlabs, 56 Sparta Avenue, Newton, NJ, USA) at the fiber end monitors coupling efficiency, reaching 80%. Forward-scattered Raman signal emerging from the HC-ARF is recollimated by a achromatic lens (AL2, JCOPTIX OLD2434-T2, f = 40 mm, Technology Park, Ningbo, China). Residual pump and Rayleigh light are rejected by a dichroic mirror (DM, Chorma RT532rdc, Chroma Technology Corp, Bellows Falls, VT, USA) and a long-pass filter (LF, Semrock LP03-532RE-2, Semrock (a part of IDEX Health & Science), Rochester, NY, USA) and the remaining Stokes signal is focused by achromatic lens L3 (AL3, JCOPTIX OLD2434-T2, f = 40 mm, Technology Park, Ningbo, China) into a multimode collection fiber (MMF, core 25 µm, NA = 0.10). The MMF terminates at the input of the spectrometer (Princeton Instruments HRS-300, Teledyne Princeton Instruments, Trenton, NJ, USA) equipped with a deep-cooled CCD (PIXIS-400BX, Teledyne Princeton Instruments, Trenton, NJ, USA) for spectral acquisition. This compact, direct-coupling arrangement minimizes alignment optics while maintaining efficient excitation and high-fidelity forward Raman collection.
The detailed structure of the HC-ARF gas cell is illustrated in Figure 2. The gas chamber is designed to simultaneously provide optical alignment and controlled gas flow. Both ends of the chamber are terminated with customized fiber adapters (FA1 and FA2) that provide mechanical stability and optical sealing. The two adapters are connected by a tubular gas conduit, inside which the HC-ARF is mounted to serve as the optical and gas interaction channel. The HC-ARF is fixed in a standard V-groove fiber holder (LBTEK OFF32) using double-sided adhesive tape and precisely mounted within FA1 and FA2 to ensure alignment stability. Each adapter includes a 3-way valve and pressure gauge to control gas inlet/outlet flow and monitor internal pressure. Optical windows, fixtures (1–3) and a seal ring ensure airtight sealing.
The gas-chamber module employs a 4 m-long hollow-core anti-resonant fiber (HC-ARF, STF-VIS 500–650, China Linfiber Tech. Ltd., Beijing, China), featuring a core diameter of 29 μm. The microscopic image of the fiber structure is shown in Figure 3a. Furthermore, the measured transmission spectrum, shown in the inset of Figure 3c, reveals a low-loss window spanning 500–650 nm, which fully covers the excitation wavelength of 532 nm and the corresponding Raman-shifted spectral range. The 4m-long HC-ARF is coiled on a 600 mm diameter spool to minimize bending loss. Finite element simulations using COMSOL 6.2 Multiphysics were conducted to obtain the mode field distribution of the HC-ARF at 532 nm, as shown in Figure 3b. The simulation was performed under typical structural parameters (cladding diameter: 200 μm, wall thickness: 400 nm). Mesh refinement followed standard criteria: λ/5.8 in silica and λ/4 in air, with a perfectly matched layer (PML) applied at the outer boundary to suppress reflection. The simulated fundamental mode exhibits strong confinement within the hollow core, indicating efficient light guidance and minimal overlap with the silica structure, which is beneficial for reducing background Raman scattering.

3. Experimental Details

3.1. Apparatus for Background Noise Suppression

Enhancing the signal-to-noise ratio (SNR) of the HC-ARF-based Raman spectroscopy system requires effective suppression of the spatially nonuniform background fluorescence noise originating from scattering at the fiber coupling interface and within the cladding region [23]. This background, typically concentrated in the outer cladding and surrounding the central Raman signal, severely restricts detection sensitivity and stability.
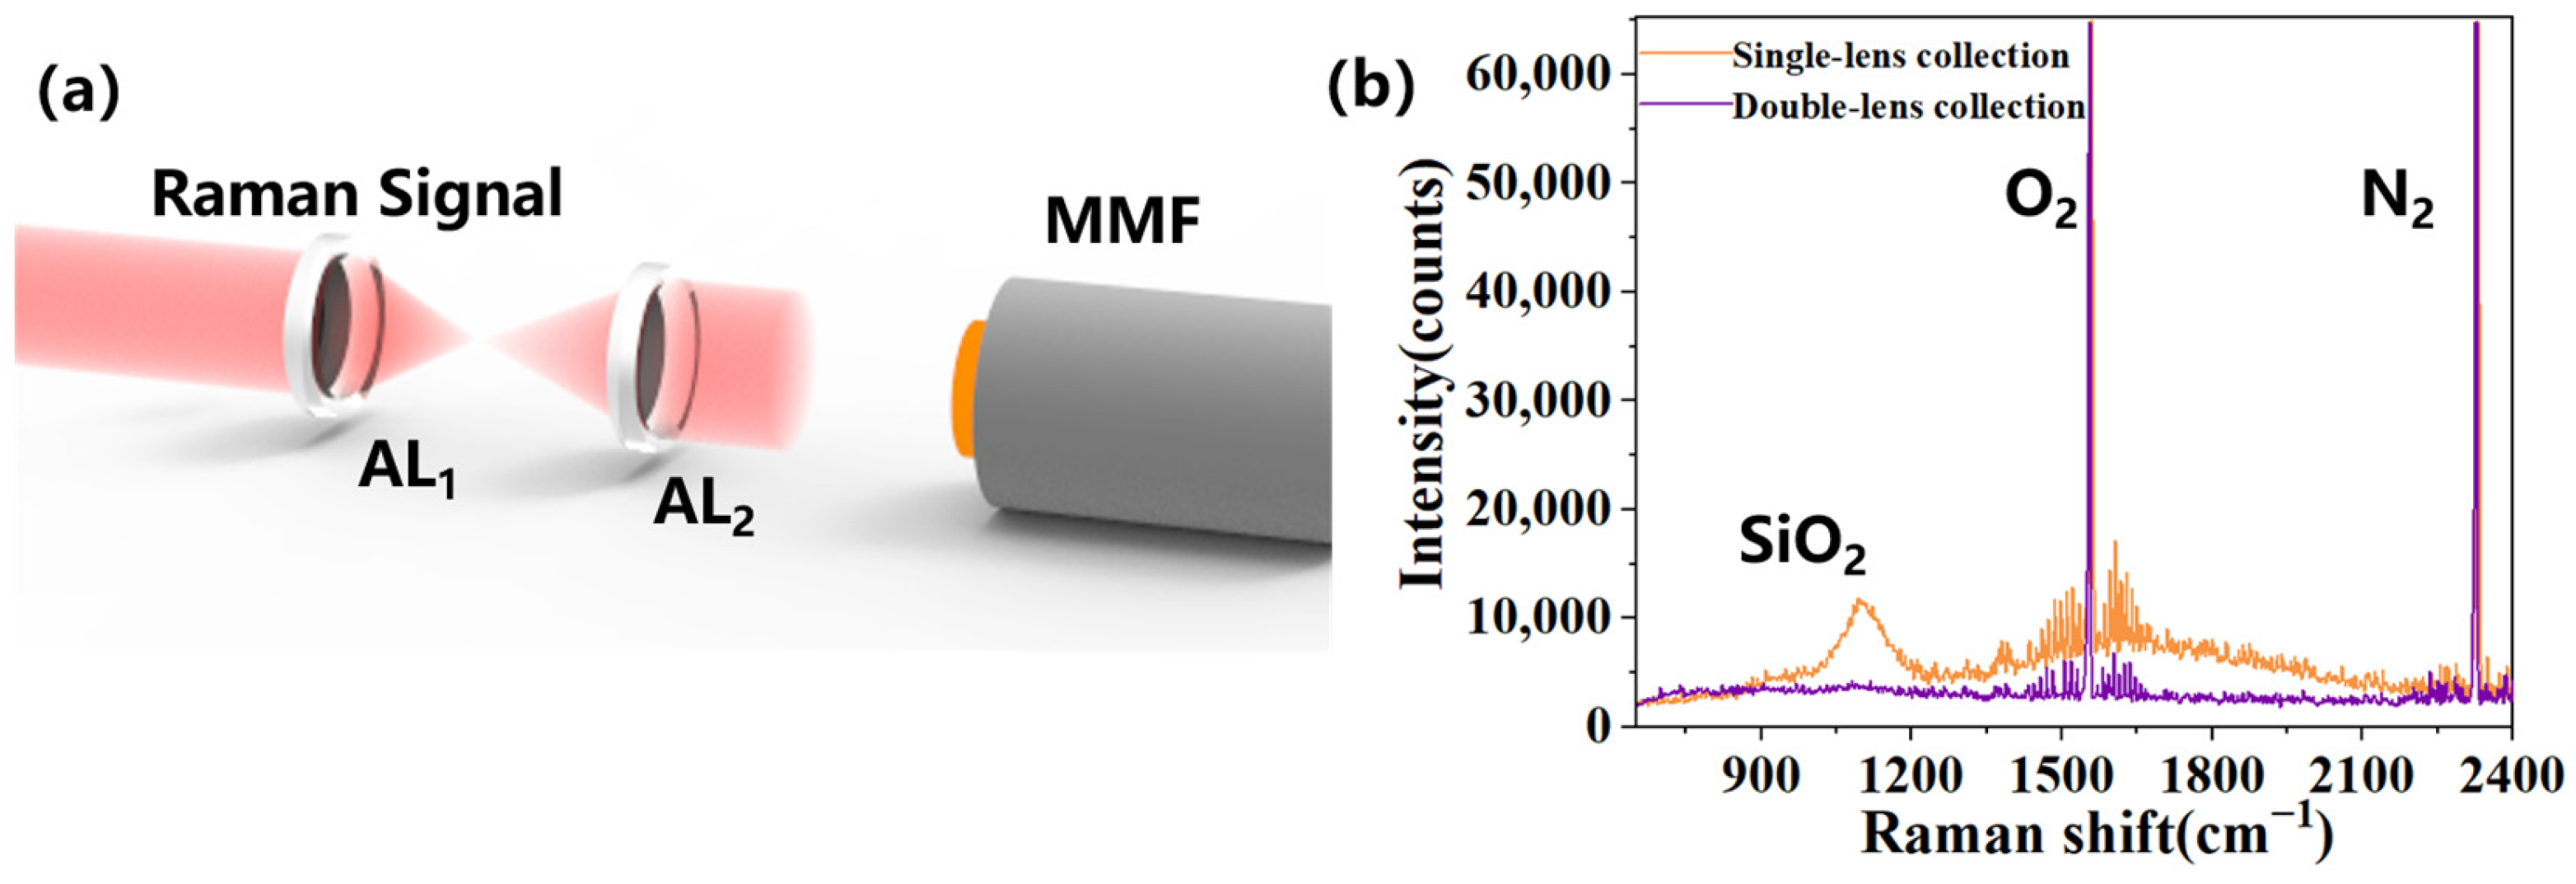
Accordingly, a double-lens signal collection module was developed to improve Raman signal collection efficiency while mitigating such background noise, as illustrated in Figure 4a. In this configuration, the Raman light emerging from the HC-ARF is relayed by two achromatic lenses (AL1 and AL2, focal length ratio of 1:1) to form a~30 μm image at the entrance of a multimode fiber (MMF, 25 μm core diameter) that is directly connected to the spectrometer. Experimental results, presented in Figure 4b, confirm that the double-lens configuration substantially enhances Raman signal intensity while suppressing silica background, demonstrating its superiority in both signal collection efficiency and noise reduction.
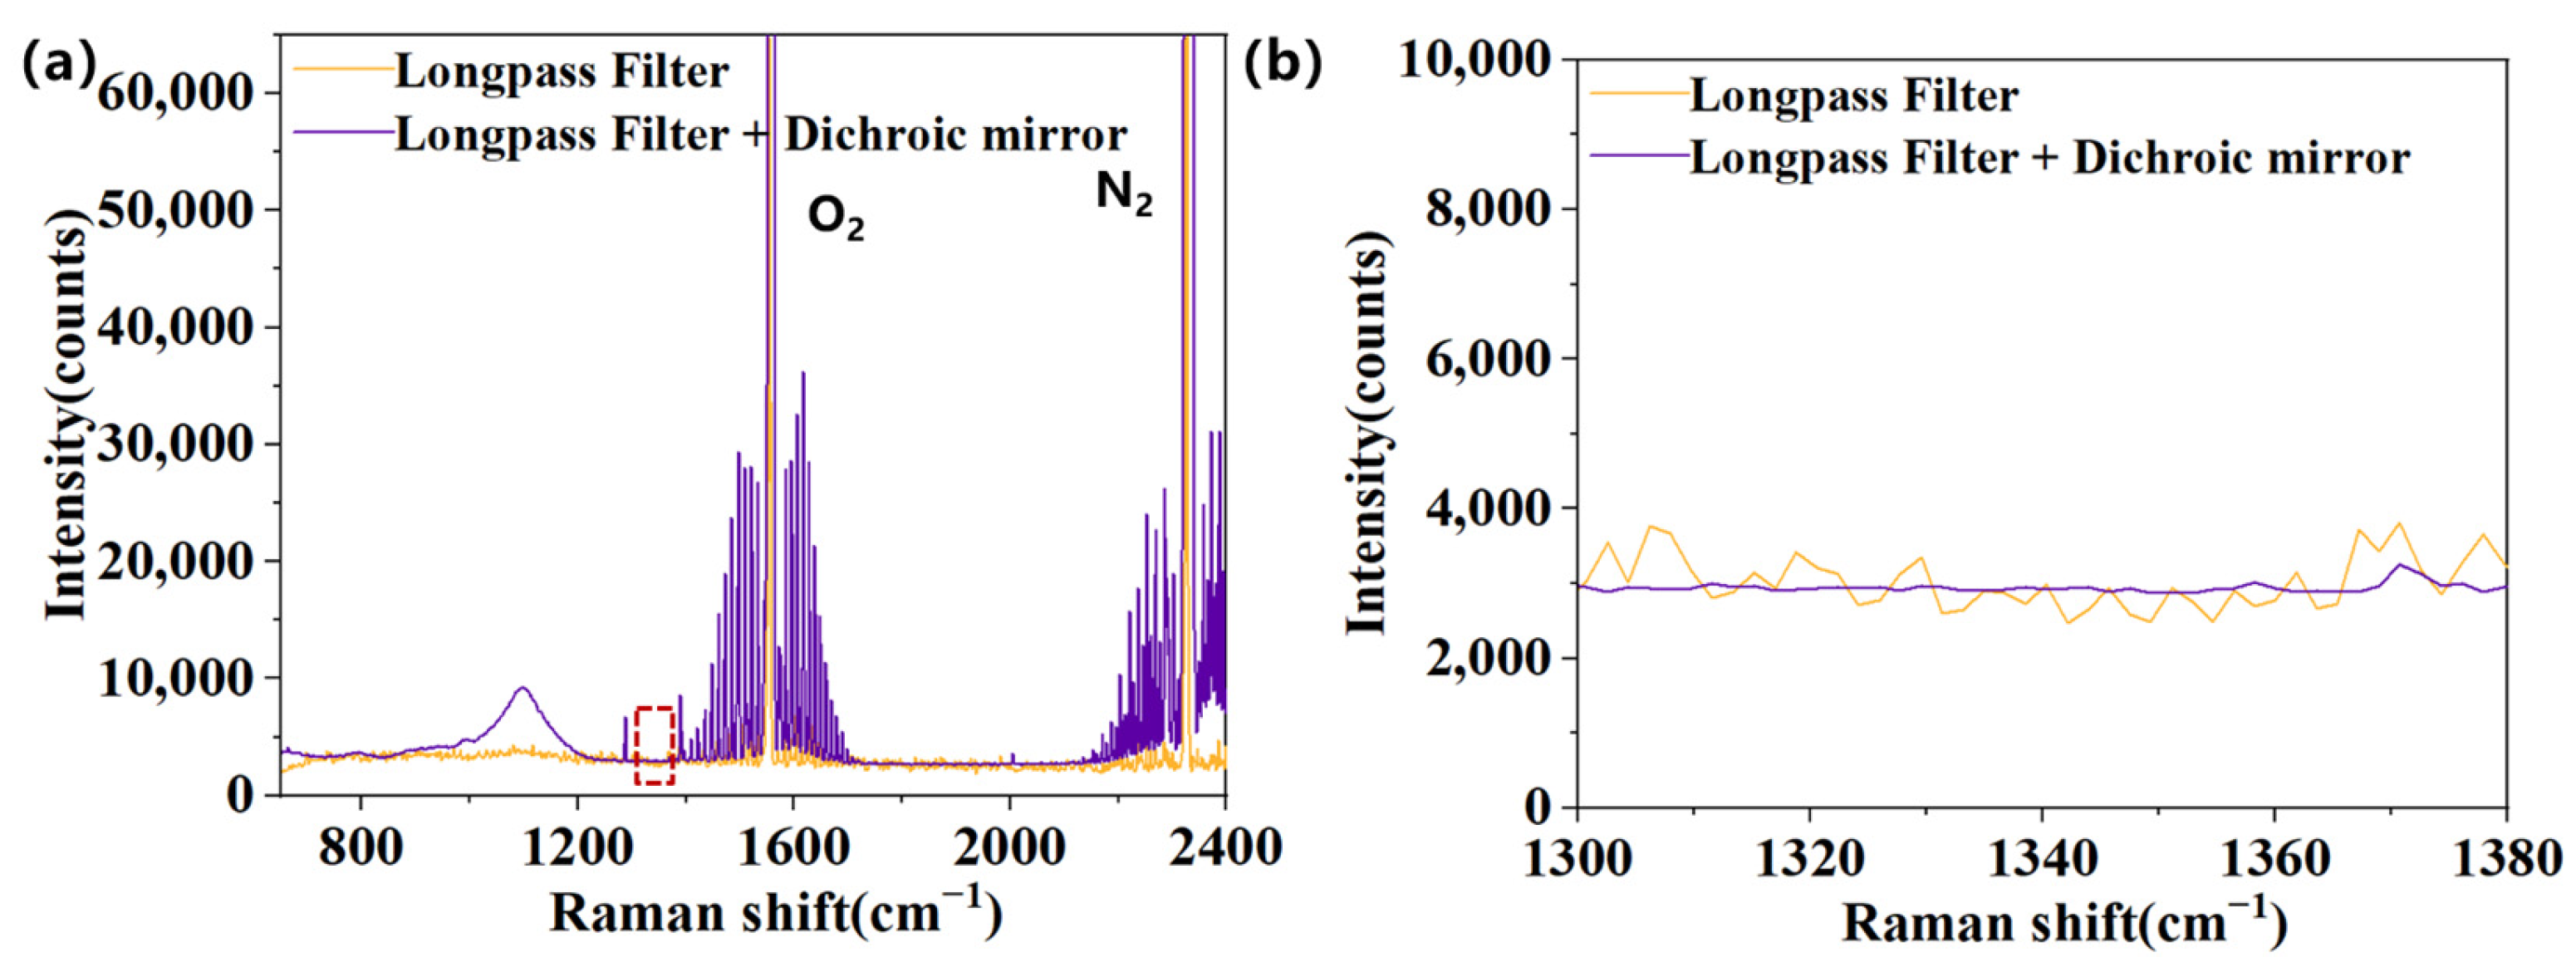
To further suppress the spatially nonuniform background noise after optimizing the collection module, additional optical filtering was implemented to remove the residual excitation light. In forward Raman configurations, the transmitted laser and Raman signal co-propagate, and a single long-pass filter is often insufficient to completely reject the strong 532 nm excitation component. This residual leakage can raise the baseline and mask weak gas Raman features. To address this issue, a dichroic mirror was added in series with the long-pass filter to enhance laser suppression without significantly attenuating the Raman signal.
Figure 5a compares the Raman spectra obtained using a single long-pass filter and the combined long-pass + dichroic mirror configuration under identical integration time. The enlarged view of the CO2 Raman region in Figure 5b (1300–1380 cm−1) provides a clearer comparison of the background noise level. The baseline fluctuations are reduced when employing the dual-filter configuration, and the CO2 Raman peaks appear more distinct. To quantitatively evaluate the noise performance, the standard deviation of the background signal in the 1298–1350 cm−1 region was used as a measure of noise. The noise level decreased from 248.64 to 33.15 counts when employing the dual-filter configuration, corresponding to an improvement factor of approximately 7.5. This demonstrates that the dual-filter design effectively eliminates unwanted background light, thereby improving the signal-to-noise ratio (SNR) and overall spectral fidelity of the system.

3.2. Spatial Filtering Method

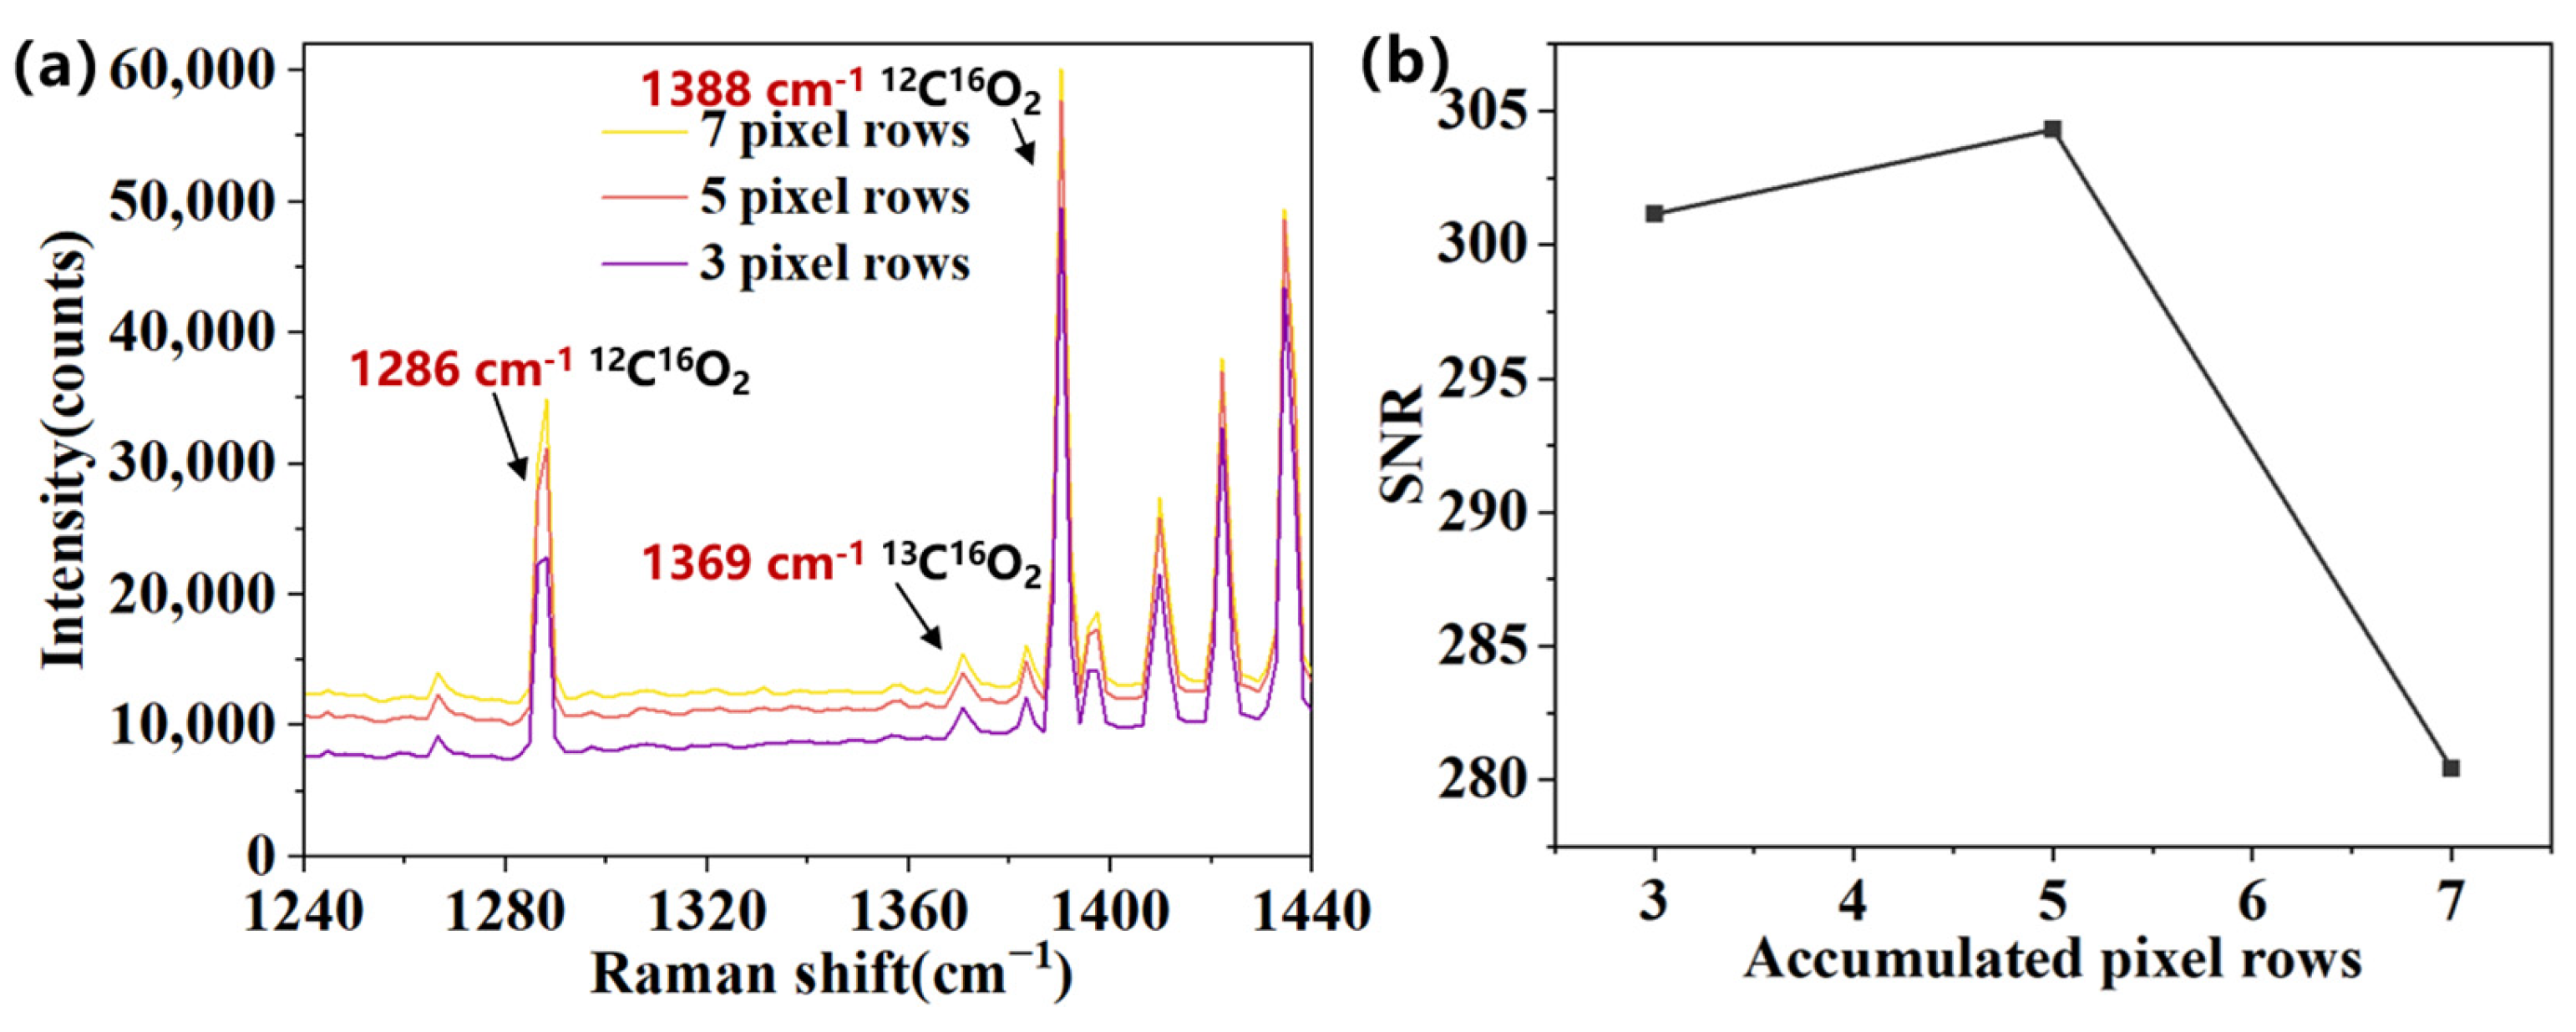
Following optical filtering, spatial nonuniformity originating from the fiber and spectrometer was further reduced by employing a row-selective integration strategy on the CCD detector. This technique enables flexible control of the effective detection area by selectively integrating only the pixel rows containing clean Raman signals, thereby eliminating residual lateral noise. To evaluate the effect of the integration range, Raman spectra were extracted by integrating 3, 5, and 7 CCD pixel rows, respectively, under the following conditions: excitation power of 150 mW, slit width of 20 μm and CCD exposure time of 450 s, and measurements conducted at standard atmospheric pressure (1 atm) and room temperature, as shown in Figure 6a. Increasing the number of accumulated rows enhances the overall signal intensity; however, excessive integration introduces additional background noise from adjacent regions.
As summarized in Figure 6b, the optimal signal-to-noise ratio (SNR) was obtained when integrating 5-pixel rows, which provided a balance between signal intensity and noise suppression. This result demonstrates that selecting an appropriate CCD readout region is crucial for achieving stable and high-SNR Raman detection in hollow-core fiber systems.

4. Experimental Results

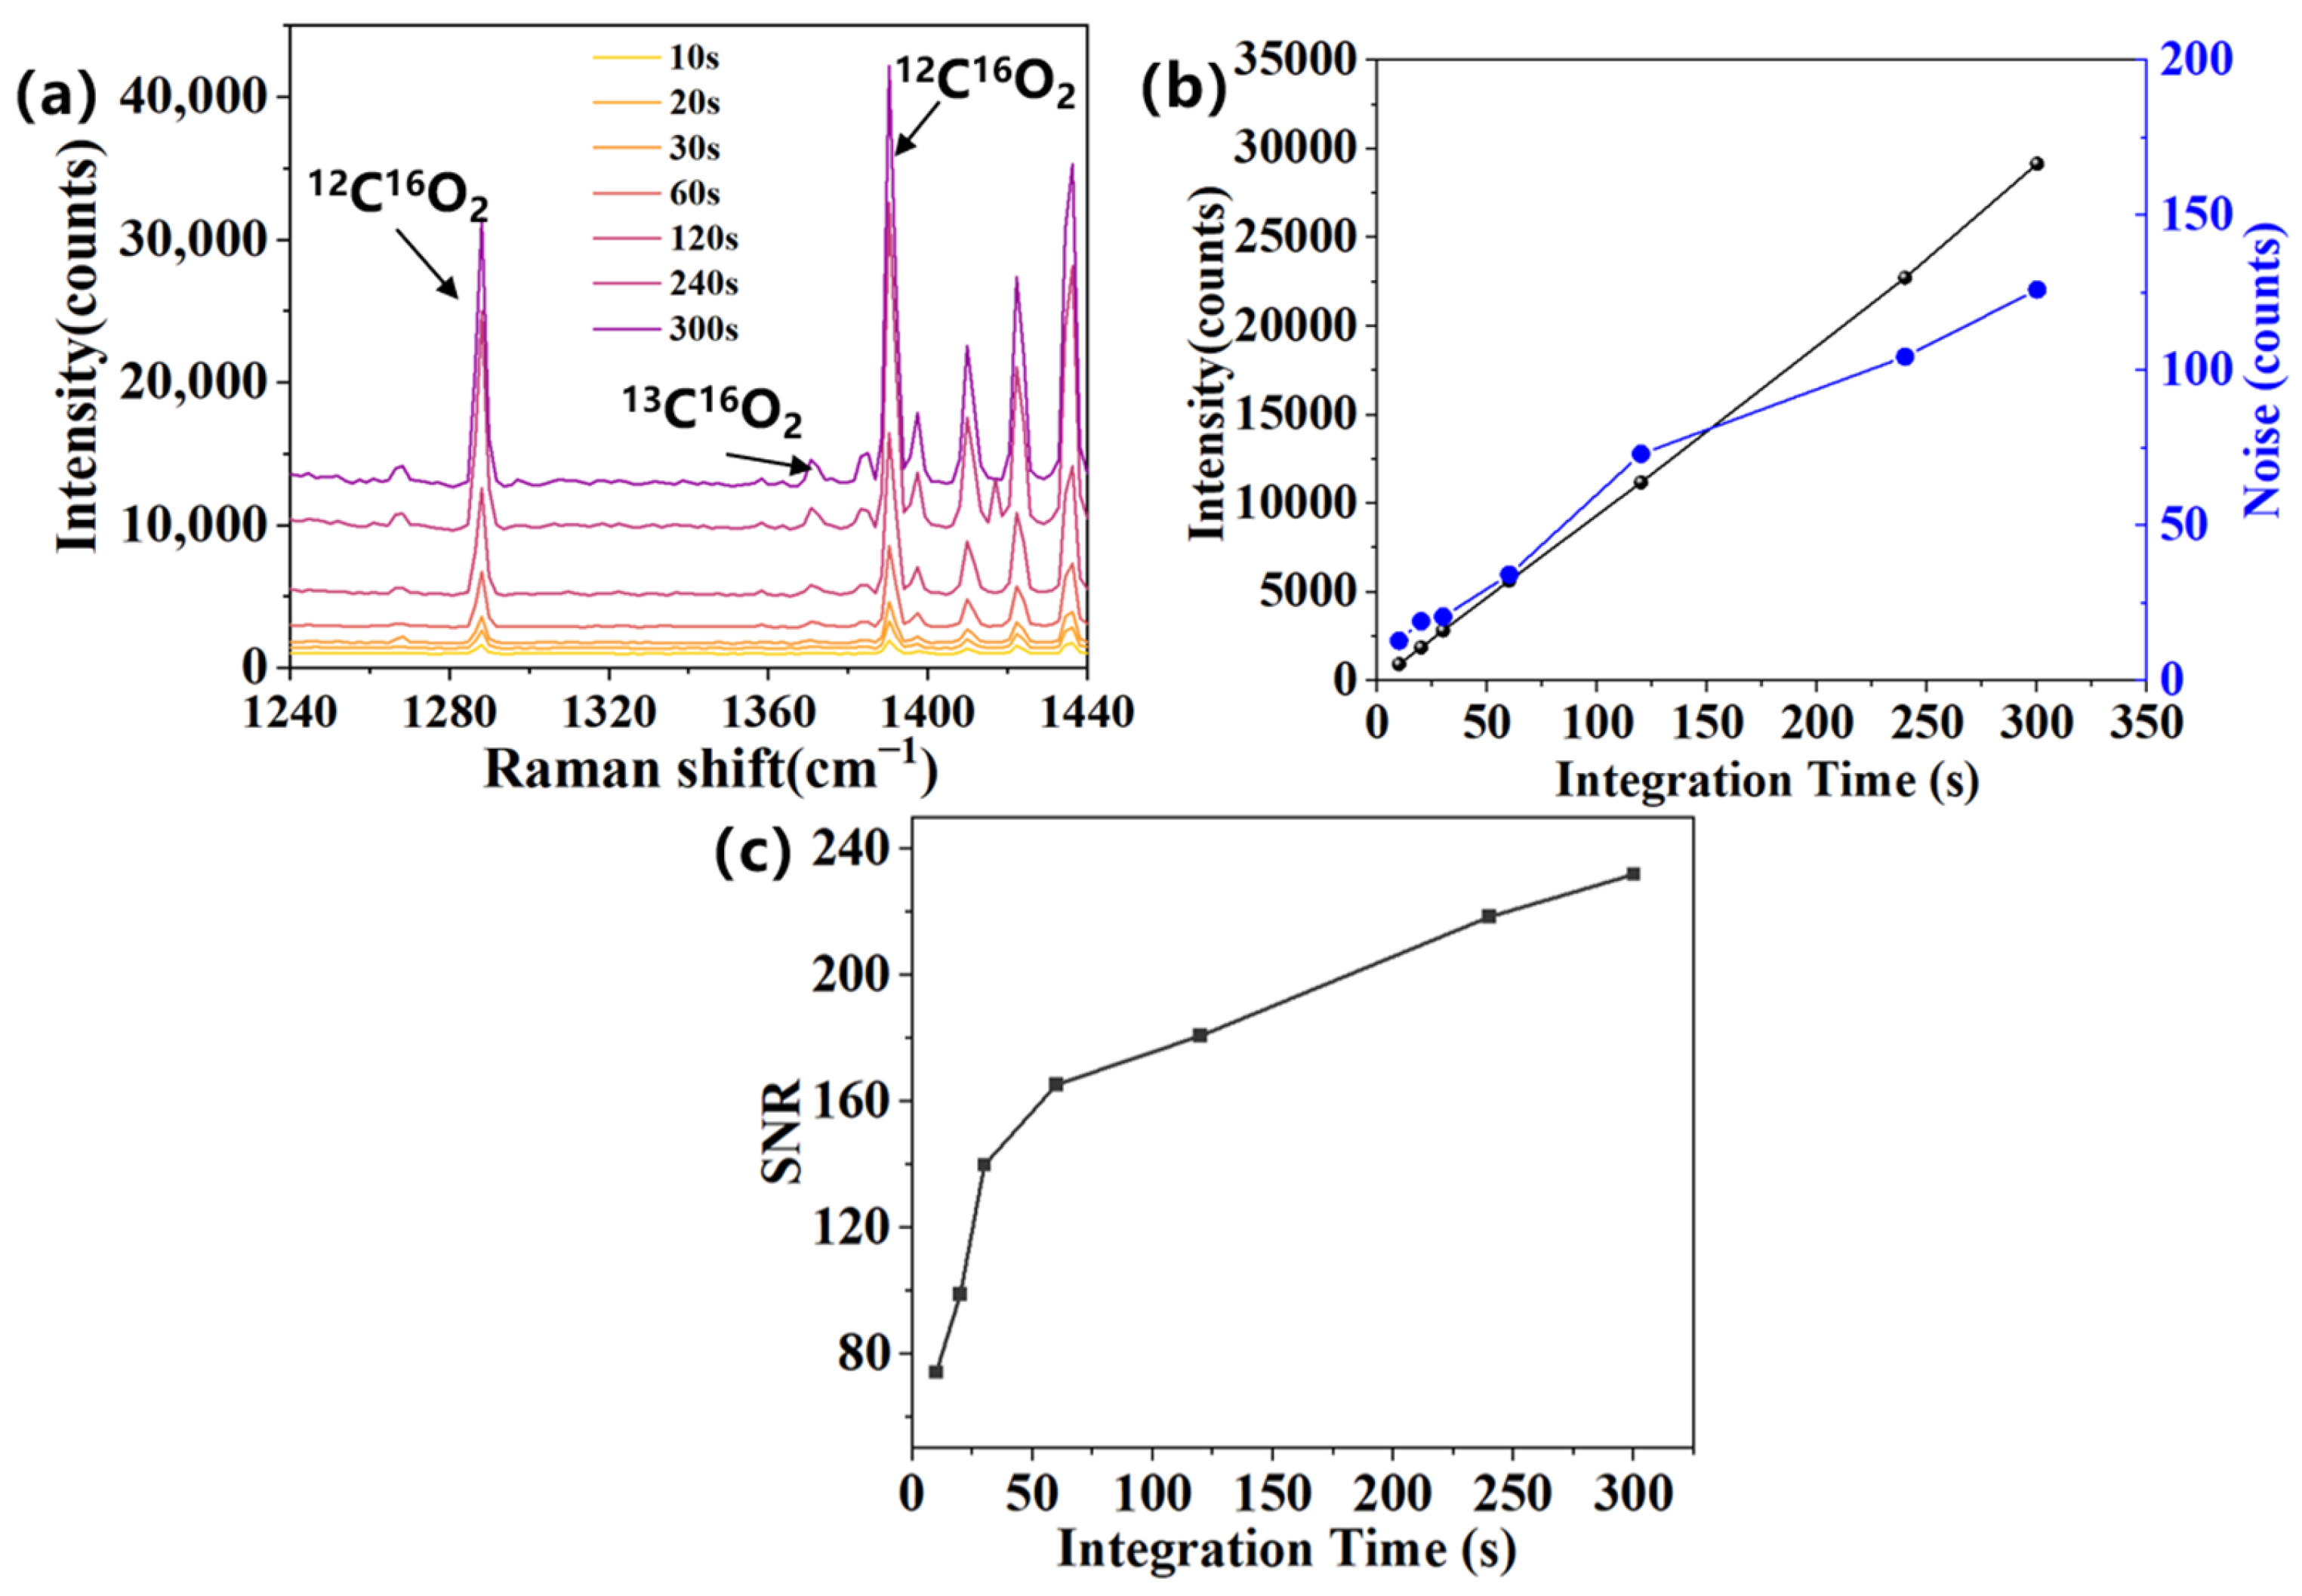
To evaluate the temporal performance and detection stability of the proposed hollow-core fiber Raman sensing system, the influence of CCD integration time on the Raman signal quality was systematically investigated. Unlike the spatial filtering optimization discussed previously, this section focuses on the temporal accumulation process during spectral acquisition. Raman spectra of CO2 were recorded under constant experimental conditions (excitation power of 150 mW, slit width of 20 μm and CCD integration over the central 5 pixel rows) at standard atmospheric pressure (1 atm) and room temperature, while varying the CCD integration time from 10 s to 300 s, as illustrated in Figure 7a.The Raman peaks corresponding to 12C16O2 (1286 cm−1 and 1388 cm−1, around 396 ppm) and 13C16O2 (1369 cm−1, around 4 ppm) become progressively more pronounced with longer integration times, indicating an enhanced photon accumulation efficiency. As shown in Figure 7b,c, both signal intensity and noise increased with integration duration, but the growth rate of signal surpassed that of noise, leading to a steady rise in signal-to-noise ratio (SNR). The monotonic improvement of SNR demonstrates that appropriate extension of the integration time effectively enhances detection sensitivity and measurement repeatability in the HC-ARF Raman system.
Under a 300 s integration condition, the ν+ vibrational peaks of 13CO2 (1369 cm−1) and 12CO2 (1388 cm−1) were selected for limit-of-detection (LOD) analysis. The corresponding signal intensities were 1856 and 29,161 counts, respectively, with a baseline noise level of 126.09. The calculated signal-to-noise ratios (SNRs) were 14.72 for 13CO2 and 231.41 for 12CO2. Based on these values, the LODs were estimated to be 0.82 ppm for 13CO2 and 5.13 ppm for 12CO2.
The LOD was determined using the standard definition [24]:
LOD   =   3 C SNR   ,
where C is the actual concentration of the target gas. Here, the LOD corresponds to the minimum detectable concentration at which the Raman signal equals three times the baseline noise. Notably, the proposed configuration enables direct quantitative Raman measurements without the need for gas pre-concentration or background subtraction. This advantage stems from the strong light–gas interaction within the HC-ARF, which effectively suppresses silica-induced Raman signals, and from the optimized optical and CCD integration design that minimizes system background. Consequently, the obtained spectra feature a clean baseline and high SNR, allowing real-time and straightforward trace gas analysis under ambient conditions.
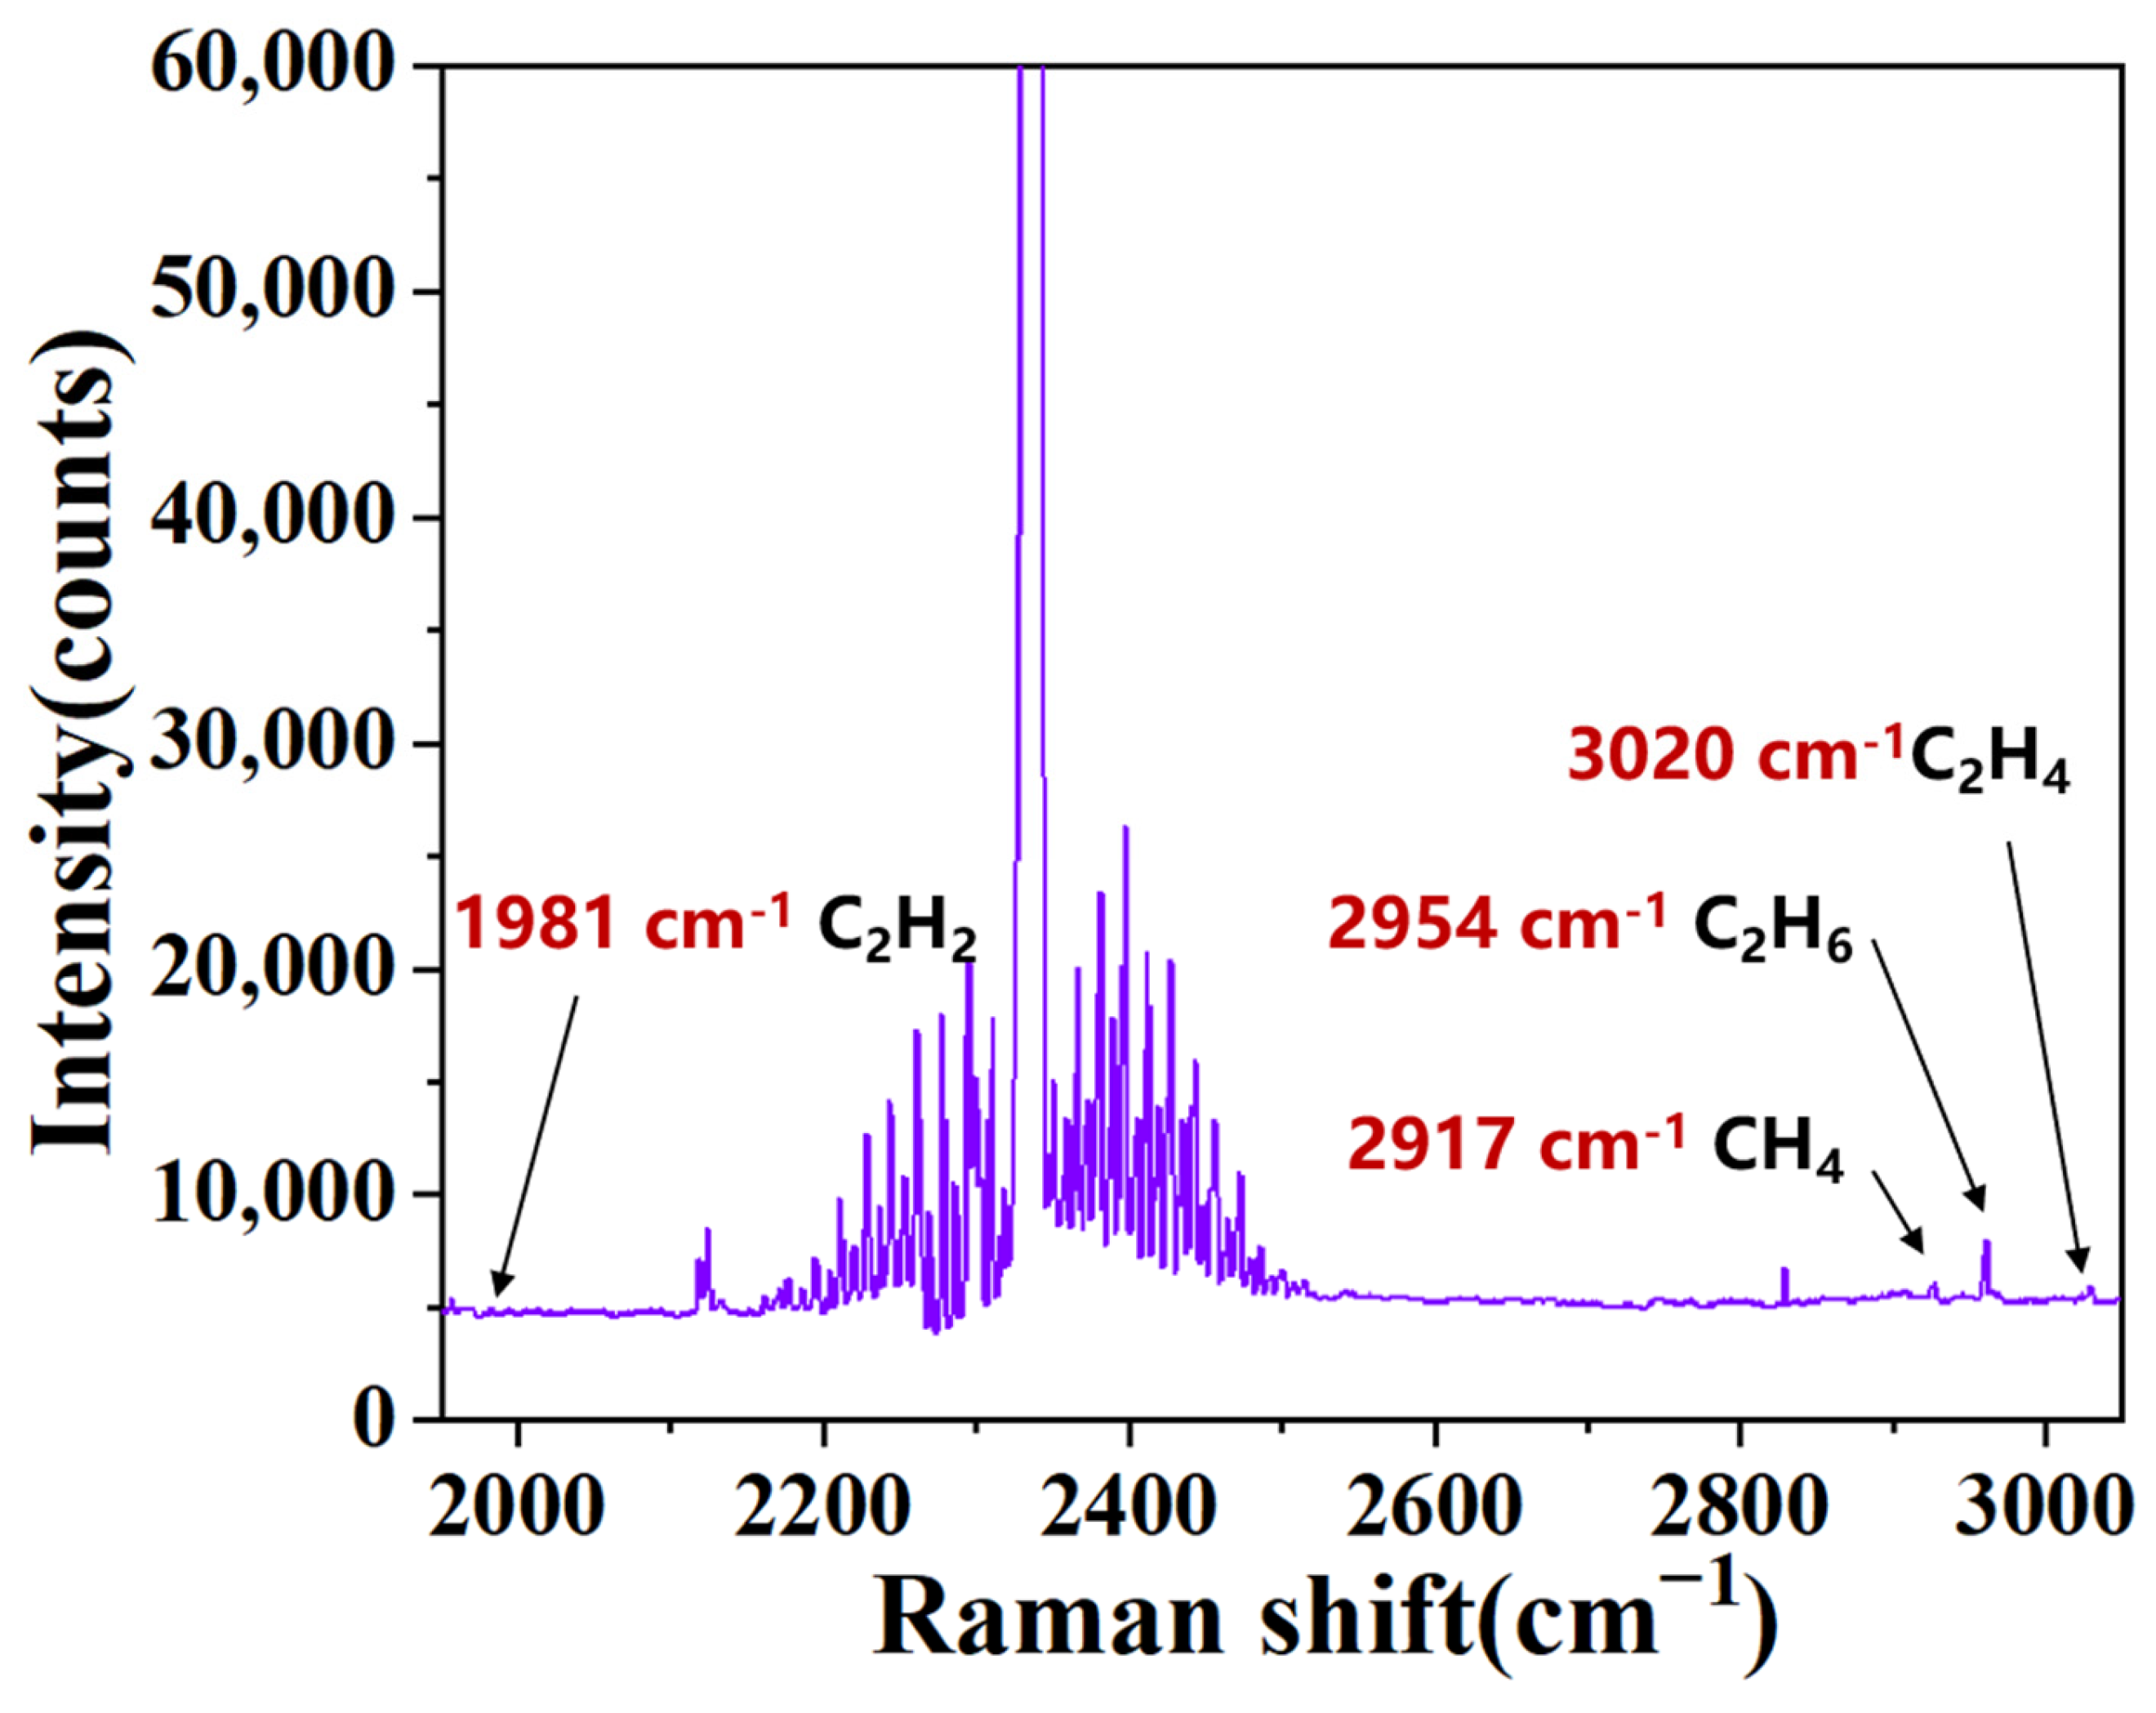
Building upon the quantitative evaluation of CO2 detection performance, the developed HC-ARF Raman sensing system was further examined for its capability to detect trace hydrocarbon gases. Prior to gas injection, the gas chamber was evacuated for approximately 15 min to remove residual air and moisture, ensuring a clean optical path and stable baseline. Subsequently, hydrocarbon gases at a concentration of approximately 5 ppm were introduced into the hollow-core fiber for trace-level detection sensitivity assessment. All test gases (CH4, C2H2, C2H4, and C2H6) were provided as certified mixtures in an argon (Ar) balance by Shanghai Ujali Special Gases Co., Ltd.; The corresponding Raman spectrum, presented in Figure 8, was recorded under an excitation power of 150 mW, a slit width of 20 μm, and a CCD integration time of 300 s, with signal accumulation over the central 5 pixel rows, at standard atmospheric pressure (1 atm) and room temperature. Distinct Raman peaks associated with CH4 (2917 cm−1), C2H6 (2954 cm−1), C2H4 (3020 cm−1), and C2H2 (1981 cm−1) are clearly identifiable, and a quantitative summary of their spectral parameters—including peak positions, molecular assignments, measured intensities, signal-to-noise ratios (SNRs), and limits of detection (LODs)—is presented in Table 1, demonstrating the system’s strong potential for multi-component hydrocarbon detection at trace concentrations.

5. Conclusions

In summary, we have demonstrated a hollow-core anti-resonant fiber (HC-ARF)-enhanced Raman gas detection system integrating a double-lens signal collection module, a small-core multimode fiber (MMF), and CCD row-selective integration, achieving high spectral fidelity, sub-ppm detection limits, and exceptional detection sensitivity. The optimized optical collection design significantly improves Raman signal coupling efficiency while mitigating background interference, and the adaptive CCD integration effectively suppresses spatially nonuniform noise, enhancing detection stability. This system has reliably detected CO2 isotopic species (12CO2: 5.13 ppm, 13CO2: 0.82 ppm) and several hydrocarbons, including CH4 (2.5 ppm), C2H2 (2.7 ppm), C2H4 (2.84 ppm), and C2H6 (0.57 ppm). These results highlight the system’s strong capability for multi-component gas detection and its potential for real-time environmental monitoring and industrial diagnostics. Future work will focus on optimizing system sensitivity by extending the fiber length, improving optical coupling, and exploring pressurized conditions for further enhancement of detection limits, along with evaluating different core-diameter MMFs to achieve a better balance between coupling efficiency and background suppression.

Author Contributions

Conceptualization, X.Z. and X.W.; Data curation, H.Y.; Formal analysis, H.Y.; Funding acquisition, X.Z. and X.W.; Investigation, H.Y.; Methodology, H.Y.; Project administration, X.Z. and X.W.; Resources, Y.M., H.L. (Huixin Liu), H.L. (Hongsong Lian) and Q.L.; Supervision, X.Z. and X.W.; Writing—original draft, H.Y.; Writing—review and editing, X.Z. and X.W. All authors have read and agreed to the published version of the manuscript.

Funding

This research was funded by the Science and Technology Project of State Grid Corporation of China (No. 5700-202321618A-3-2-ZN).

Data Availability Statement

The original contributions presented in this study are included in the article. Further inquiries can be directed to the corresponding authors.

Conflicts of Interest

Author Xuran Zhu, Yanzong Meng were employed by the company China Electric Power Research Institute Co., Ltd. Author Huixin Liu, Hongsong Lian, Qingwen Lian were employed by the company Electric Power Research Institute Co., Ltd. The remaining authors declare that the research was conducted in the absence of any commercial or financial relationships that could be construed as a potential conflict of interest.

References

  1. Li, C.; Dong, L.; Zheng, C.; Tittel, F.K. Compact TDLAS based optical sensor for ppb-level ethane detection by use of a 3.34 μm room-temperature CW interband cascade laser. Sens. Actuators B Chem. 2016, 232, 188–194. [Google Scholar] [CrossRef]
  2. He, Y.; Ma, Y.; Tong, Y.; Yu, X.; Tittel, F.K. Ultra-high sensitive light-induced thermoelastic spectroscopy sensor with a high Q-factor quartz tuning fork and a multipass cell. Opt. Lett. 2019, 44, 1904–1907. [Google Scholar] [CrossRef]
  3. Cui, R.; Dong, L.; Wu, H.; Ma, W.; Xiao, L.; Jia, S.; Chen, W.; Tittel, F.K. Three-dimensional printed miniature fiber-coupled multipass cells with dense spot patterns for ppb-level methane detection using a near-IR diode laser. Anal. Chem. 2020, 92, 13034–13041. [Google Scholar] [CrossRef]
  4. Dong, L.; Tittel, F.K.; Li, C.; Sanchez, N.P.; Wu, H.; Zheng, C.; Yu, Y.; Sampaolo, A.; Griffin, R.J. Compact TDLAS based sensor design using interband cascade lasers for mid-IR trace gas sensing. Opt. Express 2016, 24, A528–A535. [Google Scholar] [CrossRef]
  5. Ma, Y.; He, Y.; Tong, Y.; Yu, X.; Tittel, F.K. Quartz-tuning-fork enhanced photothermal spectroscopy for ultra-high sensitive trace gas detection. Opt. Express 2018, 26, 32103–32110. [Google Scholar] [CrossRef]
  6. Mondello, L.; Tranchida, P.Q.; Dugo, P.; Dugo, G. Comprehensive two-dimensional gas chromatography-mass spectrometry: A review. Mass Spectrom. Rev. 2008, 27, 101–124. [Google Scholar] [CrossRef]
  7. Nedjalkov, A.; Meyer, J.; Köhring, M.; Doering, A.; Angelmahr, M.; Dahle, S.; Sander, A.; Fischer, A.; Schade, W. Toxic gas emissions from damaged lithium ion batteries—Analysis and safety enhancement solution. Batteries 2016, 2, 5. [Google Scholar] [CrossRef]
  8. Schmidt, F.M.; Foltynowicz, A.; Ma, W.; Axner, O. Fiber-laser-based noise-immune cavity-enhanced optical heterodyne molecular spectrometry for Doppler-broadened detection of C2H2 in the parts per trillion range. J. Opt. Soc. Am. B 2007, 24, 1392–1405. [Google Scholar] [CrossRef]
  9. Weber, A. Raman Spectroscopy of Gases and Liquids; Springer Science & Business Media: Berlin/Heidelberg, Germany, 2012; Volume 11. [Google Scholar]
  10. Zhou, Y.; Liu, J.; Guo, S.; Zhao, G.; Ma, W.; Cao, Z.; Dong, L.; Zhang, L.; Yin, W.; Wu, Y. Laser frequency stabilization based on a universal sub-Doppler NICE-OHMS instrumentation for the potential application in atmospheric lidar. Atmos. Meas. Technol. 2019, 12, 1807–1814. [Google Scholar] [CrossRef]
  11. Kong, W.; Wan, F.; Wang, R.; Sun, H.; Chen, W. Signal enhancement and noise suppression technologies in Raman spectroscopic gas sensing. Appl. Phys. Rev. 2025, 12, 011334. [Google Scholar] [CrossRef]
  12. Pearman, W.F.; Carter, J.C.; Angel, S.M.; Chan, J.W. Multipass capillary cell for enhanced Raman measurements of gases. Appl. Spectrosc. 2008, 62, 285–289. [Google Scholar] [CrossRef] [PubMed]
  13. Zhao, J.; Cao, X.; Xu, W.; Xu, S. Waveguide—based Raman enhancement strategies. J. Raman Spectrosc. 2023, 55, 355–376. [Google Scholar] [CrossRef]
  14. Nie, Q.; Liu, Z.; Cheng, M.; Pei, S.; Yang, D.; Guo, D.; Yang, M. Review on Hollow-Core Fiber Based Multi-Gas Sensing Using Raman Spectroscopy. Photonic Sens. 2024, 14, 240412. [Google Scholar] [CrossRef]
  15. Wang, J.; Chen, W.; Wang, P.; Wan, F.; Zhang, Z.; Gao, S.; Wang, Y. Analysis of SF6 decomposed products by fibre-enhanced Raman spectroscopy for gas-insulated switchgear diagnosis. High Volt. 2023, 9, 206–216. [Google Scholar] [CrossRef]
  16. Blohm, A.; Domes, C.; Frosch, T. Isotopomeric Peak Assignment for N2O in Cross-Labeling Experiments by Fiber-Enhanced Raman Multigas Spectroscopy. Anal. Chem. 2024, 96, 2883–2892. [Google Scholar] [CrossRef]
  17. Pearman, W.F.; Carter, J.C.; Angel, S.M.; Chan, J.W. Quantitative measurements of CO2 and CH4 using a multipass Raman capillary cell. Appl. Opt. 2008, 47, 4627–4632. [Google Scholar] [CrossRef]
  18. Khannanov, M.N.; Kirpichev, V.E. Express analysis of natural gas and gas mixtures using a portable Raman spectrometer coupled to a hollow photon-crystal light guide. Bull. Russ. Acad. Sci. Phys. 2021, 85, 169–173. [Google Scholar] [CrossRef]
  19. Khannanov, M.N.; Vankov, A.B.; Novikov, A.A.; Semenov, A.P.; Gushchin, P.A.; Gubarev, S.I.; Kirpichev, V.E.; Morozova, E.N.; Kulik, L.V.; Kukushkin, I.V. Analysis of natural gas using a portable hollow-core photonic crystal coupled Raman spectrometer. Appl. Spectrosc. 2020, 74, 1496–1504. [Google Scholar] [CrossRef]
  20. Knebl, A.; Domes, R.; Yan, D.; Popp, J.; Trumbore, S.; Frosch, T. Fiber-Enhanced Raman Gas Spectroscopy for 18O-13C-Labeling Experiments. Anal. Chem. 2019, 91, 7562–7569. [Google Scholar] [CrossRef]
  21. Knebl, A.; Domes, R.; Wolf, S.; Domes, C.; Popp, J.; Frosch, T. Fiber-Enhanced Raman Gas Spectroscopy for the Study of Microbial Methanogenesis. Anal. Chem. 2020, 92, 12564–12571. [Google Scholar] [CrossRef]
  22. Knebl, A.; Domes, C.; Domes, R.; Wolf, S.; Popp, J.; Frosch, T. Hydrogen and C2-C6 Alkane Sensing in Complex Fuel Gas Mixtures with Fiber-Enhanced Raman Spectroscopy. Anal. Chem. 2021, 93, 10546–10552. [Google Scholar] [CrossRef]
  23. Yan, D.; Popp, J.; Frosch, T. Analysis of fiber-enhanced Raman gas sensing based on Raman chemical imaging. Anal. Chem. 2017, 89, 12269–12275. [Google Scholar] [CrossRef]
  24. Voigtman, E. Limits of detection and decision. Part 1. Spectrochim. Acta Part B At. Spectrosc. 2008, 63, 115–128. [Google Scholar] [CrossRef]
Figure 1. Schematic of the experimental setup for Forward-collection fiber-enhanced gas Raman spectroscopy system.
Photonics 12 01133 g001
Figure 2. Structure of the customized gas chamber, integrating fixtures, adapters, a V-groove holder, optical windows, and sealing components for optical alignment and airtight connection.
Photonics 12 01133 g002
Figure 3. Characterization of the hollow-core anti-resonant fiber (HC-ARF). (a) Microscopic image of the HC-ARF cross-section. (b) Simulated mode field distribution at 532 nm obtained by the finite element method. (c) Measured transmission spectrum of the HC-ARF.
Photonics 12 01133 g003
Figure 4. Double-lens signal collection module for enhanced Raman signal acquisition and background suppression. (a) Schematic diagram (b) Comparison of Raman spectra collected using single-lens and double-lens configurations. All spectra were acquired from a single measurement with an input laser power of 150 mW, an integration time of 60 s, and a spectrometer slit width set to 20 μm, under standard atmospheric pressure (1 atm) and room temperature conditions.
Photonics 12 01133 g004
Figure 5. Raman spectra comparison between the single long-pass filter and the long-pass + dichroic mirror configuration: (a) overall spectra and (b) enlarged view of the CO2 Raman band region (1300–1380 cm−1) showing a clearer comparison of the background noise. The yellow and purple curves correspond to integration times of 10 s and 60 s, respectively. All spectra were obtained under a laser power of 150 mW, a spectrometer slit width of 20 μm, an integration time of 60 s, and at a gas pressure of 1 bar (atmospheric pressure).
Photonics 12 01133 g005
Figure 6. Effect of CCD row-selective integration on Raman signal quality. (a) Raman spectra obtained by integrating 3-, 5-, and 7-pixel rows. (b) SNR variation with accumulated pixel rows, showing an optimal value at five rows.
Photonics 12 01133 g006
Figure 7. Dependence of Raman signal quality on integration time. (a) Raman spectra of CO2 at integration times from 10 s to 300 s. (b) Raman intensity (black) and background noise (blue) as functions of integration time. (c) SNR variation showing continuous improvement with increasing exposure duration.
Photonics 12 01133 g007
Figure 8. Raman spectrum of hydrocarbon gases (~5 ppm) detected by the HC-ARF-based Raman sensing system.
Photonics 12 01133 g008
Table 1. Quantitative Raman detection results of trace hydrocarbon gases (~5 ppm) obtained using the HC-ARF-based Raman sensing system. (The SNR values were calculated based on the average signal intensity and average baseline noise from three independent measurements under identical experimental conditions).
GasGas Concentration/ppmRaman Shift/cm−1Signal-To-Noise RatioLOD/ppm
CH45.129176.12.5
C2H25.219815.72.7
C2H45.430205.72.84
C2H65.2295427.20.57
Disclaimer/Publisher’s Note: The statements, opinions and data contained in all publications are solely those of the individual author(s) and contributor(s) and not of MDPI and/or the editor(s). MDPI and/or the editor(s) disclaim responsibility for any injury to people or property resulting from any ideas, methods, instructions or products referred to in the content.