Article

High-Sensitivity Broadband Acoustic Wave Detection Using High-Q, Undercoupled Optical Waveguide Resonators

1
School of Information Engineering, Shanxi College of Technology, Shuozhou 036032, China
2
State Key Laboratory of Extreme Environment Optoelectronic Dynamic Measurement Technology and Instrument, North University of China, Taiyuan 030051, China
*
Authors to whom correspondence should be addressed.
Photonics 2025, 12(11), 1128; https://doi.org/10.3390/photonics12111128
Submission received: 23 October 2025 / Revised: 9 November 2025 / Accepted: 13 November 2025 / Published: 14 November 2025
(This article belongs to the Special Issue Recent Advances and Applications in Optical Fiber Sensing)

Abstract

In the field of acoustic wave detection, optical sensors have significant potential applications in numerous civilian and military fields due to their high sensitivity and immunity to electromagnetic interference. This study designed an undercoupled silica optical waveguide resonator (OWR) with a 2% refractive index contrast. Mode spot converters were introduced at both ends of the straight waveguide to achieve efficient optical transmission between the fiber and the waveguide. The resonator was fabricated using plasma-enhanced chemical vapor deposition (PECVD) and inductively coupled plasma (ICP) etching technologies. The results show that the quality factor (Q-factor) of the resonator reached 2.75 × 10⁶. Compared with a resonator with a refractive index difference of 0.75%, the Q-factor remained at the same order of magnitude while the sensor size was significantly reduced. To achieve high-sensitivity acoustic wave detection, this study employed an intensity demodulation method to realize acoustic wave detection with the resonator. Test results demonstrate that the OWR can detect acoustic signals in the frequency range of 25 Hz to 20 kHz, with a minimum detectable sound pressure of 1.58 μPa/Hz1/2 @20 kHz and a sensitivity of 1.492 V/Pa @20 kHz. The sensor exhibits a good signal-to-noise ratio and stability. The proposed method shows broad application prospects in the field of acoustic sensing and is expected to enable large-scale applications in scenarios such as communication, biomedical monitoring, and precision industrial sensing.

1. Introduction

With continuous advancements in the field of optical integration technology, particularly the remarkable progress in micro-nano photonic integration, optical resonators have become a research focus in optical communication and sensing detection due to their high Q-factor and miniaturization advantages [1,2,3,4,5]. As a typical optical component of micro-nano fabrication technology, optical waveguide microring resonators possess structures that combine optical field localization enhancement and frequency selection characteristics in both temporal and spatial dimensions, making them widely applicable in cutting-edge fields such as biosensing [6,7] and ultrasonic detection [8,9].
Currently, optical resonators used for acoustic wave detection are mainly divided into four categories. The first category comprises optical fiber microring resonator acoustic sensors [9,10,11,12]. For instance, Zhai Xiaoping et al. [12] designed a fiber knot-type acoustic wave sensor. Such sensors calculate the corresponding sound pressure through deformation, but their shortcomings include low sensitivity and poor stability. The second category is whispering gallery mode resonator acoustic sensors [13,14,15]. These operate based on acoustic waves modulating the optical characteristics of the resonator via mechanical deformation or the elastooptic effect, with detection achieved by monitoring changes in the optical signal. Examples include a microsphere resonator acoustic sensor designed by Wang et al. [13]; a wide-bandwidth (10 Hz to 100 kHz) optical microbubble hydrophone developed by Tu Xin et al. [14]; and a PDMS flexible polymer resonator designed by Wang Yansu et al. [15], capable of detecting acoustic waves in the 200 Hz–10 kHz frequency range with a maximum sensitivity of 23.58 mV/Pa @4 kHz. However, such sensors are sensitive to environmental disturbances and suffer from poor consistency in device fabrication. The third category is Fabry–Pérot (FP) cavity acoustic sensors [16,17,18]. Their operating principle relies on acoustic waves causing changes in the FP cavity length or refractive index, leading to a shift in the resonant wavelength for acoustic detection. While structurally simple and low-cost, they exhibit relatively low sensitivity and weak anti-interference capability. The fourth category is optical waveguide microring resonator acoustic sensors. These sensors can be fabricated via micro-nano processes, are compatible with MEMS technology—ensuring consistency and avoiding manual coupling variations. For example, S.M. Leinders et al. designed an optical micromachined ultrasound sensor (OMUS) [19] with a sensitivity of 2.1 mV/Pa. In our previous work, we designed a silica optical waveguide resonator acoustic sensor with a 0.75% refractive index contrast [20]. The sensor size was 3 cm × 3.5 cm, with a quality factor of 1.69 × 10⁶. The frequency-locking method was employed for acoustic wave sensing, which featured a complex system and a narrow measurable frequency range.
To achieve acoustic detection across a broader frequency range, this paper designs and fabricates a slotted silica optical waveguide resonator with a 2% refractive index contrast. Mode spot converters are integrated at both ends of the waveguide to ensure efficient optical transmission. The resonator dimensions are 1.3 cm × 1.4 cm, achieving a quality factor (Q) of 2.5 × 10⁶. Furthermore, an intensity demodulation method is employed to realize high-sensitivity acoustic wave detection with the waveguide cavity. Experimental results demonstrate that the proposed waveguide cavity achieves high-sensitivity detection of acoustic waves within the 25 Hz–20 kHz frequency range, with a minimum detectable sound pressure of 1.58 μPa/Hz1/2 @ 20 kHz and a sensitivity of 1.492 V/Pa @ 20 kHz. This approach breaks through the bottleneck of mutual constraints among size, performance, and system complexity in the Optical Waveguide Resonator Acoustic Sensing Platform, which provides a new pathway for the practical application of high-precision acoustic sensing.

2. Principle

2.1. Optical Waveguide Resonators

An optical waveguide ring resonator consists of a bus waveguide and a ring waveguide separated by a specific gap, as illustrated in Figure 1a. When near-infrared laser light is injected into the input end of the bus waveguide, the evanescent field effect enables coupling between the bus and ring waveguides in the coupling region. Part of the optical field enters the ring waveguide, and after completing one round trip in the resonator, this field interferes with the light transmitted directly through the bus waveguide. If the circumference of the ring is an integer multiple of the laser wavelength, resonance occurs between the light in the bus waveguide and the ring waveguide. Through repeated cycles, a strong optical field is built up within the resonator. The resonance wavelength can be derived from the standing wave condition of the microring resonator:
m λ = n e f f L
where neff and L are the effective refractive index and the circumference of the resonator, respectively. m is the order of the resonance modes.
Assuming the input optical field intensity of the resonator is Ein and the output optical field intensity is Eout, the normalized optical field intensity at the output port (as shown in Figure 1b) can be expressed as:
T = E o u t E i n 2 = t 2 + a 2 2 t a cos θ 1 + t 2 a 2 2 t a cos θ
where θ = βL represents the phase shift of light after one round trip in the ring waveguide, with β denoting the propagation constant of light in the waveguide t is the transmission coefficient, a is the loss coefficient per round trip, characterizing the amplitude attenuation due to “loss mechanisms” such as material absorption and scattering during propagation, a = α L / 10 and α denotes the propagation loss.
The Quality Factor (Q) is a parameter that evaluates the performance of an optical resonator, reflecting its efficiency in storing optical energy. It is defined as the ratio of the energy stored in the resonator to the energy dissipated per oscillation cycle. The Quality Factor can be expressed as:
Q = n e f f π L λ ( arccos 2 t a 1 + t 2 a 2 ) 1
Here, neff represents the effective refractive index. The full width at half maximum (FWHM) of an optical waveguide resonator can be expressed as:
F W H M = c n e f f π L ( arccos 2 t a 1 + t 2 a 2 )
Based on Equations (3) and (4), Q = f/FWHM. Therefore, the smaller the FWHM, the higher the Q value.

2.2. Principle of Acoustic Detection

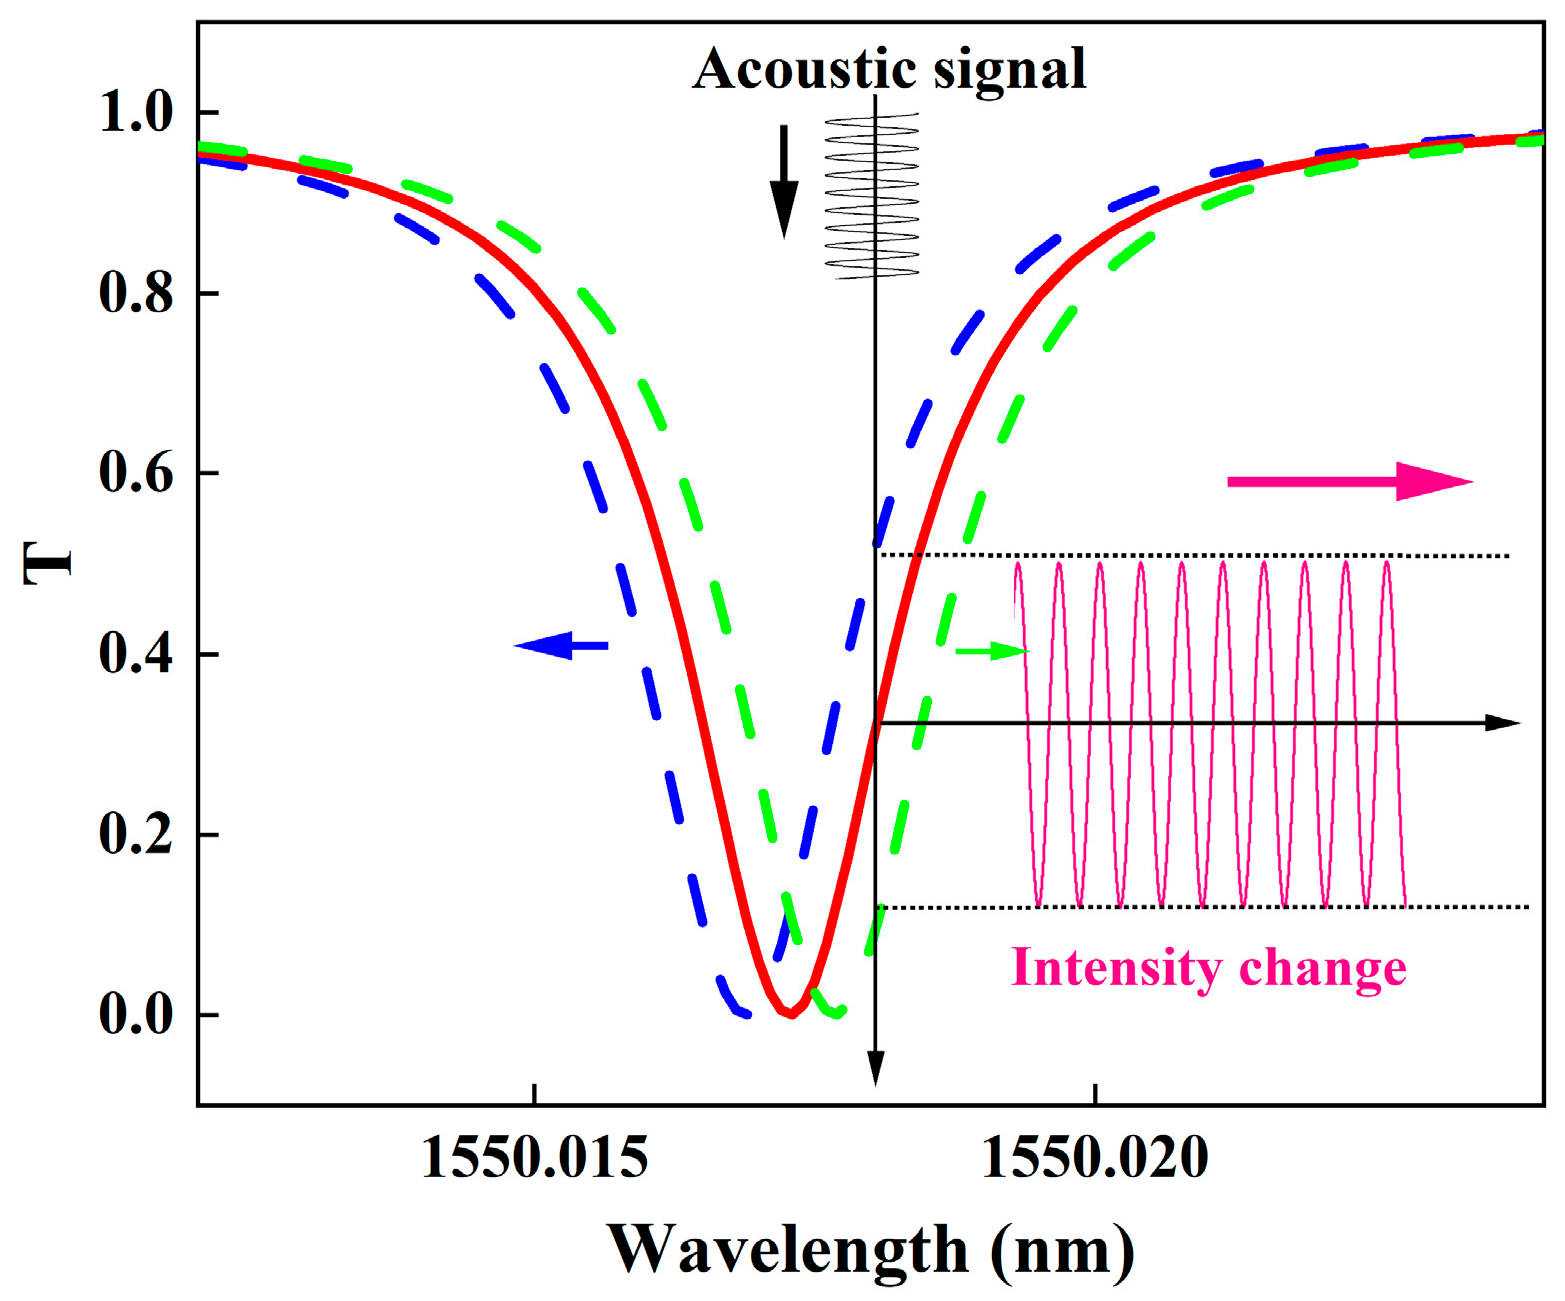
The principle of acoustic signal detection is shown in Figure 2. When an acoustic signal acts on the resonant cavity, it induces a periodic change in the effective refractive index of the resonant cavity. According to the elasto-optic effect [21], the relationship between the change in effective refractive index and the stress exerted on the resonant cavity can be expressed as:
Δ n e f f = n e f f 3 ε 2 p
where p denotes the elasto-optic coefficient tensor element and ε represents the strain. In light of Equation (1), the variation in effective refractive index gives rise to a wavelength drift of the resonant cavity. It can be seen from the figure that within a specific wavelength range (1550.015 nm to 1550.020 nm), the original transmission spectrum (as shown by the red curve) changes due to the influence of the acoustic signal, showing an obvious drift (as shown by the blue and green curves). At the same time, the light intensity of the resonant cavity also undergoes corresponding periodic changes (as shown by the pink light intensity change curve). By monitoring the changes in the transmission spectrum and the fluctuations in light intensity, the detection of acoustic signals can be realized. Specifically, the modulation effect of acoustic signals on optical transmission characteristics and light intensity is utilized to convert the information of acoustic signals into changes in optical signals, thereby completing the detection and analysis of acoustic signals. The time-varying light intensity can be described as follows:
I ( λ L , t ) = T 0 ( λ L + Δ λ ( t ) ) I 0
Among them, I is the optical intensity measured by the photodetector; I0 is the maximum optical intensity far away from the resonant dip; T0 is the initial transmission spectrum; λL is the laser operating wavelength; Δλ is the optical resonant wavelength shift caused by the action of sound waves. According to Equation (4), the sound pressure sensitivity of the optical waveguide resonant cavity can be expressed as:
S = d I d P = d T 0 d λ d λ d n e f f d n e f f d P I 0 s l o p e L m C I 0
In the formula, slope denotes the transmittance gradient at the operating wavelength. It can be seen that the sensitivity S is proportional to the transmission spectrum gradient. Therefore, in this paper, λL is set at the point where the transmission spectrum gradient is maximum to achieve the highest sensitivity for acoustic signal measurement. Theoretically, a higher Q factor implies a narrower resonant linewidth, which in turn results in a steeper transmission spectrum slope in the intensity demodulation scheme. According to the sensitivity formula S ∝ slope, this directly leads to higher sensitivity. During the experiment, the laser wavelength is adjusted to operate at the position with the maximum slope in the resonance curve, which serves as the optimal operating point for acoustic signal detection.

3. Design and Fabrication

3.1. Design of the Resonator

In the structural design of the optical waveguide resonant cavity, to ensure that the optical waveguide satisfies the single-mode field distribution while taking into account the minimum bending radius of 5 mm for the ring resonant cavity, the cross-sectional size of the waveguide is designed to be 4 μm × 4 μm. The cladding material is silica with a refractive index of 1.4448, and the core material is germanium-doped silica with a refractive index of 1.4742, resulting in a refractive index difference of 2% between the core and the cladding. To match the mode field of the waveguide with that of the single-mode polarization-maintaining fiber, a spot-size converter (SSC) is introduced between the waveguide and the fiber to reduce coupling loss. The SSC is a common technology in integrated photonics for achieving efficient coupling between optical fibers and chips, and its design and implementation have been extensively studied across various platforms [22,23].
To determine the single-mode transmission characteristics of the designed waveguide, we performed simulations using the BeamPROP module of RSoft (2020 version) software based on the Finite-Difference Time-Domain (FDTD) method. The specific process is as follows: First, in Global Setting, the refractive indices of the core and cladding were set to 1.4742 and 1.4448 (corresponding to a 2% refractive index contrast), with the operating wavelength set to 1550 nm. Second, in Layout Editor, a rectangular waveguide model with a cross-section of 4 μm × 4 μm and a ring waveguide model with a radius of 5 mm were constructed, and the calculation mode was selected in Launch Parameters. By solving the vector wave equation, the simulation software directly provided the electromagnetic field distribution of the fundamental mode, as shown in Figure 3a. This simulation result verifies that the waveguide with this size supports single-mode transmission at the target wavelength.
The coupling distance of the resonant cavity affects its coupling state. When t = a, the resonant cavity is in a critical coupling state; when t > a, it is in an under-coupling state, where the Q value is maximum; when t < a, it is in an over-coupling state, where the Q value is minimum. The transmission spectrum curves and gradients under the three states are shown in Figure 3b. From the transmission spectrum gradient (dT/dλ) diagram, it can be seen that the transmission spectrum gradient in the under-coupling state (red curve) can be maximized, which is beneficial for achieving high sensitivity in acoustic wave detection. Therefore, the resonant cavity in this paper is designed to be in the under-coupling state. Adjusting the coupling gap in the RSoft model allows calculation of different transmittances. Since the transmission loss α of the waveguide with a 2% refractive index difference is 0.1 dB/cm, it can be calculated that a = 0.9645, so t > 0.9645 is required. The figure shows the simulation result of the transmission coefficient when the coupling distance is 2.6 μm, where t = 0.978, satisfying t > a. Thus, the coupling distance of the resonant cavity is designed to be 2.6 μm.

3.2. Fabrication of the Resonator

The fabrication process flow of the designed silica OWR is shown in Figure 4. From the perspective of the central cross-section of the resonant cavity, the main steps are as follows: First, a silicon wafer is prepared, and a silica thin film is grown by PECVD as the lower cladding of the waveguide; then, germanium-doped silica is prepared as the core layer, which includes a ring waveguide, straight waveguides, and mode spot converters at both ends of the straight waveguides. A mask layer is formed on the surface of the silica thin film using a mask plate, the pattern is transferred to the photoresist by photolithography, and the core layer is etched by ICP etching technology; finally, the upper cladding is grown by PECVD. A template with microgroove patterns is used to form a mask layer on the surface of the core layer. The pattern is transferred to the photoresist by photolithography, and the upper cladding of the silica coupling region is etched by ICP etching technology to construct the microgroove structure. Considering both the Q value and sensing performance of the waveguide cavity, the microgroove size designed in this paper is 40 μm × 40 μm. The ports of the optical waveguide resonant cavity are connected to single-mode polarization-maintaining fibers to transmit optical signals through the fibers. The physical image of the coupled microgroove-type optical waveguide microring resonant cavity is shown in Figure 5a. It can be seen from the figure that the size of the waveguide cavity is 1.3 cm × 1.4 cm. Figure 5b is a scanning electron microscope (SEM) image of the resonant cavity coupling region. From the figure, it can be observed that the cross-section of the waveguide core layer is 3.99 μm × 3.98 μm, and the coupling distance is 2.6 μm.
The quality factor of the optical waveguide resonator was measured using the full width at half maximum (FWHM) method. A swept-source laser (DLCpro) with a central wavelength of 1550 nm was employed and passed through the resonator, and the output light was detected by a power sensor, and the power spectrum was displayed on a host computer. The measured power spectrum is shown in Figure 5c. Due to the certain roughness of the waveguide interface caused by errors in the fabrication process, light of different wavelengths undergoes a certain degree of power attenuation, thus forming a “background baseline” of the spectrum, i.e., an envelope. By performing Lorentzian fitting on the absorption peak, the FWHM was obtained as 5.628 × 10⁻⁴ nm. According to Equations (3) and (4), the Q factor of the optical waveguide resonator was calculated to be 2.75 × 10⁶ (Q = f/FWHM). Compared with the resonator with a refractive index difference of 0.75%, the Q factor remains at the same order of magnitude while the sensor size is significantly reduced [20].

4. Results and Discussion

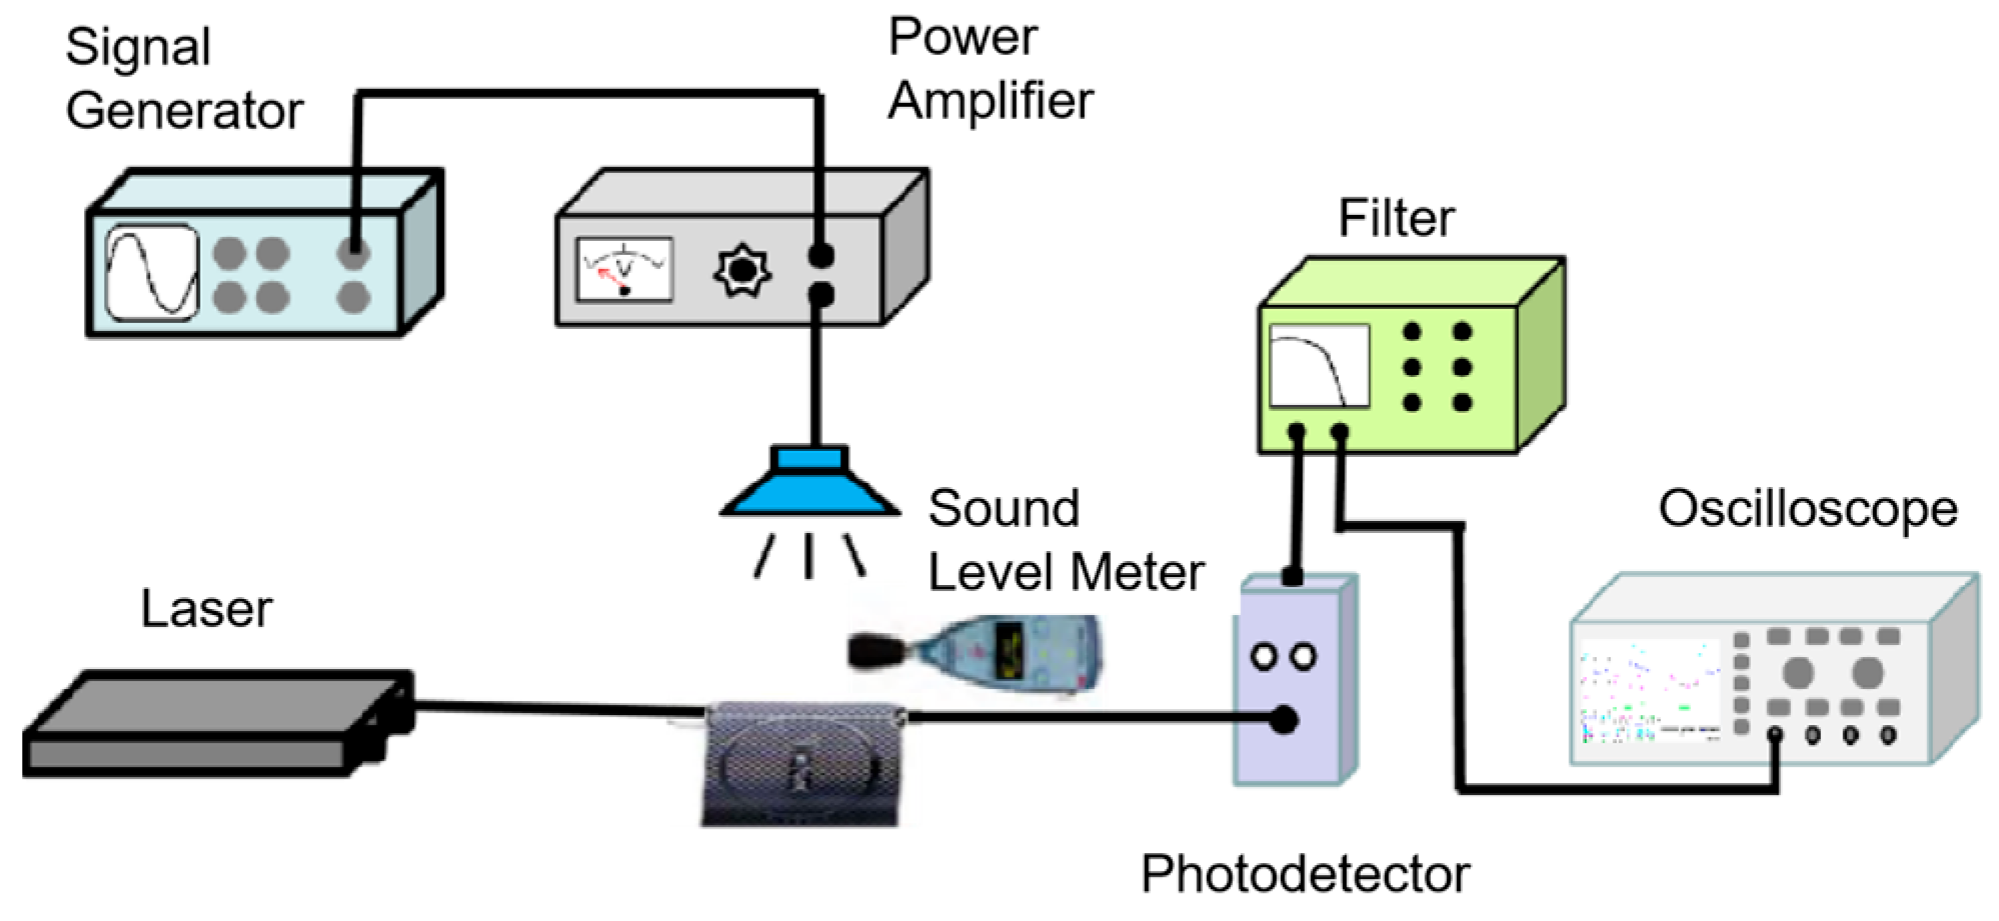
The experimental setup for acoustic wave detection using the optical waveguide resonator is shown in Figure 6. A 1550 nm light wave generated by a narrow-linewidth laser (NKT E15) is input into the resonator, and the light output from the resonator is sent to a photodetector (New Focus, 1811, San Jose, CA, USA). The output of the photodetector is connected to a filter (Moku:go), and the filter is connected to an oscilloscope for signal monitoring. A power amplifier (PA, AWA5871, HANGZHOU AIHUA INSTRUMENTS CO., Hangzhou, China) and a signal generator are used to generate sinusoidal sound pressure signals with specific frequencies and amplitudes to drive the loudspeaker. A handheld sound level meter (model: AWA5661, HANGZHOU AIHUA INSTRUMENTS CO., LTD., Hangzhou, China) is placed on the horizontal plane of the waveguide cavity, near its coupling region, for sound pressure calibration.
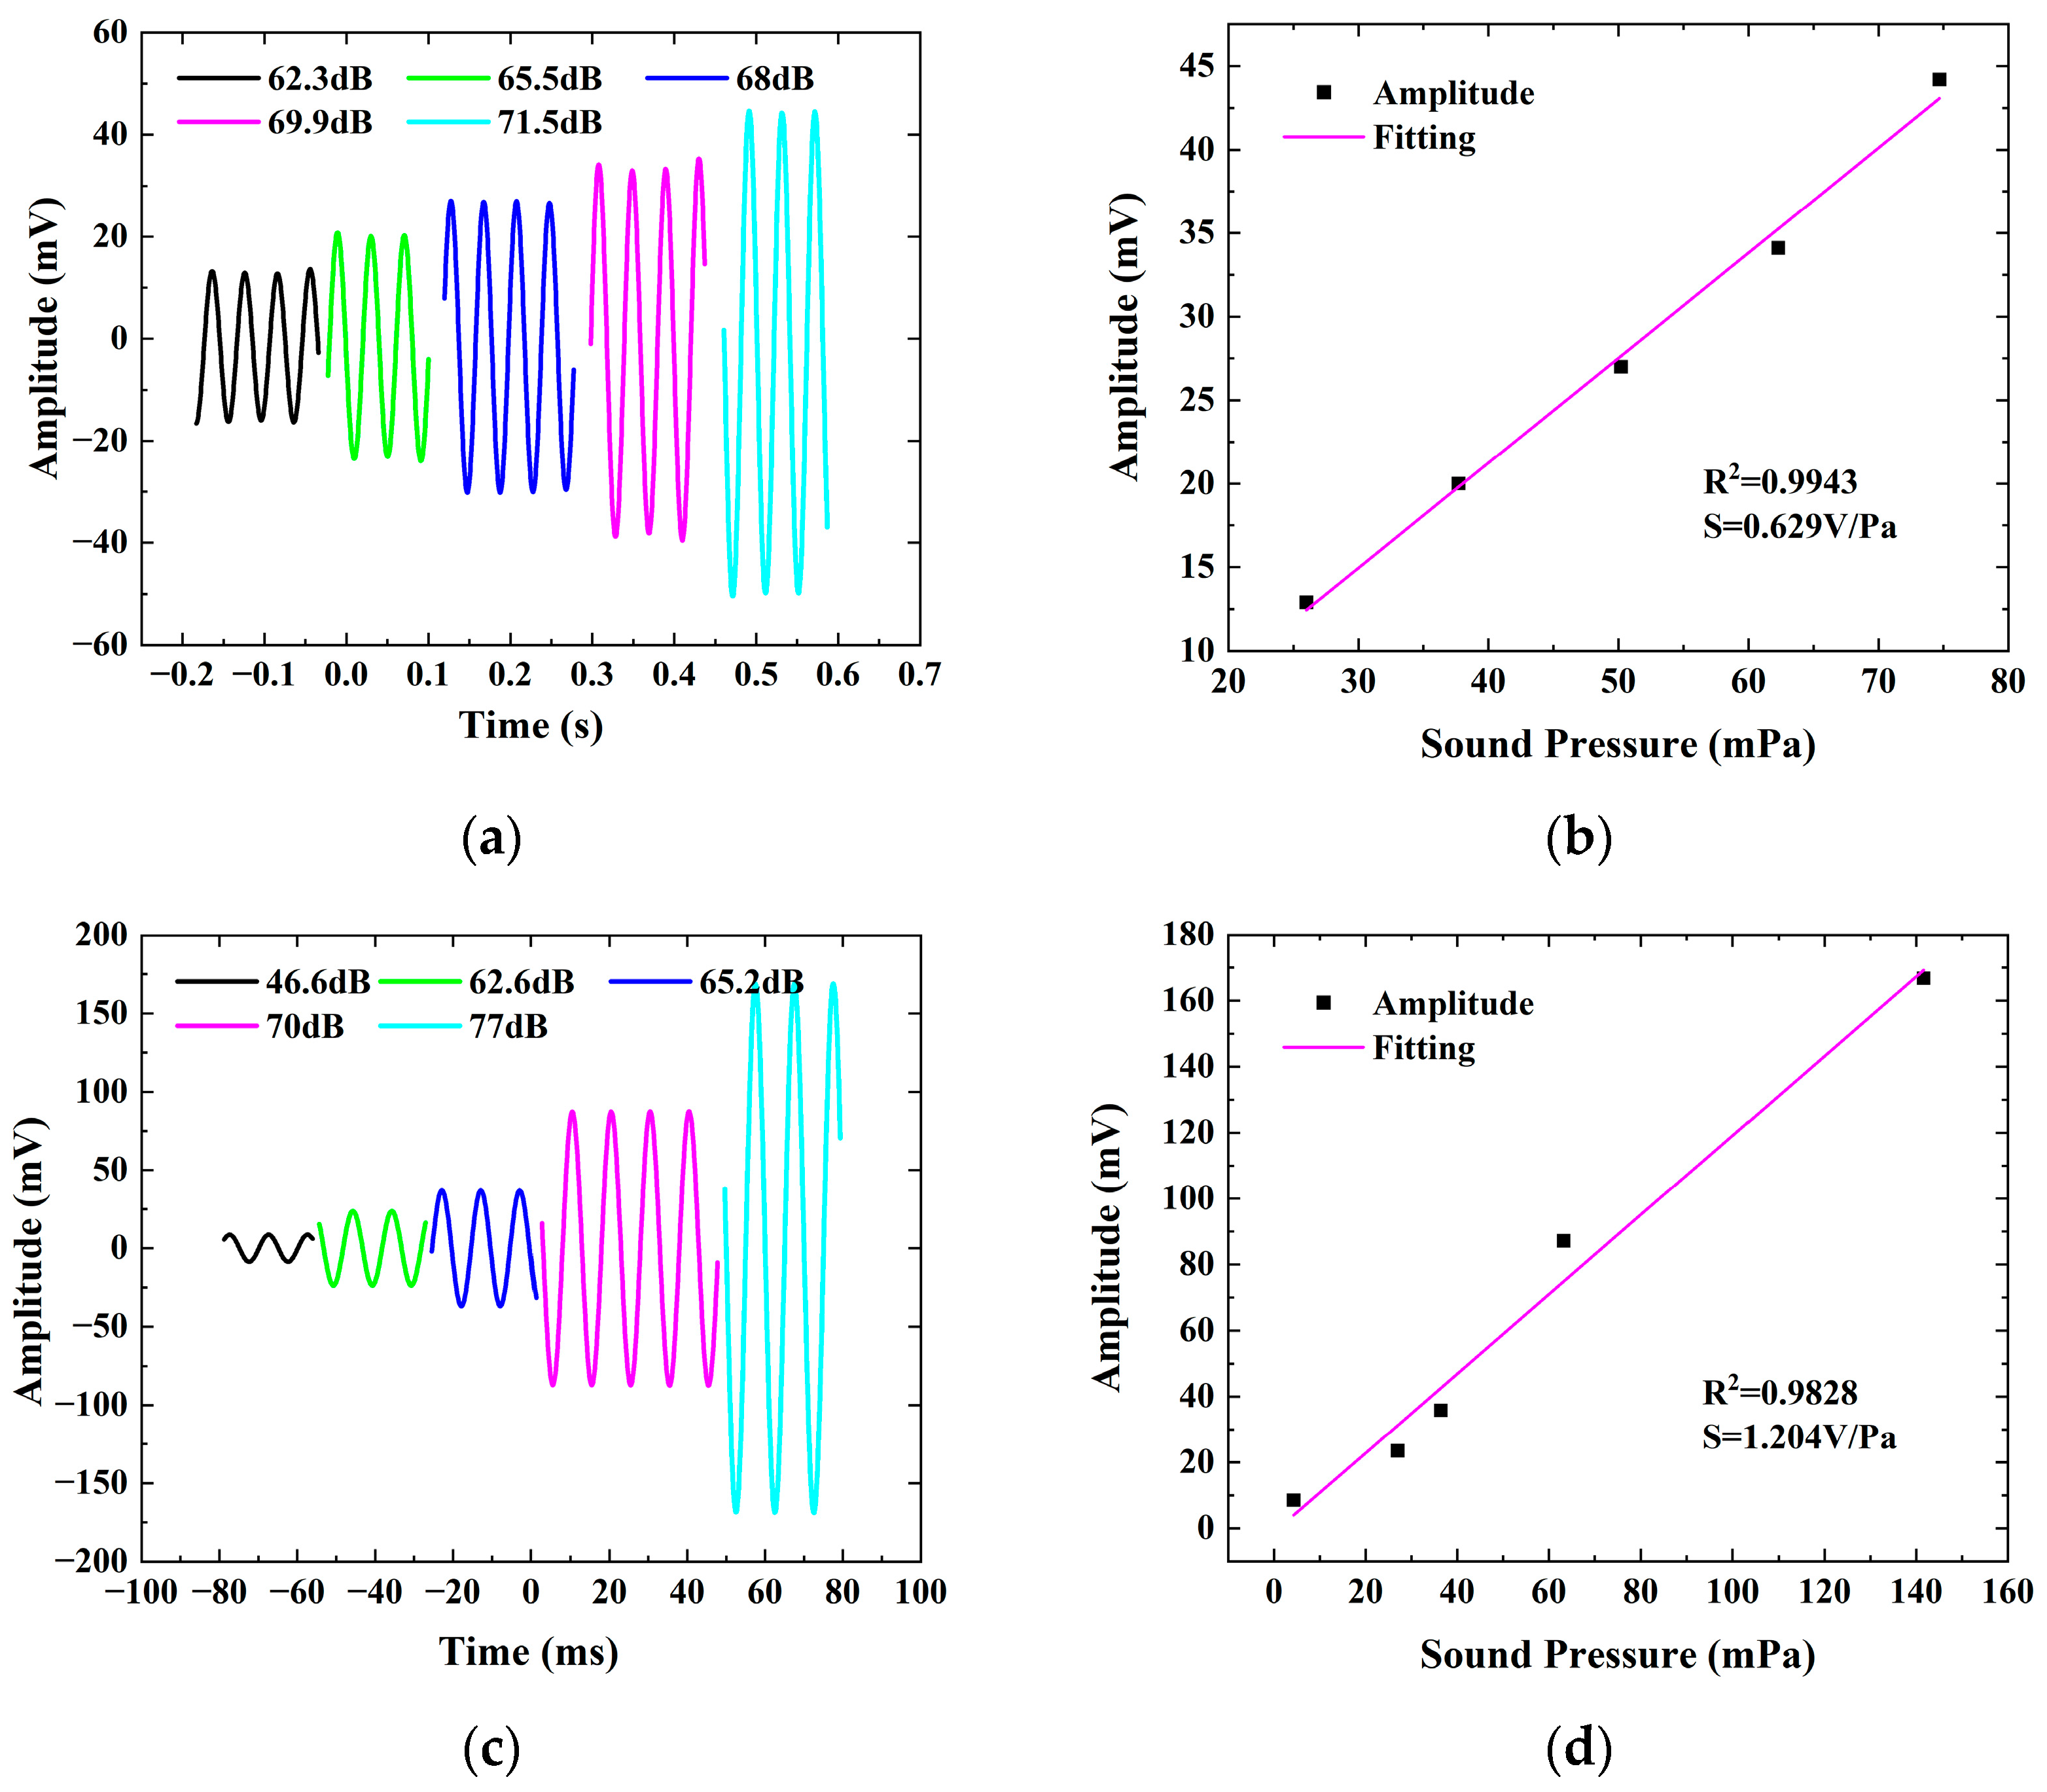
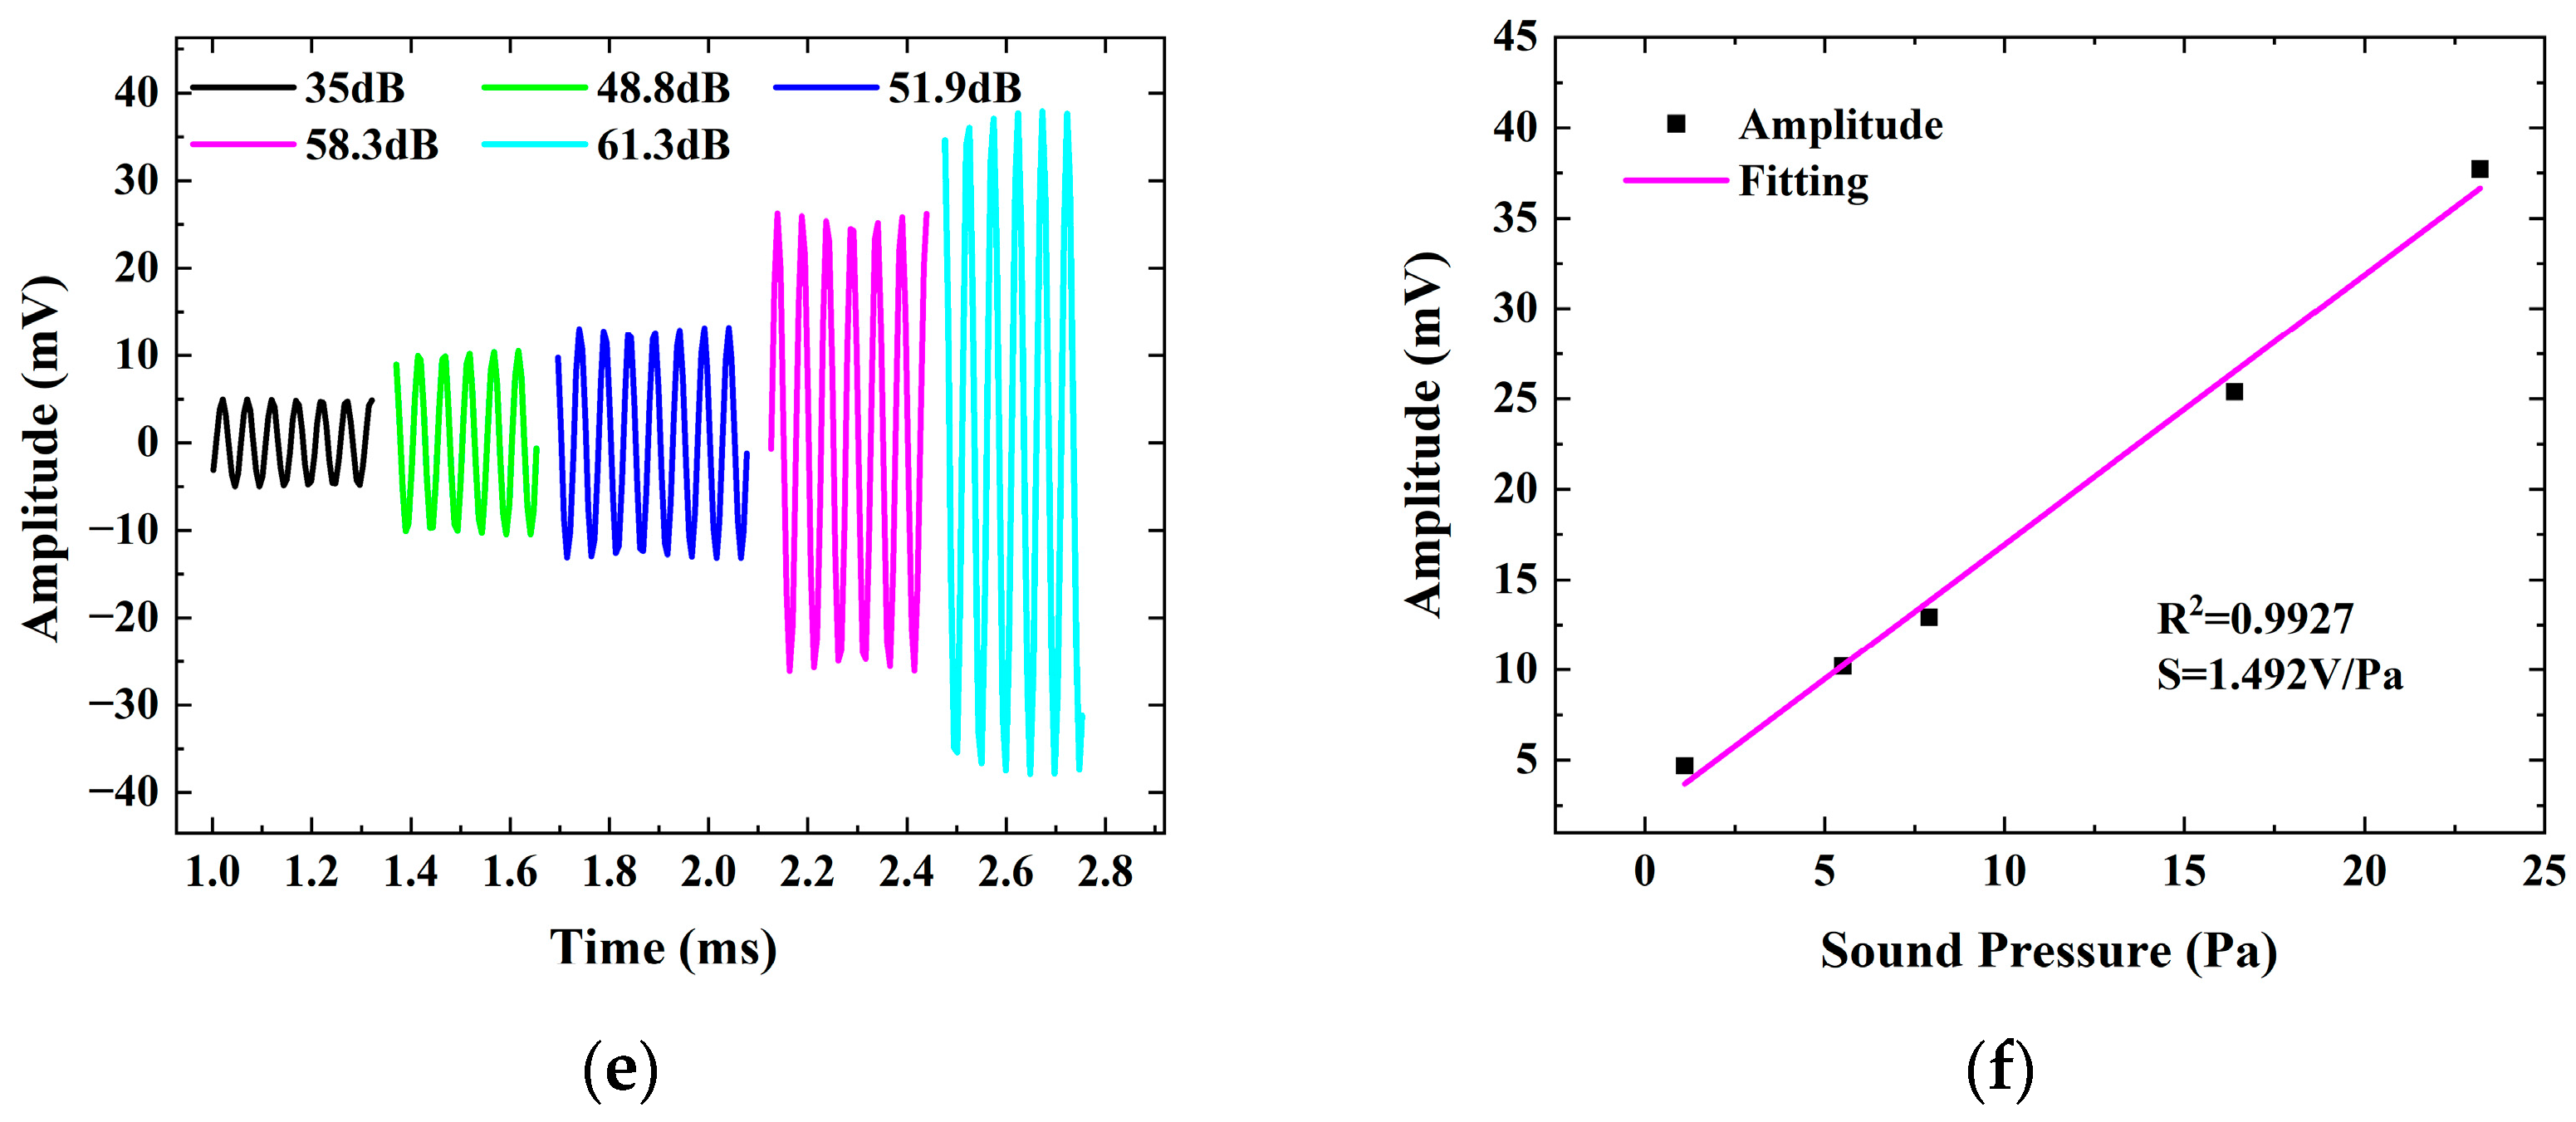
During the test, the signal generator was first set to a specific frequency, and the driving voltage was gradually increased via the power amplifier, while the voltage amplitude of the OWR response was recorded. The time-domain responses of the OWR signal at several representative frequency points are shown in the figures. Among them, Figure 7a,c,e, respectively, display the time-domain responses of the OWR under acoustic signals of different intensities at frequencies of 25 Hz, 100 Hz, and 20 kHz. The variations in signal amplitude result from differences in the driving voltage applied to the transducer during the test. It is noteworthy that the period of the acoustic signal detected by the OWR is consistent with the frequency of the transmitted signal, indicating that the OWR has a good response to acoustic signals. Figure 7b,d,f are the fitting results of Figure 7a,c,e, respectively. In the figures, the black scatter points represent the peak values of the signal waveforms received by the OWR under different sound pressures, and the pink curves are the fittings of these peak values. The test results show that the OWR has good linearity for acoustic signals within the measured sound pressure range. At a frequency of 25 Hz, the fitting coefficient R2 = 0.9943 and the sensitivity is 0.629 V/Pa; at 100 Hz, the fitting coefficient R2 = 0.9828 and the sensitivity is 1.204 V/Pa; at 20 kHz, the fitting coefficient R2 = 0.9927 and the sensitivity is 1.492 V/Pa. The good linearity can be attributed to the fundamental physics of the elasto-optic effect. The strain generated in the waveguide induces a proportional change in the effective refractive index through the elasto-optic effect, which in turn translates into a wavelength shift, resulting in a change in light intensity that is proportional to the applied acoustic pressure. Regarding the frequency response, the flat response up to 20 kHz is indeed likely limited by our acoustic experimental setup rather than the OWR itself. The fundamental acoustic response of the OWR is expected to extend to much higher frequencies, potentially into the MHz range, as the physical mechanism (elasto-optic effect) and the device dimensions (mm-scale) support such operation. The 20 kHz cutoff observed in our experiments is primarily constrained by the frequency response of the commercial loudspeaker used. Future work employing ultrasonic transducers will explore the high-frequency capabilities of our OWR platform.
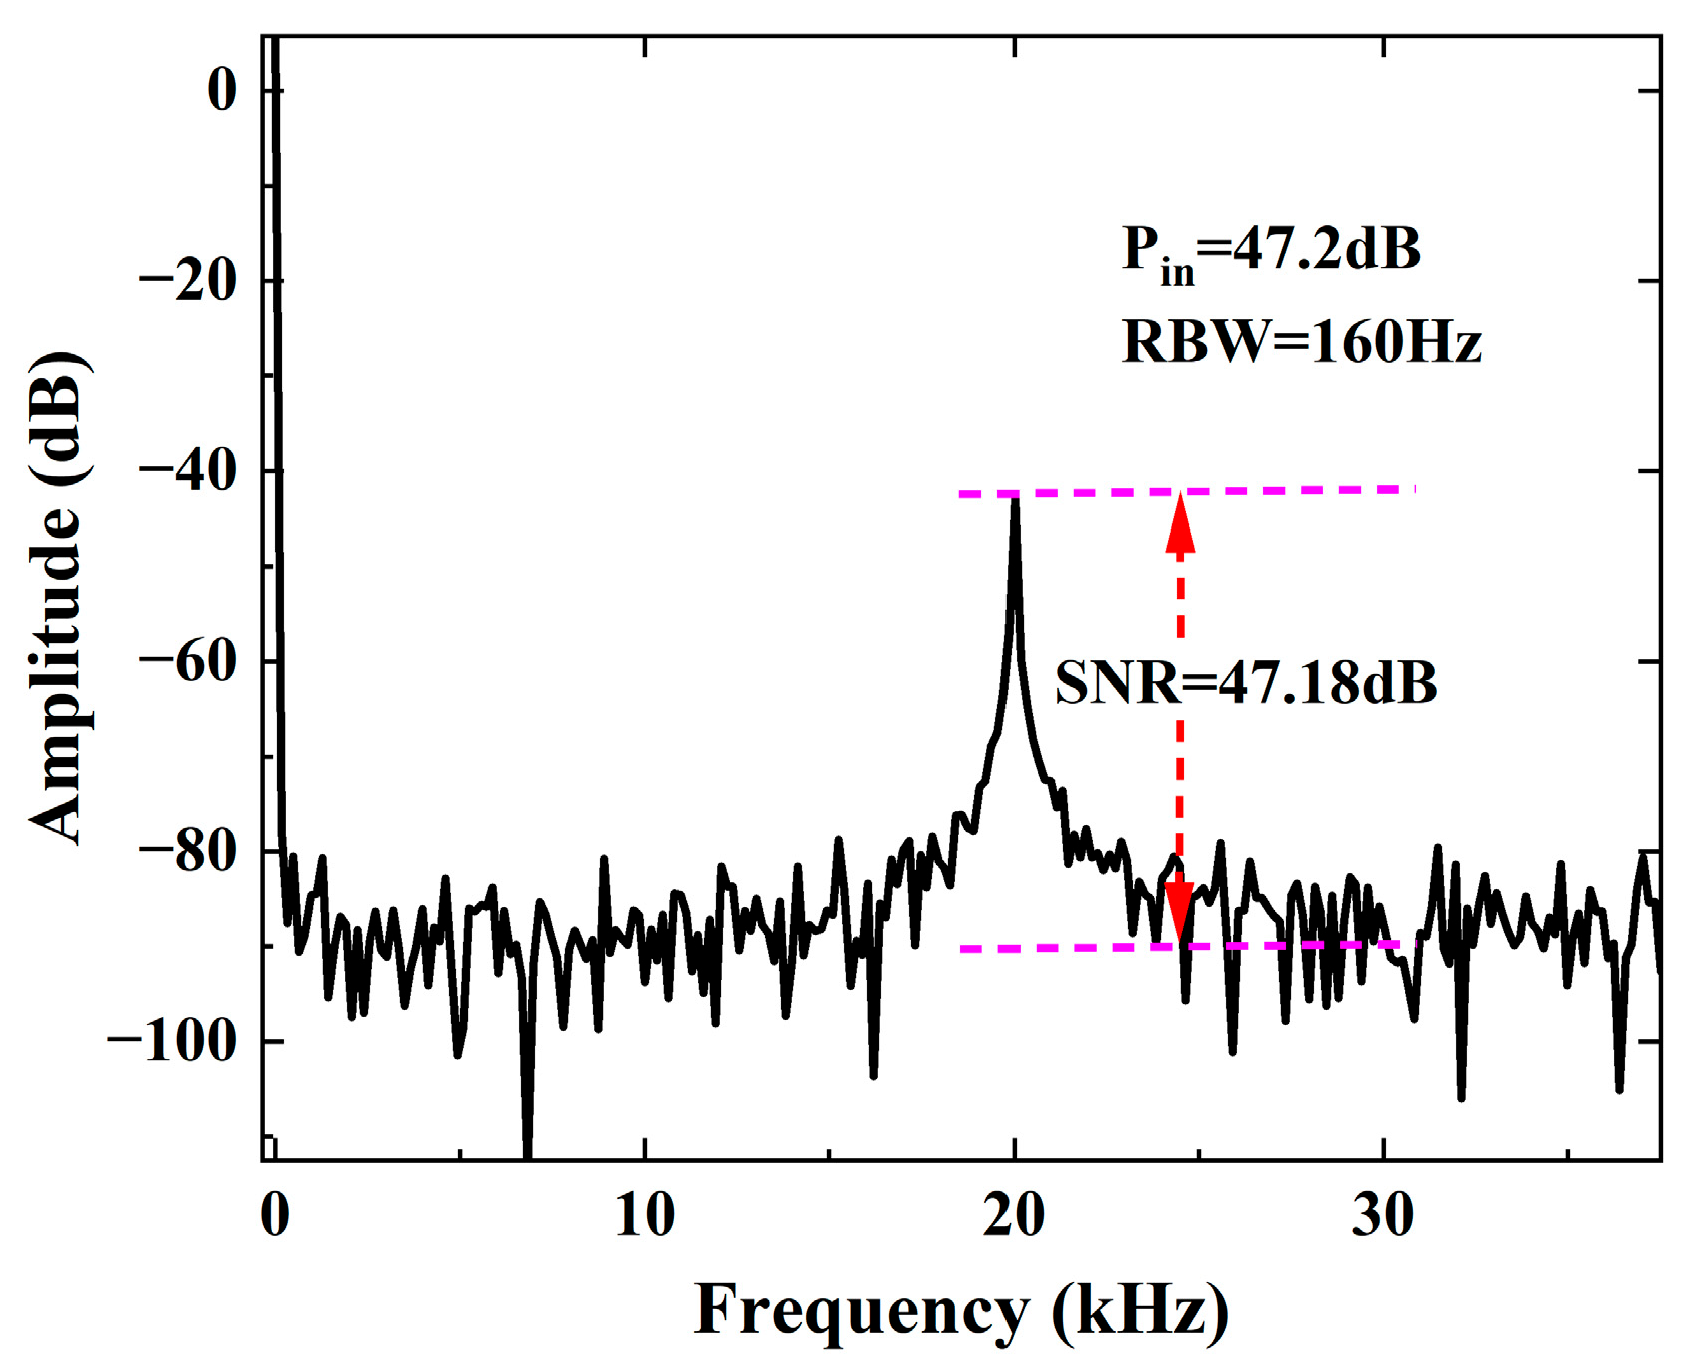
The minimum detectable sound pressure of the system, namely the equivalent noise pressure, reflects the sensor’s capability to identify the lowest sound pressure, which is derived from the sensor’s frequency-domain response to sound pressure and bandwidth resolution. Figure 8 shows the frequency-domain response result of the system’s minimum detectable sound pressure under the action of a 20 kHz, 47.2 dB sound pressure, with a bandwidth resolution (RBW) of 160 Hz. It can be seen that the signal-to-noise ratio (SNR) of the system’s response to the acoustic signal is 46.18 dB. According to Equation (6), the minimum detectable sound pressure of the OWR at 20 kHz can be calculated as 1.58 μPa/Hz1/2.
P M D P = P i n 10 S N R / 20 R B W
To verify stability and repeatability, we studied the dependence of the sensitivity on the fluctuations of temperature and conducted repeatability experiments, respectively. In the temperature fluctuation experiments, by adjusting the room temperature, we measured the sensitivity variation in the OWR at a frequency of 1 kHz within the range of 17–25 °C, with the results shown in Figure 9a. It can be seen that the sensitivity fluctuates around 0.165 V/Pa with a fluctuation error within ±4 mV, indicating that the OWR is nearly insensitive to temperature fluctuations. Although temperature fluctuations cause a shift in the transmission spectrum, they do not alter the slope at the operating wavelength, so their impact on sensitivity is negligible [14]. In the repeatability experiments, we conducted five repeated tests on the system’s response to acoustic signals at three frequencies (25 Hz, 100 Hz, and 20 kHz) at 24 h intervals. The test results are shown in Figure 9b, which indicate that the maximum deviation of sensitivity does not exceed 0.005 V/Pa at the same frequency, demonstrating that the system has good temporal stability. The frequency response curve of the OWR’s sound pressure sensitivity in the frequency range of 0.025–20 kHz is shown in Figure 9c. The results show that the OWR using the intensity demodulation method can detect acoustic signals in the frequency range of 25 Hz–20 kHz, with the highest sensitivity of 1.492 V/Pa @20 kHz. Table 1 presents a performance comparison between the results of this paper and those Reference. It can be seen from the table that the method designed and proposed in this paper can achieve higher sensitivity.

5. Conclusions

This paper designs a silica optical waveguide resonator with a refractive index difference of 2%, whose quality factor Q is 2.75 × 10⁶, and uses the intensity demodulation method to complete the acoustic wave detection by the resonator sensor. The test results show that the optical waveguide resonator can effectively detect acoustic signals in the frequency range of 25 Hz–20 kHz. At 20 kHz, the sensitivity reaches 1.492 V/Pa, and the minimum detectable sound pressure is 1.58 μPa/Hz1/2. The design scheme and detection method proposed in this study significantly improve the acoustic sensing sensitivity of the OWR, providing new ideas for the technical development in this field.

Author Contributions

Conceptualization, X.C.; methodology, X.C. and Z.Z.; Software, Z.Z.; validation, X.C.; resources, J.C. and J.Z.; data curation, X.C.; writing—original draft preparation, X.C., Z.Z.; writing—review and editing, X.C. and J.Z.; project administration, J.C. and X.C.; funding acquisition, J.C. and X.C. All authors have read and agreed to the published version of the manuscript.

Funding

The APC was funded by the National Natural Science Foundation of China (Grant No. 62274149) and Research Start-up Fund Project of Shanxi College of Technology (No. 026014).

Institutional Review Board Statement

Not applicable.

Informed Consent Statement

Not applicable.

Data Availability Statement

The data presented in this study are available on request from the corresponding authors.

Acknowledgments

Thanks to Cui Jiangong for the equipment support provided.

Conflicts of Interest

The authors declare no conflicts of interest.

References

  1. Li, M.; Wu, X.; Liu, L.Y.; Xu, L. Self-referencing optofluidic ring resonator sensor for highly sensitive biomolecular detection. Anal. Chem. 2013, 85, 9328–9332. [Google Scholar] [CrossRef]
  2. Yao, B.C.; Yu, C.B.; Wu, Y.; Huang, S.-W.; Wu, H.; Gong, Y.; Chen, Y.; Li, Y.; Wong, C.W.; Fan, X.; et al. Graphene-enhanced Brillouin optomechanical microresonator for ultrasensitive gas detection. Nano Lett. 2017, 17, 4996–5002. [Google Scholar] [CrossRef]
  3. Lim, J.; Liang, W.; Savchenkov, A.A.; Matsko, A.B.; Maleki, L.; Wong, C.W. Probing 10 µK stability and residual drifts in the cross-polarized dual-mode stabilization of single-crystal ultrahigh-Q optical resonators. Light-Sci. Appl. 2019, 8, 1. [Google Scholar] [CrossRef] [PubMed]
  4. Xing, T.; Xing, E.B.; Jia, T.; Li, J.; Rong, J.; Li, L.; Tian, S.; Zhou, Y.; Liu, W.; Tang, J.; et al. An ultrahigh sensitivity acoustic sensor system for weak signal detection based on ultrahigh-Q CaF2 resonator. Microsyst. Nanoeng. 2023, 9, 65. [Google Scholar] [CrossRef]
  5. Chen, J.M.; Xue, C.Y.; Zheng, Y.Q.; Wu, L.; Chen, C.; Han, Y. Micro-fiber-optic acoustic sensor based on high-Q resonance effect using Fabry-Pérot etalon. Opt. Express 2021, 29, 16447–16454. [Google Scholar] [CrossRef]
  6. Kumar, S.; Kumar, A.; Mishra, R.D.; Babu, P.; Pandey, S.K.; Pal, M.K.; Kumar, M. Nanophotonic Ring Resonator Based on Slotted Hybrid Plasmonic Waveguide for Biochemical Sensing. IEEE Sens. J. 2023, 23, 5695–5702. [Google Scholar] [CrossRef]
  7. Zhang, P.; Ding, Y.L.; Wang, Y.F. Asymmetrical microring resonator based on whispering gallery modes for the detection of glucosecon centration. Optik 2018, 171, 642–647. [Google Scholar] [CrossRef]
  8. Song, J.; Pan, J.; Wan, L.; Chen, Z.S.; Zhu, Y.; Yang, Z.; Chen, Y.; Zhang, M.; Yi, X.; Li, Z. Ultrasound Measurement Using On-Chip Optical Micro-Resonators and Digital Optical Frequency Comb. J. Light. Technol. 2020, 38, 5293–5301. [Google Scholar] [CrossRef]
  9. Li, H.; Dong, B.Q.; Zhang, Z.; Zhang, H.F.; Sun, C. A transparent broad-band ultrasonic detector based on an optical micro-ring resonator for photoacoustic microscopy. Sci. Rep. 2016, 4, 44961–44968. [Google Scholar]
  10. Chen, H.; Shao, Z.H.; Hao, Y.X.; Rong, Q. A high-frequency hydrophone using an optical fiber microknot resonator. Opt. Commun. 2019, 446, 77–83. [Google Scholar] [CrossRef]
  11. De Freitas, J.M.; Birks, T.A.; Rollings, M.D. Optical micro-knot resonator hydrophone. Opt. Express 2015, 23, 5850–5860. [Google Scholar] [CrossRef]
  12. Zhai, X.P.; Zhang, W.D.; Cui, J.G.; Huang, H.; Wang, Y.; Zhang, G.; Wang, R.; Yang, Y.; Wang, Y. Underwater acoustic sensor based on microfiber knot resonator. Opt. Fiber Technol. 2024, 84, 103711. [Google Scholar] [CrossRef]
  13. Wang, K.; Wang, H.; Wu, X.-Y.; Zhang, Y.; Yang, D.; Jiao, R.; Wang, C. Ultrasound Sensing Using Packaged Microsphere Cavity in the Underwater Environment. Sensors 2022, 22, 4190. [Google Scholar] [CrossRef] [PubMed]
  14. Tu, X.; Wang, W.X.; Guo, Z.H.; Chen, Z.; Huang, T.; Wu, X.; Luo, W. Underwater Acoustic Wave Detection Based on Packaged Optical Microbubble Resonator. J. Light. Technol. 2022, 40, 6272–6279. [Google Scholar] [CrossRef]
  15. Wang, Y.S.; Rong, J.M.; Xing, E.B.; Li, J.; Ji, R.; Tang, J.; Liu, J. A Lever-Type PDMS Flexible Cavity for Acoustic Vector Sensor With High Sensitivity. IEEE Sens. J. 2023, 23, 5637–5642. [Google Scholar] [CrossRef]
  16. Xi, Q.; Ma, B.H.; Tian, Z.Y.; Li, R.; Wang, Y.; Ma, Z. Micro-Fabricated Compact Extrinsic Fabry-Perot Sensor for In-Situ Harsh Environment Acoustic Measurement. IEEE Photonics J. 2025, 17, 6800807. [Google Scholar] [CrossRef]
  17. Cao, Z.W.; Zhang, H.J.; Li, X.; Sun, J.; Zhang, Z. High-resolution optical fiber underwater acoustic sensor enhanced by PDMS coating. Opt. Fiber Technol. 2024, 87, 103953. [Google Scholar] [CrossRef]
  18. Wei, H.M.; Wei, Y.; Zhang, C.Q.; He, G.; Yang, T.; Zhang, X.; Pang, F.; Wang, T.; Krishnaswamy, S.; Caucheteur, C.; et al. Sensitivity-Enhanced Fiber-Optic FabryPerot Ultrasonic Sensor Based on Direct Laser Writing of Dual-Resonant Cavity. IEEE Trans. Instrum. Meas. 2025, 74, 7000706. [Google Scholar]
  19. Leinders, S.M.; Westerveld, W.J.; Pozo, J.; van Neer, P.; Snyder, B.; O’bRien, P.; Urbach, H.; de Jong, N.; Verweij, M.D. A sensitive optical micro-machined ultrasound sensor (OMUS) based on a silicon photonic ring resonator on an acoustical membrane. Sci. Rep. 2015, 5, 14328. [Google Scholar] [CrossRef]
  20. Chu, X.X.; Cui, J.G.; Zhu, M.; Wu, B.; Zhang, G.; Wang, R.; Zhang, W.; Yang, Y.; Ren, Y. Study on Acoustic Sensing Characteristics of a Novel Grooved SiO2 Waveguide Resonator. IEEE Sens. J. 2023, 23, 8206–8213. [Google Scholar] [CrossRef]
  21. Bhola, B.; Steier, W.H. A Novel Optical Microring Resonator Accelerometer. IEEE Sens. J. 2007, 7, 1759–1766. [Google Scholar] [CrossRef]
  22. Martin, P.; Pavel, C.; Daniel, B.; Jens, H.S.; James, P.; Robert, H.; Alejandro, O.-M.; Gonzalo, W.-P.; Winnie, N.Y.; Dan-Xia, X.; et al. Fiber-chip edge coupler with large mode size for silicon photonic wire waveguides. Opt. Express 2016, 24, 5026–5038. [Google Scholar] [CrossRef]
  23. Brunetti, G.; Heuvink, R.; Schreuder, E.; Armenise, M.N.; Ciminelli, C. Silicon nitride spot size converter with very low-loss over the C-band. IEEE Photonics Technol. Lett. 2023, 35, 1215–1218. [Google Scholar] [CrossRef]
  24. Rao, N.; Jing, Z.G.; Zhang, S.; Liu, Y.; Cheung, Y.; Peng, W. All-Fiber Acoustic Sensor Based on Anti-Resonant Refective Optical Waveguide. IEEE Sens. J. 2024, 24, 17709–17717. [Google Scholar] [CrossRef]
  25. Hong, G.Q.; Chen, B.Q.; Liu, S.; Chen, P.; Liu, B.; Xiao, H.; Ding, W.; Yan, W.; Wang, Y. Optical fiber acoustic sensor with gold diaphragm based Fabry-Perot interferometer. Sens. Actuators A Phys. 2024, 366, 114930. [Google Scholar] [CrossRef]
Figure 1. (a) Schematic diagram of the OWR Structure; (b) Normalized Transmittance.
Photonics 12 01128 g001
Figure 2. Schematic diagram of acoustic Wave Detection by OWR.
Photonics 12 01128 g002
Figure 3. Parameter Design of the OWR: (a) Optical Field Distribution in Optical Waveguide; (b) Three Coupling States of the OWR; (c) Simulation of the OWR’s Transmission Coefficient.
Photonics 12 01128 g003
Figure 4. Schematic diagram of fabrication flow of the OWR: (a) Wafer preparation and cleaning; (b) Lower cladding growth; (c) Core layer growth; (d) Lithography; (e) Core layer etching; (f) Upper cladding growth; (g) Lithography; (h) Microgroove etching.
Photonics 12 01128 g004
Figure 5. Physical object of the OWR and its performance test: (a) Physical object of the optical waveguide (Size = 1.3 cm × 1.4 cm); (b) scanning electron microscope (SEM) image of the OWR coupling region (gap = 2.6 μm); (c) power spectrum of the OWR (The colored box highlights one of the power spectra.).
Photonics 12 01128 g005
Figure 6. Schematic diagram of experimental setup for acoustic wave detection with OWR.
Photonics 12 01128 g006
Figure 7. Time-domain responses and sensitivity fitting of the OWR under acoustic frequencies of 25 Hz, 100 Hz, and 20 kHz: (a) Time response of the OWR under different sound pressures at 25 Hz; (b) Sensitivity fitting curve of the OWR at 25 Hz; (c) Time response of the OWR under different sound pressures at 100 Hz; (d) Sensitivity fitting curve of the OWR at 100 Hz; (e) Time response of the OWR under different sound pressures at 20 kHz; (f) Sensitivity fitting curve of the OWR at 20 kHz.
Photonics 12 01128 g007aPhotonics 12 01128 g007b
Figure 8. The frequency-domain response of the system’s minimum detectable sound pressure at 20 kHz.
Photonics 12 01128 g008
Figure 9. (a) The dependence of the sensitivity on the fluctuations of temperature; (b) Repeatability tests of the OWR’s response to acoustic signals at different times; (c) The frequency response curve of the OWR’s sound pressure sensitivity in the frequency range of 0.025–20 kHz.
Photonics 12 01128 g009
Table 1. A performance comparison between the results of this paper and those referenced.
SensorSensor MediumQSize (Diameter)SensitivityRange of Frequency
Paper [15]SphericalPDMS2.0 × 1052.44 mm23.58 mV/Pa@4 kHz0.2–10 kHz
Paper [16]FPSi-5 mm95.73 mV/Pa@18 kHz0.1–20 kHz
Paper [20]OWRSiO21.82 × 10620 mm1.143 V/Pa@8 kHz0.4–15 kHz
Paper [24]FiberFiber-80 μm1.189 V/Pa@290 Hz0.1–14.2 kHz
Paper [25]FPGold Diaphragm-75 μm147.5 mV/Pa@1 kHz0.07–20 kHz
This workOWRSiO22.75 × 10610 mm1.492 V/Pa@20 kHz0.025–20 kHz
Disclaimer/Publisher’s Note: The statements, opinions and data contained in all publications are solely those of the individual author(s) and contributor(s) and not of MDPI and/or the editor(s). MDPI and/or the editor(s) disclaim responsibility for any injury to people or property resulting from any ideas, methods, instructions or products referred to in the content.