Abstract
In inter-satellite laser communication systems, angular deviations between the boresights of terminals exert an impact on system performance, thereby imposing higher requirements on performance parameters such as the angle measurement accuracy and range of the system. Conventional coherent angle measurement systems feature a fixed baseline, which results in insufficient dynamic adjustment capability for accuracy and range. To address the aforementioned issues, this paper proposes a variable-baseline coherent angle measurement method based on nutation scanning. By altering the baseline length through a nutation scanning strategy, this method achieves dynamic adjustment of angle measurement accuracy and range, enhancing the adaptability of the angle measurement system in different scenarios. For long-distance communication, a small nutation scanning angle (short baseline) is used to adapt to significant satellite relative position changes via a large angle measurement range, while a large nutation scanning angle (long baseline) is adopted for short-distance communication to ensure stable tracking with high angle measurement accuracy. Firstly, a mathematical model of the system is established, and the relationships between the nutation scanning angle, angle measurement accuracy, and angle measurement range are derived. The Monte Carlo method is employed to construct a variable-baseline angle measurement simulation system for data verification, and a tabletop experimental system is built for performance analysis. Experimental results show that when the nutation scanning angle γ increases from 10 μrad to 100 μrad, the baseline length increases from 0.05 μm to 0.5 μm, the angle measurement accuracy improves from 56.9 μrad to 6.35 μrad, and the angle measurement range narrows from 880 μrad to 560 μrad. These results are consistent with the trend of theoretical derivation and correspond to the simulation results. This study verifies the feasibility of dynamically regulating angle measurement accuracy and range via the nutation scanning angle and provides a reference for the design of space laser communication systems.
1. Introduction
Differential wavefront sensing (DWS) technology, featuring advantages such as high measurement accuracy and strong anti-interference capability, enables measurements with nanometer-level and even sub-nanometer-level precision [1,2,3,4]. DWS technology has been widely applied in the field of optoelectronic measurement, particularly in the domain of inter-satellite precision detection. Typical applications include the Laser Interferometer Gravitational-Wave Observatory (LIGO) in the United States [5], the Gravity Recovery and Climate Experiment (GRACE) gravity satellites [6], the Laser Interferometer Space Antenna (LISA) mission for space-based gravitational wave detection [7], the Taiji Program [8,9,10], and the Tianqin Program [11]. In conventional DWS angle measurement systems, the angle measurement range and accuracy are affected by factors such as the photosensitive surface size of the detector and the signal light spot size. These factors constitute the physical boundary of the angle measurement field of view. When targeting objects whose surface motion trajectory exceeds the preset range, the system faces the risk of failure in measuring the miss distance, which limits the expansion of application scenarios and the improvement of adaptability of the measurement system.
In research on the range and angle measurement accuracy of DWS systems, Yu X et al. developed an optical fiber-coupled three-degree-of-freedom interferometer based on DWS and investigated the influence mechanisms of beam geometric parameters, alignment errors, and wavefront aberrations on measurement accuracy and range. Their research showed that increasing the diameter of the measurement beam or the size of the quadrant photodetector (QPD) can improve the angular measurement sensitivity and accuracy, but it compresses the linear range of measurement results; reducing the beam diameter or QPD size can expand the linear range but with a slight decrease in accuracy [12]. Duan H.-Z. et al. derived an analytical model of Differential Wavefront Sensing, analyzed the nonlinear effects of the DWS model, and explored the influences of factors such as quadrant photodetector size and quadrant channel on the linear interval of DWS measurement results. Their findings indicated that the detector size is negatively correlated with the size of the linear interval, while the width of the inter-quadrant channel of the QPD is positively correlated with it [13]. Xia Q et al. changed the wavefront curvature of the measurement beam by adding a lens and studied the effect of wavefront curvature on the sensitivity of the DWS system. The displacement measurement resolution of their DWS system could reach 40 pm/Hz1/2 (within the frequency range of 1–10 Hz) [14]. Meshksar N et al. proposed a scheme that integrates DWS technology with differential power sensing (DPS) technology. Specifically, the DWS method—with higher measurement accuracy—is adopted within the high-precision angle measurement interval of ±0.11 mrad, while the DPS method is used to expand the measurement range within the wide angle measurement range of ±5 mrad, thus constructing a composite angle measurement system [15].
In the scenario of laser communication between LEO and GEO satellites, during long-distance communication, the relative position of satellites varies within a wide range, requiring a large angle measurement range to achieve initial optical axis acquisition. However, during short-distance communication, the relative motion state between satellites is relatively stable, and high-precision angle measurement is required to maintain tracking—this trade-off between range and accuracy cannot be addressed by traditional fixed-baseline systems. In this study, to address the issue that traditional angle measurement systems cannot dynamically adjust the trade-off between angle measurement range and measurement accuracy, DWS technology is integrated with nutation scanning technology, and a variable-baseline nutation coherent angle measurement system is proposed. A hierarchical optimization strategy of “short baseline for ambiguity resolution, long baseline for precision preservation” is constructed, enabling dynamic switching of baseline length according to the accuracy and range requirements under specific angle measurement environments. For large-field-of-view (FOV) and low-precision measurement scenarios, a small nutation scanning angle can be selected to meet the demand for a wide-angle measurement range; for small-FOV and high-precision measurement scenarios, increasing the nutation scanning angle can improve angle measurement accuracy. Figure 1 shows the application scenario of the system. By reasonably selecting the nutation scanning angle γ, the baseline length of the system can be adjusted. The angle measurement system can find the optimal solution adapted to different application scenarios through the trade-off between accuracy and range, which effectively enhances the system’s environmental adaptability and task universality. In this study, mathematical modeling of the system was conducted at the theoretical level, the Monte Carlo method was used for system simulation analysis, and a desktop experimental system was built for verification. These efforts provide support for the subsequent design and engineering application of inter-satellite laser communication systems.
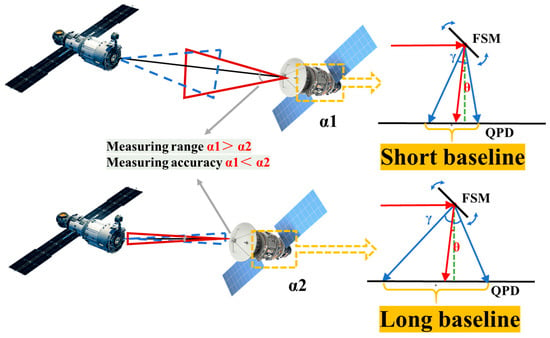
Figure 1.
Application scenario diagram of the variable baseline coherent angle measurement system, the red solid arrow represents the initial signal beam, the blue solid arrow represents the signal beam during the nutation scanning process, and the green dashed arrow represents the local beam.
2. Principle
In this study, a scanning nutation coherent detection system is designed. After the signal beam to be measured is coupled into the system, it is reflected by a precision fast steering mirror, which simultaneously executes the nutation motion. Upon passing through a beam splitter (BS), the transmitted signal beam to be measured undergoes coherent mixing with the reflected collimated local beam. The generated beat frequency signal is projected onto the photosensitive surface of a QPD, producing four channels of photocurrent signals that contain amplitude and phase information. After the four-channel photocurrent signals are converted by an analog-to-digital converter (ADC), a digital phase meter extracts the phase information of each quadrant and then calculates the azimuth and pitch yaw angles. The system block diagram is shown in Figure 2:
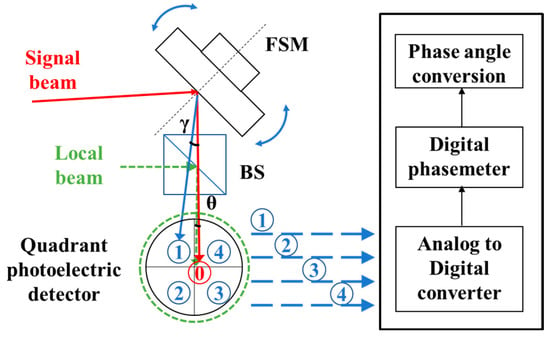
Figure 2.
Block diagram of the nutation scanning coherent angle measurement system, the numbers 1 to 4 in the figure represent the illustrations of nutation scanning points.
In the figure above, red lines represent signal beams, and green lines represent local beams. The BS enables the transmission of signal beams and the reflection of local beams; the two beams undergo coherent mixing on the photosensitive surface of the QPD, generating beat frequency waves with dynamic modulation characteristics. The analysis of these beat frequency waves is as follows: Based on Maxwell’s equations, assuming that (x, y, z) is an arbitrary point in the optical field, the electric field Equation of a fundamental-mode Gaussian beam propagating along the z-direction can be expressed as follows:
Here, p represents the laser power, k denotes the wave number, and ω stands for the laser frequency. The wavefront curvature R(z), spot size w(z), and Gouy phase shift G(z) are determined by the Rayleigh length z0 and the position relative to the beam waist z, which are given as follows:
For convenience, the amplitude part of Equation (1) is denoted as A(x,y,z), and the phase part is denoted as φ(x,y,z).
Then, the irradiance generated by the coherent mixing of the signal beam ES and the local beam EL can be expressed as follows:
Therefore, for a single quadrant in the QPD, the generated photocurrent is given as follows:
Among the parameters, Δω represents the frequency difference between the local beam and the signal beam, while Δφ denotes the phase difference between the two beams, which contains the optical path information between them. η stands for the quantum efficiency of the detector, qe is the electronic charge (1.602 × 10⁻¹⁹ C), h is the Planck constant (6.626 × 10⁻³⁴ J·s), v is the laser frequency, and Σ is the effective photosensitive area of a single quadrant in the detector. After filtering out the DC components iS and iL in the photocurrent, the remaining intermediate-frequency AC components are analyzed using a digital phase meter, from which the phase of this quadrant can be derived.
When measuring the yaw angles of the signal beam and local beam, the angle measurement operation is accomplished via FSM scanning. The FSM controls the signal beam to perform nutation scanning around the point to be measured, offsetting by an equal angle γ along the positive and negative semi-axes of Axis 1 and Axis 2, respectively. The upper computer control system enables precise adjustment of the nutation scanning radius. The signal beam with the target angle θ (angle to be measured) completes the nutation process at a fixed nutation angle γ. When the nutation angle γ changes, the distance between detection points on the detector’s photosensitive surface varies accordingly: If γ increases, this distance expands (i.e., the baseline extends), which improves the accuracy of the angle measurement system but reduces the unambiguous angle measurement range; conversely, if γ decreases, the baseline shortens, which expands the unambiguous angle measurement range but lowers the system’s angle measurement accuracy.
Definition of the physical baseline: In this study, the baseline length refers to half of the effective linear distance between two symmetric wobble points of the signal beam on the photosensitive surface of the QPD. This effective distance is generated by the wobble motion of the FSM, and its calculation formula is L× tanγ (where L denotes the distance from the FSM to the QPD). The baseline length is regulated by the nutation scanning angle γ; thus, flexible adjustment of the system’s angle measurement accuracy and range can be achieved by modifying the value of the nutation scanning angle. To describe the tilt of the signal beam relative to the reference beam, a coordinate transformation is introduced. Assuming the signal beam has a target angle θ in the x-axis direction, the coordinate axes diagram is shown in Figure 3 below (axis 1 and axis 2 represent two orthogonal nutation axes).
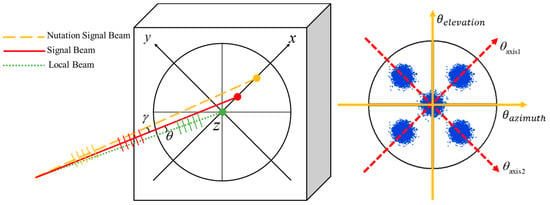
Figure 3.
Schematic diagram of the nutation coordinate axes.
By means of the Rodrigues rotation matrix in the three-dimensional Cartesian coordinate system, the coordinates of any point on the photosensitive surface of the detector at each nutation point can be obtained [16,17]. Substituting the transformed coordinates into Equation (5). To simplify the computation of the complex integrand and reduce the complexity of subsequent numerical calculations, the real-domain integral was further extended to the complex domain and decomposed. Ultimately, an Equation containing coefficients Ai and Bi was derived; the resulting integrand is as follows:
where I1 and I2 represent the photocurrent values of two relative points on one nutation axis, respectively. The specific expressions of parameters Ai and Bi (where i = 1, 2,…, 6) in Equation (6) are shown in Table 1 below.

Table 1.
The parameters in Equation (6).
Among these parameters, RS and Rl are the radii of curvature of the signal beam and the local beam, respectively; zs and zl are the Rayleigh ranges; ws and wl are the beam waist radii; and L is the distance from the rotation axis to the detector target surface, i.e., the spacing between the nutating FSM and the photosensitive surface of the detector. By substituting the expressions of I1 and I2 into Equation (7), the phase difference along this nutation axis can be calculated as follows:
The integration domain Σ refers to the effective photosensitive area of a single quadrant of the QPD.
Linear fitting analysis was performed on the phase angle relationship curves, and linear intervals meeting the requirements were screened out by setting a goodness-of-fit threshold. Within this linear interval, the phase angle relationship exhibits a stable linear response characteristic, and its variation law can be accurately described by a linear model. When the yaw angle exceeds this linear interval, a local π-jump phenomenon occurs in the phase difference, which directly causes a sharp increase in the slope of the phase angle relationship curve. This further leads to a nonlinear mutation in the system response, significantly interfering with the output accuracy of the angle measurement system and seriously affecting the accuracy and reliability of the angle measurement results. Based on the above analysis results, the yaw angle range corresponding to the linear interval with a goodness-of-fit (R2 > 0.9) is defined as the effective measurement range of the angle measurement system.
As can be seen from the curves in Figure 4, the angle measurement accuracy and range can be dynamically adjusted by modifying the nutation scanning angle γ. The value of the nutation scanning angle directly affects the response characteristics of the phase difference to the deflection angle of the signal beam: When the nutation scanning angle is small (i.e., short baseline), the variation gradient of the phase difference with the deflection angle of the signal beam is relatively gentle. The system can maintain a stable phase angle correspondence within a larger angular range, thus expanding the angle measurement range. However, the sensitivity of phase variation is limited, making it difficult to further improve the angle measurement accuracy. In contrast, when the nutation scanning angle increases (i.e., extended baseline), the phase difference becomes more sensitive to changes in the deflection angle of the signal beam. A tiny angular deviation can cause significant fluctuations in the phase difference, thereby improving the angle measurement accuracy. Nevertheless, the effective angle measurement range narrows under this condition. This dynamic regulation mechanism provides a key basis for the engineering design of optical angle measurement systems.
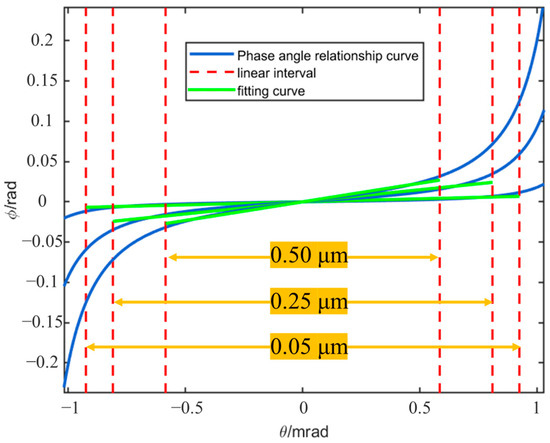
Figure 4.
Curves of the deflection angle and phase difference of the signal light under different baselines.
3. System Implementation and Simulation
3.1. Phase Tracking and Detection Unit
In a coherent angle measurement and detection system, the phase detection unit serves as the core functional component for achieving precise angle measurement. It determines the stability and reliability of the entire detection system and plays a crucial supporting role in improving the system’s measurement accuracy [18,19]. The mathematical model equations of the digital phase-locked loop established in this paper are as follows:
Here, fNCO,k and fNCO,k−1 represent the output frequencies of the numerically controlled oscillator (NCO) at the k-th and (k−1)-th discrete time instants, respectively. Kp is the proportional gain, which denotes the instantaneous response of phase error to frequency adjustment. Ki is the integral gain, representing the cumulative response coefficient of the error change rate to frequency adjustment; its core function is to eliminate the long-term steady-state error of the loop. Tcoh denotes the coherent integration time, a core time window in the phase error detection process, mainly used to accumulate the phase difference between the input signal and the local carrier. θe(k) is the phase error at the k-th time instant, representing the difference between the instantaneous phase of the beat frequency signal and the phase of the NCO carrier.
After the beat frequency signals collected in real-time by the detector are input to the phase detection module, a branching process is performed: one branch of the signal undergoes a mixing operation with the cosine signal output by the NCO, and the other branch of the signal completes a mixing operation with the sine signal output by the NCO. After accumulating the results of the two mixing operations, respectively, the in-phase integral value (Int I) and the quadrature integral value (Int Q) can be obtained. Int I and Int Q are used as input quantities of the loop filter, which performs filtering processing on them according to preset parameters. The loop filter is used to adjust the NCO frequency word, realizing phase tracking and detection of the phase-locked loop. The principle implementation process of the phase-locked loop is shown in Figure 5.
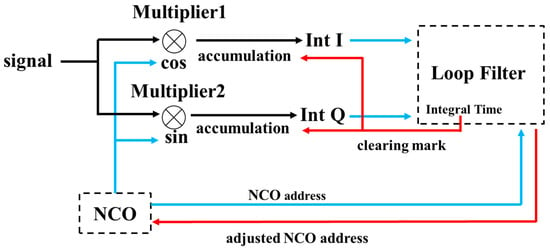
Figure 5.
Implementation process of the phase-locked loop (PLL) principle.
To achieve precise measurement of the phase at different nutation points, the system employs 4 channels of PLL to track 4 target nutation points in a preset sequence. The specific operation mechanism is as follows: When the light beam points to a specific nutation point, the PLL corresponding to this nutation point starts operating immediately. Taking the real-time collected signal photocurrent as the feedback basis, this PLL dynamically adjusts the address parameters of its NCO, thereby realizing real-time tracking and locking of the signal phase at the current nutation point. After the FSM drives the light spot to reach the next nutation point, the previous PLL stops operating immediately and its corresponding channel is closed; at the same time, the PLL channel matching the new nutation point is triggered and activated. During this switching process, the NCO address offset of the previous PLL remains unchanged at the final value of its last adjustment, so as to ensure the reference stability for subsequent phase comparison.
The PLL module in the angle measurement system operates continuously based on the aforementioned cyclic switching and parameter retention mechanism. By performing real-time comparison and analysis on the NCO address parameters of the 4 PLL channels, high-precision measurement of phase information at different nutation points is ultimately achieved. The NCO address offsets and NCO address variation characteristics during the operation of the 4 PLL channels are shown in Figure 6; the dynamic response results of the NCO in each channel to the signal are presented in Figure 7.
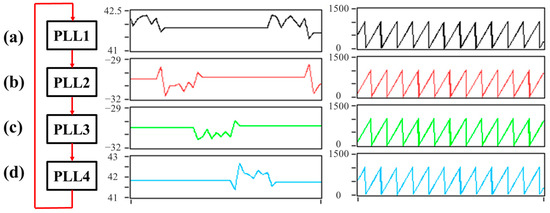
Figure 6.
NCO address offset and NCO address in the PLL: (a) Nutation Point 1; (b) Nutation Point 2; (c) Nutation Point 3; (d) Nutation Point 4.
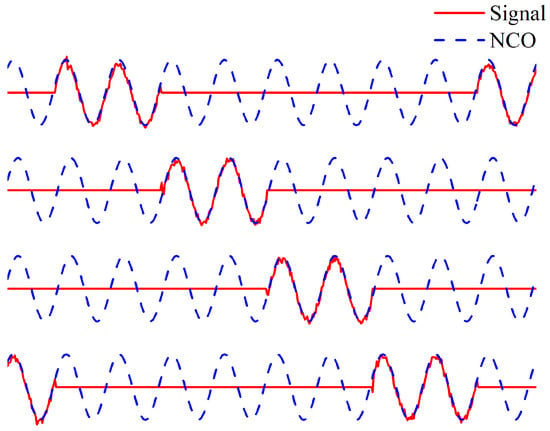
Figure 7.
Phase-locked results of the angle measurement system.
3.2. System Simulation
For the theoretical model mentioned earlier, this study constructs an angle measurement simulation system using the Monte Carlo method. The core idea of the Monte Carlo method is to approximate the solution of a deterministic problem or the distribution characteristics of a probabilistic problem through the statistical results of a large number of random experiments [20]. The specific simulation implementation process is as follows: The simulation of the angle measurement system is divided into three phases, namely beat frequency signal generation, nutation scanning, and phase tracking. The block diagram of the simulation system is shown in Figure 8.
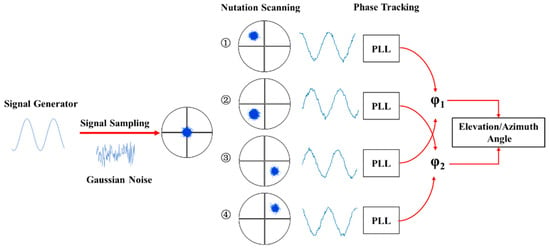
Figure 8.
Block diagram of the simulation system, the numbers 1 to 4 in the figure represent the illustrations of nutation scanning points.
In a DWS detection system, multiple noise components such as thermal noise, shot noise, and phase noise coexist. These noise components not only limit the system’s detection performance and reduce the signal-to-noise ratio (SNR) but also severely weaken the system’s ability to detect weak signals. To truly reflect this characteristic in the simulation, random Gaussian noise conforming to the properties of additive white Gaussian noise (AWGN) in communication theory is used to approximate and simulate various noise types in the detection system. In this simulation, Gaussian noise is superimposed to simulate the noise in the angle measurement system, and signals are sampled at a fixed sampling frequency—this simulates the ADC sampling module in actual experiments. Considering that in practical systems, coherent light beams in a laboratory environment present as Gaussian beams, the generated intermediate-frequency signals are superimposed with a Gaussian distribution. Monte Carlo random points that follow a Gaussian distribution are used to simulate the Gaussian light spot on the detector target surface. Meanwhile, this Gaussian light spot is mapped to the coordinate plane of the simulated QPD. The number of Monte Carlo random points on the QPD target surface is calculated to characterize the optical energy received by each quadrant. Based on preset nutation scanning rate and nutation scanning angle parameters, the angle measurement system executes periodic nutation scanning motion through a nutation scanning control algorithm. It sequentially positions the centroid of the Gaussian light spot generated by Monte Carlo simulation to each predetermined nutation scanning position, achieving ordered scanning coverage of the target area. The optical energy signals collected from each received quadrant are processed to calculate the phase differences on the two nutation axes and solve for the final angle result.
As the core indicator for evaluating the performance of an angle measurement system, the quantitative characterization of angle measurement accuracy can be achieved through the standard deviation of angle measurement results: a larger standard deviation value indicates a higher degree of dispersion in the angle measurement data, a more scattered distribution, and an increased deviation amplitude of each data sample relative to the overall mean. For the measurement range of the angle measurement system, its definition logic is as follows: When the deflection angle of the incident signal beam gradually increases and exceeds the angle measurement capability threshold of the system, jumps occur in the angle measurement results, which in turn lead to discontinuous mutations in the data. Based on this characteristic, the critical position where such mutations occur in the angle measurement results can be defined as the effective angle measurement range of the system.
The parameter settings for the simulation tests are as follows: the yaw angle is 0, the SNR is 30 dB, the distance between the FSM and the detector target surface is 250 mm, the radius of the QPD target surface is 1.5 mm, and the radius of the received light spot is 1.05 mm. To ensure statistical significance, the number of independent trials in the Monte Carlo simulation was set to 100. The simulated beat frequency signal was 1 MHz, and the sampling frequency was 50 MHz. The baseline length is increased from 0.05 μm to 0.5 μm in increments of 0.05 μm. The angle measurement results under different baseline lengths were tested, and the curve of the simulation-derived angle measurement accuracy versus the nutation angle is shown in Figure 9.
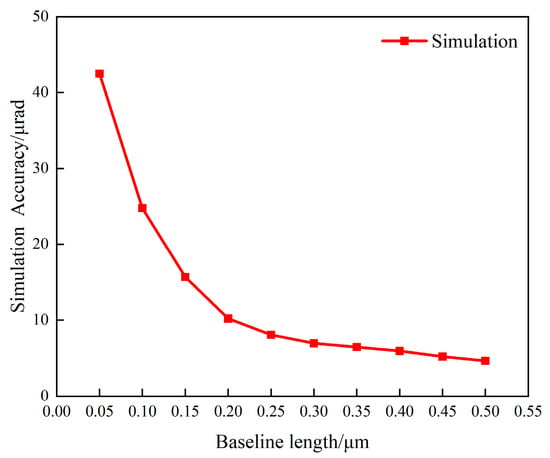
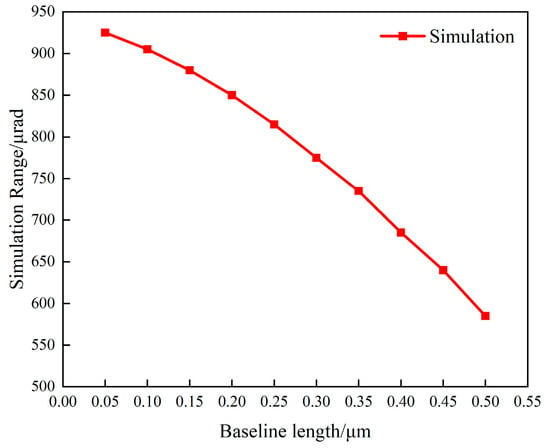
Figure 9.
Simulation results of angle measurement accuracy and range as baseline length extends from 0.05 μm to 0.5 μm.
From the above simulation analysis results, the following patterns can be concluded: As the nutation scanning angle gradually increases, the standard deviation of the angle measurement results shows a corresponding decreasing trend, which indicates a significant improvement in the system’s angle measurement accuracy. At the same time, the system’s effective detection range for the yaw angle exhibits a gradually narrowing characteristic: When the baseline length is 0.05 μm (i.e., the nutation scanning angle is 10 μrad), the system’s angle measurement accuracy is 42.5 μrad; when the baseline length increases to 0.5 μm (i.e., the nutation scanning angle is 100 μrad), the system’s angle measurement accuracy improves to 4.64 μrad, while the system’s effective detection range for the yaw angle decreases from 925 μrad to 585 μrad. These results are consistent with the theoretical trend.
4. Experimental System
Based on theoretical derivation and simulation verification, this study further constructed a variable-baseline nutation angle measurement desktop experimental system. The block diagram of the experimental system is shown in Figure 10, and the experimental scenario is presented in Figure 11. The light emitted by a narrow-linewidth laser is split into two paths by a polarization-maintaining fiber splitter: one path serves as the local beam, and the other as the signal beam. Each path undergoes frequency shifting via an acousto-optic modulator (AOM) and is then emitted into the spatial optical path through a fiber collimator. The local beam is transmitted through a BS and incident along a fixed optical path to the center of the photosensitive surface of the QPD. The signal beam, on the other hand, is reflected by a FSM for dynamic angle adjustment: according to the target angle miss distance and nutation scanning angle parameters configured by the upper computer, the FSM not only provides the target angle miss distance in real time but also drives the signal beam to complete the preset nutation scanning motion on this basis, thereby realizing the detection of target angle information. The QPD converts the received light intensity signal into an analog electrical signal, which is then subjected to high-precision digital sampling by an ADC. The sampled data are transmitted to an industrial control board equipped with dual cores—an advanced RISC machine (ARM) and a field programmable gate array (FPGA)—to perform high-speed phase-locked phase detection operations, extracting the phase difference information between the local beam and the signal beam. Finally, the control board uploads the phase difference data of the two nutation axes (azimuth axis and elevation axis) to the LabVIEW upper computer via serial communication. The upper computer completes the precise calculation of the azimuth angle and elevation angle and outputs the final angle measurement result. The desktop experimental framework and physical diagrams are shown in the figures below.
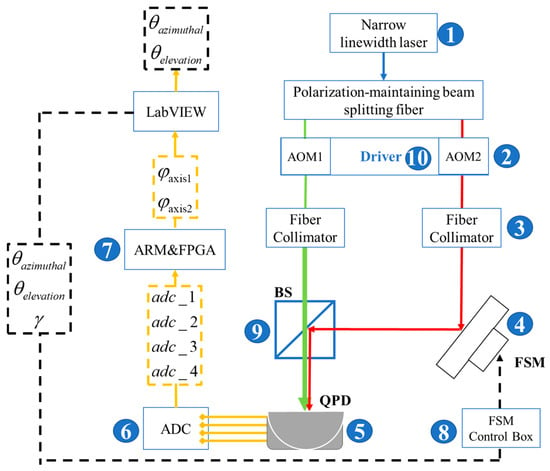
Figure 10.
Block diagram of the variable-baseline nutation angle measurement desktop experiment. The numbers in the figure correspond to those in the experimental scene diagram shown in Figure 11. Solid-line boxes are used to represent each functional module of the experimental components, and dashed-line boxes are used to represent the transmission parameters between different modules, the green arrow represents the local beam, and the red arrow represents the signal beam.
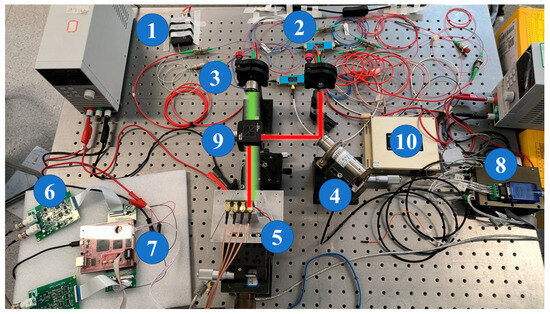
Figure 11.
Experimental scenario diagram of the variable-baseline nutation angle measurement: (1) narrow-linewidth laser; (2) AOM; (3) fiber collimator; (4) FSM; (5) QPD; (6) high-speed ADC acquisition board; (7) ARM + FPGA industrial control board; (8) FSM control box; (9) BS; (10) AOM driver box.
The settings of each parameter in the experimental system are shown in Table 2 below:

Table 2.
Parameter list for the nutation coherent angle measurement desktop experimental system.
With the aforementioned experimental parameters kept constant, the performance of the angle measurement system was tested. The baseline length was gradually increased from 0.05 μm to 0.5 μm with a step size of 0.05 μm, which corresponds to the nutation scanning angle expanding gradually from 10 μrad to 100 μrad.
As a characterization of the system’s angle measurement accuracy, the standard deviation is calculated using every 250 data acquisition points as an independent statistical unit. Figure 12a presents the angle measurement accuracy results obtained by performing repeated measurements on 30 statistical units under different baseline conditions; the final angle measurement accuracy of the experiment is determined by calculating the arithmetic mean of the multiple repeated measurement results. To clarify the system’s effective measurement range, the experiment gradually increases the yaw angle in steps of 10 μrad while simultaneously conducting measurement experiments at the corresponding angles, with the measurement results shown in Figure 12b. When the measured angle reaches the system’s maximum measurable angle, the angle measurement results exhibit an obvious jump. The judgment criterion for this jump is as follows: if the ratio (expressed as a percentage) of the difference between the standard deviation of a given statistical unit and that of the previous statistical unit to the standard deviation of the previous statistical unit exceeds 300%, the current angle is determined to have reached the system’s measurement boundary. Based on this judgment criterion, the effective measurement range of the system can be defined.
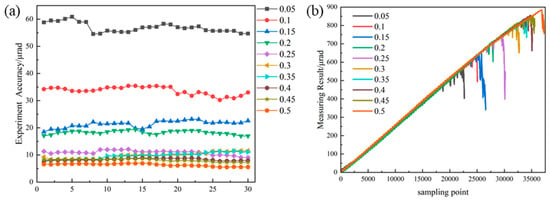
Figure 12.
(a) Results of repeated angle measurement accuracy for 30 statistical units under different baseline conditions; (b) angle measurement results and measurement boundary determination with the yaw angle increased in steps of 10 μrad.
Regarding the experiment, the variation patterns of measurement accuracy and range under different baseline lengths are shown in Figure 13. When the baseline length is set to 0.05 μm, the system’s angle measurement accuracy is 56.9 μrad; as the baseline length increases to 0.5 μm (corresponding to a nutation scanning angle of 100 μrad), the system’s angle measurement accuracy improves to 6.35 μrad, while the system’s effective detection range for the yaw angle decreases from 880 μrad to 560 μrad. Comprehensive analysis of the experimental results reveals that the baseline length of the angle measurement system exerts a regulatory effect on the measurement range and accuracy: a smaller nutation scanning angle leads to a shorter baseline length and a larger effective measurement range of the system; conversely, a larger nutation scanning angle results in a longer baseline length and better angle measurement accuracy of the system.
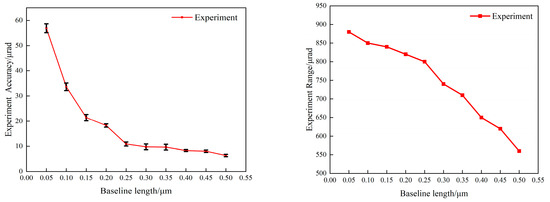
Figure 13.
Experimental results of angle measurement accuracy and range as baseline length increases from 0.05 μm to 0.5 μm.
5. System Performance Analysis and Discussion
5.1. Impact of FSM Parameters on the System
In the variable-baseline angle measurement system, the switching efficiency of different baseline lengths and the duration of a single angle measurement operation depend primarily on the dynamic response characteristics of the FSM. To ensure the stability of the system structure during operation and the reliable performance of the motion actuator, the operating frequency of the FSM must be strictly limited to within 1/3 of its mechanical resonance frequency. This constraint is a critical technical criterion for avoiding system instability caused by mechanical resonance and a hard requirement that must be prioritized during the system design phase.
The FSM model S-330.8SL, manufactured by PI, was used in this experiment. According to the device specifications, the rated maximum operating frequency of this FSM model is 0.33 kHz, corresponding to a minimum response time of 3 ms. Based on this parameter, the time required for the FSM to complete the specified motion in a single angle measurement process is approximately 12 ms. Additionally, the round-trip transmission delay of control signals between the host and the FSM must be accounted for; this delay is approximately 2 ms (the specific value is affected by the type of communication physical layer interface and the implementation of the software protocol stack). Comprehensive calculation of the above timing parameters shows that the minimum cycle of the system—from the upper computer sending an angle measurement command to start the measurement process to receiving the measurement data returned by the FSM—is approximately 14 ms. In ultra-high-speed dynamic angle control tasks, the switching speed of the FSM may become a bottleneck restricting the overall dynamic performance of the system.
In a nutation scanning coherent angle measurement system, the FSM inevitably exhibits slight drift during operation due to temperature drift and piezoelectric ceramic creep, leading to minor changes in baseline length. The use of an FSM system with a closed-loop feedback mechanism can effectively reduce errors caused by FSM drift. The drift degree of the FSM can be measured by its repeatability accuracy, which typically exhibits a differential distribution pattern with the deflection angle range. This distribution characteristic is directly related to the inherent performance parameters of the FSM. Taking the FSM used in this experiment as an example, reference to the device technical manual shows the following: when the deflection angle is within 10% of its maximum deflection range (i.e., 0.5 mrad), its repeatability accuracy can reach 0.15 μrad; when the deflection angle reaches the maximum deflection range (5 mrad), its repeatability accuracy decreases to 1.5 μrad. In this experiment, the nutation angle was set to 10–100 μrad. Combined with the experimental result distribution shown in Figure 12a, it can be observed that in 30 grouped tests with different baseline lengths, the length of the error bars did not exhibit a regular distribution pattern related to the baseline length. This phenomenon indicates that when the nutation scanning angle is less than 10% of the FSM’s maximum deflection range, the system’s repeatability error is mainly dominated by uncertain factors such as external electromagnetic interference, rather than being limited by the FSM’s own repeatability accuracy index.
In summary, for the variable-baseline angle measurement system in this study, selecting an FSM with better performance parameters is an effective way to further improve the system’s dynamic response performance and angle measurement accuracy. The essence of this selection process is an engineering practice of trade-off optimization between the upper limit of the system’s hardware capabilities and dynamic response requirements, which requires targeted design based on the performance indicator requirements of specific application scenarios.
5.2. Impact of Signal Beam Radius on System Performance
According to the research results in Reference [12], the signal beam radius parameter in the DWS system is also one of the factors affecting the system’s measurement accuracy and detection range. The following section will briefly analyze the impact of changes in the signal beam radius from a theoretical perspective.
Different signal beam radii were substituted into Equation (7) for calculation, while other core parameters remained fixed: the distance L from the FSM to the detector target surface was set to 250 mm, the laser wavelength λ was selected as 1550 nm, the waist radius wl of the local beam was fixed at 3.5 mm, and the nutation scanning angle γ was set to 10 μrad; the waist radii ws of the signal beam were selected as 1 mm and 2 mm, respectively. Based on the above parameter settings, the phase angle relationship curves of the angle measurement system obtained are shown in Figure 14.
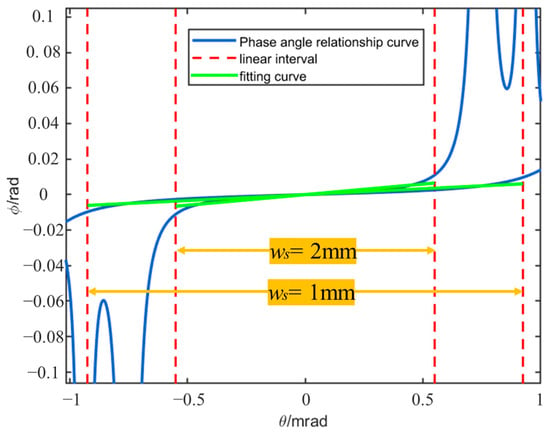
Figure 14.
Curves of the deflection angle and phase difference of the signal light under different signal beam radii.
From the analysis of the above figure, it can be concluded that in the variable-baseline coherent angle measurement system, as the signal beam radius increases, the system’s measurement range shows a decreasing trend, while its measurement sensitivity increases accordingly. Conversely, if the signal beam radius decreases, the system’s measurement range expands correspondingly, and the measurement sensitivity decreases.
6. Conclusions
To address the demand for dynamic adjustment of angle measurement accuracy and range in spatial laser communication systems, this study proposes a variable-baseline nutation coherent angle measurement method, establishes a theoretical model for nutation angle measurement, and constructs simulation and experimental systems for data verification and performance analysis. The performance of the variable-baseline angle measurement system under different baseline lengths was analyzed in depth. When the baseline length decreases from 0.5 μm to 0.05 μm, the system’s angle measurement accuracy changes from 6.35 μrad to 56.9 μrad, and the angle measurement range expands from 560 μrad to 880 μrad. The summary of the conclusions is shown in Table 3. The experimental results are consistent with the trends of theoretical derivation and simulation results, which verify the feasibility of the variable-baseline nutation angle measurement model and lay a theoretical foundation for practical engineering applications.

Table 3.
Summary of angle measurement performance across theoretical, simulation, and experimental results.
Author Contributions
Conceptualization: D.Z. and X.Y.; methodology: D.Z., X.Y. and P.L.; software: D.Z.; validation: D.Z.; formal analysis: D.Z.; investigation: D.Z., Z.Z., R.W. and W.J.; resources: X.Y. and P.L.; data curation: D.Z.; writing—original draft preparation: D.Z.; writing—review and editing: X.Y.; visualization: D.Z. and Z.Z.; supervision: X.Y.; project administration: X.Y. and S.T.; funding acquisition: X.Y. and S.T. All authors have read and agreed to the published version of the manuscript.
Funding
This research was funded by the National Key R&D Program of China grant number 2022YFB2903402 And The APC was funded by the National Key R&D Program of China (2022YFB2903402).
Data Availability Statement
The original contributions presented in this study are included in the article. Further inquiries can be directed to the corresponding author.
Conflicts of Interest
The authors declare no conflicts of interest.
References
- Estler, W.T. High-accuracy displacement interferometry refin air. Appl. Opt. 1985, 24, 808. [Google Scholar] [CrossRef] [PubMed]
- Haitjema, H. Achieving traceability and sub-nanometer uncertainty using interferometric techniques. Meas. Sci. Technol. 2008, 19, 84002. [Google Scholar] [CrossRef]
- Zhang, Y.; Jiang, H.; Song, Y.; Liu, M.; Ding, R.; Xue, J.; Qian, Z.; Sun, L.; Wang, C. Research on angular displacement detection technology of inter-satellite laser communication based on coherent system. Opt. Commun. 2025, 574, 131050. [Google Scholar] [CrossRef]
- Xu, X.; Liu, H.; Tan, Y. Verification of Laser Heterodyne Interferometric Bench for Chinese Spaceborne Gravitational Wave Detection Missions. Research 2024, 7, 302. [Google Scholar] [CrossRef] [PubMed]
- Abbott, B.P. Observation of gravitational waves from a binary black hole merger. Phys. Rev. Lett. 2016, 116, 61102. [Google Scholar] [CrossRef] [PubMed]
- Chen, J.; Cazenave, A.; Dahle, C.; Llovel, W.; Panet, I.; Pfeffer, J.; Moreira, L. Applications and challenges of GRACE and GRACE follow-on satellite gravimetry. Surv. Geophys. 2022, 43, 305–345. [Google Scholar] [CrossRef] [PubMed]
- Danzmann, K. LISA and its pathfinder. Nat. Phys. 2015, 11, 613–615. [Google Scholar] [CrossRef]
- Hu, W.R.; Wu, Y.L. The Taiji Program in Space for gravitational wave physics and the nature of gravity. Natl. Sci. Rev. 2017, 4, 685–686. [Google Scholar] [CrossRef]
- Tao, W.; Deng, X.; Diao, Y.; Gao, R.; Qi, K.; Wang, S.; Luo, Z.; Sha, W.; Liu, H. Design and Construction of the Optical Bench Interferometer for the Taiji Program. Sensors 2023, 23, 9141. [Google Scholar] [CrossRef] [PubMed]
- Gao, R.; Liu, H.; Luo, Z.; Jin, G. Linearity performance analysis of the differential wavefront sensing for the Taiji programme. J. Mod. Opt. 2020, 67, 383–393. [Google Scholar] [CrossRef]
- Luo, J.; Chen, L.S.; Duan, H.Z.; Gong, Y.G.; Hu, S.; Ji, J.; Liu, Q.; Mei, J.; Milyukov, V.; Sazhin, M.; et al. TianQin: A space-borne gravitational wave detector. Class. Quantum Gravity 2015, 33, 35010. [Google Scholar] [CrossRef]
- Yu, X.; Gillmer, S.R.; Ellis, J.D. Beam geometry, alignment, and wavefront aberration effects on interferometric differential wavefront sensing. Meas. Sci. Technol. 2015, 26, 125203. [Google Scholar] [CrossRef]
- Duan, H.Z.; Liang, Y.R.; Yeh, H.C. Analysis of non-linearity in differential wavefront sensing technique. Opt. Lett. 2016, 41, 914–917. [Google Scholar] [CrossRef] [PubMed]
- Xia, Q.; Liang, Y.R.; Yan, Z.B. High-precision laser beam lateral displacement measurement based on differential wavefront sensing. Opt. Lett. 2023, 48, 5281–5284. [Google Scholar] [CrossRef] [PubMed]
- Meshksar, N.; Mehmet, M.; Isleif, K.S.; Heinzel, G. Applying Differential Wave-Front Sensing and Differential Power Sensing for Simultaneous Precise and Wide-Range Test-Mass Rotation Measurements. Sensors 2020, 21, 164. [Google Scholar] [CrossRef] [PubMed]
- Wanner, G.; Heinzel, G. Analytical description of interference between two misaligned and mismatched complete Gaussian beams. Appl. Opt. 2014, 53, 3043–3048. [Google Scholar] [CrossRef] [PubMed]
- Hechenblaikner, G. Measurement of the absolute wavefront curvature radius in a heterodyne, interferometer. J. Opt. Soc. Am. A Opt. Image Sci. Vis. 2010, 27, 2078–2083. [Google Scholar] [CrossRef] [PubMed]
- Zhang, Z.; Tong, S.; Lin, P.; Zeng, D.; Yu, X. A μrad Accuracy and nW Detection Sensitivity Four-Quadrant Heterodyne Coherent Angular Measurement System. Photonics 2025, 12, 509. [Google Scholar] [CrossRef]
- Heinzel, G.; Álvarez, M.D.; Pizzella, A.; Brause, N.; Delgado, J.J.E. Tracking Length and Differential-Wavefront-Sensing Signals from Quadrant Photodiodes in Heterodyne Interferometers with Digital Phase-Locked-Loop Readout. Phys. Rev. Appl. 2020, 14, 54013. [Google Scholar] [CrossRef]
- Metropolis, N.; Ulam, S. The Monte Carlo Method. J. Am. Stat. Assoc. 1949, 44, 335–341. [Google Scholar] [CrossRef] [PubMed]
Disclaimer/Publisher’s Note: The statements, opinions and data contained in all publications are solely those of the individual author(s) and contributor(s) and not of MDPI and/or the editor(s). MDPI and/or the editor(s) disclaim responsibility for any injury to people or property resulting from any ideas, methods, instructions or products referred to in the content. |
© 2025 by the authors. Licensee MDPI, Basel, Switzerland. This article is an open access article distributed under the terms and conditions of the Creative Commons Attribution (CC BY) license (https://creativecommons.org/licenses/by/4.0/).