Article

Highly Sensitive Dual-Polished Dual-Core PCF-Based SPR Sensor for Hemoglobin Detection Using FEM and Machine Learning

1
Department of Electrical and Electronic Engineering, Chittagong University of Engineering Technology, Chattogram 4349, Bangladesh
2
Department of Electrical and Electronic Engineering, Rajshahi University of Engineering and Technology, Rajshahi 6204, Bangladesh
3
Health and Civil Sector, Leidos, Reston, VA 20190, USA
4
Institute for Photonics and Advanced Sensing, School of Physics, Chemistry and Earth Sciences, The University of Adelaide, Adelaide, SA 5005, Australia
*
Author to whom correspondence should be addressed.
These authors contributed equally to this work.
Photonics 2025, 12(11), 1078; https://doi.org/10.3390/photonics12111078 (registering DOI)
Submission received: 18 September 2025 / Revised: 23 October 2025 / Accepted: 28 October 2025 / Published: 31 October 2025
(This article belongs to the Special Issue Advances in Optical Sensors and Applications)

Abstract

This research investigates a dual-polished surface plasmon resonance sensor based on dual-core photonic crystal fiber, featuring an innovative design aimed at enhancing hemoglobin concentration detection in blood, providing a valuable tool for diagnosing numerous health issues, such as chronic obstructive pulmonary disease. The sensor makes use of an external sensing mechanism and utilizes gold (Au) coating as the plasmonic material, chosen for its strong plasmonic response and excellent chemical stability, ensuring robust performance across the 1.31–1.42 refractive index range. The electromagnetic characteristics and efficacy of the designed sensor were thoroughly investigated using the finite element method. Our proposed sensor demonstrates outstanding performance metrics, attaining peak amplitude sensitivity of about 734 RIU−1, and wavelength sensitivity of 74,000 nm/RIU along with 1.35 × 10⁻⁶ RIU wavelength resolution. It also exhibits a notable Figure of Merit value of 667 for a corresponding Full width at Half Maximum value of 111 nm. Finally, a machine learning model based on linear regression was employed that enables the prediction of any hemoglobin concentration levels corresponding to analyte RI values. These exceptional performance metrics highlight the potential of our sensor as a reliable, cost-effective and highly sensitive solution for real-time biosensing applications.

1. Introduction

Surface Plasmon Resonance (SPR) sensors are optical instruments that measure variations in the refractive index next to a metallic surface. They operate by identifying changes in the resonance condition between surface plasmons and incident light [1]. SPR sensors are largely used in diverse areas such as chemical detection and biosensing. There are various types of SPR sensors including Photonic Crystal Fiber (PCF), waveguides, prisms, and optical fibers [2]. Waveguide-based SPR sensors frequently encounter constraints in mode confinement, resulting in diminished sensitivity. Prism-based sensors are bulky and require exact angular measurements. For these reasons, their use becomes more complex and less appropriate for portable applications [3,4]. Conventional Optical fiber-based sensors are flexible and encounter excessive propagation losses. As a result, their performance degrades over extended distances [5]. SPR bio-detection offers real-time, quantitative monitoring with high resistance to temperature interference. Therefore, they are more intelligent and portable through advancements in manufacturing. SPR-based devices have applications in optical integrated circuits, high-speed communication, graphene-based switches, terahertz waveguides, and sensing technologies [6,7]. They usually operate by coupling light into dielectric–metal interface, where surface plasmon resonance causes a significant change in the intensity or wavelength of the output signal in response to variations in the surrounding refractive index. This shift is utilized to detect variation in the medium, which helps in accurate and instantaneous detection of analytes [8,9].
Recent studies have shown the growing potential of photonic and SPR-based biosensors for medical diagnostics. A photonic biosensor was designed to detect disorders like cholesterol and anemia by analyzing refractive index variations in blood samples, achieving a sensitivity of 225 nm/RIU and a quality factor of 257. This study demonstrated satisfactory detection ability compared to conventional techniques [10]. Sharma et al. presented a one-dimensional photonic crystal sensor for diagnosing anemia by monitoring transmittance peak fluctuations, which are correlated with hemoglobin content. This sensor exhibited 892.85 nm/RIU sensitivity and a quality factor of 990, making it suitable for identifying different anemia stages [11].
Karki et al. developed an SPR sensor utilizing graphene and MXene layers for hemoglobin detection [12]. It demonstrated a sensitivity of 161 deg/RIU due to its multilayered structure, which is linked to hemoglobin concentration variations. A 2D PCF-based SPR sensor was also designed for detecting glucose and hemoglobin concentrations in blood [13]. It showed exceptional sensitivity, detection limit, and figure of merit, which indicated its value for rapid and accurate diagnosis of diabetes and anemia.
Other notable designs include a Barium Titanate–BlueP/TMDCs-based SPR sensor [14], which enhances glucose detection in urine by exploiting hybrid materials. A bowtie-shaped PCF SPR sensor [15] delivers high amplitude and wavelength sensitivities for identifying proteins and glucose with a superior figure of merit. A D-channel PCF SPR sensor [16] has been developed for multi-analyte detection, particularly for cancer diagnostics, while another design [17] targets real-time sodium ion monitoring for point-of-care diagnosis of hyponatremia and hypernatremia. Efforts have also been made to address pandemic needs, such as a gold-coated PCF-based SPR biosensor for SARS-CoV-2 detection [18] that made advancements in pandemic observation.
In the field of biosensing and diagnostics, the single-core PCF SPR sensor demonstrates superior performance in cervical and skin cancer detection with great sensitivity [19]. The U-grooved dual-channel SPR sensor features a dual-channel architecture with U-shaped grooves that improves sensitivity for the detection of several analytes [20]. The Ultra-Sensitive SPR sensor has remarkable sensitivity to both wavelength and amplitude, making it suitable for biomedical diagnostics [21]. Moreover, the V-shaped SPR biosensor provides improved sensitivity for the identification of a wider array of analytes in biochemical applications [22]. The PCF SPR sensor employs gold for plasmonic detection, identifying diverse biological and chemical analytes [23].
The proposed PCF-SPR biosensors demonstrate exceptional performance across various applications. One study in [24] introduced a highly sensitive PCF-SPR biosensor with a maximum wavelength sensitivity of 125,000 nm/RIU and amplitude sensitivity of −1422.34 RIU−1, which was optimized using machine learning and SHAP analysis. Another research presented a dual-channel PCF-SPR sensor for detecting Tuberculosis (TB) and Urinary Tract Infections (UTI), with sensitivities of 10,000 nm/RIU and 8235.29 nm/RIU [25]. A double-core PCF sensor has been designed for cancer detection, which achieved spectral sensitivities from 10,000 to 12,857.14 nm/RIU and a FOM of 22.03 1/RIU. These advancements validate the potential of PCF-SPR biosensors for early disease detection and biomolecular sensing [26].
The aim of this study is to develop and optimize a dual-polished SPR sensor based on PCF that presents an innovative and efficient architecture with multiple enhancements over traditional sensors. A major improvement is the minimization of gold requirement (less than 50%), which substantially lowers material costs and enhances cost-effectiveness compared to conventional SPR sensors that require larger plasmonic layers. The design also includes fewer air holes, simplifying the fabrication process, which reduces manufacturing complexity, improving scalability and facilitating production. This reduced complexity further enhances fabrication tolerances and it validates the capability for large-scale applications. The core diameter of our sensor is designed to match that of commercially available single-mode fibers (SMFs). So, coupling loss is reduced at both ends significantly during practical implementation.
The sensor is also made to keep an eye on the amount of hemoglobin in the blood, which is an important sign of diseases like Chronic Obstructive Pulmonary Disease (COPD). Blood hemoglobin levels are usually measured in g/L. The average male has a level between 140 and 180 g/L, while the average female has a level between 120 and 160 g/L. The average person’s blood has a refractive index between 1.32919 and 1.34995 [27]. The refractive index of blood ranges from 1.3321 to 1.3972, which means that our sensor can measure hemoglobin levels from 0 g/L to 250 g/L. This specialized application makes the sensor more sensitive and accurate, especially when used for point-of-care testing. To make diagnoses even more accurate, a machine learning model based on linear regression has been added to accurately predict hemoglobin levels from refractive index values. It makes it easier to understand real-time data and make clinical decisions. The proposed dual-polished PCF-based SPR sensor is an advanced and practical solution that can outperform traditional SPR sensors in both performance and applicability for medical diagnostics. This is because it has a cost-effective design, is easy to manufacture, has specialized diagnostic capabilities, and can process data intelligently.

2. Sensor Design and Operation

2.1. Device Modeling and Structure

Figure 1a,b show the 2D structure of the proposed SPR sensor, which is based on a dual-core PCF and its stacked preform. The cladding is made up of a hexagonal lattice with symmetrical air holes around the core. The pitch (Λ) is the distance between the midpoints of two air holes that are next to each other. The simulation results show that a pitch of 1.8 µm is the best balance between light confinement and propagation losses.
Dual polishing at both ends of the suggested PCF ensures uniformly smooth surfaces that reduce the gap between the plasmonic surface and the core. The central air holes of the peripheral hexagonal ring next to the upper and lower plasmonic layers are removed in order to improve coupling efficiency with the plasmonic material. Increased energy transfer from the core mode to the surface plasmon polariton (SPP) mode is made possible by this modification, which also decreases losses at the fiber interfaces and increases light coupling.
Confinement loss has a significant impact on the sensitivity of the sensor; variations in confinement loss have a direct impact on sensitivity. Furthermore, the effective sensing length and the analyte refractive-index detection range are both decreased by increased confinement loss. The diameters of the four air holes adjacent to the plasmonic layer are set to d3 = 0.96 Λ µm, and the air holes near the curved surfaces in the outermost ring are set to d1 = 0.9 Λ µm. These design choices amplified light confinement within the core, improved the interaction of the evanescent field with analytes, and substantially increased both the sensitivity and guiding performance of the sensor.
The central air hole plays a vital role in the dual-core PCF design, as it effectively separates the two cores and enhances their interaction. It enables precise mode control for superior light guidance and sensor performance. The diameter of this air hole is denoted as dc = 0.5 Λ µm. Four smaller air holes (d2 = 0.3 Λ µm) are symmetrically arranged around the central air hole, which are essential for modifying the effective mode index and improving optical confinement. The distance from the PCF center to the plasmonic layer is denoted by h = 4.2 µm. The structural parameters are listed below in Table 1.
A 40 nm-thick gold composite plasmonic layer (tau) is optimized to efficiently interact with the guided mode, thereby improving the sensor’s sensitivity. A ring-shaped Perfectly Matched Layer (PML) is employed as the boundary condition in simulations to suppress reflections and ensure accuracy. Fused silica was selected for its minimal optical loss, broad transmission range (UV–IR), chemical resistance, and mechanical durability, making it suitable for biosensing applications. Additionally, its well-understood dispersion and refractive index characteristics allow for precise FEM modeling [28].
The nonlinear refractive index coefficient n 2   for fused silica has been measured in multiple studies, and is found to be on the order of 2 4 × 10 16   cm 2 / W   (≈ 2 4 × 10 20   m 2 / W ) at near-infrared wavelengths [29]. Typical optical intensities used in SPR-based biosensing (e.g., <106 W/cm2) would therefore result in an induced refractive index change Δ n n 2 I 10 10 , this is several orders of magnitude smaller than the refractive-index variations relevant for plasmonic sensing (~10−4–10−5 RIU). Hence linear optical approximation is justified in the FEM modeling for our sensor architecture.
The refractive index of fused silica is given by the Sellmeier equation:
n λ = 1 + λ 2 X 1 λ 2 Y 1 + λ 2 X 2 λ 2 Y 2 + λ 2 X 3 λ 2 Y 3
where λ denotes the wavelength (µm), the equation coefficients X1, X2, X3, Y1, Y2, and Y3 are specific to fused silica: X1 = 0.69616300, X2 = 0.407942600, X3 = 0.89747940, Y1 = 4.679148260 × 10⁻³ µm2, Y2 = 1.351206310 × 10⁻³ µm2, and Y3 = 97.93400250 µm2 [30].
Gold was selected as the plasmonic layer due to its remarkable plasmonic characteristics, exceptional chemical stability, and strong plasmon resonance, making it ideal for enhancing sensor performance. The permittivity of gold was calculated using the Drude–Lorentz model to accurately simulate the interaction of light with the material [30], expressed as:
ε A u = ε ω D 2 ω ω + j γ D ϵ Ω L 2 ω 2 Ω L 2 + j Γ L ω
Here, the permittivity of gold is denoted as ε A u , and at higher frequencies, the permittivity approaches ε = 5.96730. The angular frequency is expressed as ω = 2πc/λ, where c is the speed of light and λ is the wavelength. The damping frequency ( γ D ) is given by the equation, γ D / 2 π = 15.920 THz. The plasma frequency ( ω D ) is denoted by ω D / 2 π   =   2113.60   THz . The weighting factor, represented by Δε, is 1.09. Finally, Ω L / 2 π   =   650.08 THz and Γ L / 2 π = 104.87 THz represent the oscillator strength and spectral width of the Lorentz oscillators, respectively. Finally, the oscillator strength and spectral width of the Lorentz oscillators are ΩL/2π = 650.08 THz and ΓL/2π = 104.87 THz, respectively.
Wave optics modal analysis was performed using the Finite Element Method (FEM) in COMSOL Multiphysics (version 6.2) to design, model, and simulate the sensor. The simulation was performed in the frequency domain with a wavelength sweep ranging from 400 to 2000 nm, and the step size was set to 20 nm. The Electromagnetic Waves, Frequency Domain physics interface was used to simulate the optical behavior of the structure. The simulation incorporated a predefined cylindrical Perfectly Matched Layer (PML) and standard boundary conditions to effectively absorb scattered evanescent fields and minimize reflection artifacts. A fine mesh was employed to improve accuracy. Minimum and maximum mesh element sizes were set to 3.78 × 10⁻⁹ m and 8.44 × 10⁻⁷ m, respectively, to minimize error.
The proposed PCF structure can be fabricated using the standard “stack and draw” method, a widely adopted technique due to its advantages of being fast, clean, cost-effective, and flexible [31]. Figure 1b shows the stacked performance for the proposed PCF sensor. The air holes that are missing can be formed by inserting solid rods, with thick-wall capillaries used for smaller air holes and thin-wall capillaries for larger air holes. To coat the external surface of the fiber structure with gold thin films, the chemical vapor deposition (CVD) technique can be applied. CVD is ideal for creating a uniform, thin metal coating. Additionally, the selective-filling technique can be employed on top of the plasmonic layer to introduce the analyte sample into the sensing channel [32].
Future work could explore the use of two-photon polymerization (2PP) microstereolithography for fabricating high-resolution 3D photonic crystals and microscale structures, enabling precise control over material properties and geometry for applications in biosensing, micro-optics, and spectroscopic sensing in the mid-infrared range [33,34]. Additionally, phase-assisted multi-material two-photon polymerization can be utilized to extend the refractive index range, enabling the fabrication of complex, high-performance optical devices [35].

2.2. Experimental Setup and Working Mechanism of the Sensor

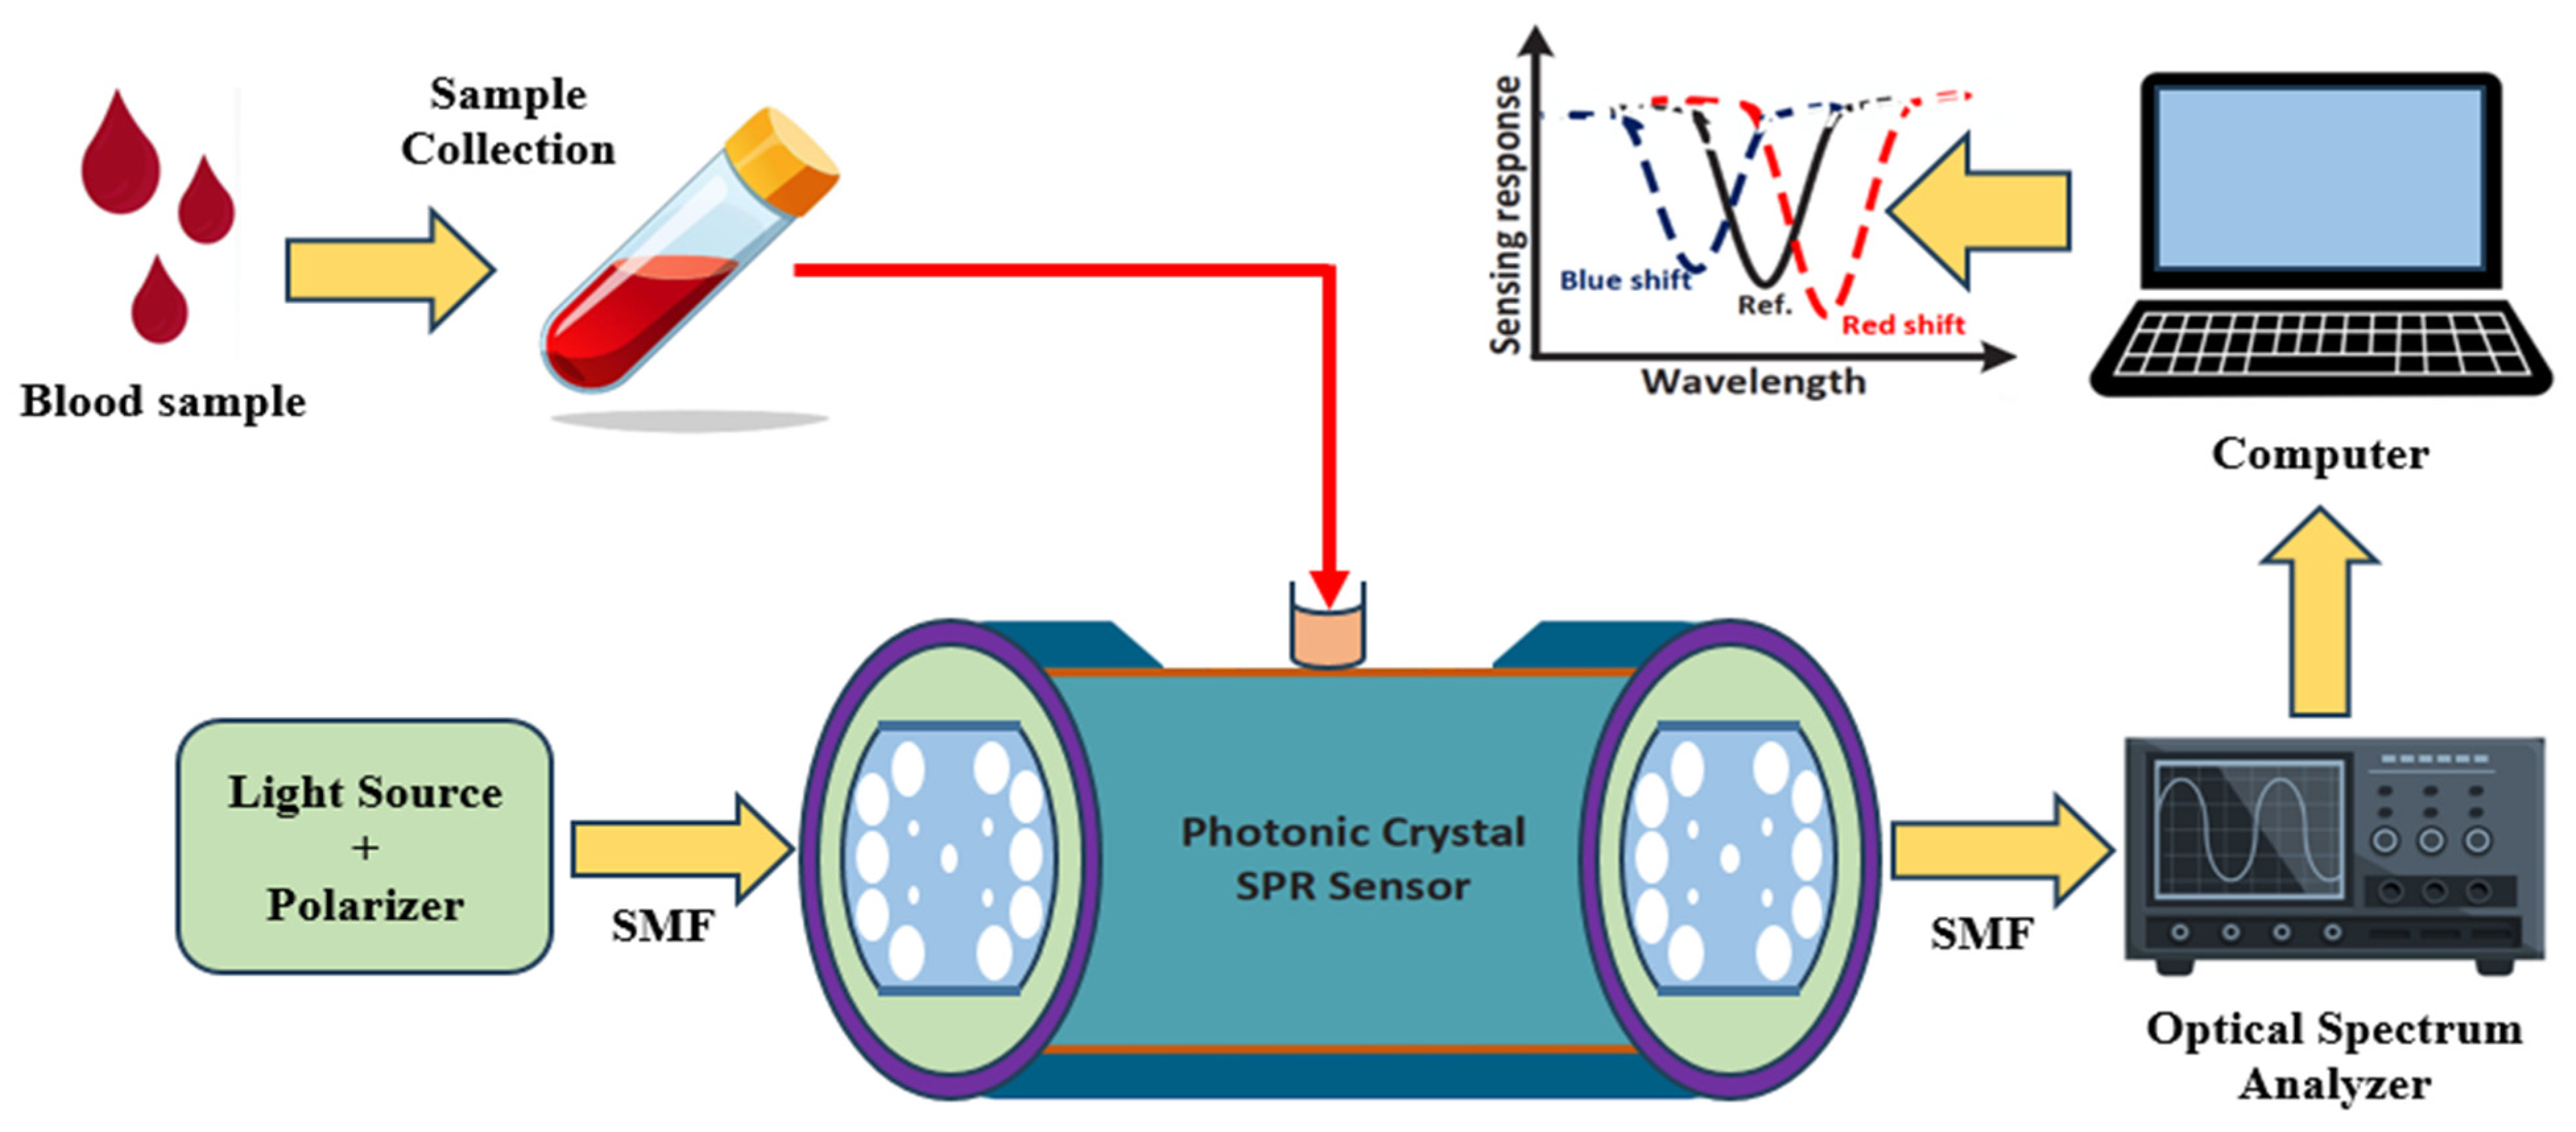
The step-by-step schematic for the hemoglobin (Hb) detection using the proposed sensor is illustrated in Figure 2.
The process begins with the extraction of a blood sample, which is then introduced into the sensor system. Electromagnetic waves from a broadband polarized light source are coupled into the PCF through a single-mode fiber (SMF) that is sold commercially. Another SMF is then used to connect the PCF to an optical spectrum analyzer (OSA). The core diameter of our suggested design, which is roughly 9 µm, closely resembles the core diameter of commercially available SMFs, which are normally between 9 and 10 µm. During practical implementation, this close matching significantly lowers coupling losses at both ends of the sensor.
Surface plasmon polaritons (SPPs) at the metal–dielectric interface are excited by light as it passes through the PCF, which causes energy absorption and a corresponding drop in light intensity. The resonance wavelength, which correlates to a particular refractive index (RI) connected to the analyte, is where maximum energy transfer takes place.
The resulting transmission loss spectrum is captured by the OSA and transferred to a computer for further processing. This analysis tracks the changes in the resonance wavelength, which indicate the deviations in the RI caused by variations in hemoglobin concentration. These shifts are compared against a pre-established calibration curve or reference spectrum to quantitatively determine the analyte concentration.
This integrated system enables real-time, highly sensitive detection and analysis of blood samples, making it a promising diagnostic tool for early detection and monitoring of COPD.

3. Results and Discussions

3.1. Performance Analysis

The performance of the proposed sensor is mainly governed by waveguide theory and coupled-mode theory. Waveguide theory explains how light is confined and guided within the unique geometry of the PCF. The specific arrangement of air holes and the dual-core structure enable strong mode confinement with minimal propagation loss [36]. While coupled mode theory describes the interaction between the guided core modes and the plasmonic material, which enables the transfer of energy from the optical mode to surface plasmon modes at the dielectric–metal interface [37]. The electromagnetic (EM) waves that propagate along this interface are known as surface plasmon polaritons (SPPs). When the phase matching condition, propagation constants of the core mode and SPP mode are equal, is satisfied, efficient coupling occurs, resulting in SPR. This resonance is highly sensitive to variations in the analyte’s refractive index, making the sensor effective for detection applications [38].
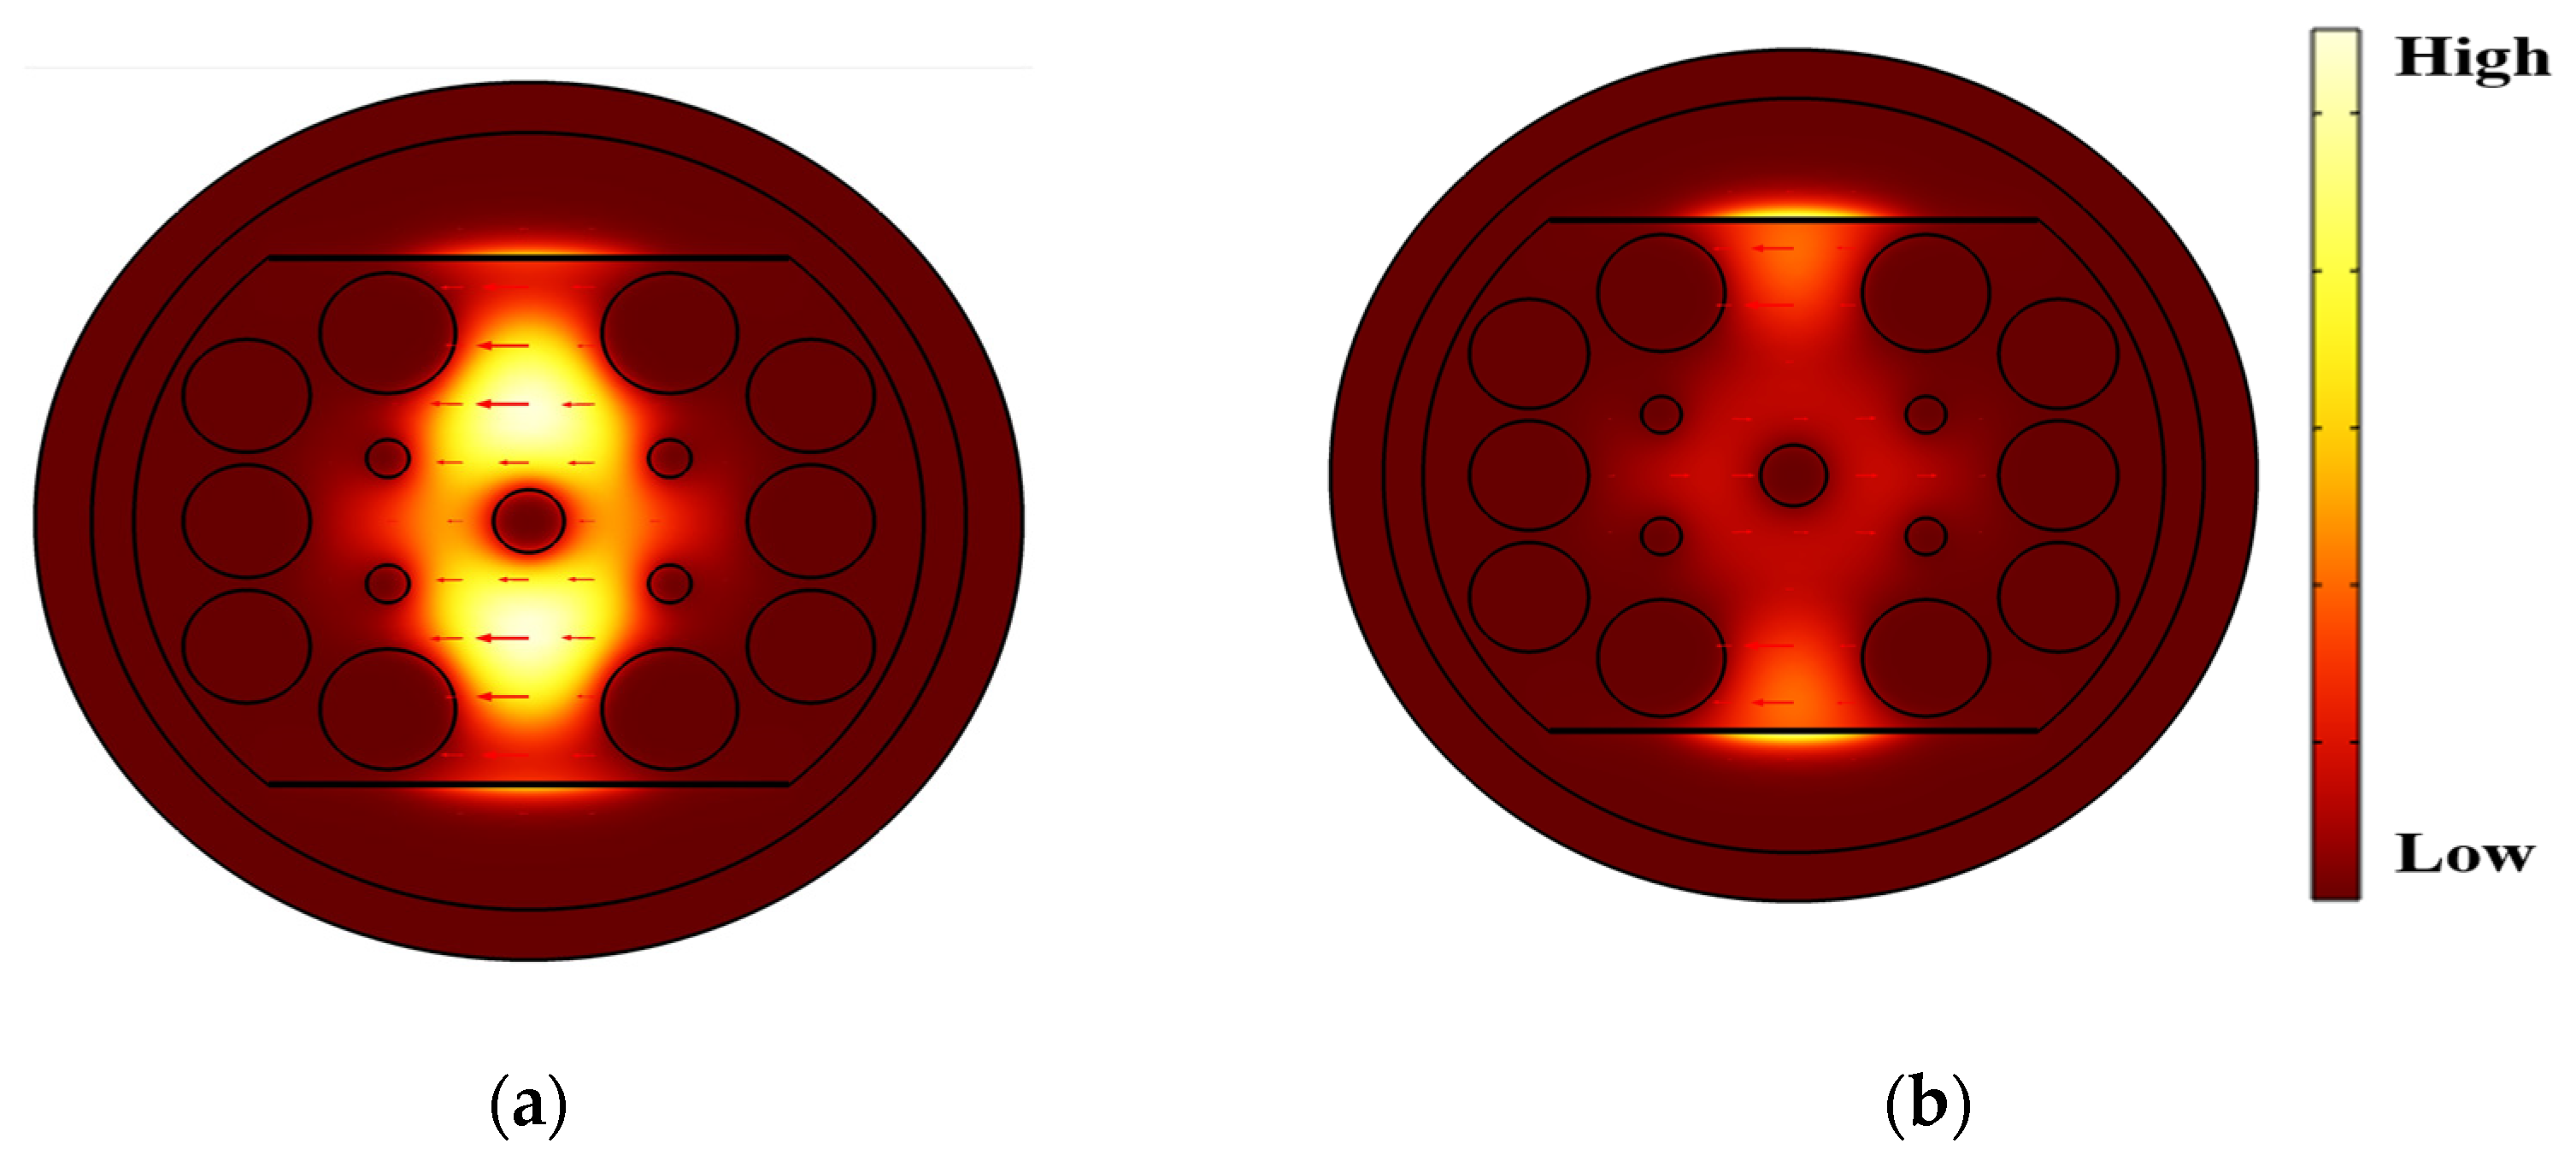
Figure 3a shows the fundamental mode of x-polarized light in the designed PCF–SPR sensor, where the electric field is strongly confined within the fiber core. The field intensity is maximum at the center and gradually decreases toward the cladding, indicating efficient confinement. Figure 3b illustrates the electric field distribution of the SPP mode, where the field penetrates the plasmonic layer, facilitating interaction between the evanescent field and the metallic surface. The arrows in the figure represent the polarization direction which highlights the interaction between the guided light and the plasmonic material. The resonance condition occurs when the propagation constants of the core mode and the SPP mode become equal and it enables maximum energy transfer between them. In the PCF–SPR sensor, this condition is critical for optimizing coupling between the guided core light and the plasmonic surface to enhance sensitivity for biosensing applications [39].
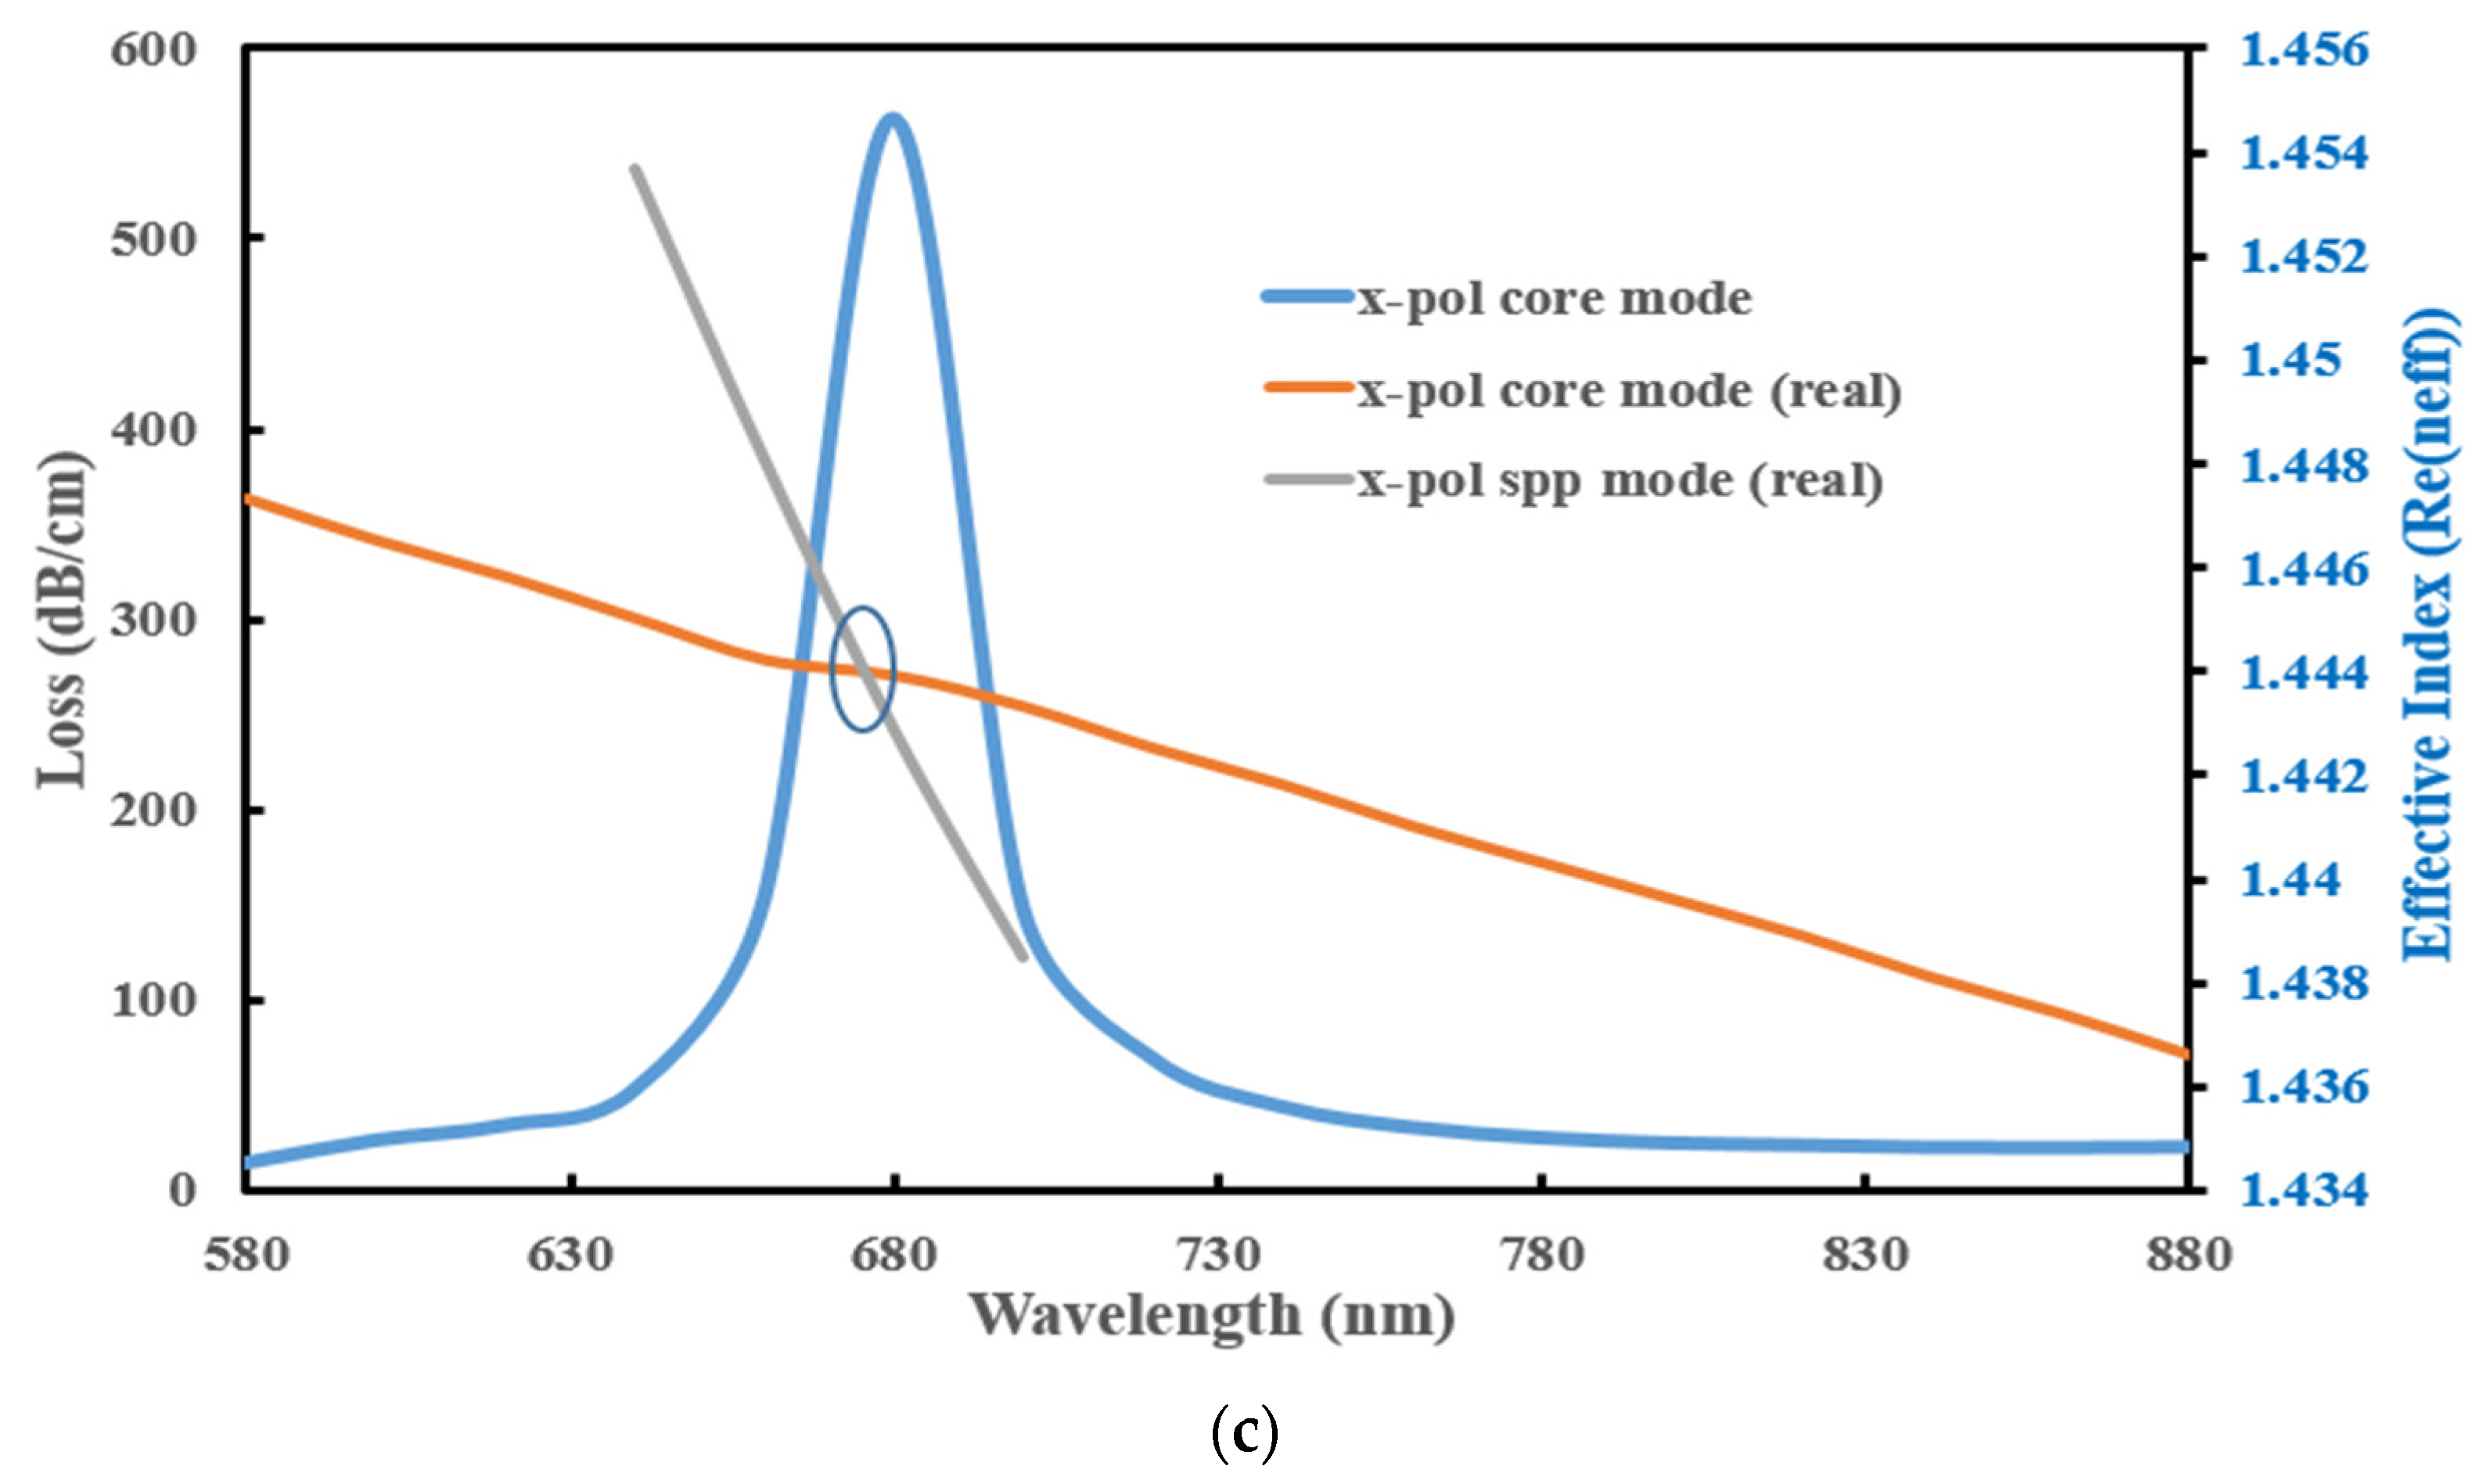
In Figure 3c, the orange curve represents the real component of the effective index for the x-polarized core mode, which shows a gradual decrease with increasing wavelength. For the x-polarized SPP mode, the gray curve represents the Re(neff), which varies significantly. The point where they intersect, denoted by a circle, is close to a resonant wavelength of 680 nm, where the resonance condition is met. Maximum energy transfer from the core mode to the plasmonic surface takes place at this wavelength, resulting in a noticeable peak in the blue curve that, for a refractive index of 1.37, represents the refinement loss of the x-polarized core mode. This peak shows that the evanescent field radiating from the core into the cladding is effectively exciting the plasmonic material, which improves the light-matter interaction. It is especially useful for biosensing applications because of its high sensitivity to variations in the analyte’s refractive index as monitoring shifts in the resonant peak enables accurate detection and differentiation of analytes based on their unique RI values.
The proposed sensor demonstrates significantly stronger coupling and a sharper loss curve for the x-polarized mode compared to the y-polarized mode. Consequently, the performance evaluation focuses exclusively on the x-polarized mode. For a specific wavelength, the confinement loss (α) is calculated using the equation:
α ( dB / cm )   =   8.686   ×   k 0   ×   Im ( neff )   ×   10 4        
where the free space wave number for wavelength λ is k 0 = 2 π λ and the imaginary part of the core effective index RI is Im(neff) [40].
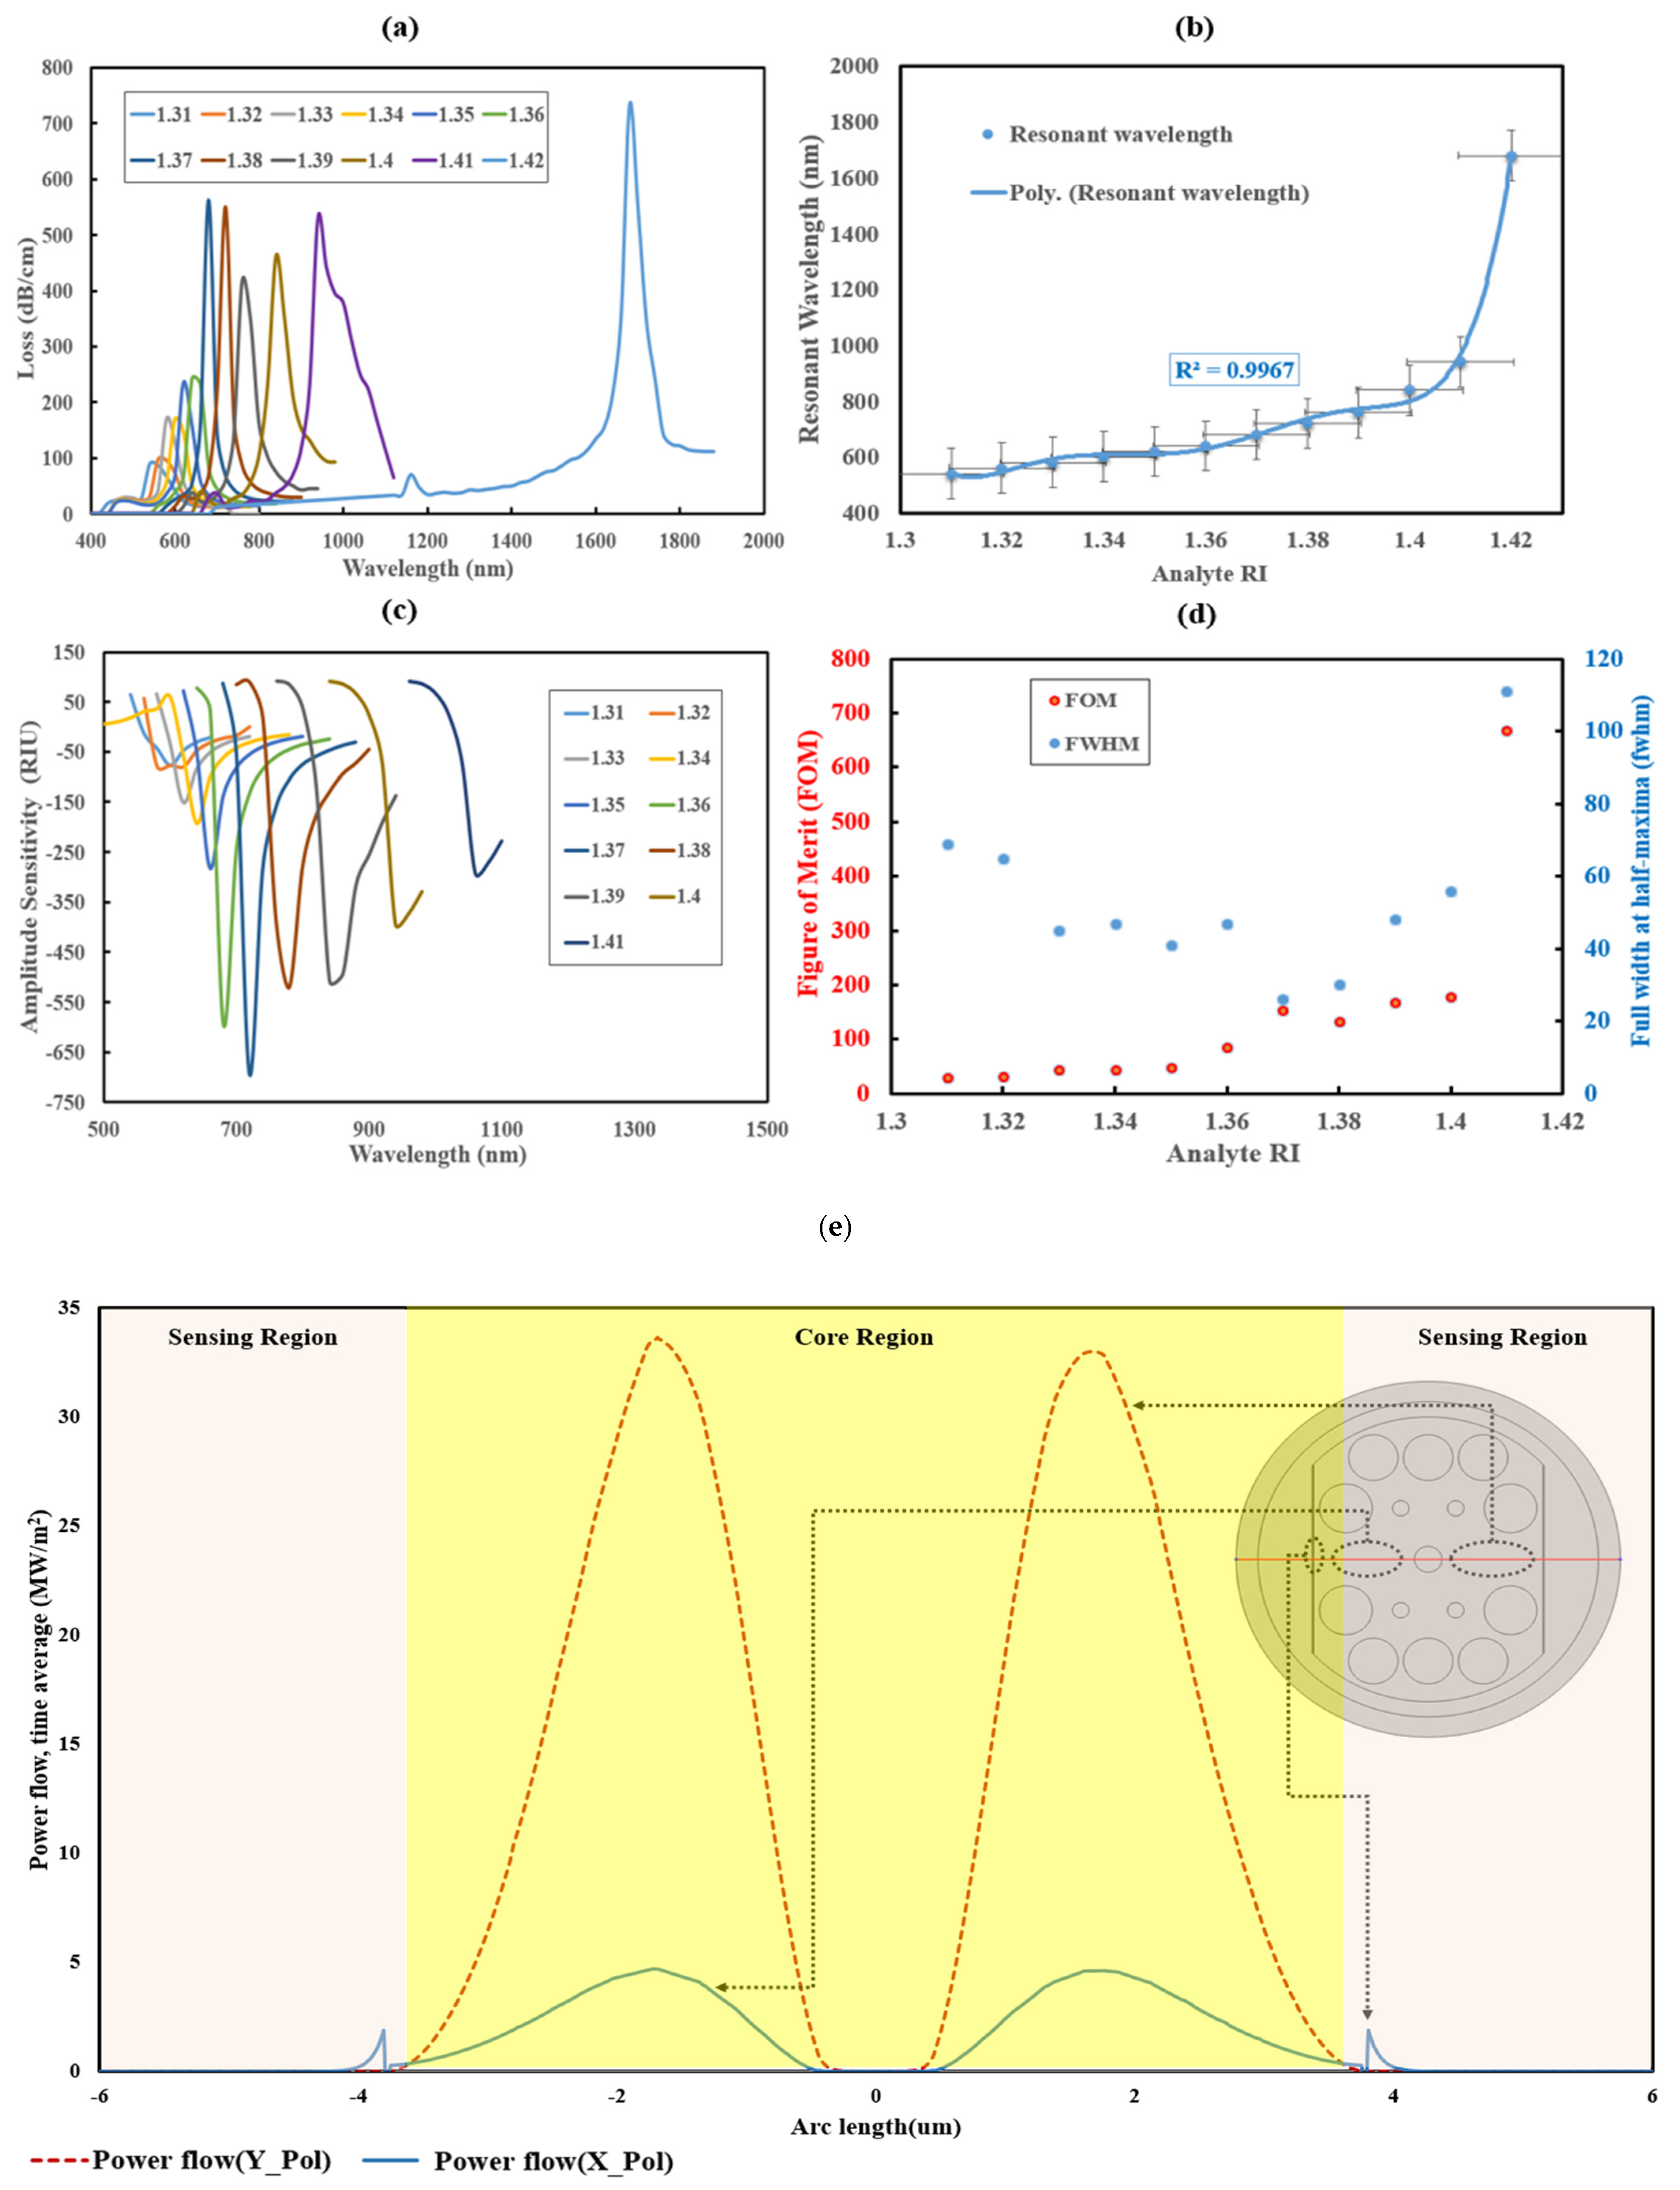
The variation in the analyte refractive index (RI) alters the effective indices of both the core and SPP modes. Figure 4a illustrates the confinement loss spectrum of the core-guided mode for analyte RIs ranging from 1.31 to 1.42. The maximum confinement loss increases as the RI rises from 1.31 to 1.38, likely due to enhanced index contrast between the core and cladding, while slight fluctuations are observed between 1.39 and 1.42. Additionally, the resonance wavelength shifts toward longer wavelengths as the RI increases. The corresponding resonance wavelengths are 540, 560, 580, 600, 620, 640, 680, 720, 760, 840, 940, and 1680 nm for RIs of 1.31–1.42, respectively. This shift confirms the sensor’s capability to detect small RI variations, thereby improving sensitivity and measurement reliability for biosensing applications.
The wavelength sensitivity ( S λ ) is calculated from [41],
S λ ( nm / RIU ) =   λ peak n a      
where   λ p e a k is the difference between the resonance wavelengths for two RIs and n a   is the corresponding RI difference. Using wavelength interrogation, Figure 4a shows that resonance peaks shift consistently toward longer wavelengths with increasing RI. A particularly large shift is observed between RI = 1.41 and RI = 1.42, corresponding to a maximum wavelength sensitivity of 74,000 nm/RIU. This high sensitivity enables the detection of minute RI changes, making the sensor suitable for accurate sensing.
The resolution of an SPR biosensor refers to its ability to detect and quantify small variations in the refractive index of the medium adjacent to the sensor surface. The wavelength resolution (Rλ) is given by [42].
R λ RIU = Δ n a   ×   Δ λ min / Δ λ peak  
where Δ λ m i n denotes the smallest spectral resolution. With Δ λ m i n set to 0.1 nm and an analyte RI of 1.41, the wavelength resolution is calculated to be 1.35 × 10⁻⁷ RIU. Additionally, a polynomial curve fit of the resonant wavelength versus analyte RI, over the range 1.31–1.42, is shown in Figure 4b. The resonant wavelength increases from 540 nm to 1680 nm with increasing RI. The fit shows an R-squared magnitude of 0.9967, which indicates excellent linearity and consistent sensor behavior across the entire operating range [43]. This strong linearity validates the sensor’s potential for practical applications due to precise RI determination.
The amplitude sensitivity of the biosensor was evaluated for each analyte RI for further evaluation. This parameter is important in selecting the optimal operating wavelength for accurate biosensing. The amplitude sensitivity (SA) is determined using the amplitude interrogation technique [44]:
S A R I U 1 = 1 α λ , n a α λ , n a n a
where α(λ,na) denotes the confinement loss as a function of wavelength and analyte RI, and ∂α(λ, na)/∂na represents the change in loss with respect to RI variation.
As shown in Figure 4c, the amplitude sensitivity varies with RI and wavelength, which reaches a maximum value of 694 RIU−1 at RI = 1.37. This high value demonstrates the sensor’s ability to detect minute changes in refractive index, especially at wavelengths where resonance is strongest, which confirms its suitability for highly accurate sensing applications.
The figure of merit (FOM) is another critical metric for evaluating sensor performance and is defined as [44]:
F O M   =   S λ F W H M  
where Sλ is the wavelength sensitivity and FWHM denotes the full width at half maximum of the fundamental mode loss spectrum.
As shown in Figure 4d, the FOM increases with analyte RI and it reaches a maximum at RI = 1.37 before gradually declining. This indicates that sensitivity improves with RI up to the optimum point, and after that the performance decreases. A higher FOM corresponding to a narrower FWHM shows their inverse relationship. It demonstrates that at higher FOM values, the sensor achieves improved resolution and sharper resonance peaks with enhanced detection accuracy. The complete performance parameters for different analyte RIs are listed in Table 2.
To quantify the light-matter interaction, the fraction of total power (Pf) is introduced, as derived from the Poynting theorem in Equation:
    P f   =   sample R e ( E x H y - E y H x ) d x d y total R e ( E x H y - E y H x ) d x d y × 100 %
Here, the integration of the numerator indicates the light power carried by the core hole material, and the integration of the denominator shows the total light power inside the fiber [45].
The effective area is an important characteristic of a PCF. It refers to the region within the core of the PCF that is enclosed by the mode field, and is calculated using the equation.
A eff =   [ I r rdr ] 2 [ I 2 r dr ]  
where I(r) = |Et|2 denotes the electric field intensity distribution along the PCF waveguide [46]. The effective area of our sensor was calculated as around 7.33 µm2.
Figure 4e illustrates the electromagnetic power flow distribution along the photonic crystal fiber (PCF) for x- and y-polarized modes. The red dashed curve represents the y-polarized mode, while the blue solid curve corresponds to the x-polarized mode. In this figure, the zero point on the x-axis represents the center of the PCF 2D structure. In this case, the region to the left of the zero point and the region to the right represent the two cores of the PCF structure, respectively. Beyond both the left and right core regions of the PCF geometry, there are two sensing or plasmonic layers, which are also indicated in the figure after the extended core portions on the left and right sides. In the case of the x-polarized mode, it is clear that two peaks appear in the two core regions, representing the power flow in the core areas. Additionally, two relatively smaller peaks are observed in the two sensing regions on both sides, which indicate the amount of transferred power from the core regions to the sensing regions. Our results revealed that for x-polarized light, approximately 28.7% of the modal power interacts with the plasmonic region (sensing area), while 71.3% remains confined within the fiber core. In contrast, for the y-polarized mode, although the core region contains more power compared to the x-polarized mode, the power has not extended into the sensing regions. As a result, no peaks are observed in the sensing regions for the y-polarized mode which exhibits nearly zero interaction with the plasmonic region, indicating negligible coupling. This difference in modal interaction refers to the differential power enhancement between the two participating modes. The enhanced field overlap of the x-polarized mode with the plasmonic region facilitates stronger surface plasmon excitation, thereby improving the sensor’s ability to discriminate variations in the refractive index (RI) of the analyte.
Although the FEM model assumes ideal structural and environmental conditions, we have examined the effects of temperature, humidity, and fabrication tolerances qualitatively. The thermo-optic coefficient of fused silica (1 × 10⁻⁵ RIU/°C) indicates that moderate temperature variations cause negligible spectral shifts, while humidity and air pressure effects are minimized by the liquid-filled sensing region [47,48,49]. Furthermore, tolerance analysis with ±10% geometric deviations demonstrates less than 3% change in wavelength sensitivity, confirming the robustness of the proposed sensor design.

3.2. Hemoglobin (Hb) Level Detection Analysis

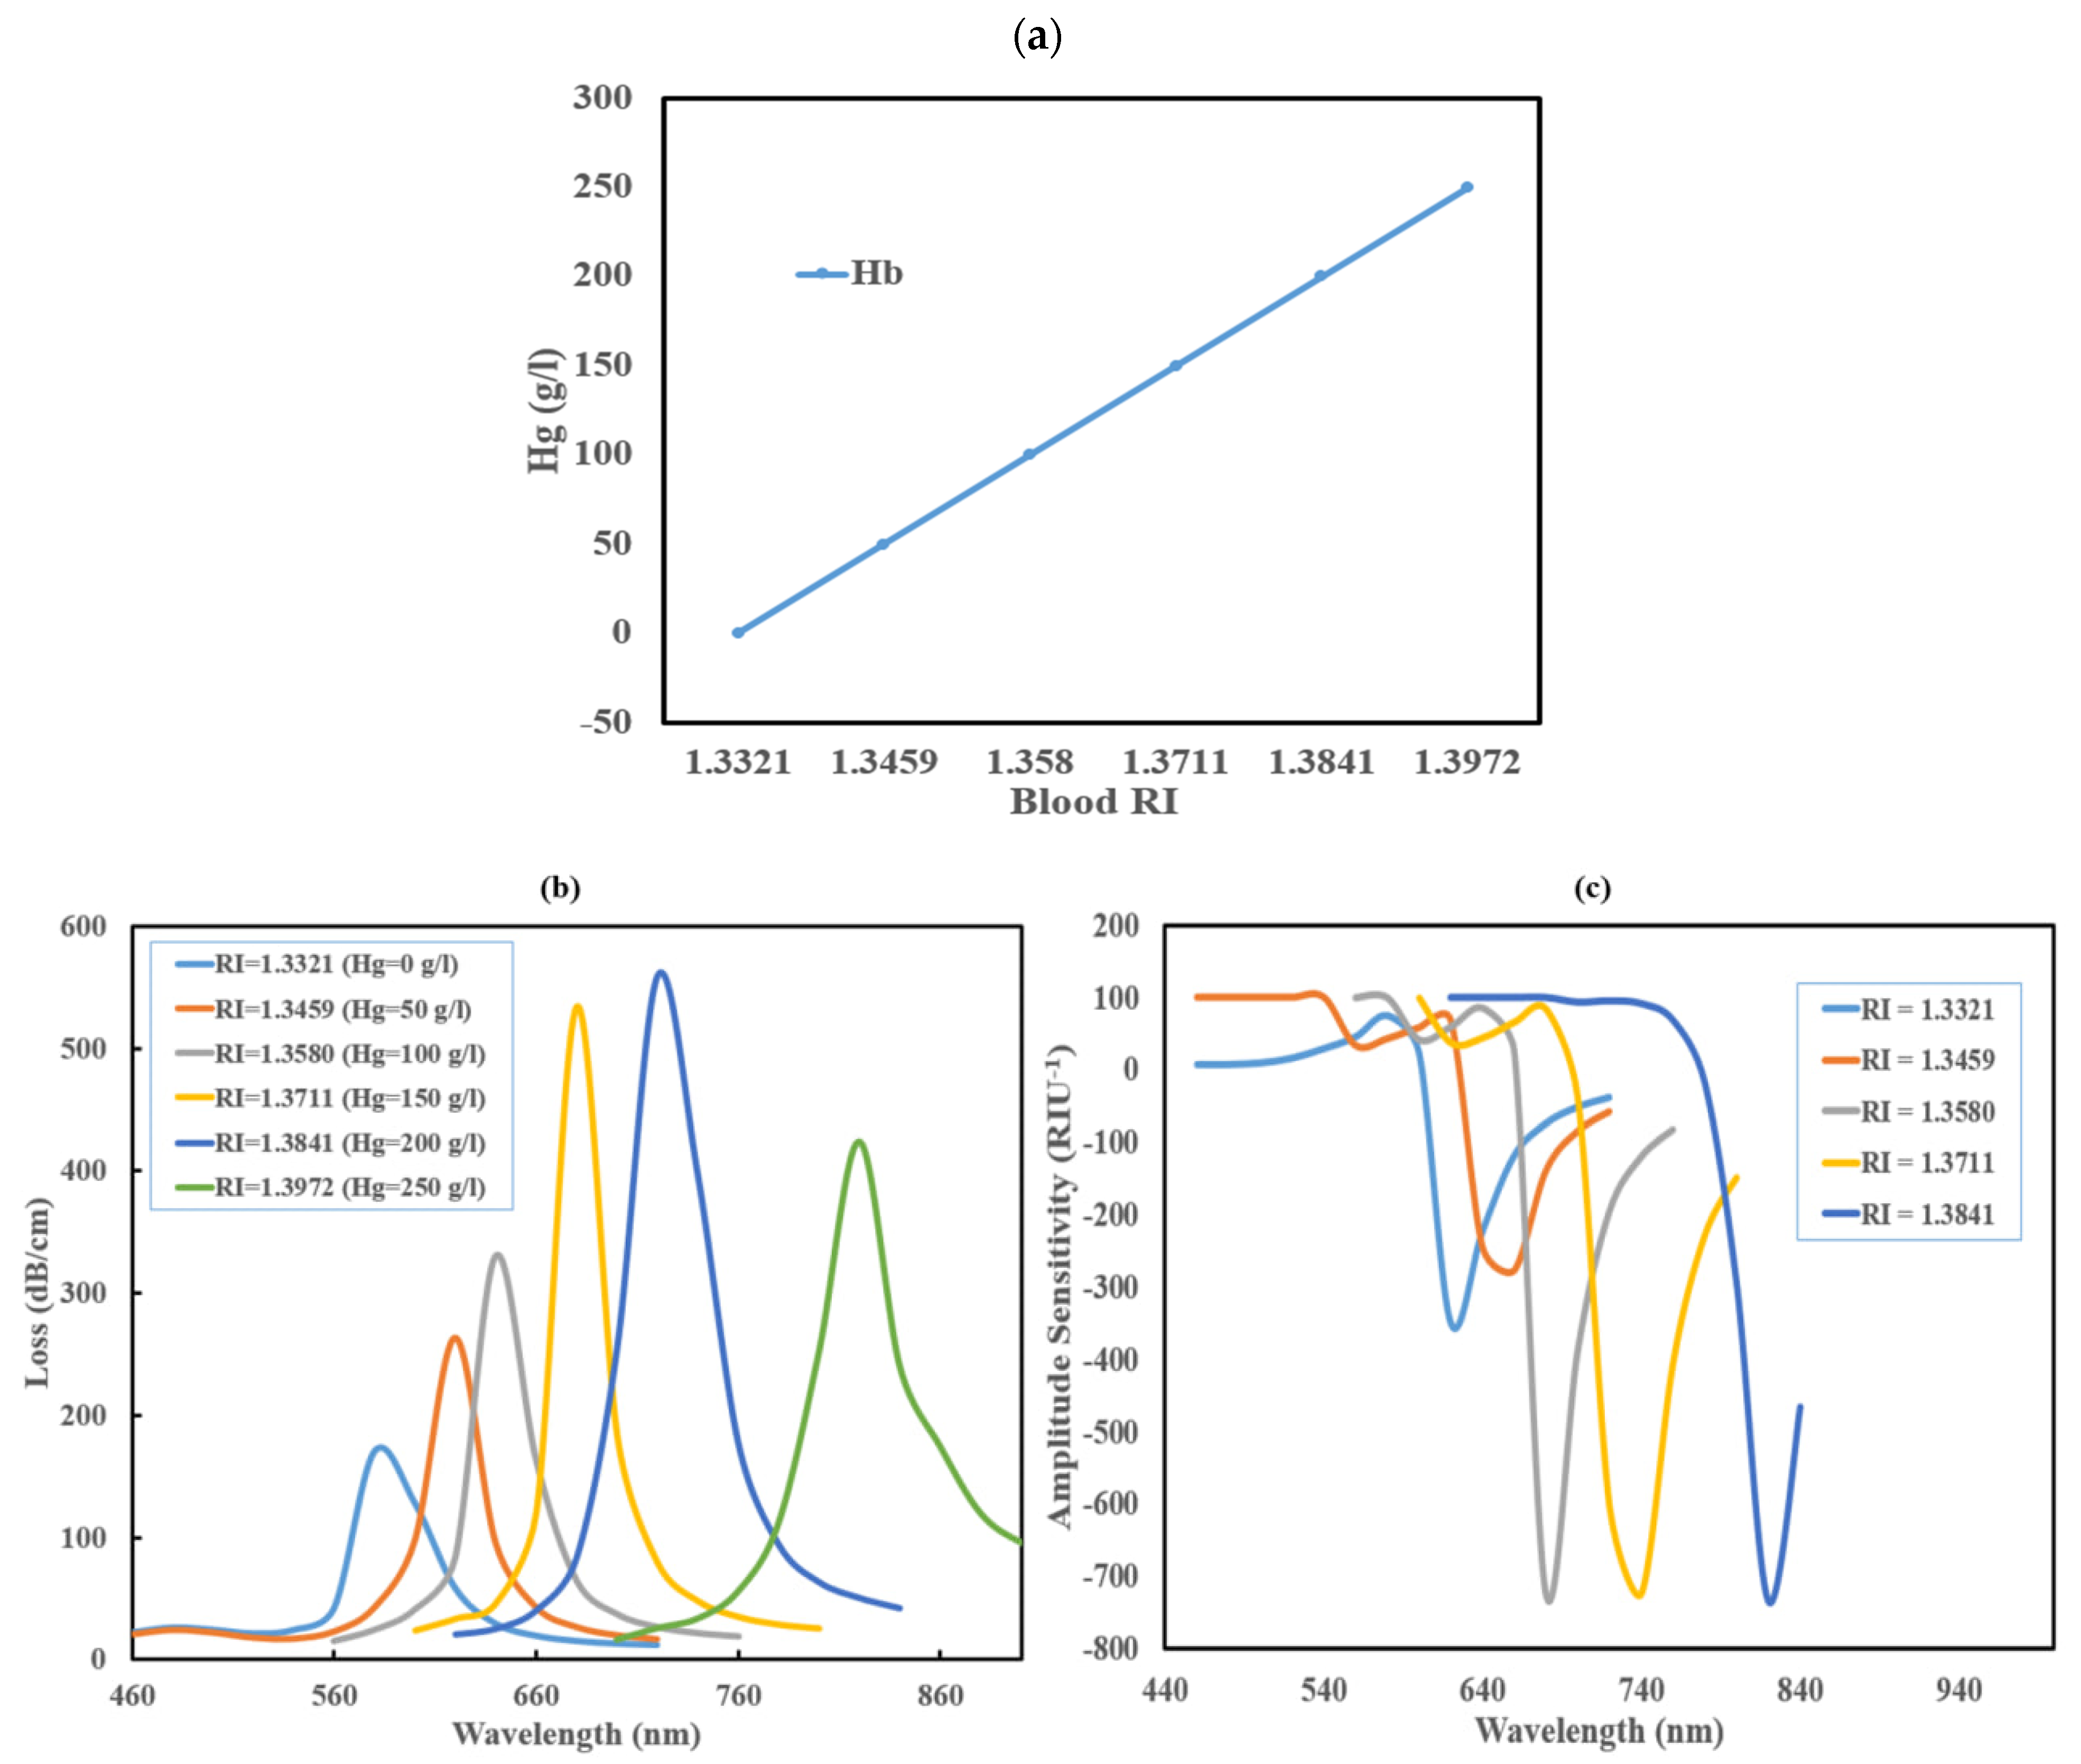
The proposed PCF-SPR sensor is capable of accurately quantifying Hb concentration in blood which enables the detection and monitoring of conditions such as anemia and COPD. Variations in Hb concentration cause predictable changes in the blood’s RI which is shown in Figure 5a. By calibrating the sensor against a reference curve that correlates Hb concentrations with corresponding RI values, the Hb level of a sample can be determined through direct RI measurement. For instance, in Table 3, an RI of 1.3711 corresponds to an Hb concentration of approximately 150 g/L, which is a clinically relevant threshold for COPD assessment. This approach allows rapid, sensitive, and non-invasive analysis of blood, and makes the sensor suitable for real-life biomedical applications and point-of-care diagnostics.
The confinement loss spectrums in Figure 5b illustrate the variation in loss with wavelength for various refractive indices of blood, corresponding to varied levels of hemoglobin (Hb) in blood. Each curve denotes a certain hemoglobin level, and as the hemoglobin concentration rises, the vertex of the loss curve swings toward longer wavelengths. This means that by examining the position and amplitude of these peaks, the sensor may determine the Hb content in a blood sample, since each concentration creates a specific loss pattern. The sensor is able to identify RIs inside a small spectrum, with particular resonant wavelengths established for each refractive index, which are 580, 620, 640, 680, 720, and 840 nm. The ability to identify minor RI variations helps the proposed sensor to recognize the level of Hb in a blood sample.
Figure 5c represents the amplitude sensitivity for these Refractive indices. For each RI value, the amplitude sensitivity varies with wavelength, indicating a strong response at some places. These high-sensitivity zones often occur near the wavelengths where the confinement loss peaks are located. This implies that the sensor is most effective in detecting changes in Hb concentration at specified wavelengths, allowing for very accurate and sensitive measurements in practical applications. Notably, our biosensor displays a decent amplitude sensitivity of 734 RIU−1, suggesting the remarkable ability to identify even minor variations in the refractive index produced by various Hb levels.
Table 4 shows the performance metrics of the proposed biosensor in Hb detection and demonstrates the performance of the SPR biosensor in detecting different hemoglobin (Hb) levels through variations in refractive indices. As the refractive index rises with Hb concentration, the resonant wavelength (λres) also shifts, confirming the sensor’s efficiency to follow changes in blood composition. The wavelength sensitivity (Sλ) and amplitude sensitivity (SA) both exhibit high values, indicating how responsive the sensor is to small changes. The sensor has its optimum performance at RI = 1.3841, where it shows the peak amplitude sensitivity (734 RIU−1), peak wavelength sensitivity (12,000 nm/RIU), and best figure of merit (FOM = 250), combined with a good resolution (Rλ = 8.33 × 10⁻⁶). These results prove that the sensor is highly accurate and effective in detecting Hb concentrations based on variations in RI.

3.3. Machine Learning Model to Detect Hemoglobin

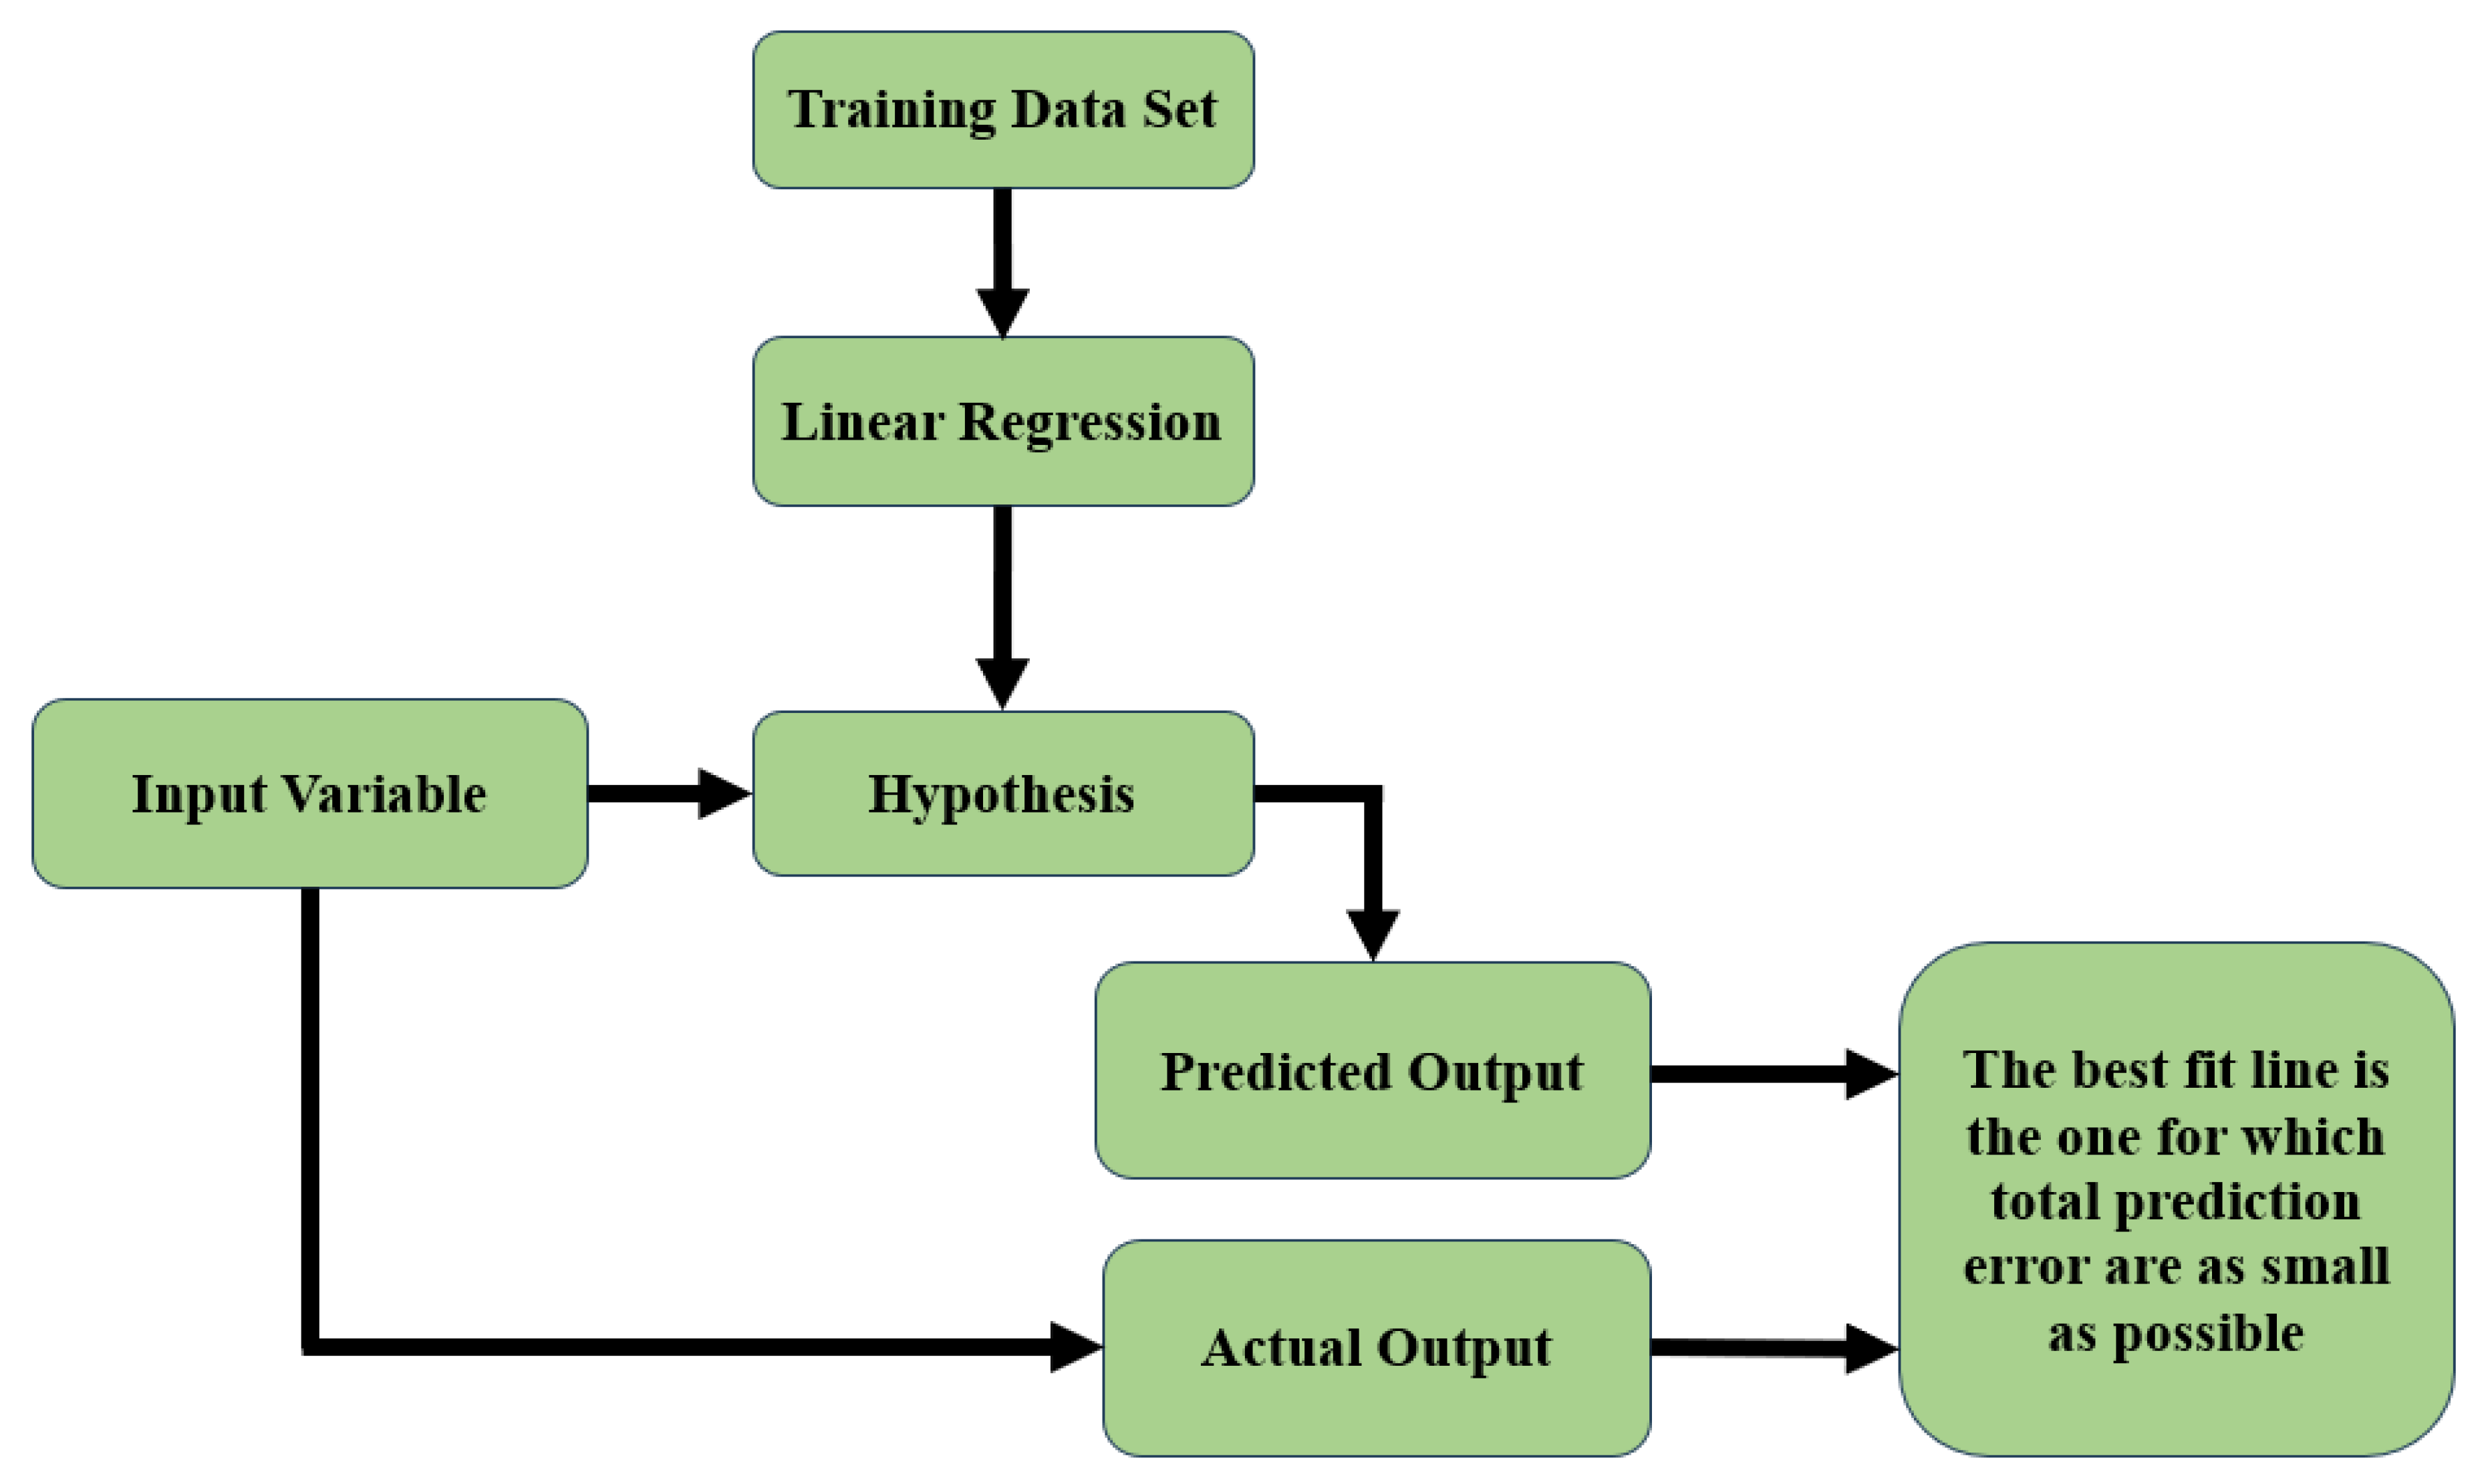
The execution time and simplicity for the hemoglobin (Hb) detection level in blood can be significantly accelerated through the integration of a machine learning model. Here, we implemented a linear regression model to efficiently estimate the hemoglobin concentration (gm/lit.) with respect to the corresponding refractive indices. The model enables us to predict Hb level between or outside the given data points. As the data show a linear trendline, this model is a better fit to predict the result accurately, and it also performs efficiently with small datasets. The overall process diagram for the model implementation is shown in Figure 6.
The flowchart in this figure illustrates how the linear regression model operates to predict hemoglobin (Hb) concentration based on analyte refractive index (RI). The process begins by collecting the input dataset from Table 2, which demonstrates the change in Hb concentration with blood refractive index. This input dataset is then trained to implement the desired model. Linear regression is applied during this step to find the relationship between RI and Hb concentration, creating a hypothesis that describes this relationship.
Once the model is trained, it generates a predicted output, which represents the estimated Hb concentration based on the given analyte RI. The predicted output is then compared with the actual output, which is the real measured Hb concentration from the dataset. The difference between these values is calculated, representing the error in the prediction.
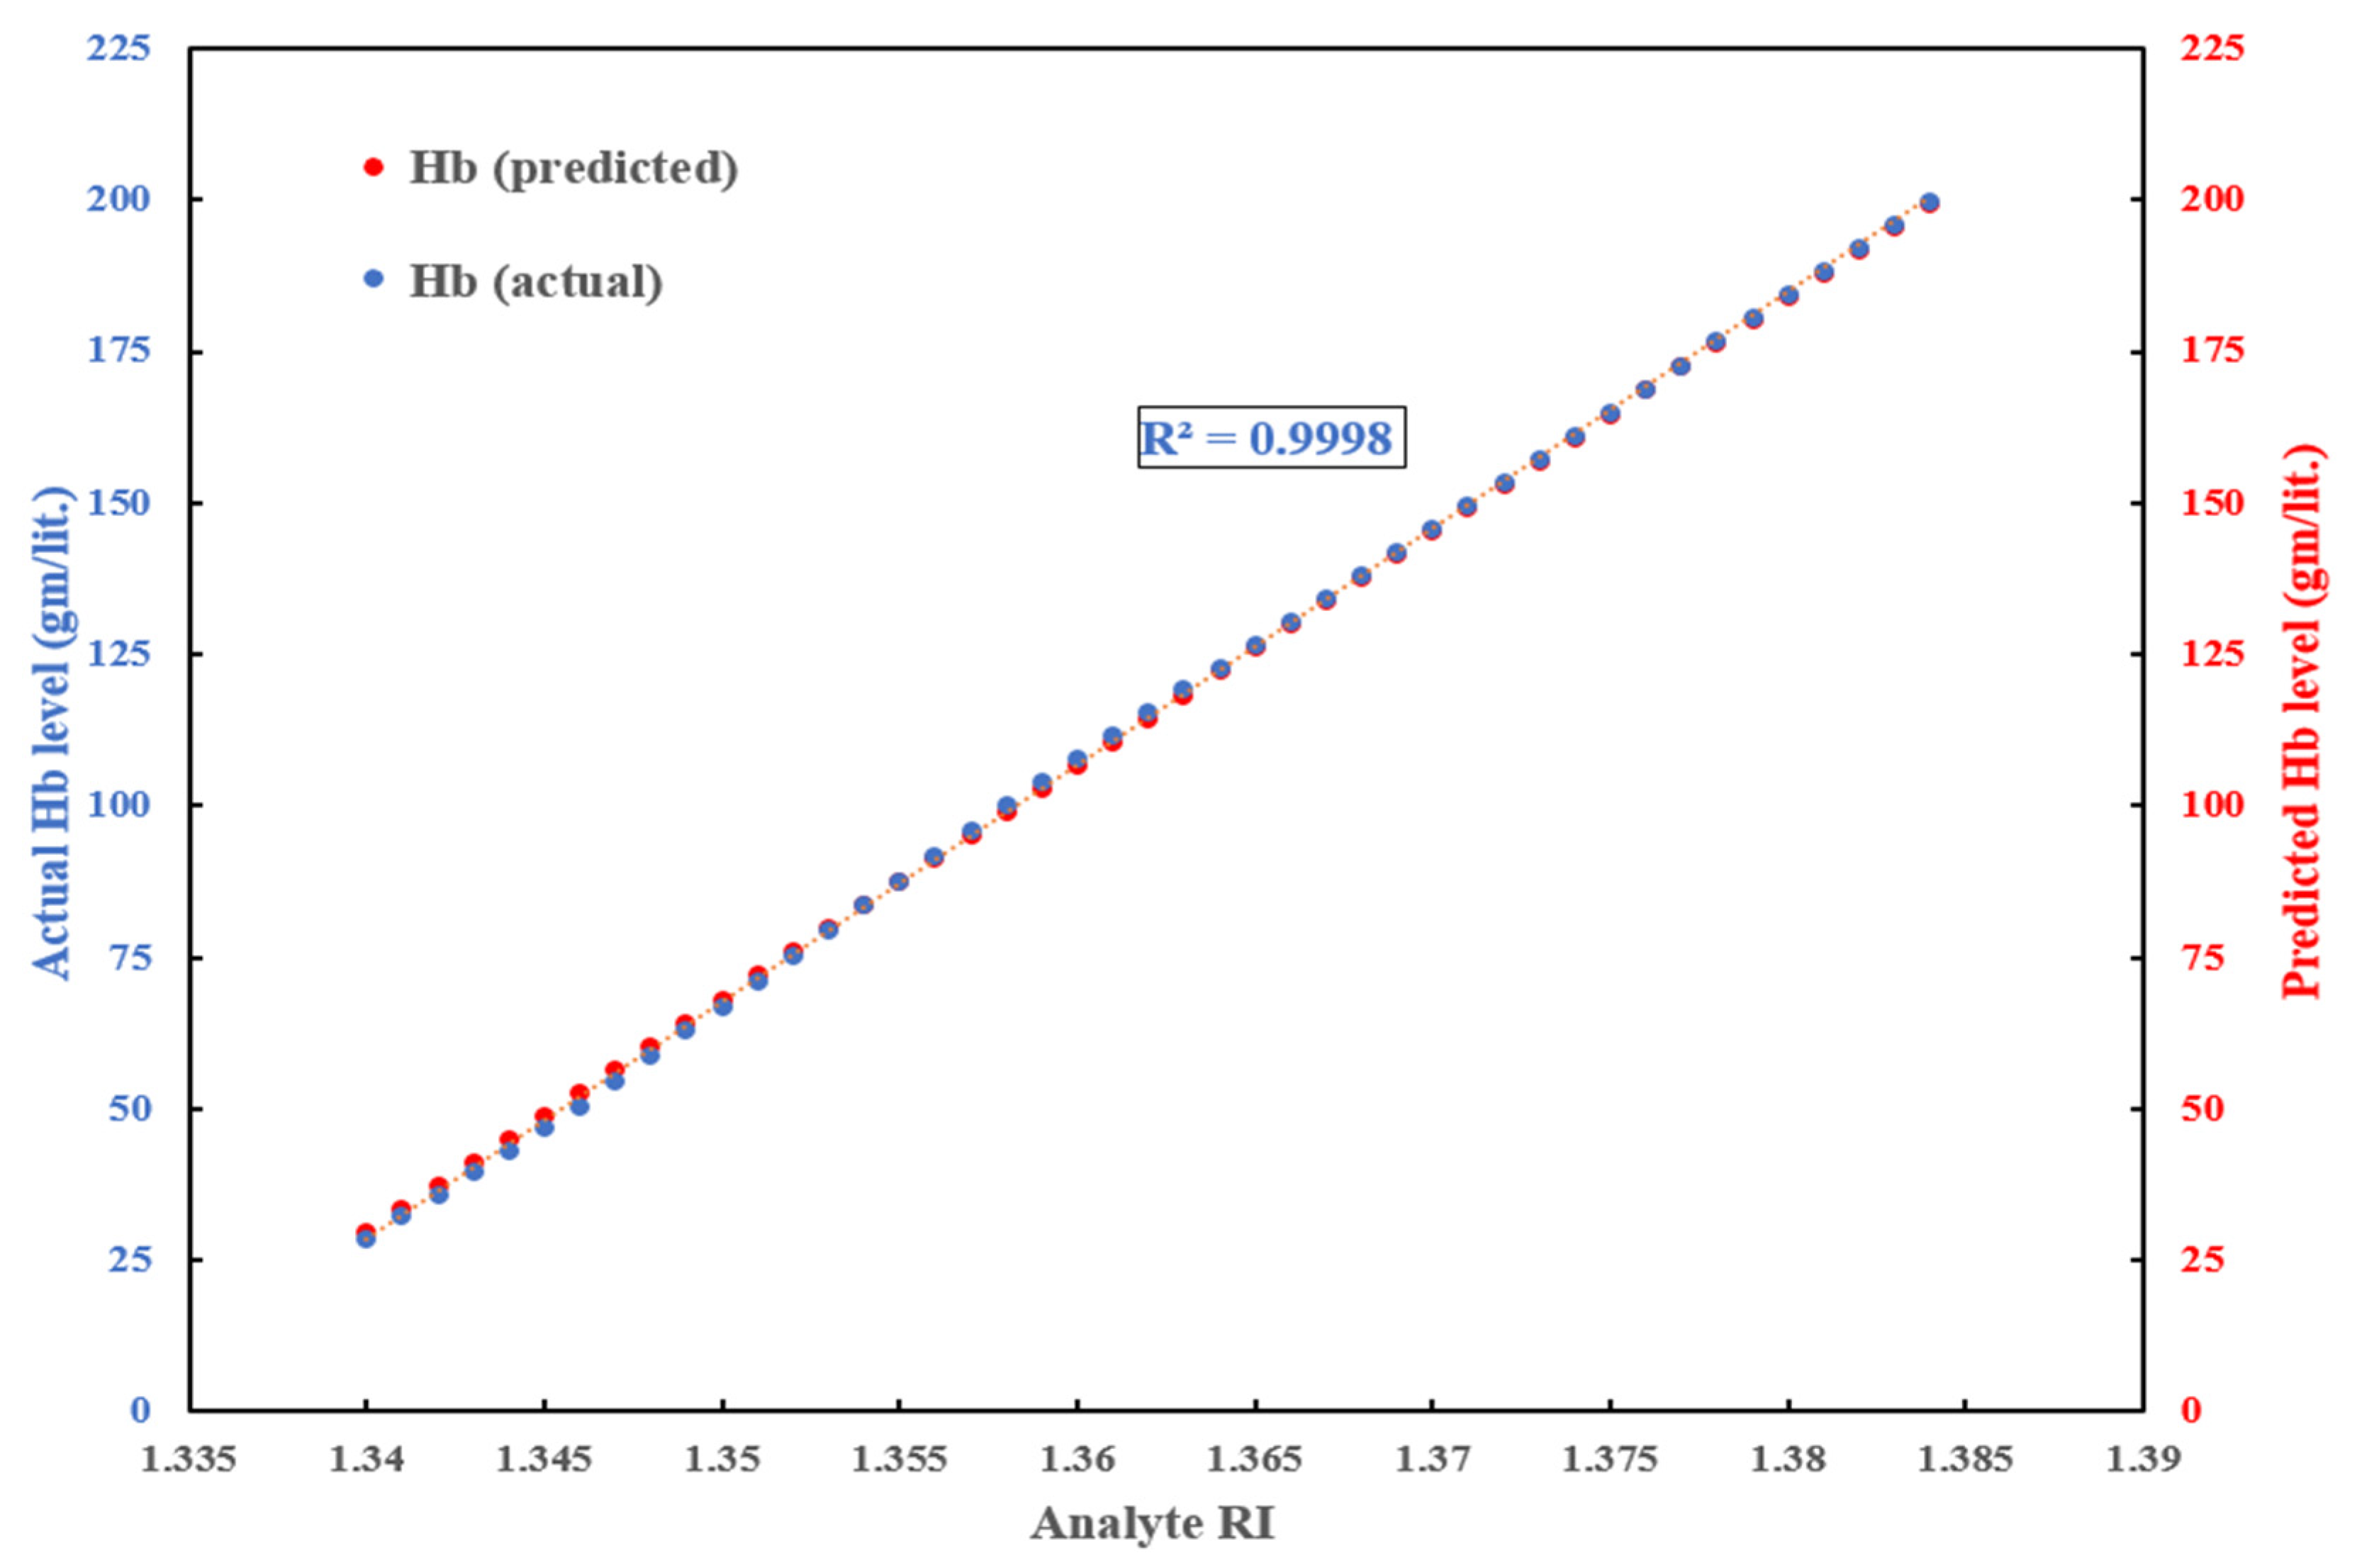
The actual concentration of hemoglobin was determined from the trendline shown in Figure 5a. Then, we used the machine learning model to predict the hemoglobin level corresponding to different refractive indices of the analyte. A comparison of the real values with the predicted ones with varying RIs is presented in Figure 7.
The objective of this approach is to determine the best-fit line that minimizes the total prediction error. It will ensure that the predicted Hb concentrations are as close as possible to the actual values for all data points. This line represents the optimal relationship between RI and Hb concentration, and allows the model to predict Hb levels for any given RI with minimal error. This step-by-step process allows for accurate prediction of hemoglobin levels based on analyte RI values, facilitating a reliable prediction model.
The limit of detection (LOD) of the proposed sensor is determined based on the smallest measurable change in hemoglobin concentration that corresponds to the smallest change in refractive index (RI). The LOD of our proposed sensor was calculated from the equation [51]:
LOD   =   Resolution × Hb   concentration RI
From the experimental data, the sensor can detect a minute change in Hb concentration of 0.0302 g/L. Also, the machine learning model can also assume this change accurately, which further validates the sensor’s sensitivity. Therefore, the LOD of the sensor is approximately 0.03 g/L, demonstrating its capability to detect minute changes in hemoglobin levels.
The mean absolute percentage error (MAPE) was calculated from Equation (8).
MAPE = 1 n   i = 1 n | x i - x i | x I    
where n is the number of observations, xi is a real value, and x i is the estimated value. The result demonstrates a low mean absolute percentage error equals about 1.183% which indicates an excellent precision in detecting the hemoglobin (Hb) concentration in blood. It is also noticeable that the machine learning model can also detect minor variations in the analyte RIs and demonstrates accurate results.
The mean squared error (MSE) was calculated from Equation (9).
M S E = 1 n   i = 1 n x i x i 2    
The result shows a low mean squared error of about 0.909, and the root mean square error (RMSE) is found to be approximately 0.953, which indicates that the model is accurate and reliable in making predictions to detect Hb levels in blood.

4. Optimization and Fabrication Tolerance Investigation

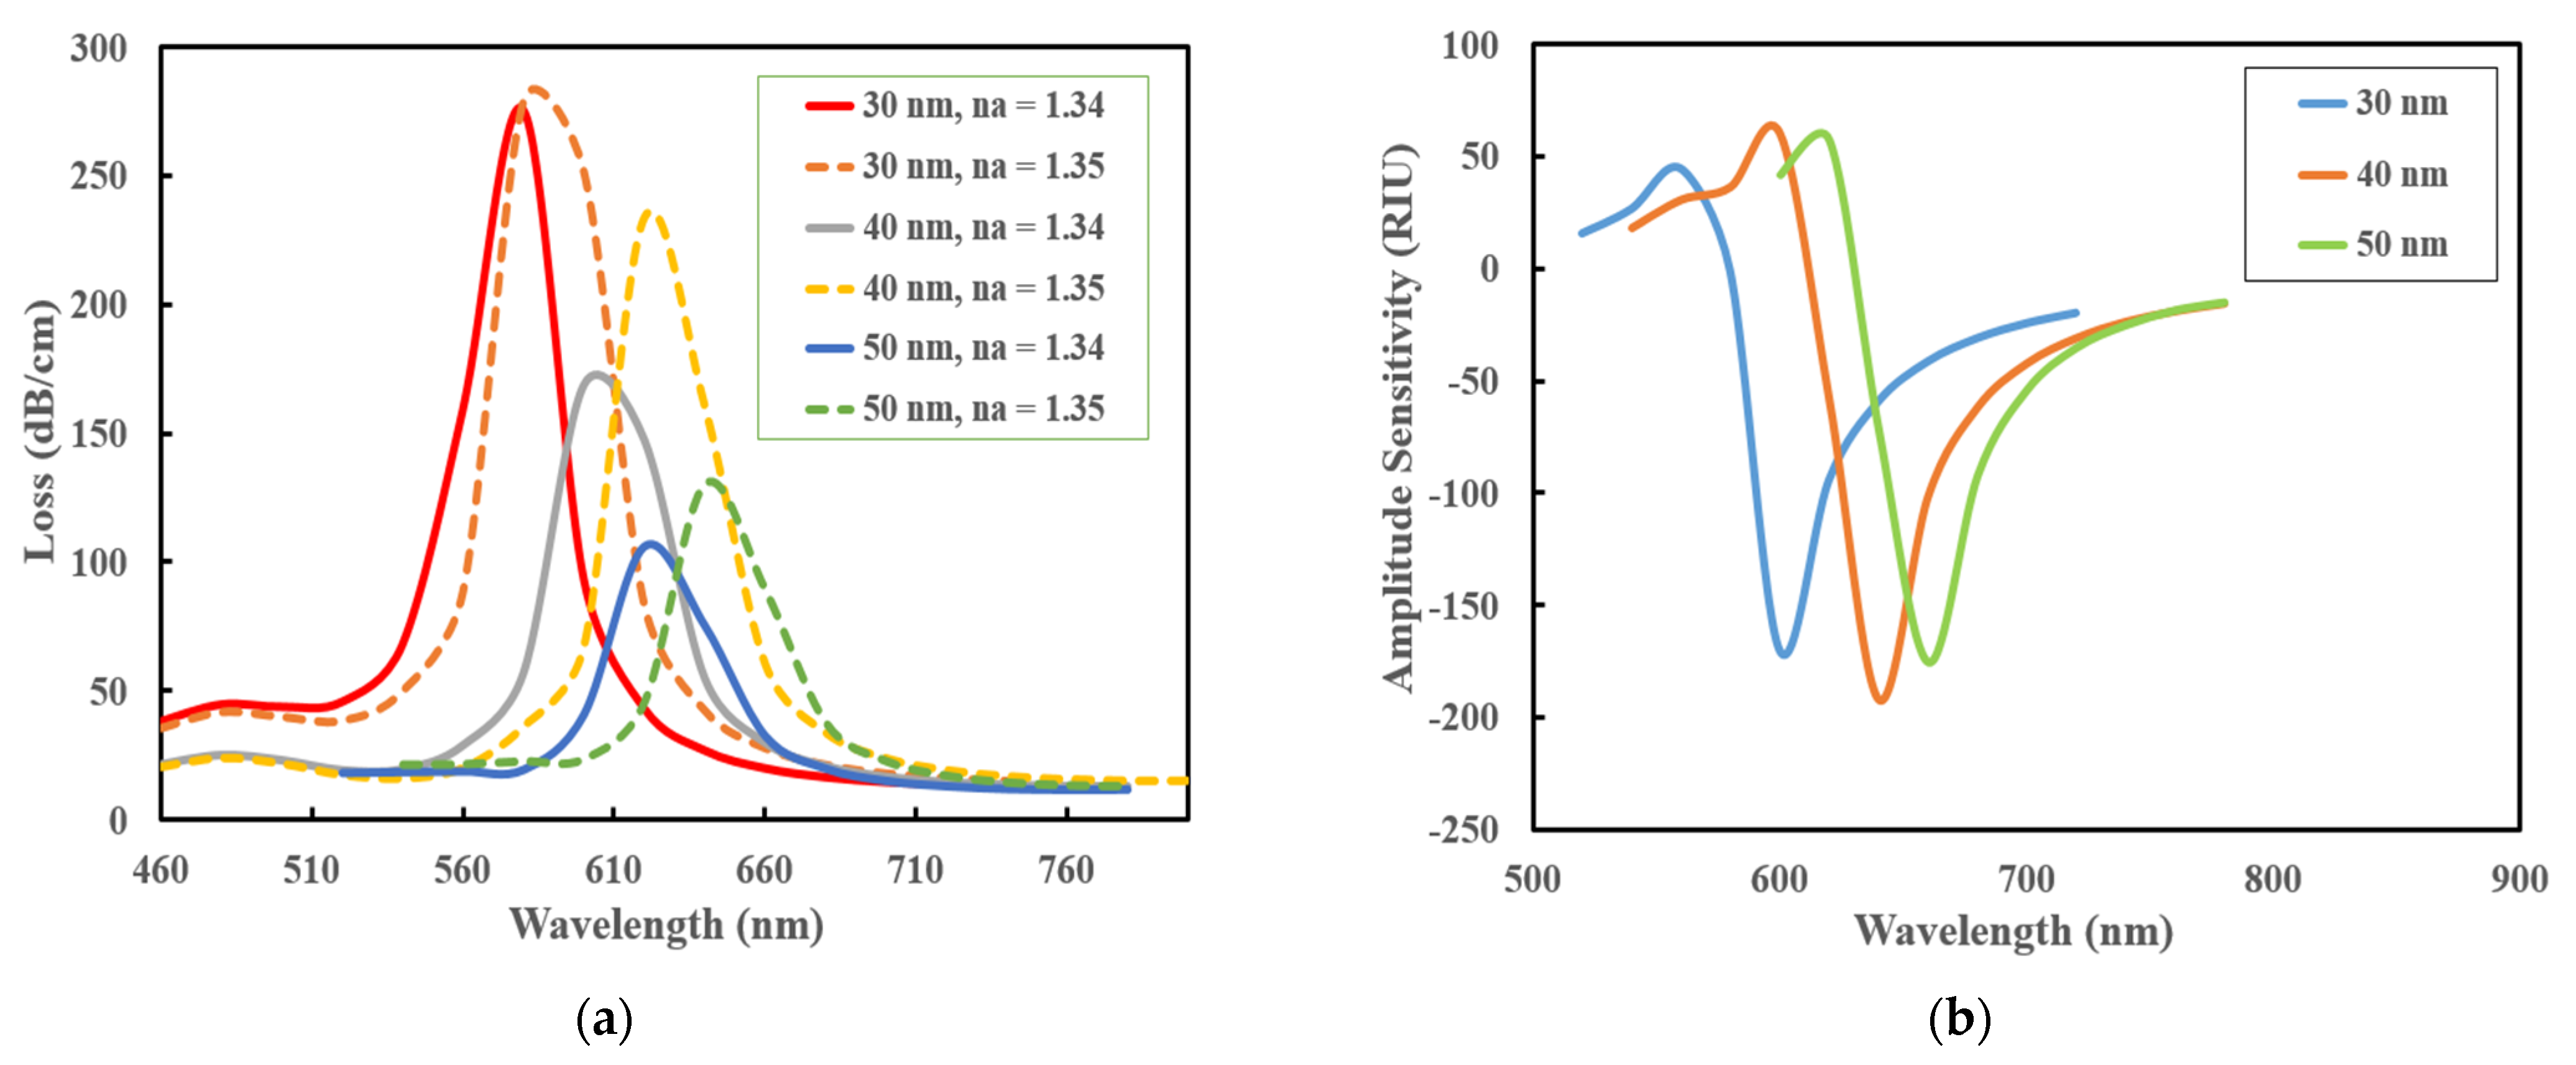
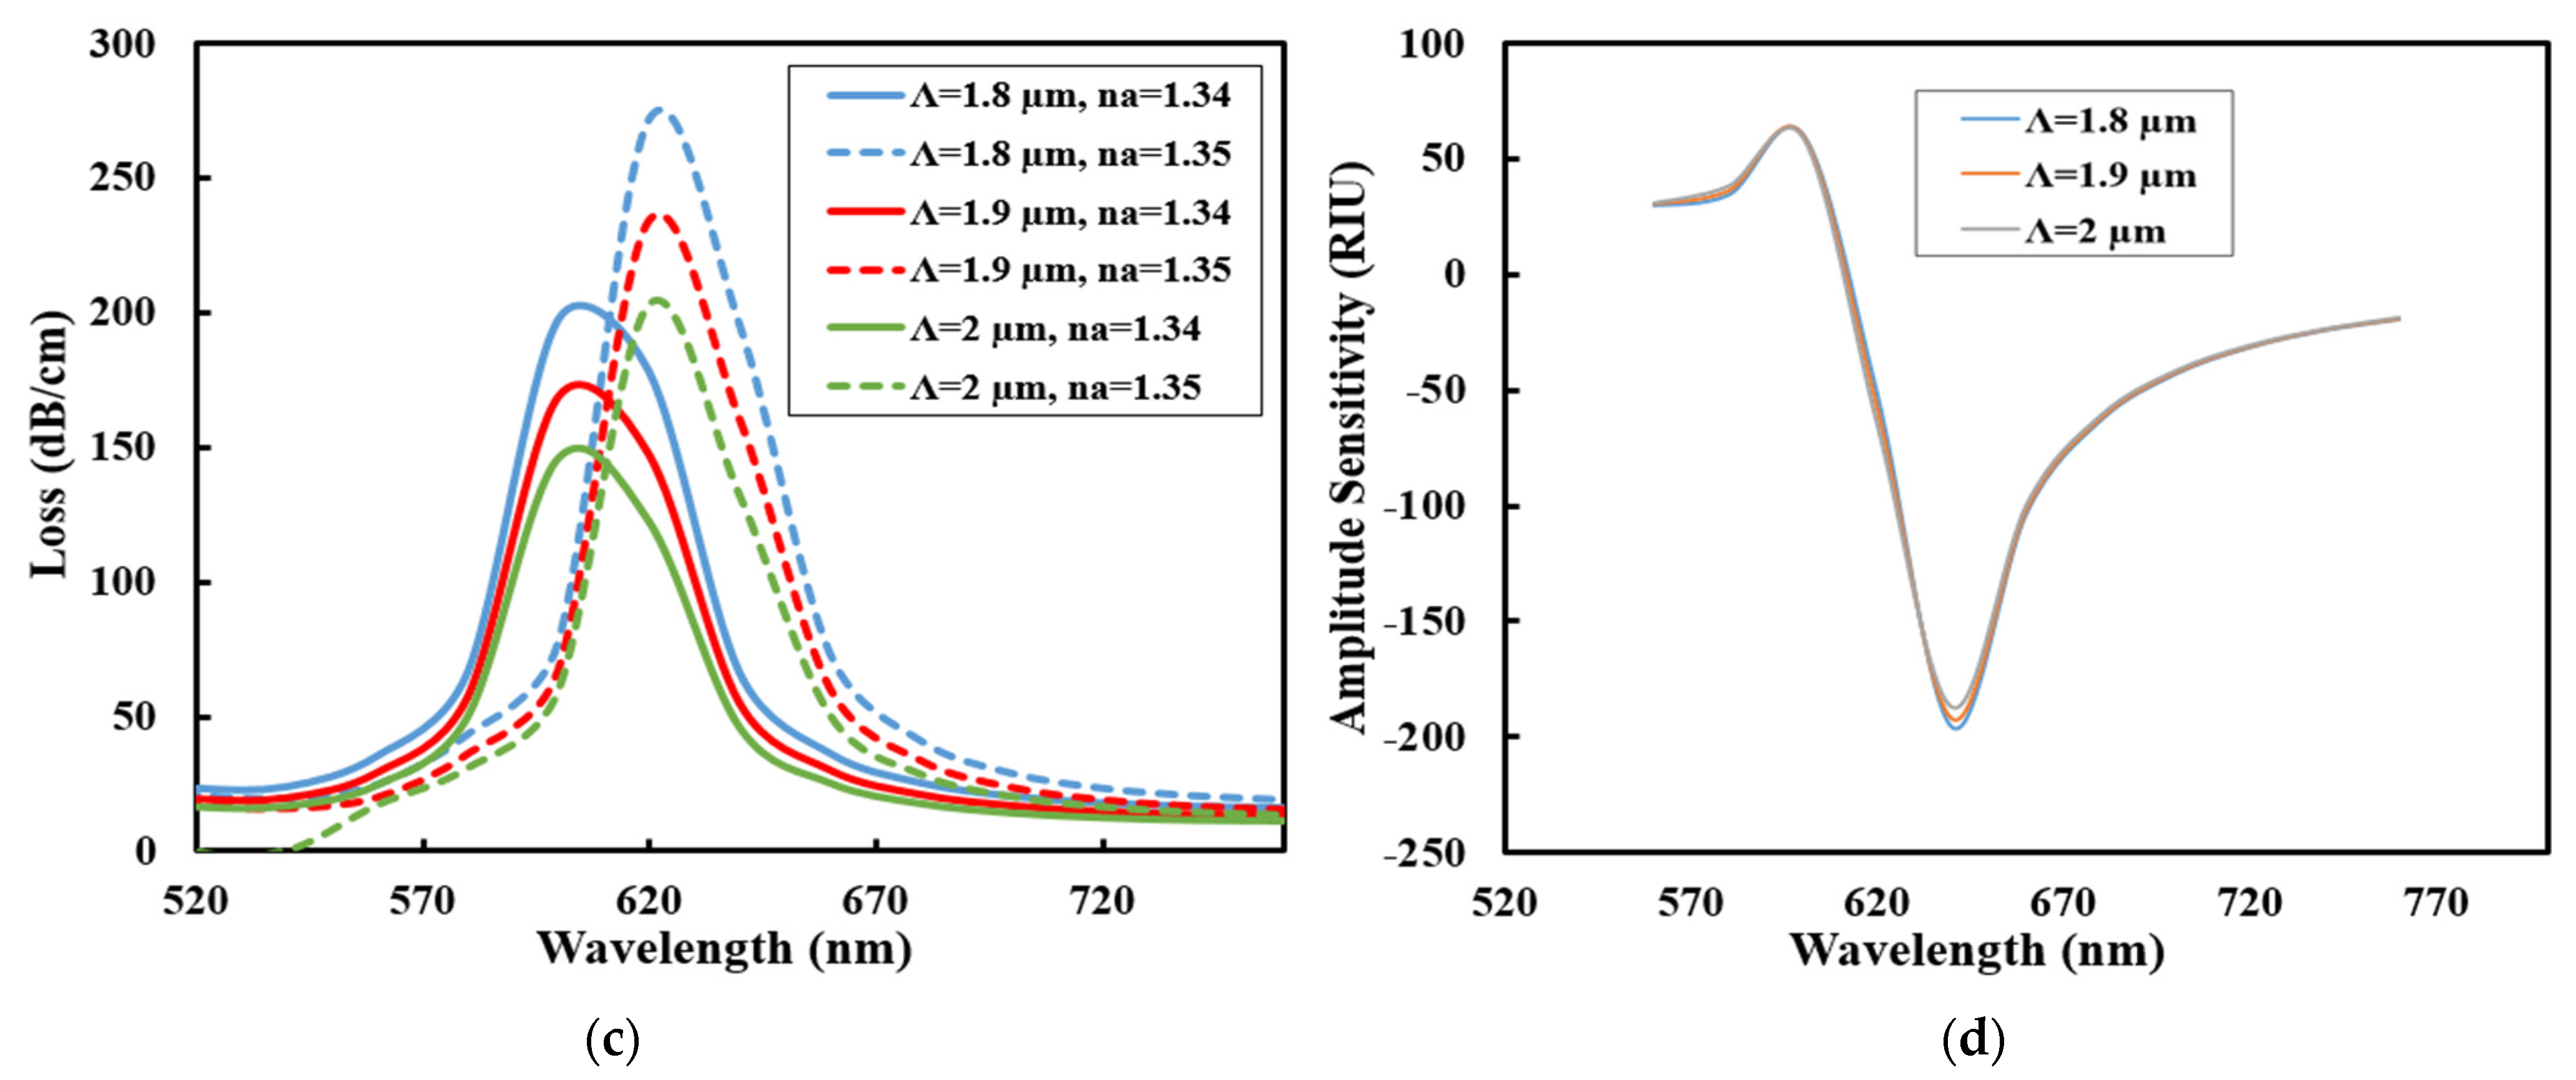
Figure 8a shows the optimization process of the gold layer thickness for your sensor, focusing on how different thicknesses (30, 40, and 50 nm) with two refractive indices (RI = 1.34, RI = 1.35) impact the confinement loss within a span of wavelengths. The plot illustrates that varying the gold layer thickness significantly affects the loss spectrum. For instance, thinner layers (30 nm) result in higher peak losses, especially at lower refractive indices (RI = 1.34), while thicker layers (50 nm) show a more balanced loss across the spectrum. Additionally, increasing the refractive index (from RI = 1.34 to RI = 1.35) shifts the peak confinement loss to higher wavelengths, with a broader loss curve.
Wavelength declines due to intense attenuation of the electric field in the metallic surface, resulting in a significant change in the sensor performance and affecting both wavelength and amplitude sensitivity. Figure 8b further illustrates how amplitude sensitivity varies across different gold layer thicknesses. The amplitude sensitivities for various gold layer thicknesses are about 170.3 RIU−1, 192 RIU−1 and 175.6 RIU−1, respectively. Therefore, this analysis indicates that the ideal thickness of the gold layer which maximizes the amplitude sensitivity is exactly 40 nm, as it also achieves a significant amount of field confinement.
Figure 8c,d show how variations in pitch affect the sensor’s performance, focusing on confinement loss and amplitude sensitivity. Figure 8c illustrates the confinement loss for a pitch size (Ʌ) of 1.8 µm, 1.9 µm, and 2 µm with analyte RIs of 1.34 and 1.35. Figure 8d shows the variation in amplitude sensitivity with respect to pitch. The amplitude sensitivity was reduced with increasing the value of pitch. The maximum amplitude sensitivity was found when the pitch was 1.8 µm. Therefore, this was chosen as the optimum pitch size for our sensor.
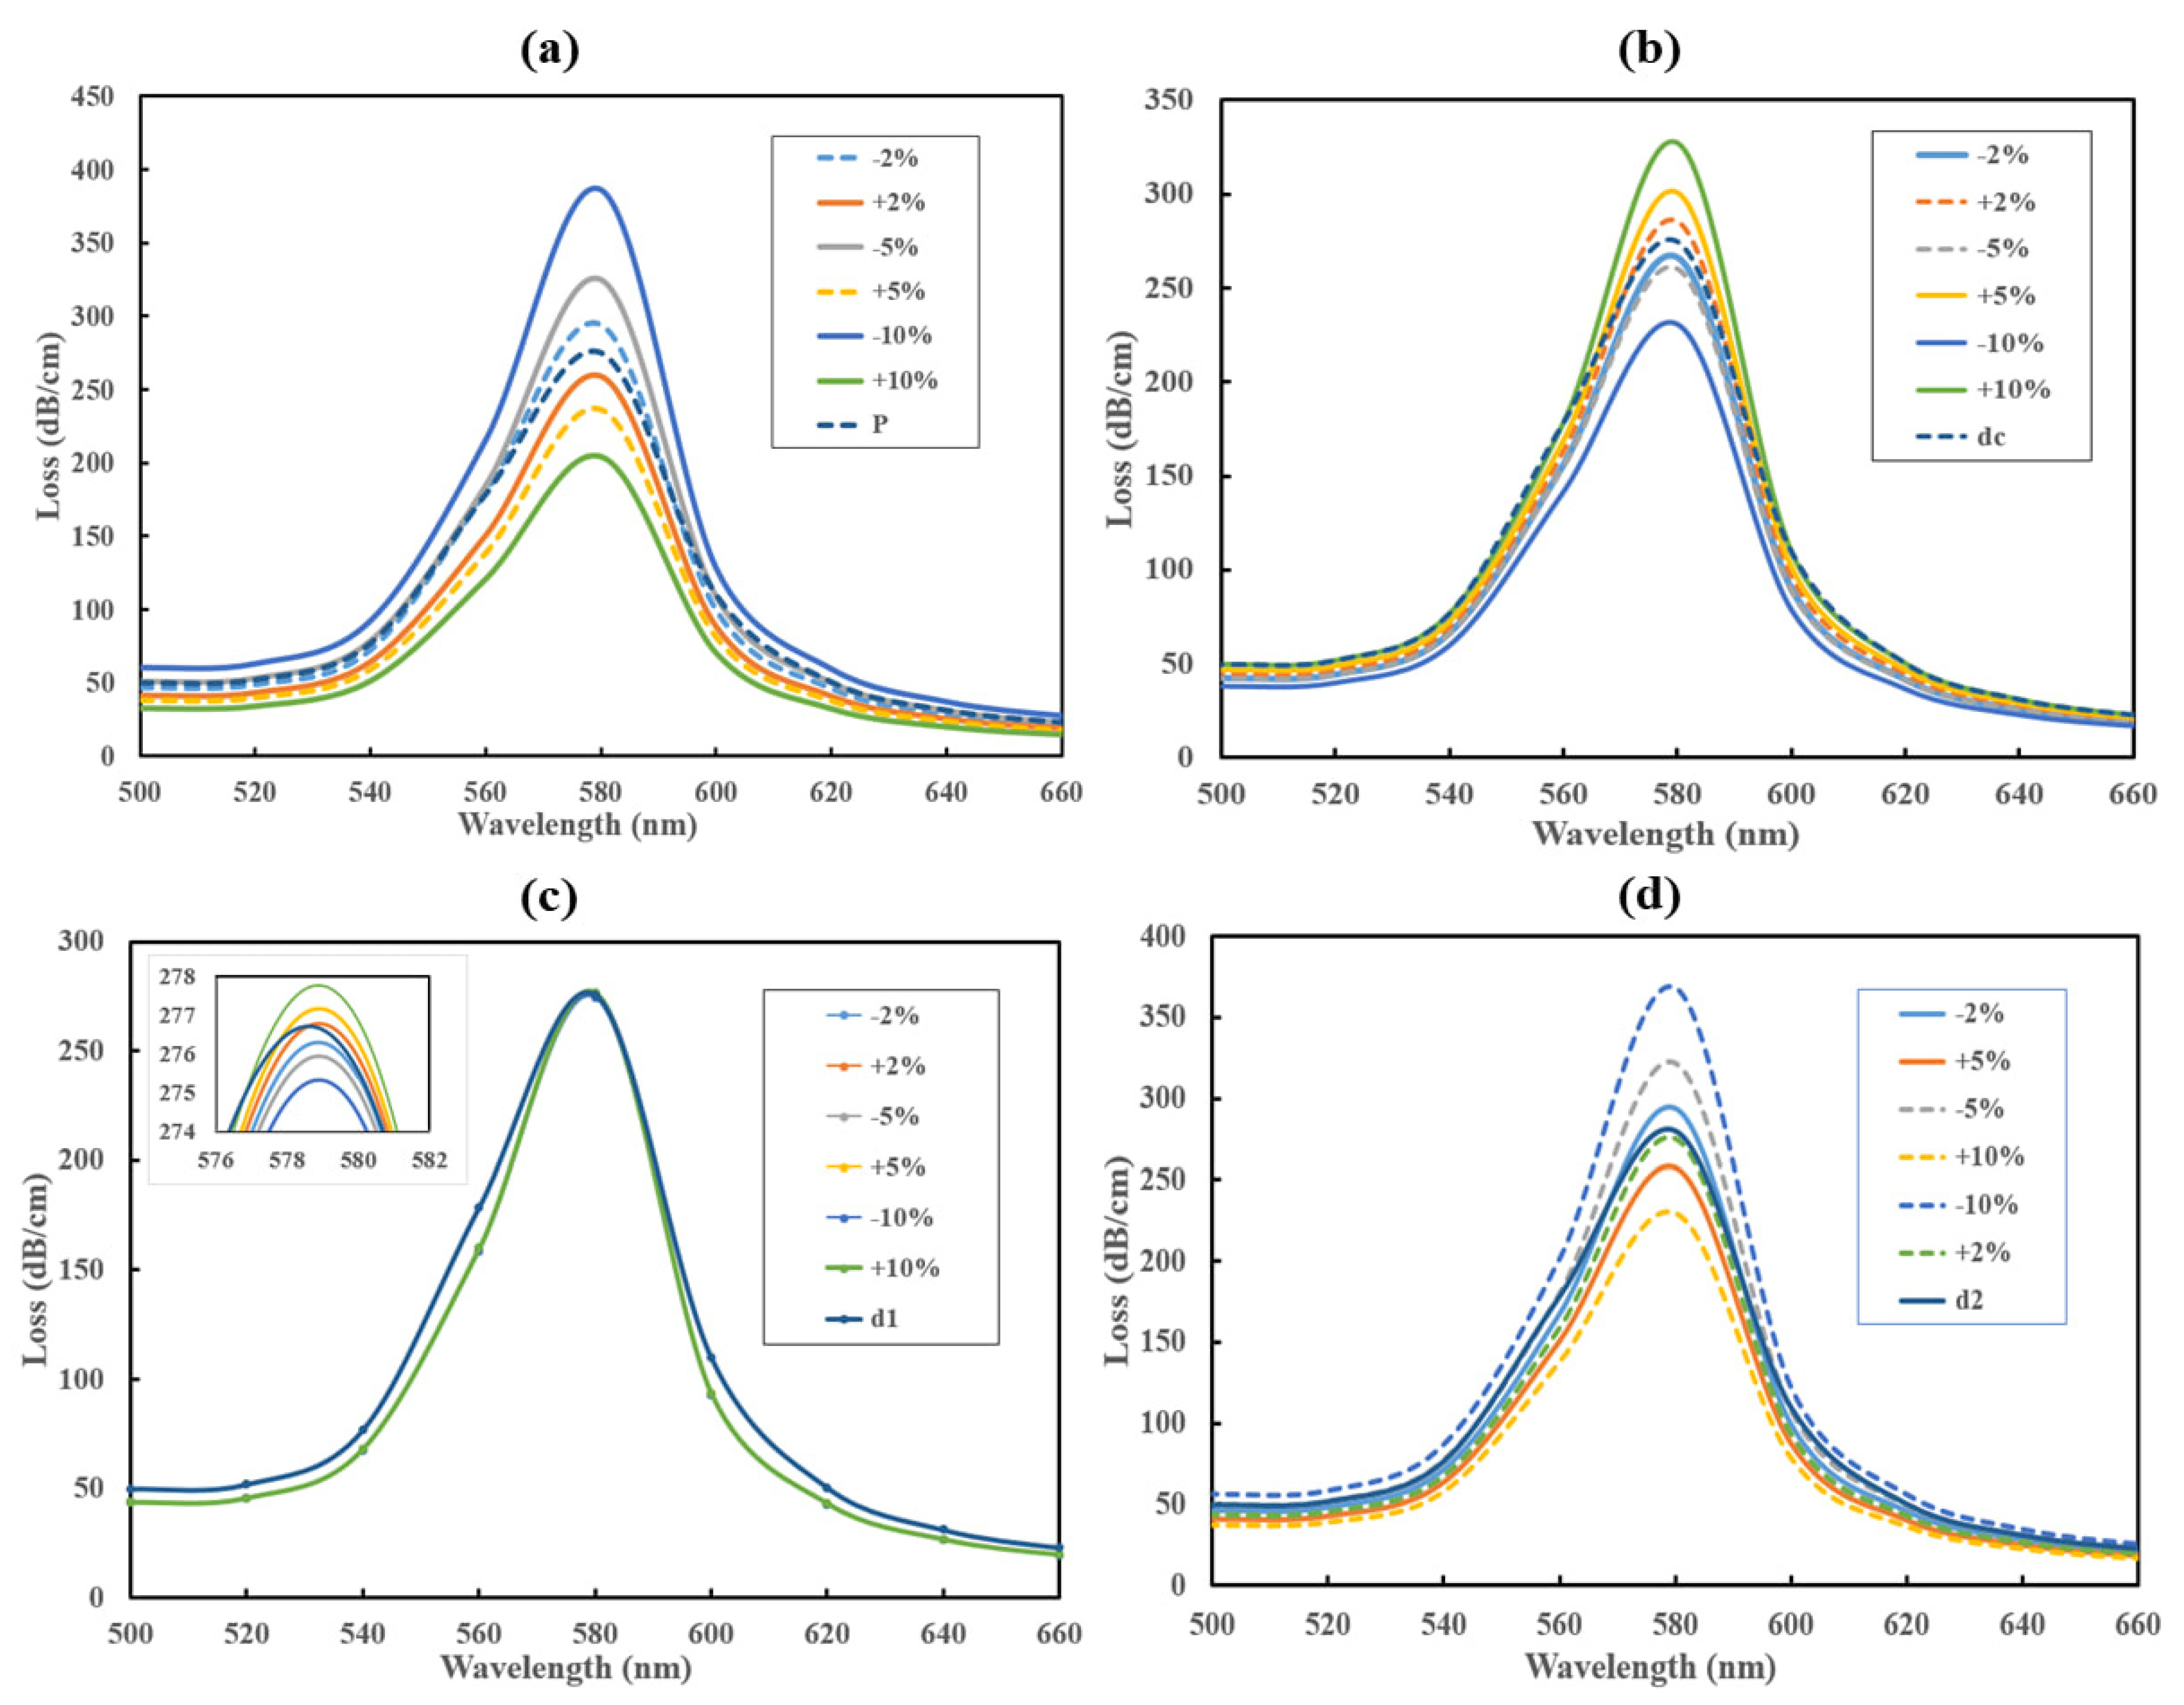
To enhance the sensor’s performance and evaluate permissible fabrication tolerances, all dimensional factors of the proposed sensor were analyzed to find its operational optimality. The sensor structure was assessed for measuring the fabrication tolerances up to ±10% which is presented in Figure 9. The resonant wavelength remains unchanged despite adjustments in factors such as the pitch size and diameters of air holes. Figure 9a reveals that the resonant wavelength (RW) does not shift with pitch variations up to ±10%. However, there are some changes in the maximum confinement loss, as a smaller pitch size leads to an increasing confinement loss. On the contrary, when pitch size is increased, it causes the confinement loss to decline in response to the larger distance between the center of the photonic crystal fiber (PCF) and the plasmonic layer. Figure 9b also demonstrates no shift in the resonant wavelength but a small change in confinement loss with the variations in diameter of the center air hole (dc). When the diameter increases, the peak confinement loss also increases and vice versa. From Figure 9c, it is evident that changing the diameter of big air holes (d1) barely has any impact on resonant wavelengths and peak confinement loss. Finally, Figure 9d represents how the loss curve behaves in accordance with variations in the small air hole diameter (d2). Here, lower values of diameter lead to more confinement loss, while the higher diameter causes the loss to decline. Conversely, the resonant wavelength stays the same throughout the adjustments in diameter. So, the anticipated levels of fabrication defects will not have substantial impacts on the overall sensor functionality and detection performance.
Table 5 compares the performance of the proposed dual-polished dual-core sensor with previously designed sensors based on different structural models. Key parameters such as refractive index (RI) range, sensitivity (Sλ), amplitude sensitivity (SA), and figure of merit (FOM) are listed for each model. The proposed sensor demonstrates a sensitivity of 74,000 nm/RIU and amplitude sensitivity of 734 RIU−1, showing superior performance compared to existing designs. Additionally, we have compared our sensor with existing hemoglobin sensors, and our results show a significantly improved performance, further highlighting the effectiveness of our sensor in this application.
The sensor features a dual-polished dual-core structure, which significantly enhances amplitude sensitivity. As the analyte is placed on the dual-polished surface, the distance between the core and the analyte becomes smaller, allowing the core-guided modes to interact more closely with the analyte. The dual-polished structure’s strong plasmon-core interaction and increased field overlap lead to the notable wavelength sensitivity (~74,000 nm/RIU). More noticeable resonance shifts result from the reduced gold area’s enhancement of plasmon confinement at the analyte interface and reduction in propagation loss. Conventional circular structures, on the other hand, limit the interaction by positioning the analyte further away from the core. Thus, by optimizing the interaction between the light and the analyte, the suggested sensor exhibits superior performance.

5. Conclusions

This study’s suggested PCF-based dual-polished SPR sensor shows a sophisticated and incredibly effective design for a variety of biosensing applications. Since gold is a plasmonic material that guarantees both chemical stability and effective energy transfer, it is suitable for real-time sensing. The sensor demonstrates a peak wavelength sensitivity of 74,000 nm/RIU and amplitude sensitivity of about 694 RIU−1 with a FOM value of around 667, which makes it compatible with the existing designs. In addition, the reduced gold layer usage and fewer air holes make it an effective and cost-efficient device. Hemoglobin concentration measurement is another key aspect of this analysis, which plays a vital role in the detection of health problems like COPD, where the Hb concentration changes with respect to blood RI. As our sensor can operate in a wide RI range for 1.31 to 1.42, it can effectively track the minor changes in the analyte sample. We have also developed a machine learning model using a linear regression approach that enables us to detect any concentration level of Hb from corresponding RI values and compared the obtained values with the actual ones. Moreover, this work is not only open to the ground of COPD but also opens the scope for upcoming medical sensing and monitoring, where there is a need for more accuracy and fast, low-cost detection. Future research may extend the present single-resonance design by introducing multiple plasmonic regions tuned to distinct resonance wavelengths. Such multi-wavelength configurations could enable simultaneous or extended-range hemoglobin detection, as well as multi-parameter biosensing, while maintaining compactness within the same PCF platform.

Author Contributions

Conceptualization, A.A., A.C. (Anik Chowdhury), A.F.M. and M.I.R.; Data curation, A.C. (Anik Chowdhury) and A.F.M.; Formal analysis, A.A., A.C. (Anik Chowdhury), A.C. (Aditta Chowdhury), A.F.M. and M.I.R.; Investigation, A.A., A.C. (Anik Chowdhury), A.C. (Aditta Chowdhury), M.A.H. and A.F.M.; Methodology, A.A. and A.C. (Anik Chowdhury); Project administration, M.I.R.; Resources, M.I.R.; Software, A.A., A.C. (Anik Chowdhury), M.A.H. and M.I.R.; Supervision, M.I.R.; Validation, A.A., A.C. (Anik Chowdhury), A.C. (Aditta Chowdhury), M.A.H. and A.F.M.; Writing—original draft, A.A. and A.C. (Anik Chowdhury); Writing—review and editing, A.C. (Aditta Chowdhury), M.A.H., A.F.M. and M.I.R. All authors have read and agreed to the published version of the manuscript.

Funding

This research received no external funding.

Data Availability Statement

The original contributions presented in this study are included in the article. Further inquiries can be directed to the corresponding author.

Conflicts of Interest

Abu Farzan Mitul was employed by the company Leidos. The remaining authors declare that the research was conducted in the absence of any commercial or financial relationships that could be construed as a potential conflict of interest.

References

  1. Homola, J. Present and future of surface plasmon resonance biosensors. Anal. Bioanal. Chem. 2003, 377, 528–539. [Google Scholar] [CrossRef]
  2. Ahmed, T.; Haider, F.; Aoni, R.A.; Ahmed, R. Highly sensitive U-shaped micro-channel photonic crystal fiber-based plasmonic biosensor. Plasmonics 2021, 16, 2215–2223. [Google Scholar] [CrossRef]
  3. Vasimalla, Y.; Singh, L. Design and analysis of planar waveguide-based SPR sensor for formalin detection using Ag-Chloride-BP structure. IEEE Trans. Nanobiosci. 2022, 22, 365–374. [Google Scholar] [CrossRef]
  4. Hossain, B.; Paul, A.K.; Islam, A.; Hossain, F.; Rahman, M. Design and analysis of highly sensitive prism-based surface plasmon resonance optical salinity sensor. Results Opt. 2022, 7, 100217. [Google Scholar] [CrossRef]
  5. Hassani, A.; Skorobogatiy, M. Design criteria for microstructured-optical-fiber-based surface-plasmon-resonance sensors. J. Opt. Soc. Am. B 2007, 24, 1423–1429. [Google Scholar] [CrossRef]
  6. Wang, Q.; Ren, Z.-H.; Zhao, W.-M.; Wang, L.; Yan, X.; Zhu, A.-S.; Qiu, F.-M.; Zhang, K.-K. Research advances on surface plasmon resonance biosensors. Nanoscale 2022, 14, 564–591. [Google Scholar] [CrossRef]
  7. Maleki, M.J.; Soroosh, M.; Al-Shammri, F.K.; Alkhayer, A.G.; Mondal, H. Design and simulation of a compact subwavelength graphene-based switch for surface plasmon polariton transmission in integrated optoelectronic circuits. Plasmonics 2025, 20, 3605–3617. [Google Scholar] [CrossRef]
  8. Kaur, V.; Singh, S. A dual-channel surface plasmon resonance biosensor based on a photonic crystal fiber for multianalyte sensing. J. Comput. Electron. 2019, 18, 319–328. [Google Scholar] [CrossRef]
  9. Yasli, A.; Ademgil, H.; Haxha, S.; Aggoun, A. Multi-channel photonic crystal fiber-based surface plasmon resonance sensor for multi-analyte sensing. IEEE Photonics J. 2020, 12, 6800515. [Google Scholar] [CrossRef]
  10. Kumar, B.M.H.; Vaibhav, A.; Srikanth, P.C. Si/SiO2 based nano-cavity biosensor for detection of anemia, HIV and cholesterol using refractive index of blood sample. Indian J. Sci. Technol. 2022, 15, 899–907. [Google Scholar] [CrossRef]
  11. Sharma, S.; Singh, M.; Tewari, R.K.; Kumar, A. A biosensor for the detection of anemia using metal Ag and defect multilayer photonic crystal. Plasmonics 2024, 19, 1463–1473. [Google Scholar] [CrossRef]
  12. Karki, B.; Vasudevan, B.; Uniyal, A.; Pal, A.; Srivastava, V. Hemoglobin detection in blood samples using a graphene-based surface plasmon resonance biosensor. Optik 2022, 270, 169947. [Google Scholar] [CrossRef]
  13. Rafiee, E. Diabetes and anemia prognosis by 2-D photonic crystal biosensor. Braz. J. Phys. 2025, 55, 73. [Google Scholar] [CrossRef]
  14. Shoshi, M.S.; Huraiya, A.; R, V.R.; Jawad, A.; Kong, C.Y.; Tabata, H.; Ramaraj, S.G.; Razzak, S.A. Revolutionary barium titanate-BlueP/TMDCs SPR sensor: Ultra-sensitive detection of urine glucose levels. Talanta Open 2025, 11, 100401. [Google Scholar] [CrossRef]
  15. Huraiya, A.; Ramaraj, S.G.; Hossain, S.M.S.; Chakrabarti, K.; Tabata, H.; Razzak, S.M.A. A highly optimized and sensitive bowtie shape-based SPR biosensor for different analyte detection. Nanoscale Adv. 2025, 7, 899–908. [Google Scholar] [CrossRef]
  16. Ashrafian, M.; Olyaee, S.; Seifouri, M. Highly sensitive cancer detection using an open D-channel PCF-based SPR biosensor. Sci. Rep. 2025, 15, 10168. [Google Scholar] [CrossRef] [PubMed]
  17. Hoque, A.M.T.; Islam, A.; Haider, F.; Aoni, R.A.; Ahmed, R. Point-of-care testing of hyponatremia and hypernatremia levels: An optoplasmonic biosensing approach. PLoS ONE 2025, 20, e0319559. [Google Scholar] [CrossRef] [PubMed]
  18. Islam, A.; Haider, F.; Aoni, R.A.; Ahmed, R. Plasmonic photonic biosensor: In situ detection and quantification of SARS-CoV-2 particles. Opt. Express 2022, 30, 40277–40291. [Google Scholar] [CrossRef]
  19. Jain, S.; Choudhary, K.; Kumar, A.; Marques, C.; Kumar, S. PCF-based plasmonic sensor for the detection of cervical and skin cancer cells. Results Opt. 2024, 14, 100589. [Google Scholar] [CrossRef]
  20. Islam, A.; Haider, F.; Aoni, R.A.; Hossen, M.; Begum, F.; Ahmed, R. U-grooved dual-channel plasmonic sensor for simultaneous multi-analyte detection. J. Opt. Soc. Am. B 2021, 38, 3055–3063. [Google Scholar] [CrossRef]
  21. Das, A.; Huraiya, A.; R, V.R.; Tabata, H.; Ramaraj, S.G. Ultra-sensitive refractive index detection with gold-coated PCF-based SPR sensor. Talanta Open 2024, 10, 100384. [Google Scholar] [CrossRef]
  22. Huraiya, A.; Razzak, S.M.A.; Tabata, H.; Ramaraj, S.G. New approach for a highly sensitive V-shaped SPR biosensor for a wide range of analyte RI detection. J. Phys. Chem. C 2024, 128, 15117–15123. [Google Scholar] [CrossRef]
  23. Ahmed, T.; Paul, A.K.; Anower, S.; Razzak, S.M.A. Surface plasmon resonance biosensor based on hexagonal lattice dual-core photonic crystal fiber. Appl. Opt. 2019, 58, 8416–8422. [Google Scholar] [CrossRef]
  24. Khatun, M.R.; Islam, M.S. Design optimization of high-sensitivity PCF-SPR biosensor using machine learning and explainable AI. PLoS ONE 2025, 20, e0330944. [Google Scholar] [CrossRef]
  25. Divya, J.; Selvendran, S.; Itapu, S.; Borra, V. A novel dual-channel SPR-based PCF biosensor for simultaneous tuberculosis and urinary tract infection diagnosis toward SDG3. IEEE Access 2024, 12, 85484–85498. [Google Scholar] [CrossRef]
  26. Ehyaee, A.; Mohammadi, M.; Seifouri, M.; Olyaee, S. Design and numerical investigation of a dual-core photonic crystal fiber refractive index sensor for cancer cells detection. Eur. Phys. J. Plus 2023, 138, 129. [Google Scholar] [CrossRef]
  27. Mostufa, S.; Paul, A.K.; Chakrabarti, K. Detection of hemoglobin in blood and urine glucose level samples using a graphene-coated SPR based biosensor. OSA Contin. 2021, 4, 2164–2176. [Google Scholar] [CrossRef]
  28. Lee, H.; Hwang, S.; Kong, H.J.; Hong, K.H.; Yu, T.J. Simultaneous measurement of group refractive index dispersion and thickness of fused silica using a scanning white light interferometer. Sensors 2023, 24, 17. [Google Scholar] [CrossRef]
  29. Milam, D. Review and assessment of measured values of the nonlinear refractive-index coefficient of fused silica. Appl. Opt. 1998, 37, 546–550. [Google Scholar] [CrossRef]
  30. Sharma, P.; Sharan, P. Design of photonic crystal-based biosensor for detection of glucose concentration in urine. IEEE Sens. J. 2015, 15, 1035–1042. [Google Scholar] [CrossRef]
  31. Yajima, T.; Yamamoto, J.; Ishii, F.; Hirooka, T.; Yoshida, M.; Nakazawa, M. Low-loss photonic crystal fiber fabricated by a slurry casting method. Opt. Express 2013, 21, 30500–30506. [Google Scholar] [CrossRef] [PubMed]
  32. Boehm, J.; François, A.; Ebendorff-Heidepriem, H.; Monro, T.M. Chemical deposition of silver for the fabrication of surface plasmon microstructured optical fibre sensors. Plasmonics 2011, 6, 133–136. [Google Scholar] [CrossRef]
  33. Singhal, A.; Dalmiya, A.; Lynch, P.T.; Paprotny, I. 2-photon polymerized IP-DIP 3D photonic crystals for Mid IR spectroscopic applications. IEEE Photonics Technol. Lett. 2023, 35, 410–413. [Google Scholar] [CrossRef]
  34. Bunea, A.-I.; del Castillo Iniesta, N.; Droumpali, A.; Wetzel, A.E.; Engay, E.; Taboryski, R. Micro 3D printing by two-photon polymerization: Configurations and parameters for the Nanoscribe system. Micro 2021, 1, 164–180. [Google Scholar] [CrossRef]
  35. Wdowiak, E.; Ziemczonok, M.; Martinez-Carranza, J.; Kuś, A. Phase-assisted multi-material two-photon polymerization for extended refractive index range. Addit. Manuf. 2023, 73, 103666. [Google Scholar] [CrossRef]
  36. Dash, J.N.; Jha, R. SPR biosensor based on polymer PCF coated with conducting metal oxide. IEEE Photonics Technol. Lett. 2014, 26, 595–598. [Google Scholar] [CrossRef]
  37. Ma, A.; Li, Y.; Zhang, X. Coupled mode theory for surface plasmon polariton waveguides. Plasmonics 2013, 8, 769–777. [Google Scholar] [CrossRef]
  38. Peng, Y.; Zhao, Y.; Hu, X.G.; Yang, Y. Optical fiber quantum biosensor based on surface plasmon polaritons for the label-free measurement of protein. Sens. Actuators B Chem. 2020, 316, 128097. [Google Scholar] [CrossRef]
  39. Liu, C.; Yang, L.; Lu, X.; Liu, Q.; Wang, F.; Lv, J.; Chu, P.K. Mid-infrared surface plasmon resonance sensor based on photonic crystal fibers. Opt. Express 2017, 25, 14227–14237. [Google Scholar] [CrossRef]
  40. Dash, J.N.; Jha, R. Highly sensitive side-polished birefringent PCF-based SPR sensor in near IR. Plasmonics 2016, 11, 1505–1509. [Google Scholar] [CrossRef]
  41. Roni, T.A.; Hassan, R.; Faisal, M. Dual-side polished SPR biosensor with wide sensing range. In Proceedings of the 2020 11th International Conference on Electrical and Computer Engineering (ICECE), Dhaka, Bangladesh, 17–19 December 2020; IEEE: Piscataway, NJ, USA, 2020; pp. 487–490. [Google Scholar]
  42. Gauvreau, B.; Hassani, A.; Fehri, M.F.; Kabashin, A.; Skorobogatiy, M.A. Photonic bandgap fiber-based surface plasmon resonance sensors. Opt. Express 2007, 15, 11413–11426. [Google Scholar] [CrossRef]
  43. Hautakorpi, M.; Mattinen, M.; Ludvigsen, H. Surface-plasmon-resonance sensor based on three-hole microstructured optical fiber. Opt. Express 2008, 16, 8427–8432. [Google Scholar] [CrossRef]
  44. Chen, N.; Chang, M.; Zhang, X.; Zhou, J.; Lu, X.; Zhuang, S. Highly sensitive plasmonic sensor based on a dual-side polished photonic crystal fiber for component content sensing applications. Nanomaterials 2019, 9, 1587. [Google Scholar] [CrossRef]
  45. Atiqullah, S.M.; Palit, A.; Reja, M.I.; Akhtar, J.; Fatema, S.; Absar, R. Detection of harmful food additives using highly sensitive photonic crystal fiber. Sens. Bio-Sens. Res. 2019, 23, 100275. [Google Scholar] [CrossRef]
  46. Bulbul, A.A.-M.; Imam, F.; Awal, A.; Mahmud, M.A.P. A novel ultra-low loss rectangle-based porous-core PCF for efficient THz waveguidance: Design and numerical analysis. Sensors 2020, 20, 6500. [Google Scholar] [CrossRef] [PubMed]
  47. Malitson, H. Interspecimen comparison of the refractive index of fused silica. J. Opt. Soc. Am. 1965, 55, 1205–1208. [Google Scholar] [CrossRef]
  48. Leviton, D.B.; Freed, C.J. Temperature-dependent absolute refractive index measurements of synthetic fused silica. In Proceedings of SPIE; SPIE: Bellingham, DC, USA, 2008; Volume 6273, 62732K. [Google Scholar]
  49. Reja, M.I.; Nguyen, L.V.; Peng, L.; Ebendorff-Heidepriem, H.; Warren-Smith, S.C. Temperature-compensated interferometric high-temperature pressure sensor using a pure silica microstructured optical fiber. IEEE Trans. Instrum. Meas. 2022, 71, 7002612. [Google Scholar] [CrossRef]
  50. Habia, M.I.; Manallah, A.; Ayadi, K. Plasmonic biosensor for the study of blood diseases by analysis of hemoglobin concentration. Opt. Quantum Electron. 2023, 55, 234. [Google Scholar] [CrossRef]
  51. White, M.; Fan, X. On the performance quantification of resonant refractive index sensors. Opt. Express 2008, 16, 1020–1028. [Google Scholar] [CrossRef]
  52. Asaduzzaman, S.; Ahmed, K. Investigation of ultra-low loss surface plasmon resonance-based PCF for biosensing application. Results Phys. 2018, 11, 358–361. [Google Scholar] [CrossRef]
  53. Liu, W.; Wang, F.; Liu, C.; Yang, L.; Liu, Q.; Su, W.; Lv, J.; An, S.; Li, X.; Sun, T.; et al. A hollow dual-core PCF-SPR sensor with gold layers on the inner and outer surfaces of the thin cladding. Res. Opt. 2020, 1, 100004. [Google Scholar] [CrossRef]
  54. Melwin, G.; Senthilnathan, K. Modelling a simple arc shaped gold coated PCF-based SPR sensor. J. Opt. 2024, 53, 117–126. [Google Scholar] [CrossRef]
  55. Tasnim, N.; Rahman, M.A.; Rahman, M.R.; Ahmed, T. Highly sensitive photonic crystal fiber-based surface plasmon resonance biosensor for detection of a wide range of organic solutions. Sens. Bio-Sens. Res. 2024, 43, 100623. [Google Scholar] [CrossRef]
  56. Das, S.; Singh, V.K. Highly sensitive PCF based plasmonic biosensor for hemoglobin concentration detection. Photonics Nanostruct.-Fundam. Appl. 2022, 51, 101040. [Google Scholar] [CrossRef]
  57. Azadi, M.; Seifouri, M.; Olyaee, S.; Mohammadi, M. Ultrahigh-sensitivity D-shaped PCF-SPR biosensor with TiO2–Au hybrid layers for precise detection of blood constituents. Results Phys. 2025, 77, 108463. [Google Scholar] [CrossRef]
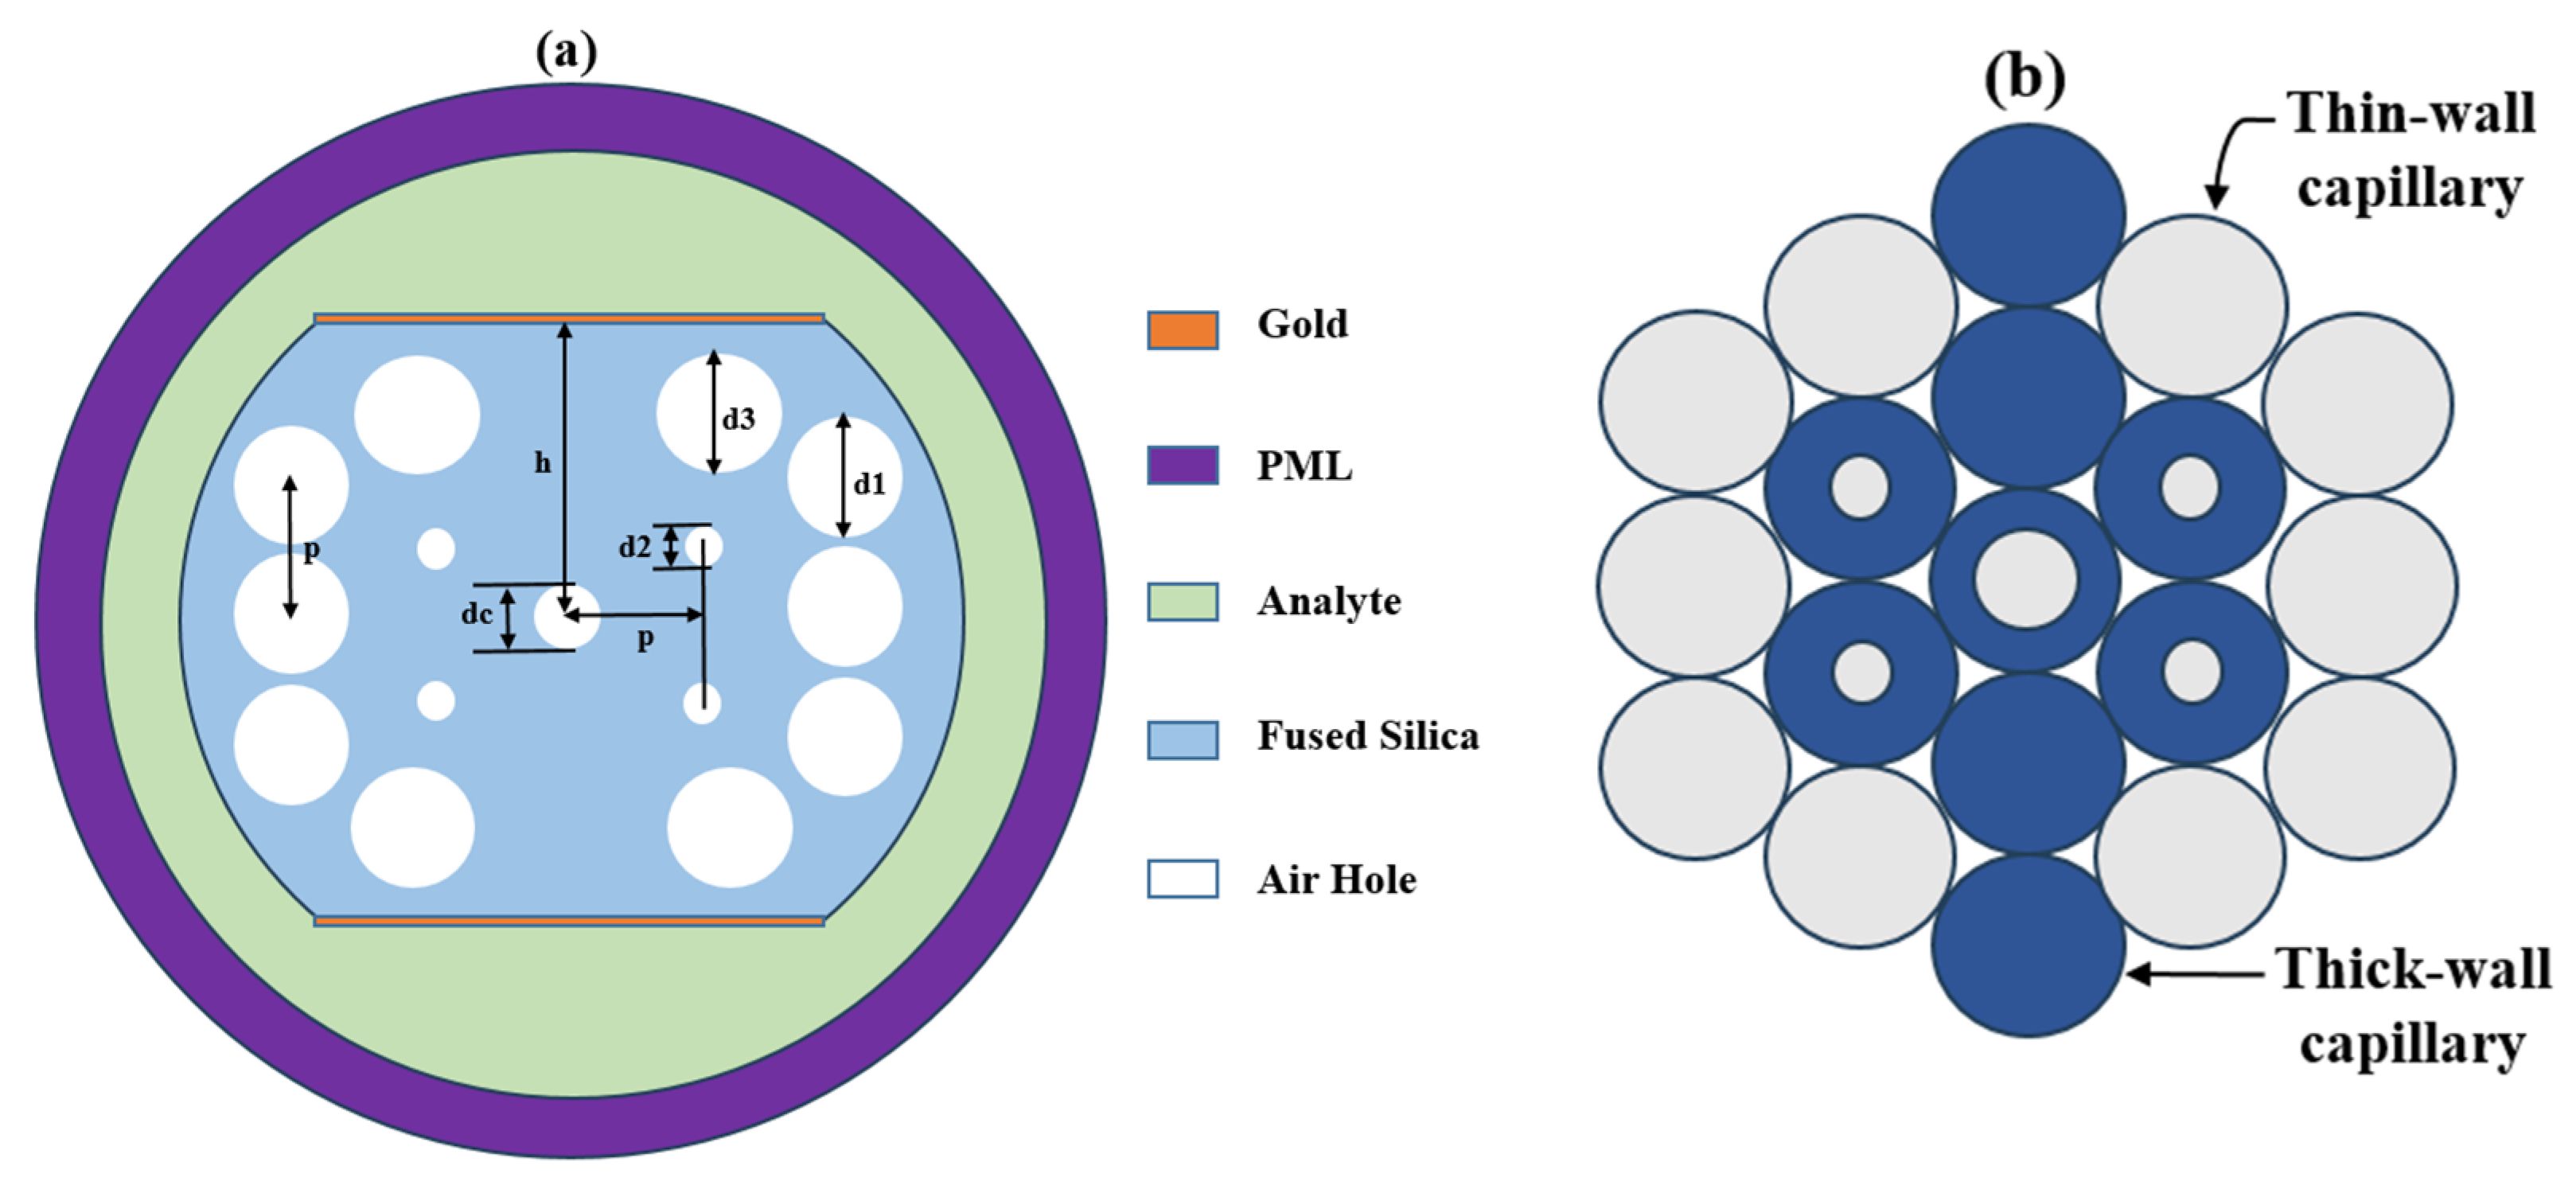
Figure 1. The (a) 2D composition of the proposed SPR sensor, (b) stacked preform for the sensor.
Photonics 12 01078 g001
Figure 2. Detailed experimental setup for analyte detection.
Photonics 12 01078 g002
Figure 3. (a) Core mode, (b) SPP mode, (c) phase matching.
Photonics 12 01078 g003aPhotonics 12 01078 g003b
Figure 4. (a) Confinement loss spectrums for the analyte RI array from 1.31 to 1.42, (b) polynomial curve fitting for the resonant wavelengths in terms of analyte RIs, (c) amplitude sensitivity of the analyte RI array from 1.31 to 1.42, (d) variation in FWHM and FOM with analyte RIs, (e) power flow distribution of x-polarization and y-polarization mode with respect to arc length.
Photonics 12 01078 g004
Figure 5. (a) Change in RI with Hb conc., (b) Confinement loss spectra for analyte RIs ranging for different Hb concentrations, (c) Amplitude sens. corresponding to different Hb concentrations.
Photonics 12 01078 g005
Figure 6. Machine learning model workflow for Hb detection.
Photonics 12 01078 g006
Figure 7. Comparison between actual and predicted values for different analyte RIs.
Photonics 12 01078 g007
Figure 8. Effect of variation in gold layer thickness on (a) confinement loss, (b) amplitude sensitivity; Effect of variation in pitch on (c) confinement loss and (d) amplitude sensitivity.
Photonics 12 01078 g008aPhotonics 12 01078 g008b
Figure 9. Fabrication tolerance examination. Loss curve with variations in (a) pitch size, (b) center air hole diameter, (c) large air holes diameter, (d) small air holes diameter.
Photonics 12 01078 g009
Table 1. Geometrical parameters of the proposed dual-polished biosensor.
Pitch, Λ (µm)d1 (µm)d2 (µm)d3 (µm)dc (µm)h (µm)
1.80.9Λ 0.3Λ 0.96Λ 0.5Λ 4.2
Table 2. Performance metrics of the proposed dual-polished biosensor.
RIλresSλ
(nm/RIU)
Rλ (RIU)SA (RIU−1)FWHM (nm)FOM
1.3154020005 × 10−5786929
1.3256020005 × 10−5806531
1.3358020005 × 10−51514544
1.3460020005 × 10−51924743
1.3562020005 × 10−52824149
1.3664040002.5 × 10−55954785
1.3768040002.5 × 10−569426154
1.3872040002.5 × 10−552030133
1.3976080001.25 × 10−550948167
1.4084010,0001 × 10−539456179
1.4194074,0001.35 × 10−6292111667
1.421680N/AN/AN/AN/AN/A
Table 3. Change in RI with Hb conc [50].
Hb (gm/lit.)RI
01.3321
501.3459
1001.3580
1501.3711
2001.3841
2501.3972
Table 4. Performance metrics of the proposed biosensor in Hb detection.
RIλresSλ
(nm/RIU)
Rλ (RIU)SA (RIU−1)FWHM (nm)FOM
1.332158040002.5 × 10−53504589
1.345962020005 × 10−52773263
1.358064040002.5 × 10−572632125
1.371168040002.5 × 10−572328143
1.384172012,0008.33 × 10−673448250
1.3972840N/AN/AN//AN//AN/A
Table 5. Performance comparison of the proposed sensor with previously designed sensors.
Ref.Structure ModelPlasmonic Material RequirementRI RangeSλ
(nm/RIU)
Rλ(RIU)SA (RIU−1)FOM
[52]Circular-shaped 100%1.34–1.3785001.16 × 10−5335N/A*
[53]Hollow core 100%1.36–1.4130,0003.33 × 10−6106.23N/A
[54]Arc-shaped, gold-coated <50%1.32–1.3714,1007.09 × 10−6109N/A
[55]Butterfly-shaped 100%1.28–1.4017,0005.88 × 10−6253298
[19]Circular-shaped, gold-coated 100%1.36–1.39250002 × 10−5505N/A
[56]Nanoscale gold-coated100%1.34–1.4134,8002.87 × 10−6N/A229
[57]D-shaped TiO2-Ag hybrid<50%1.33–1.4014,0007.14 × 10−6610N/A
This workDual-polished, dual-core<50%1.31–1.4274,0001.35 × 10−6734667
* N/A—Not Available.
Disclaimer/Publisher’s Note: The statements, opinions and data contained in all publications are solely those of the individual author(s) and contributor(s) and not of MDPI and/or the editor(s). MDPI and/or the editor(s) disclaim responsibility for any injury to people or property resulting from any ideas, methods, instructions or products referred to in the content.