Article

Novel High-Contrast Photoacoustic Imaging Method for Cancer Cell Monitoring Based on Dual-Wavelength Confocal Metalenses

by
Zixue Chen
1,†,
Ruihao Zhang
1,†,
Hongbin Zhang
1,†,
Bingqiang Zhang
2,
Lei Qin
3,
Jiansen Du
4,
Tao Zhao
5,* and
Bin Wang
1,*
1
College of Electronic Information, Micro-Nano Technology College, Qingdao University, Qingdao 266071, China
2
Qingdao Restore Medical Laboratory Co., Ltd., Key Laboratory of Cancer and Immune Cells of Qingdao, Qingdao 266111, China
3
Qingdao Civil Air Defense Command Service Center, Qingdao 266071, China
4
Qingdao International Travel Healthcare Center, Qingdao Customs District, Qingdao 266071, China
5
Shandong Provincial Key Medical and Health Laboratory of Perioperative Precise Anesthesia and Organ Protection Mechanism Research, Rizhao Key Laboratory of Basic Research on Anesthesia and Respiratory Intensive Care, Department of Central Laboratory, The People’s Hospital of Rizhao, Rizhao 276826, China
*
Authors to whom correspondence should be addressed.
These authors contributed equally to this work and should be considered co-first authors.
Photonics 2025, 12(11), 1053; https://doi.org/10.3390/photonics12111053 (registering DOI)
Submission received: 21 April 2025 / Revised: 20 October 2025 / Accepted: 22 October 2025 / Published: 24 October 2025
(This article belongs to the Special Issue The Principle and Application of Photonic Metasurfaces)

Abstract

This study proposes a high-contrast photoacoustic (PA) imaging methodology based on a dual-wavelength confocal metalens, designed to monitor the dissemination of cancer cells and to inform subsequent cancer treatment strategies. The metalens is composed of two metasurfaces that perform filtering and focusing functions, effectively reducing the cross-talk between the two wavelengths of light in space and achieving a confocal effect. Furthermore, to minimize process complexity, a uniform material system of silicon dioxide (SiO2) and titanium dioxide (TiO2) is employed across the different metasurfaces of the metalens. The designed metalens has a radius of 25 µm and an operational focal length of 98.5 µm. The results confirm that this dual-metasurface design achieves high focusing efficiency alongside precise focusing capability, with the deviations of the actual focal lengths for both beams from the design values being within 1.5 µm. Additionally, this study developed a skin tissue model and simulated multi-wavelength photoacoustic imaging of cancer cells within the human body by integrating theories of radiative transfer, photothermal conversion, and the wave equation. The results demonstrate that the enhancement trend of the reconstructed signal closely matches the original signal, confirming the model’s excellent fitting performance. The sound pressure values generated by cancer cells are significantly higher than those of normal cells, proving that this method can effectively distinguish cancerous tissue from healthy tissue. This research provides new theoretical support and methodological foundations for the clinical application of multi-wavelength photoacoustic imaging technology.

1. Introduction

Cancer is the second leading cause of death worldwide, second only to cardiovascular diseases. The recent release of the global cancer report has garnered widespread attention. According to data from the International Agency for Research on Cancer (IARC), in 2022, there were approximately 20 million new cancer cases and 9.8 million cancer-related deaths worldwide [1]. Cancer prevention, monitoring, and treatment have been subjects of significant focus among researchers. However, due to the complexity of cancer types, a fully integrated treatment approach remains elusive. Current therapeutic methods primarily include chemotherapy, radiotherapy, and surgical interventions. For cancer monitoring and post-surgical recovery assessments, imaging techniques (such as X-rays [2], ultrasound [3], etc.), tumor markers, blood tests, and tissue biopsies are commonly employed. Although these technologies continue to improve, they may still pose secondary risks to the body, including radiation exposure and potential complications from surgery, such as bleeding and infection, which could damage healthy cells or increase the risk of secondary cancers. Consequently, contemporary cancer treatment research is concentrated on identifying therapies that enhance efficacy while minimizing side effects, aiming to replace existing treatment modalities.
Photoacoustic (PA) technology, as an interdisciplinary field integrating optics, acoustics, medicine, biology, and computer vision, has garnered widespread attention in recent years [4,5,6]. The essence of this technology lies in the conversion between optical and acoustic signals. The principle is based on the irradiation of biological tissues with laser light, where the absorption of optical energy induces a local temperature increase in the tissue. The temperature rise causes the cells or tissue to expand, and upon subsequent cooling, the tissue returns to its original state, generating deformation and emitting ultrasound signals [7]. By detecting these ultrasound waves, spatial distribution information of the tissue can be reconstructed, enabling high-resolution imaging, which is beneficial for subsequent clinical diagnosis and treatment decisions. The process is illustrated in Figure 1. Photoacoustic imaging (PAI) [8] is a non-invasive imaging technique that allows for the detection of tumor-related information through the analysis of surface or shallow optical signals, making it particularly significant in the early diagnosis of cancer [9]. Compared to traditional pathological examination methods, photoacoustic imaging avoids the risks associated with invasive procedures. Furthermore, by selecting specific laser wavelengths, photoacoustic technology can sensitively monitor characteristic biomarkers of cancer cells, such as the vascular structure and oxygenated hemoglobin distribution in tumor regions, thereby improving diagnostic sensitivity and specificity [10,11,12]. To enhance imaging resolution of tumor regions and their microenvironments, multi-wavelength photoacoustic imaging technology proves to be more advantageous.
Metamaterials, as artificial structures, possess the unique capability to generate electromagnetic responses not found in natural materials, which has attracted extensive attention in the academic community [13,14]. The internal structure of these materials consists of sub-wavelength scale nano-units [15], and by controlling the geometric dimensions, material selection, and lattice constants of the units, precise modulation of polarization, phase, amplitude, and frequency of electromagnetic waves can be achieved through different mechanisms [16,17,18]. The metalens operates on this principle, and its working mechanism involves using artificial two-dimensional nanostructures to control the propagation path and focal imaging of light [19,20], thus overcoming the physical limitations of traditional lenses. The advantages of metalenses include thinness, compactness, high integration, and, most notably, their high flexibility and tunability. Specifically, metalenses can be compatible with various materials and applicable to different wavelength ranges. Depending on specific design requirements, metalenses can adopt different materials to meet the needs of particular wavelength bands, and even exhibit different optical properties at different optical wavelengths, thereby enabling multi-wavelength co-focusing imaging functions [21,22,23]. The work presented in this paper is focused on utilizing the designed metalens to achieve dual-wavelength focusing, combined with photoacoustic imaging technology for the detection of cancer cell dissemination.

2. Methods

2.1. Overall Strategy

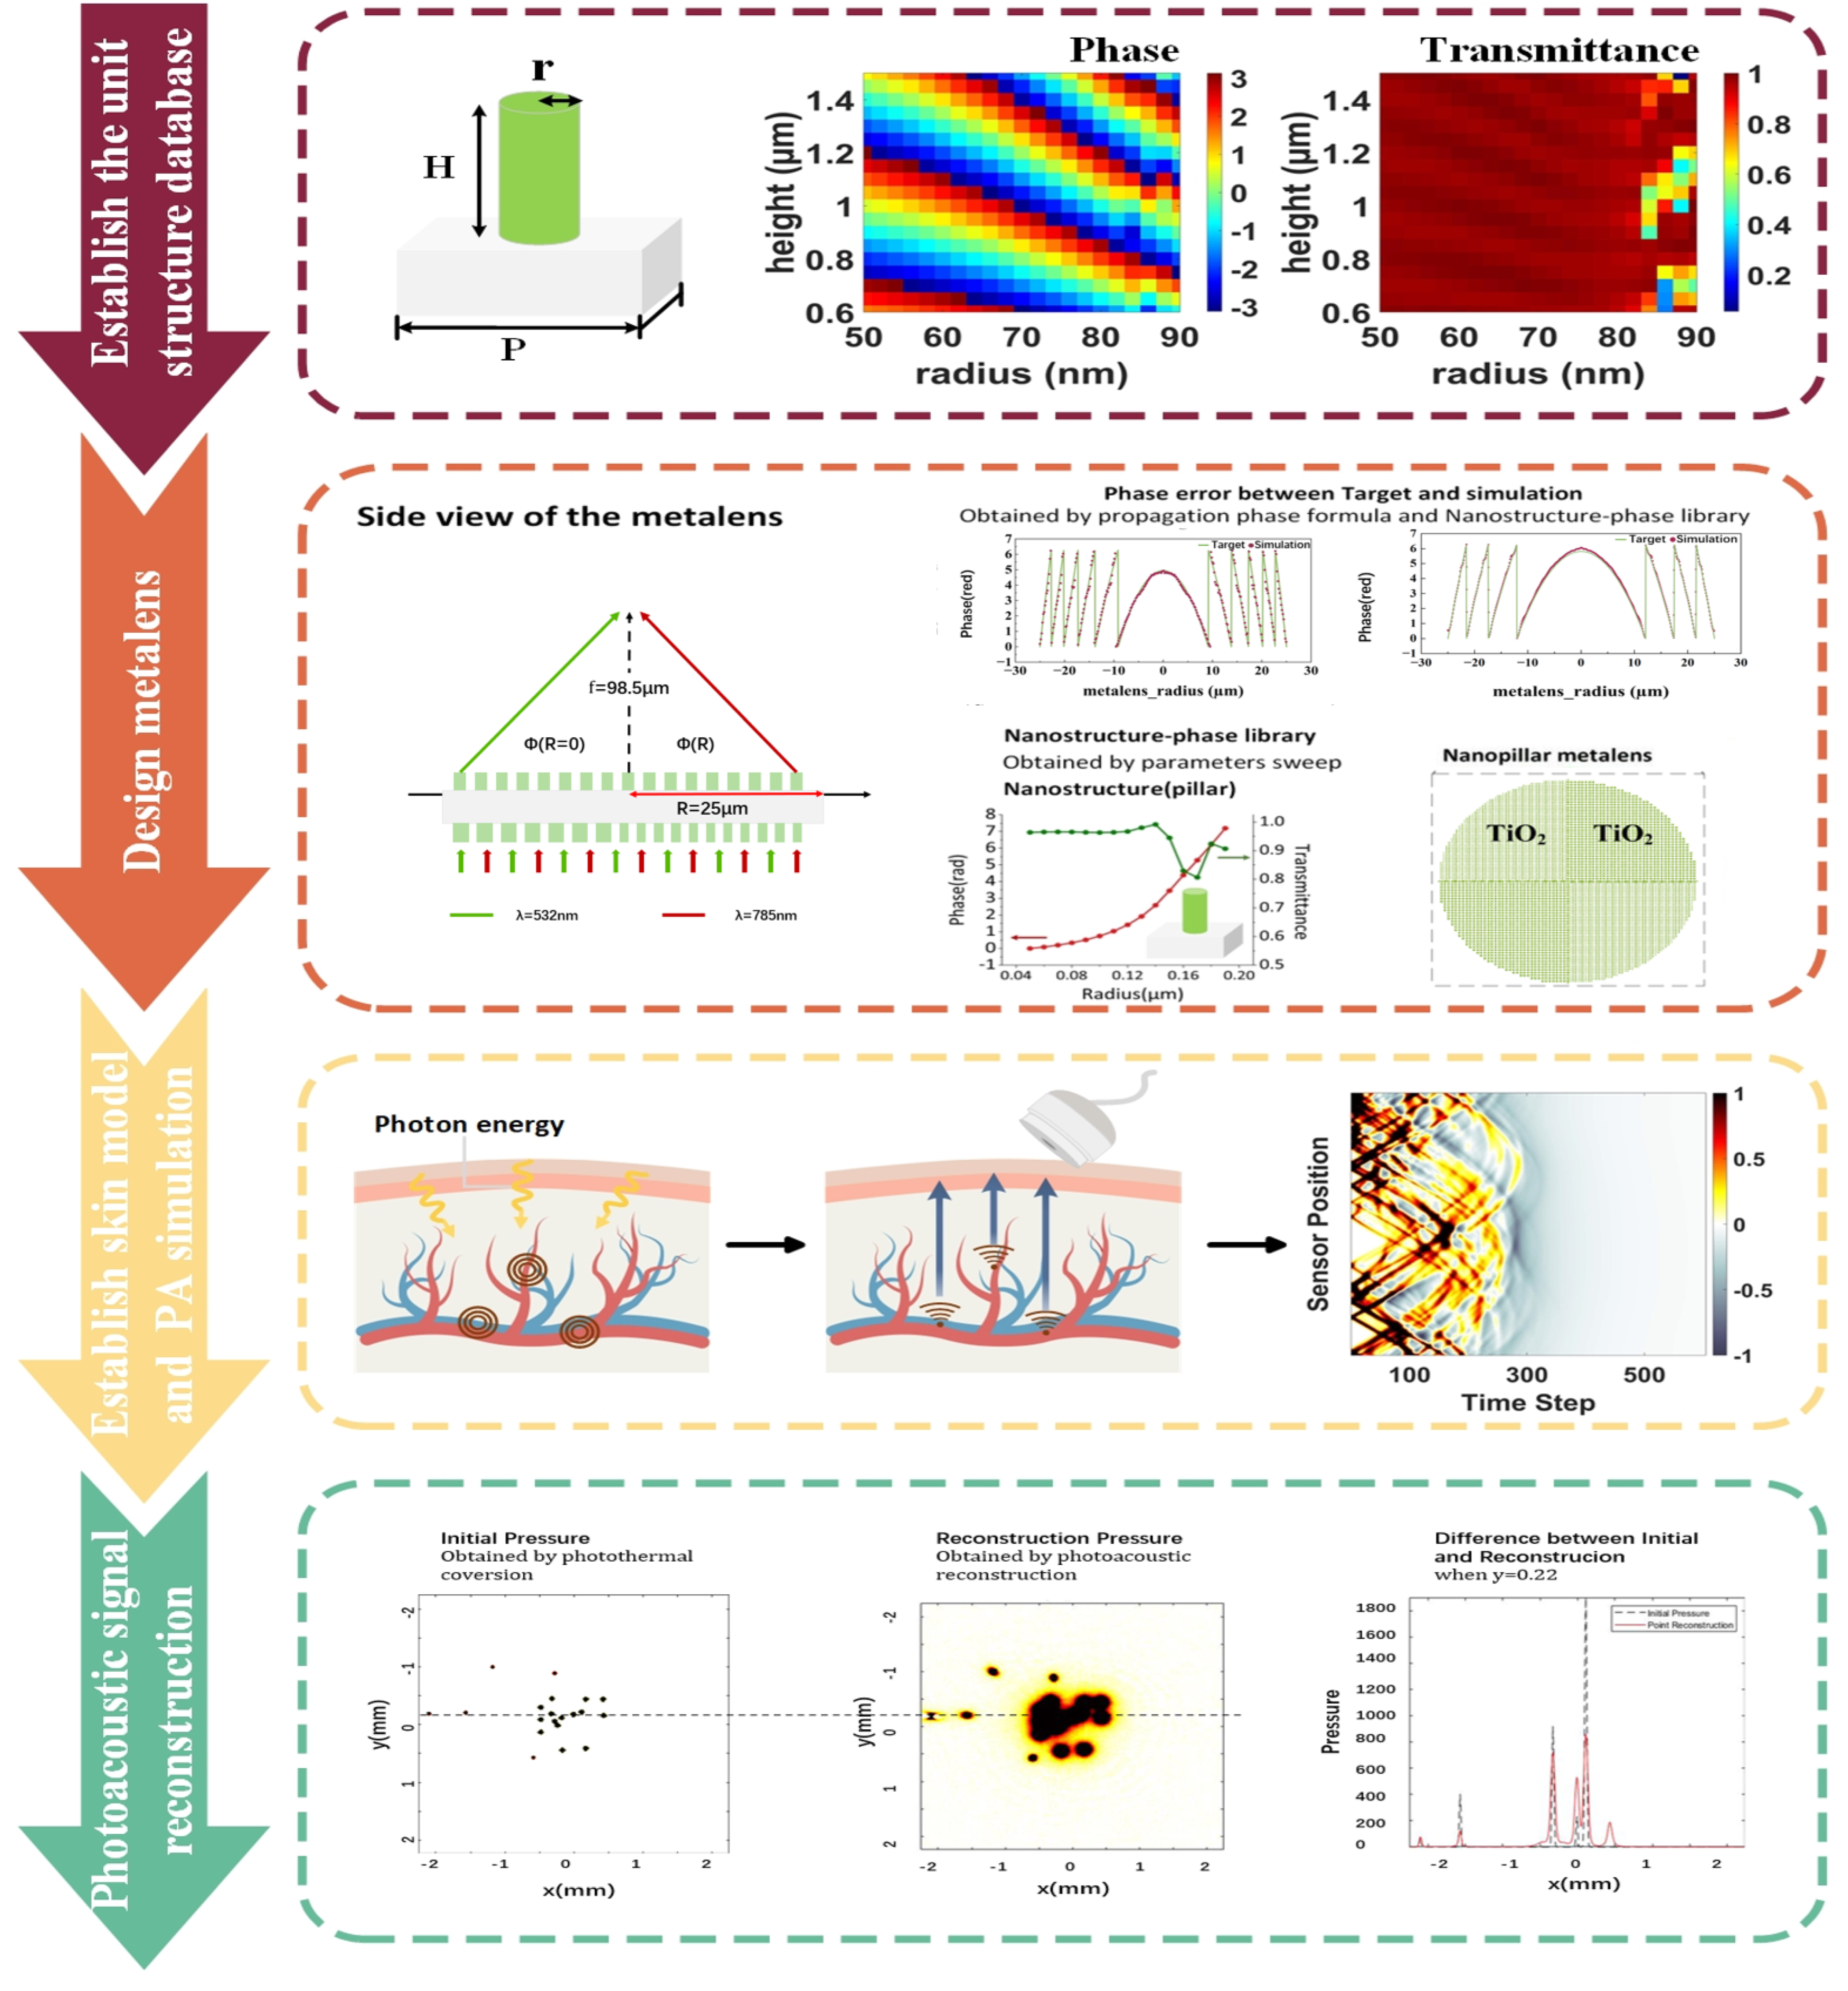
Illustrated in Figure 2 is the overall workflow adopted in this study: These steps are roughly divided into four steps: (1) Optimize the unit structure parameters and establish the phase database. (2) Design a dual-wavelength achromatic metalens and verify its performance. (3) Establish skin model with MATLAB (R2021b). (4) Reconstruct the photoacoustic signal and analyze the results.
In order to realize high contrast photoacoustic imaging of cancer cells using the dual-wavelength achromatic technique, the light absorption characteristics of endogenous substances in humans should be fully understood. The appearance of cancer is usually accompanied by angiogenesis and increased oxygen consumption. Therefore, the detection of red blood cells, especially hemoglobin, is very important. Literature research indicates that hemoglobin exhibits multiple absorption peaks within the visible to near-infrared region (wavelengths from 400 nm to 1000 nm), and these characteristics can be effectively applied in optical imaging [24,25]. Therefore, the 532 nm wavelength of light is ultimately chosen for PAI of red blood cells to image the blood vessels [26].
In addition, gold nanoparticles (GNPs) have garnered significant attention in the field of cancer imaging due to their unique physicochemical properties, including high electron density, low chemical reactivity, and excellent biocompatibility [27]. Depending on the type of cancer cell, it can be engineered into different antibodies to bind tumor-specific recognition molecules (such as epidermal growth factor, transferrin, folic acid, or GNPs surface-modified monoclonal antibodies) for targeting tumor cells [28,29]. After reviewing relevant literature, according to the size and morphology of GNPs, they show significant optical properties in the visible to near-infrared region, such as strong scattering and absorption. Therefore, light with a wavelength of 785nm was finally selected to develop cancer cells labeled with GNPs.
The dual-technique strategy, which combines a dual-wavelength achromatic metalens with selective photoacoustic excitation, leverages the synergy between them to effectively suppress background noise, thereby significantly enhancing the signal-to-noise ratio and identification accuracy of cancer cell images. This can help in early cancer detection and subsequent treatment, such as photothermal and photodynamic therapy.

2.2. The Design of Metalens

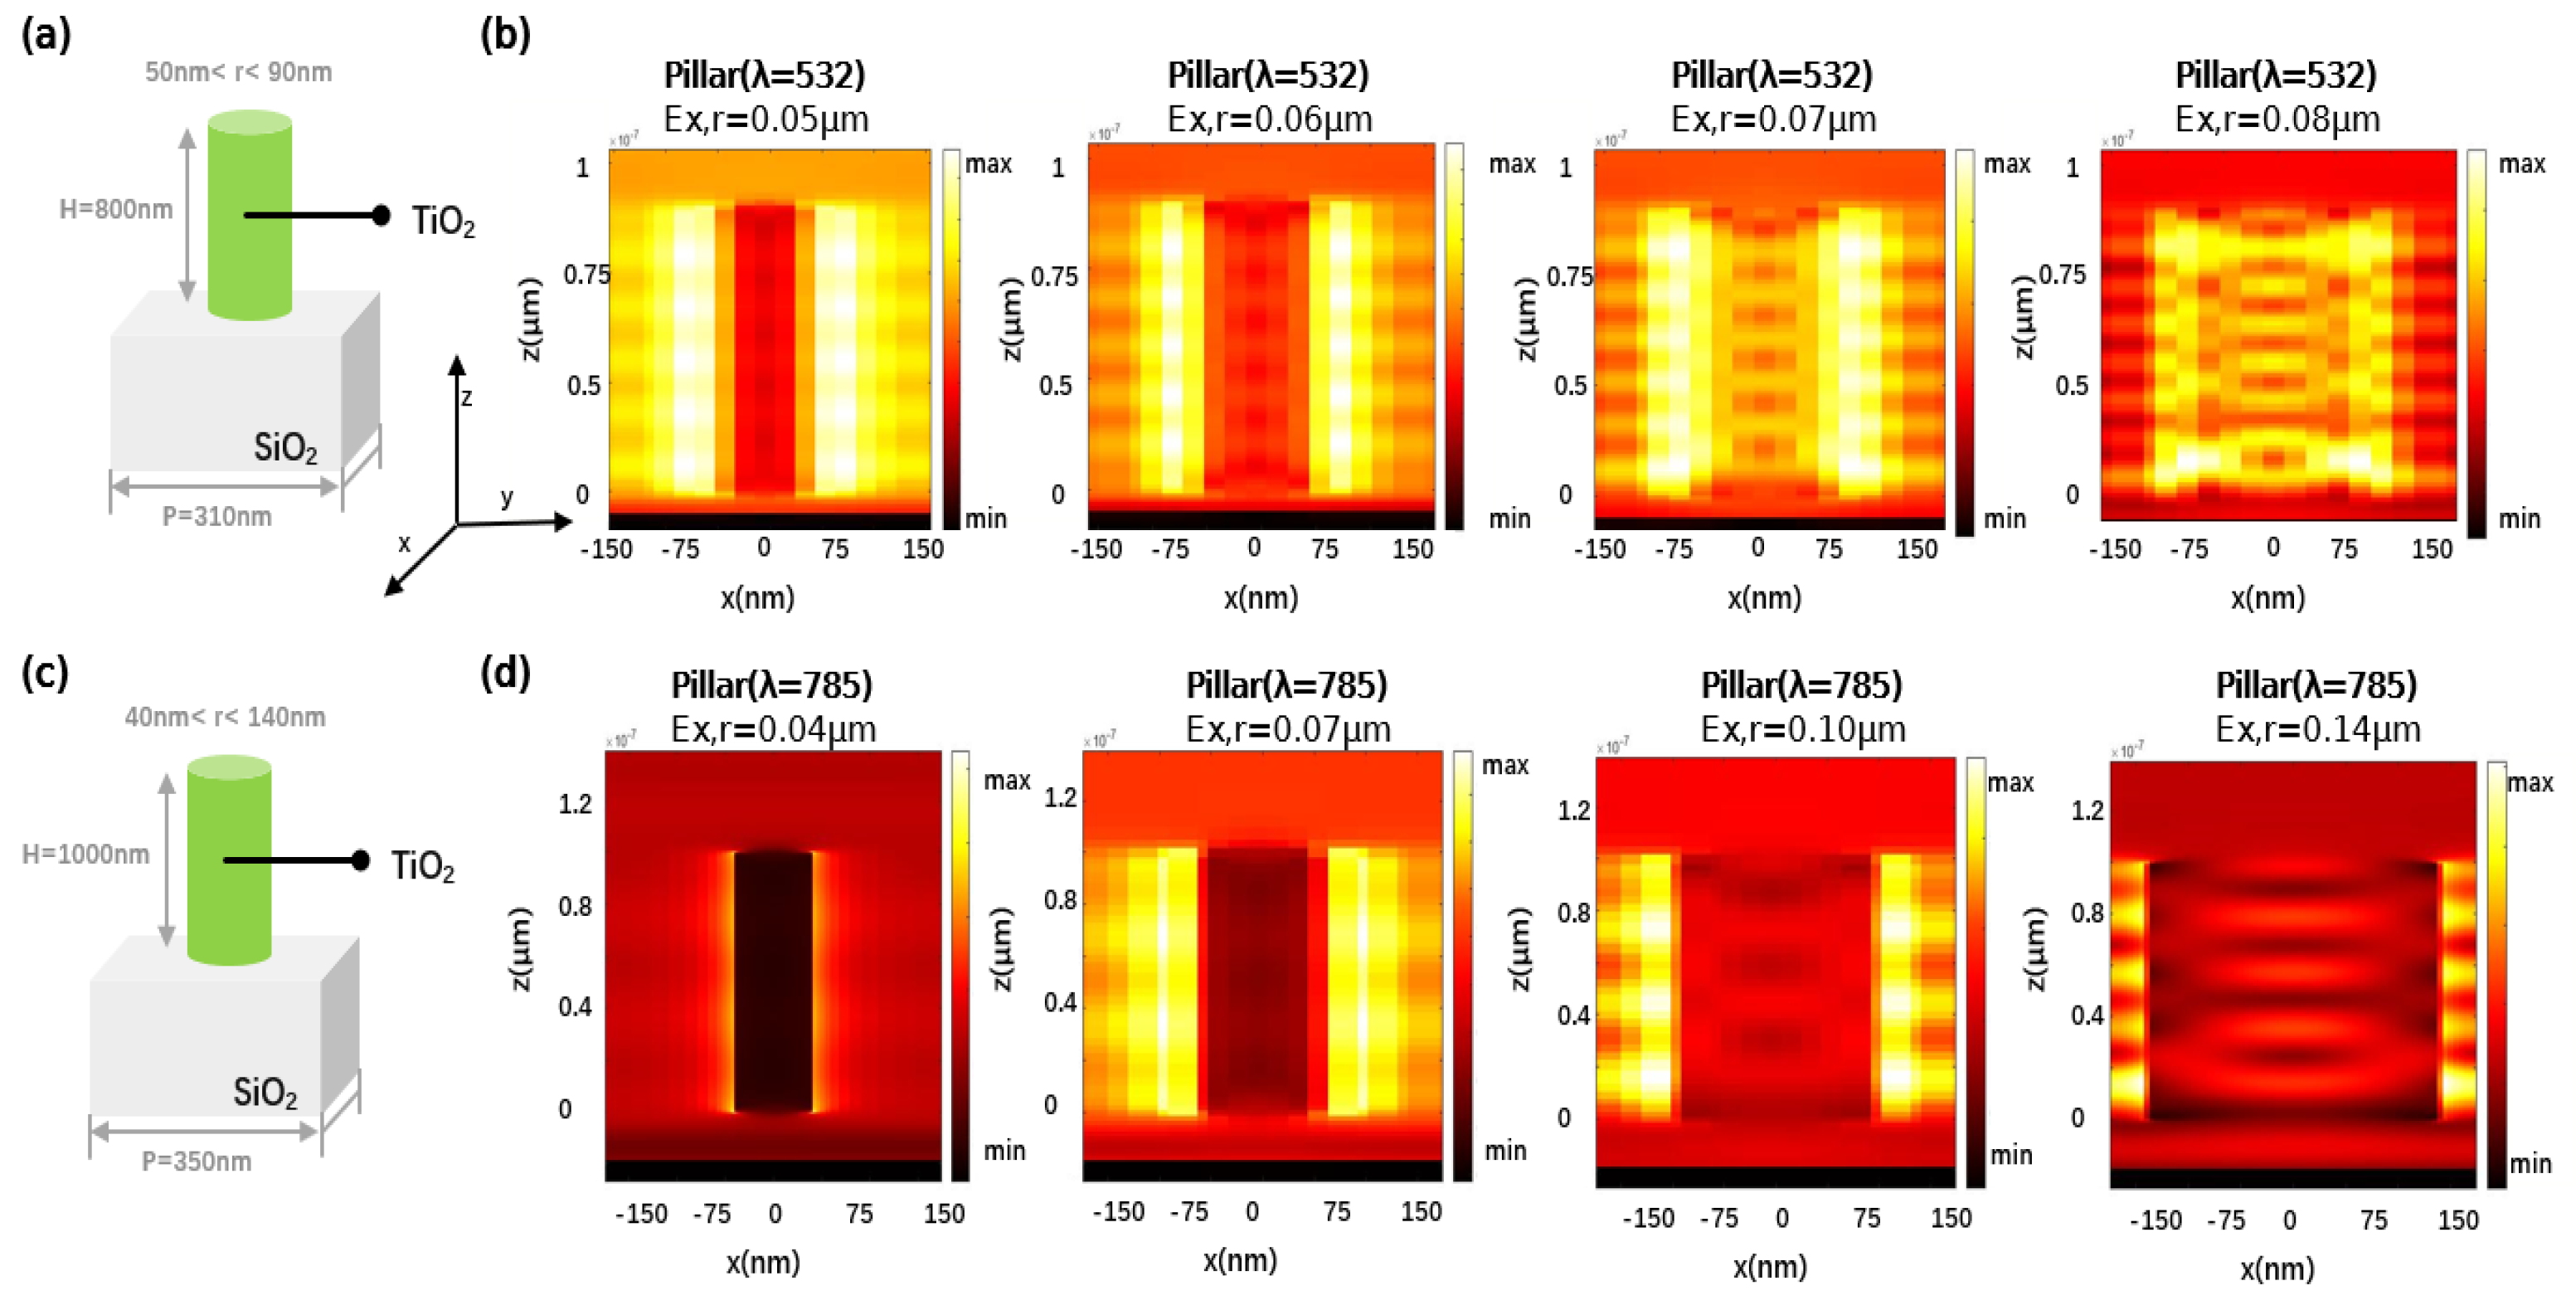
The phase control mechanisms of metalenses primarily include the resonance phase [21], geometric phase [30], and propagation phase [31]. In this paper, the design concept of spatial multiplexing and propagation phase is adopted to construct a metalens with a double metasurface structure. The central part of this structure is the substrate, which is made of SiO2. SiO2 exhibits a wide optical bandgap in the visible and near-infrared wavelength ranges, with excellent transparency, allowing effective transmission of light waves in these bands without significant absorption and demonstrating low optical loss. The upper and lower metasurfaces, which perform focusing and wavelength-selection respectively, are both fabricated using polarization-insensitive cylindrical unit structures. The material of the focusing metasurface units employs uniform TiO2, with refractive indices of nTiO2 = 2.66 (532 nm) and nTiO2 = 2.50 (785 nm), respectively. TiO2 exhibits high refractive indices at both distinct wavelengths, enabling effective control of light propagation, and despite their high refractive indices, they exhibit low optical loss. The design of the focusing surface follows the design approach of propagation phase metalenses, where the geometric dimensions of the unit structures are adjusted to change the effective refractive index, thereby controlling the phase of the transmitted light (Figure 3). The specific design methodology is elucidated by the following formula:
ϕ = 2 π λ n e f f H
where λ is wavelength, neff is the effective refractive index, and H is the height of the unit structure.
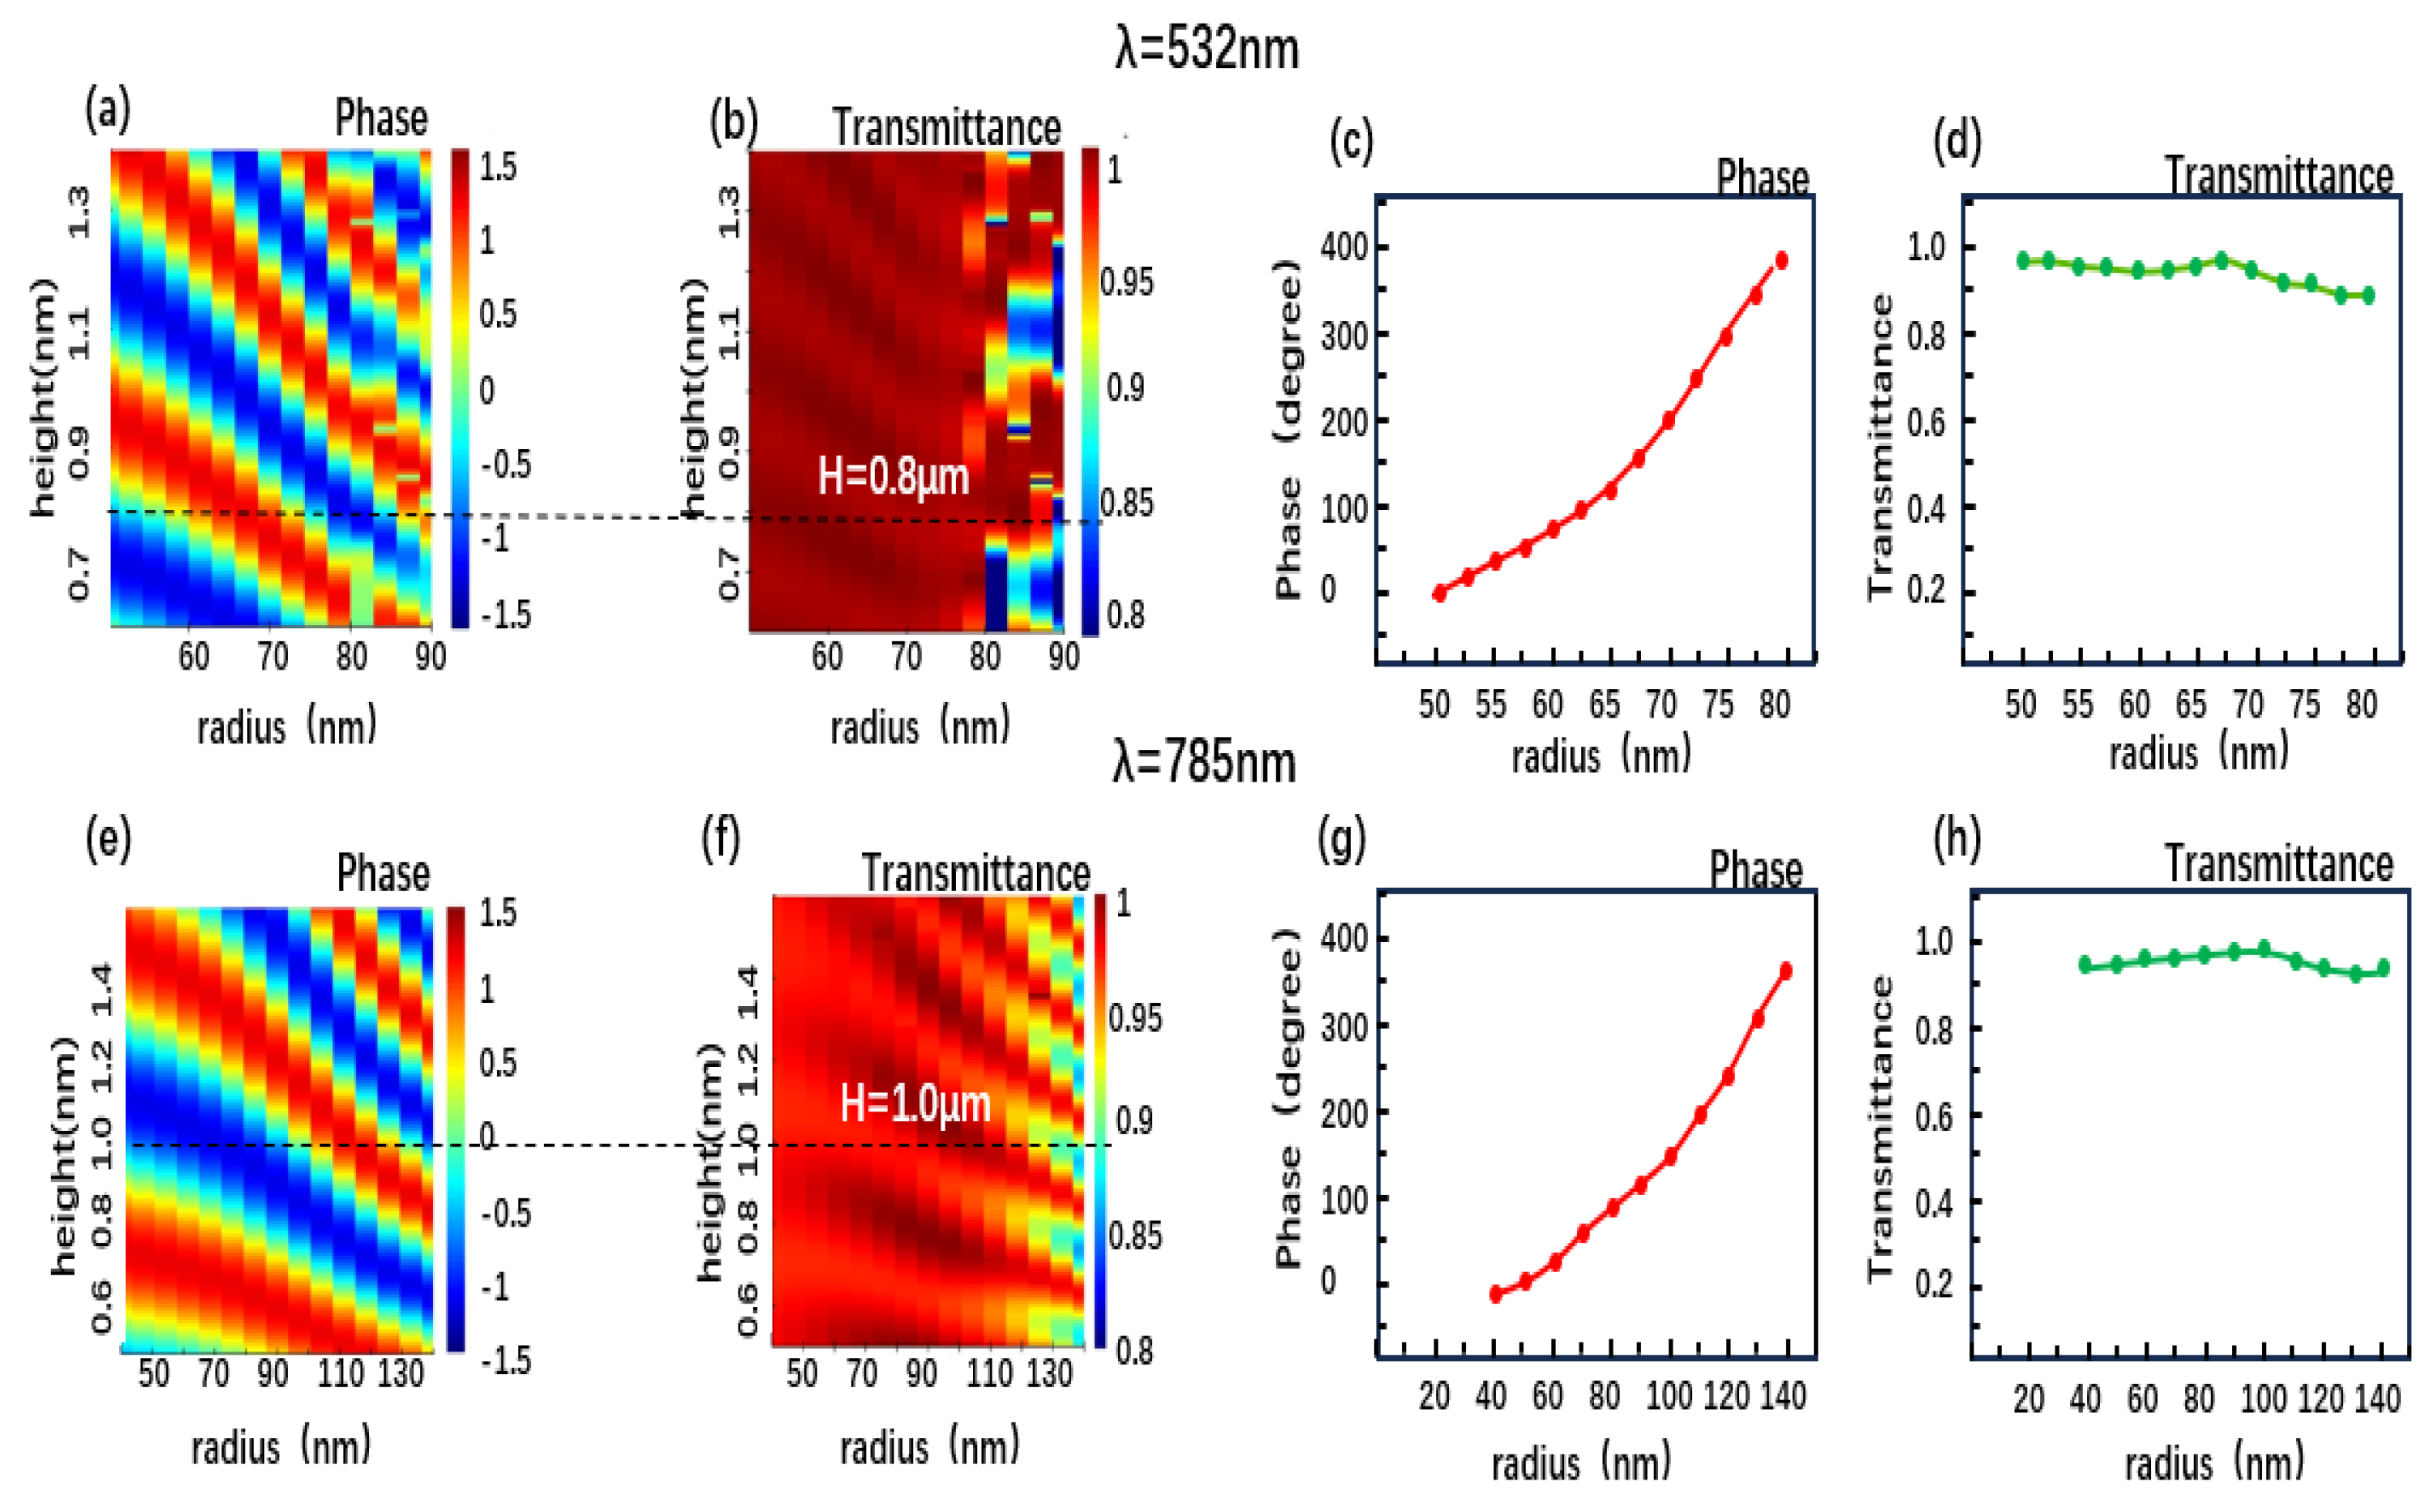
By systematically optimizing key geometric parameters of the unit structure, including its height, lattice constant, and cross-sectional radius, we achieved full phase modulation of the transmitted light from 0 to 2π while maintaining high transmittance. To ensure superior optical performance, the lattice constant must comply with the Nyquist sampling theorem to avoid optical artifacts. For precise optical performance prediction, this study employs the Finite-Difference Time-Domain (FDTD) method for computational simulations. After multiple rounds of calculations and parameter optimization (Figure 4a,b,e,f), the geometric parameters of the unit structure were determined through the aforementioned process.
For a 532 nm wavelength light source, the geometric parameters are: lattice constant P = 0.31 μm, unit height H = 0.8 μm, and cross-sectional radius r ranging from 0.05 to 0.09 μm; for a 785 nm wavelength light source, the lattice constant P = 0.35 μm, unit height H = 1 μm, and cross-sectional radius r ranging from 0.04 to 0.14 μm. These results are shown in Figure 4. By systematically organizing and summarizing these unit structures’ geometric parameters and their corresponding phase changes, we have established a detailed parameter database. Based on this, the center of the metalens surface is set as the coordinate origin, and according to the generalized Snell’s law [32] and the principle of light field focusing, the calculation results show that the phase changes at various positions must satisfy the following relation:
ϕ x , y = 2 π λ ( x 2 + y 2 + f 2 f )
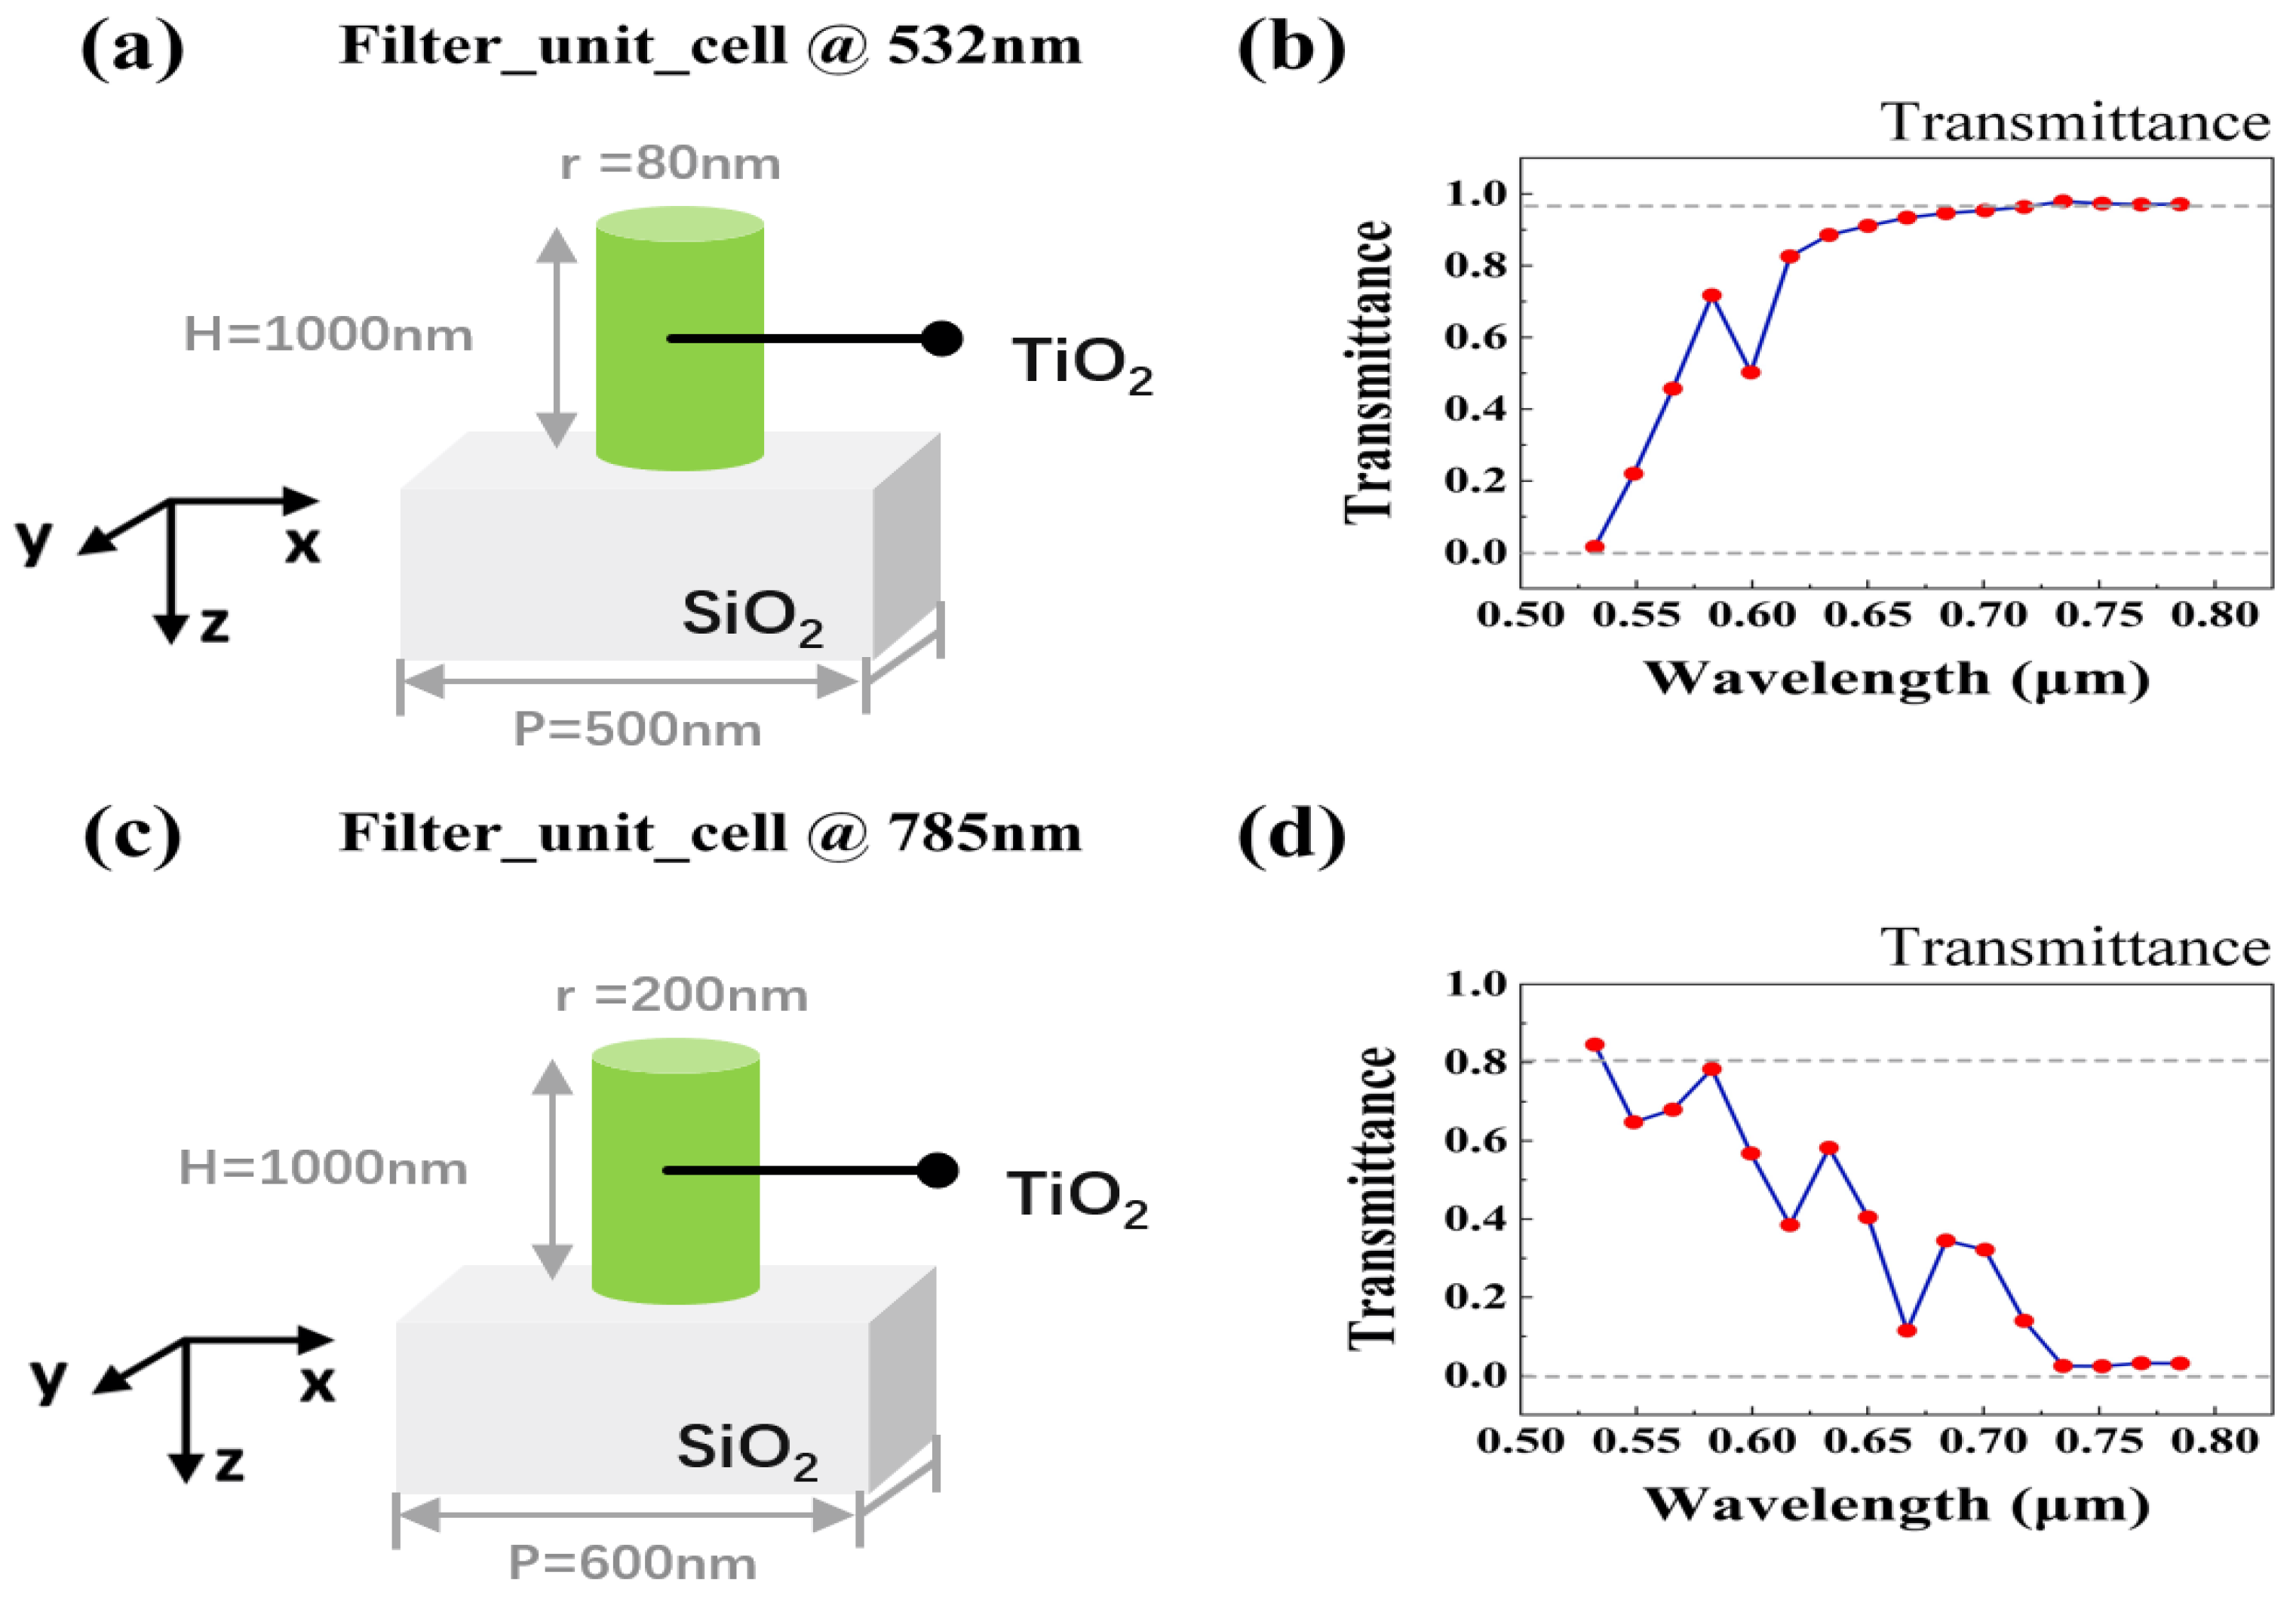
Subsequently, we identified unit structures that match the phase requirements from the database and set their corresponding geometric parameters. Metamaterials not only effectively manipulate wavefront phase but also possess the ability to regulate propagation characteristics, such as transmittance and other important optical properties. Based on this theoretical framework, suitable materials and geometric parameters were selected to enable the selective transmission or blocking of specific wavelengths. In the design of wavelength-selective metasurfaces, TiO2 was chosen as the material. By scanning and optimizing the unit structure’s height, lattice constant, and cross-sectional radius, an array structure was achieved that allows transmission of light at 532 nm while effectively blocking light at 785 nm. Additionally, the corresponding optical characteristic inversion array was obtained. After several rounds of parameter scanning and optimization, the final geometric parameters of the unit structure were determined as follows: for light at 532 nm, the lattice constant P = 0.5 μm, unit height H = 1.0 μm, and cross-sectional radius r = 0.08 μm; for light at 785 nm, the lattice constant P = 0.6 μm, unit height H = 1.0 μm, and cross-sectional radius r = 0.2 μm. Figure 5 illustrates the spatial distribution of the scanning outcomes.

2.3. Three-Dimensional Photoacoustic Simulation

Photoacoustic signals are ultrasonic waves generated by the photoacoustic effect when a material absorbs light energy. It is due to the thermal expansion-contraction deformation of cells after absorbing photon energy, resulting in sound waves. In order to simulate the generation and propagation of photoacoustic signals, this study builds a representative skin model based on the k-wave of MATLAB, including three layers of skin structure including the epidermis, dermis and subcutaneous fat layer (Figure 6). To ensure the accuracy and reliability of the simulation results, this model fully incorporates the acoustic properties of each layer, including key parameters such as sound velocity, density, and acoustic impedance. The acoustic characteristics of each layer are shown in Table 1:
The propagation of photon signals within a skin model is calculated using the Radiative Transfer Equation (RTE) [33] combined with the Monte Carlo method. The basic form of the Radiative Transfer Equation is as follows:
1 c 𝜕 I ( r , s ^ , t ) 𝜕 t + s ^ I ( r , s ^ , t ) + μ t I ( r , s ^ , t ) = μ s 4 π f ( s ^ s ^ ) I ( r , s ^ , t ) d Ω + Q ( r , s ^ , t )
where I ( r , s ^ · t ) is the light intensity at position r, direction s, and time t. c is the speed of light. Total attenuation coefficient μ t = μ a + μ s is the absorption coefficient and μ s is the scattering coefficient. f ( s ^ · s ^ ) is the scattering phase function. Q ( r , s ^ · t ) is the source function. The optical parameters of different layers are presented in Table 2 and Table 3.
Then the initial pressure value can be obtained by applying the photothermal conversion formula to convert the optical energy reaching the tissue cells. The formula is presented as follows:
P 0 ( x ) = Γ ( x ) μ a ( x ) η t h I ( r , s ^ , t )
where p 0 ( x ) represents the initial pressure distribution, μ a ( x ) represents the light absorption coefficient distribution function, and Γ ( x ) represents the Gruneisen coefficient. The expression for the Gruneisen coefficient is shown as:
Γ ( x ) = β v 2 C p
where β is the coefficient of thermal expansion, and C p is the specific heat capacity at constant pressure. Due to the short time span during the signal acquisition process, the Gruneisen coefficient is considered constant in this work. The photothermal conversion parameters of the two cells at different wavelengths are recorded in Table 4. The photothermal conversion ratio of cells is usually about 40~70%.
The propagation of the generated acoustic wave signal is governed by the wave equation [34], whose mathematical expression is as follows:
( 2 1 v c 2 𝜕 2 𝜕 t 2 ) p ( x , t ) = p 0 ( x ) d δ ( t ) d t

3. Results

3.1. Focusing Properties of Single-Wavelength Metalens

To ensure the effectiveness of the designed unit cell structure and the geometric parameter-phase database, the performance of the single-wavelength metalens must first be evaluated. In accordance with Equation (2), unit cell structures of different sizes are placed at specific locations on the substrate. Since the unit cell structure is insensitive to the polarization state of light, the light source is a plane wave with an amplitude of 1 and x-polarization. For computational efficiency, the boundary conditions are defined as anti-symmetric in the x-direction, symmetric in the y-direction, and a PML (Perfectly Matched Layer) in the z-direction.
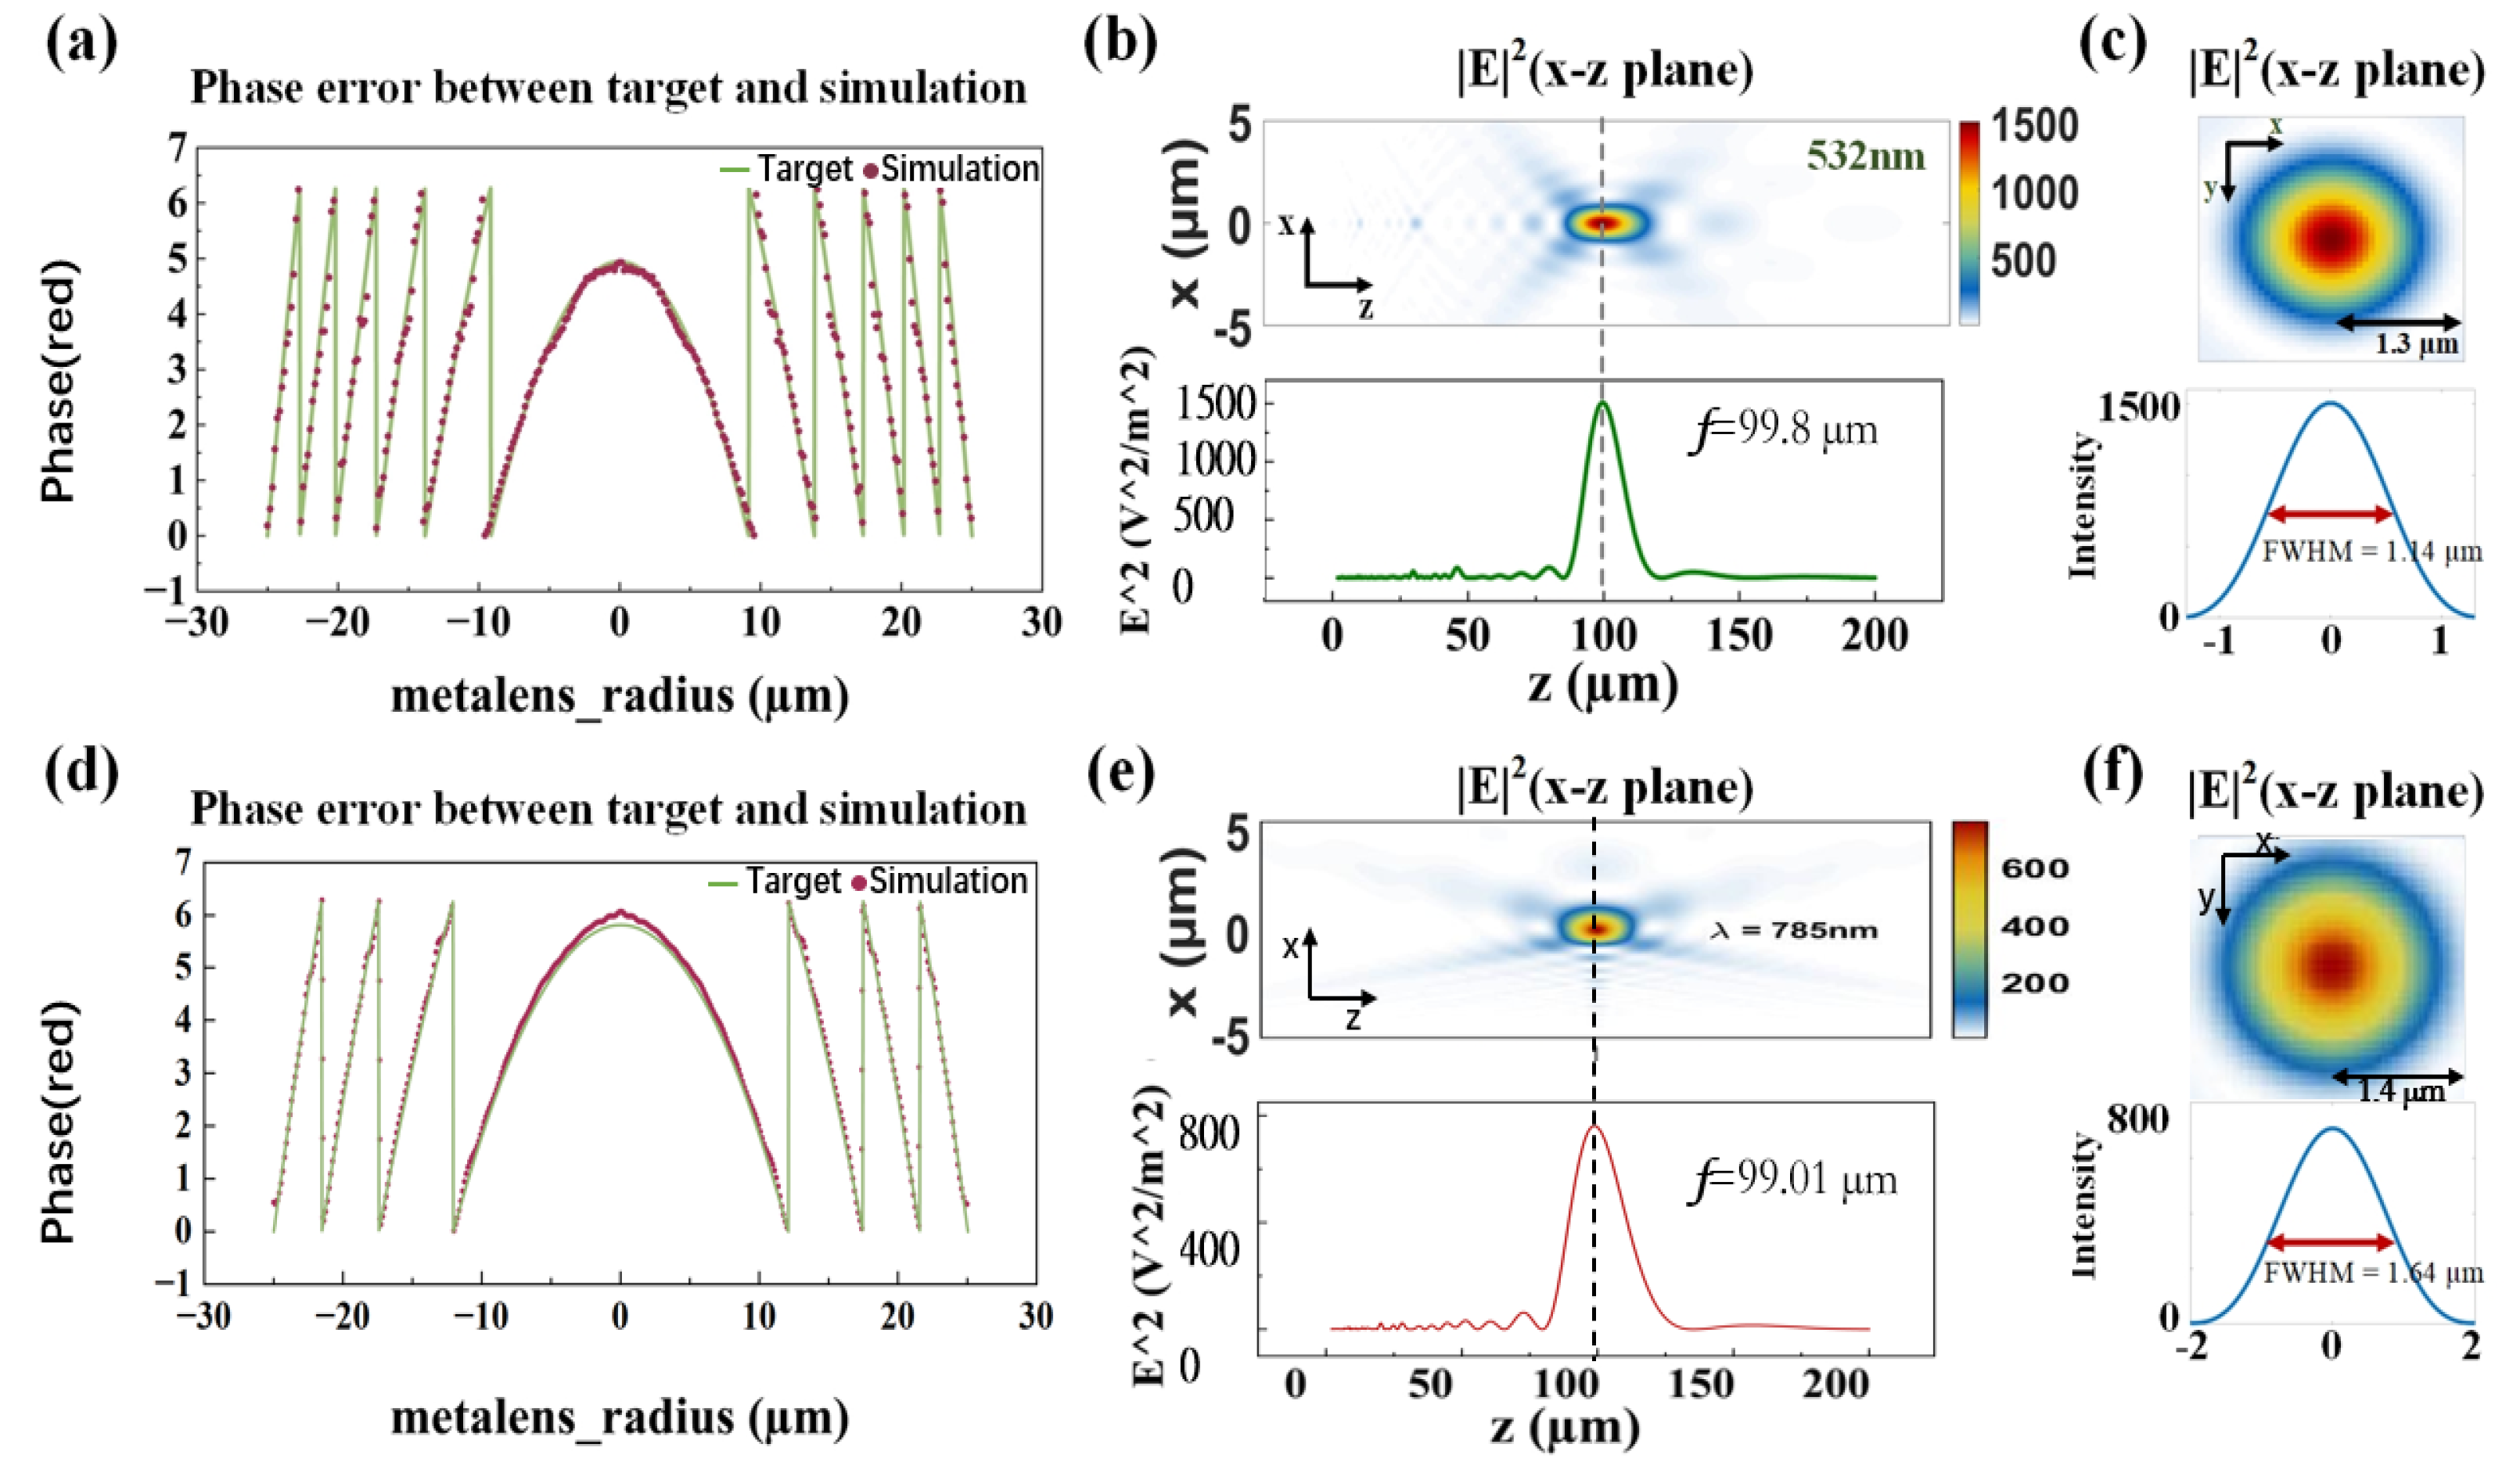
The results are illustrated in Figure 7. Figure 7a,d present a comparative analysis between the target phase distribution and the simulated phase distribution of the metalens in the transverse direction, demonstrating excellent agreement between the two. The phase distribution characteristics align well with the theoretical predictions of the focusing phase formula (Equation (2)). To further evaluate the focusing characteristics of the metalens, we simulated the focusing performance of two metalenses under plane wave illumination at different operating wavelengths, with the results shown in Figure 7b,e, respectively. Under the illumination of λ = 532 nm, the metalens exhibits an effective focal length of 99.8 μm, with a full width at half maximum (FWHM) of the focal plane intensity distribution of 1.14 μm (Figure 7c). When the operating wavelength is switched to λ = 785 nm, the measured focal length is 99.01 μm, with a corresponding FWHM value of 1.64 μm (Figure 7f). The results demonstrate that the deviations between the measured focal lengths at both operating wavelengths and the design target (f = 100 μm) are confined within 1.5%, which strongly validates the rationality and feasibility of the proposed unit cell design strategy.
Subsequently, the focusing efficiency of the two single-wavelength metasurfaces was calculated. The focusing efficiency is determined by comparing the total power of the focused spot at the focal plane of the metasurface to the total power of the incident light. In this study, the total power of the focused spot is quantified as the cumulative optical intensity encompassed within the 1 × FWHM boundary. The focusing efficiency can be expressed by the following formula:
η = P f o c u s P i n
P = 1 2 ε 0 c E 2 × A
where ϵ 0 represents the permittivity of free space, c corresponds to the speed of light, and E signifies the amplitude of the electric field. A represents the area of the optical field. Through calculations, the focusing efficiency of the 532 nm metalens is determined to be 42.68%, while the 785 nm metalens achieves 55.53%.

3.2. Simulation Results of the Visible-IR Metalens

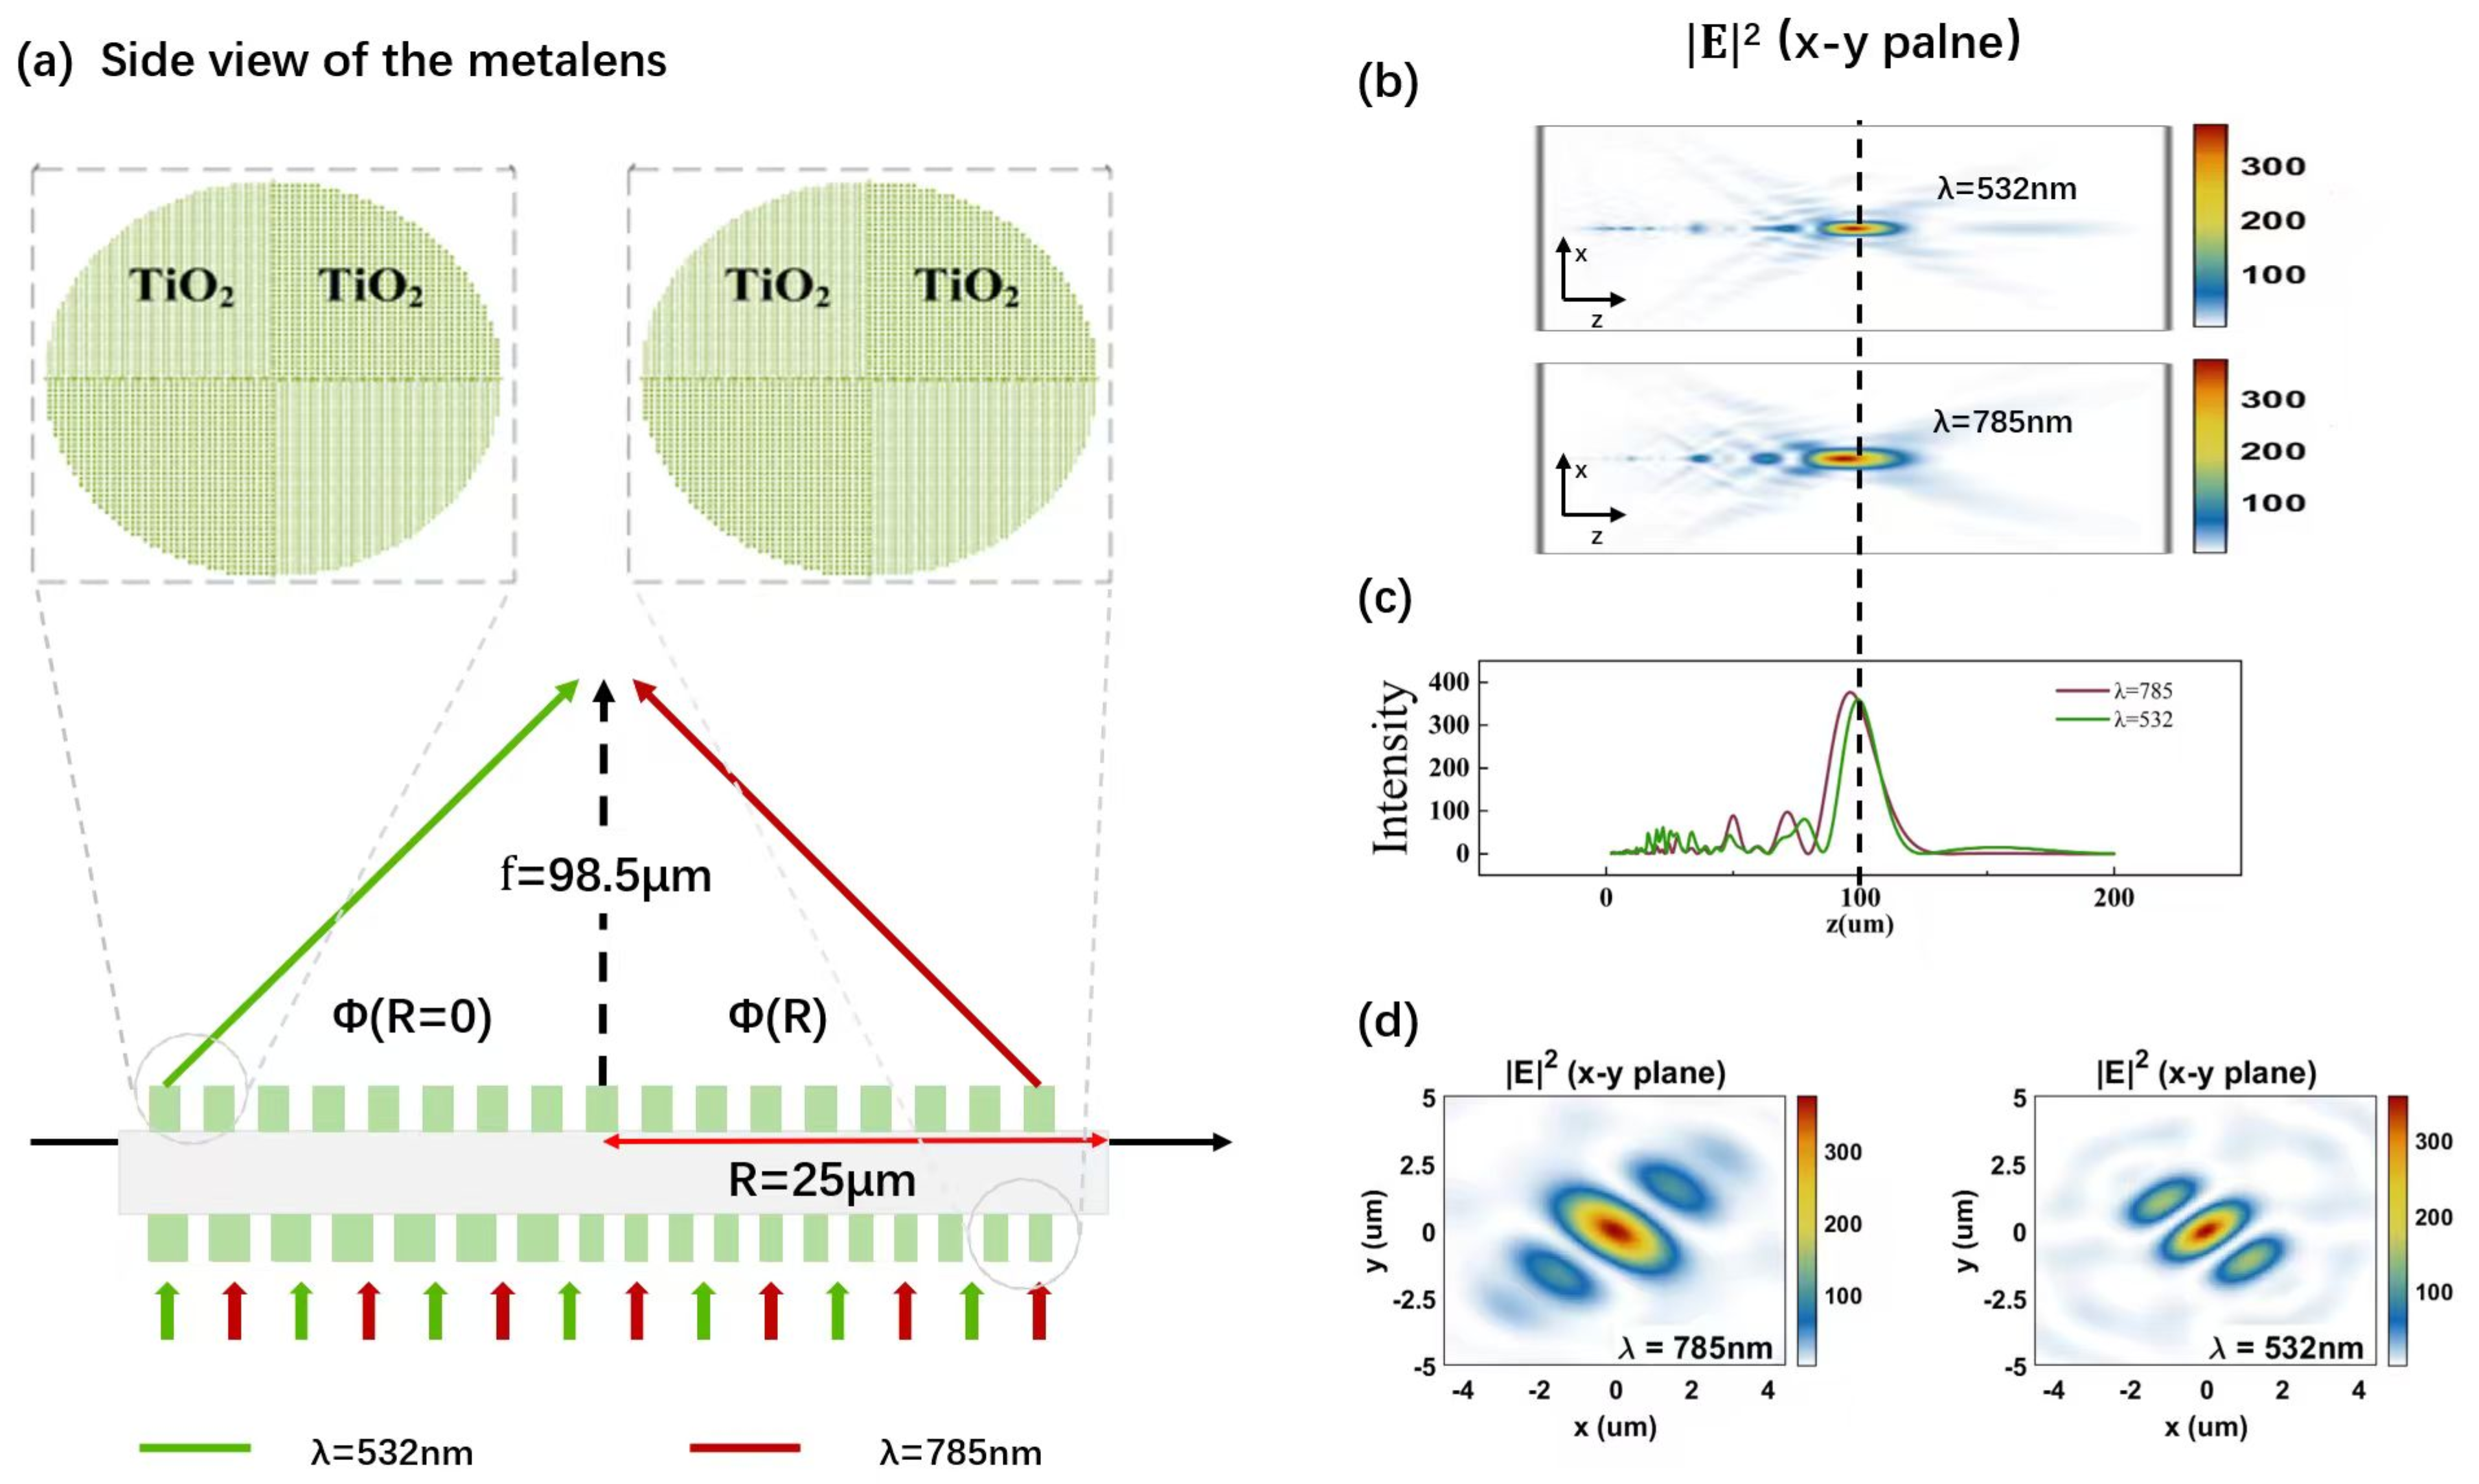
The dual-wavelength metalens employs a dual metasurface structure to separately achieve the filtering and focusing functions of light waves. The metalens has a radius of 25 μm and a focal length of 98.5 μm. The NA of the metalens is 0.25. A smaller NA can provide a greater depth of focus, making it suitable for biological imaging applications, particularly for large-scale imaging or scenarios requiring simultaneous observation of multiple targets. Additionally, the low-NA design reduces dependence on the polarization state of incident light. The metasurface structure utilizes spatial multiplexing technology, arranging TiO2 unit cells on the substrate according to the design requirements outlined in Equation (2). The specific structural layout is shown in Figure 8a.
The experiment utilized linearly polarized light sources with wavelengths of 532 nm and 785 nm respectively. In the simulation setup, perfectly matched layer (PML) boundary conditions were applied in all x, y, and z directions. Optical field revealed the focal spot distribution of the metalens (Figure 8b). Measured results indicate focal lengths of 98.85 μm at 532 nm and 96.42 μm at 785 nm (Figure 8c), with a negligible deviation of merely 2.43 μm between them, confirming the successful realization of dual-wavelength co-focusing functionality in the metalens. Under dual-wavelength illumination, the focusing efficiencies were 12.32% (532 nm) and 27.08% (785 nm), respectively. The relatively low efficiency is primarily attributable to propagation losses caused by the dual-metasurface structure and spatial multiplexing technique: the structural complexity of integrating two distinct metasurface filters on a single substrate leads to differential filtering effects for 532 nm and 785 nm light, thereby reducing the overall transmittance of the system and directly compromising the focusing efficiency. For comparison, independent studies report that dual-layer metal lenses in the green and blue spectral ranges exhibit focusing efficiencies as low as 13%, while dual-layer dielectric metalenses in the ultraviolet and green spectral ranges achieve efficiencies as low as 16%.
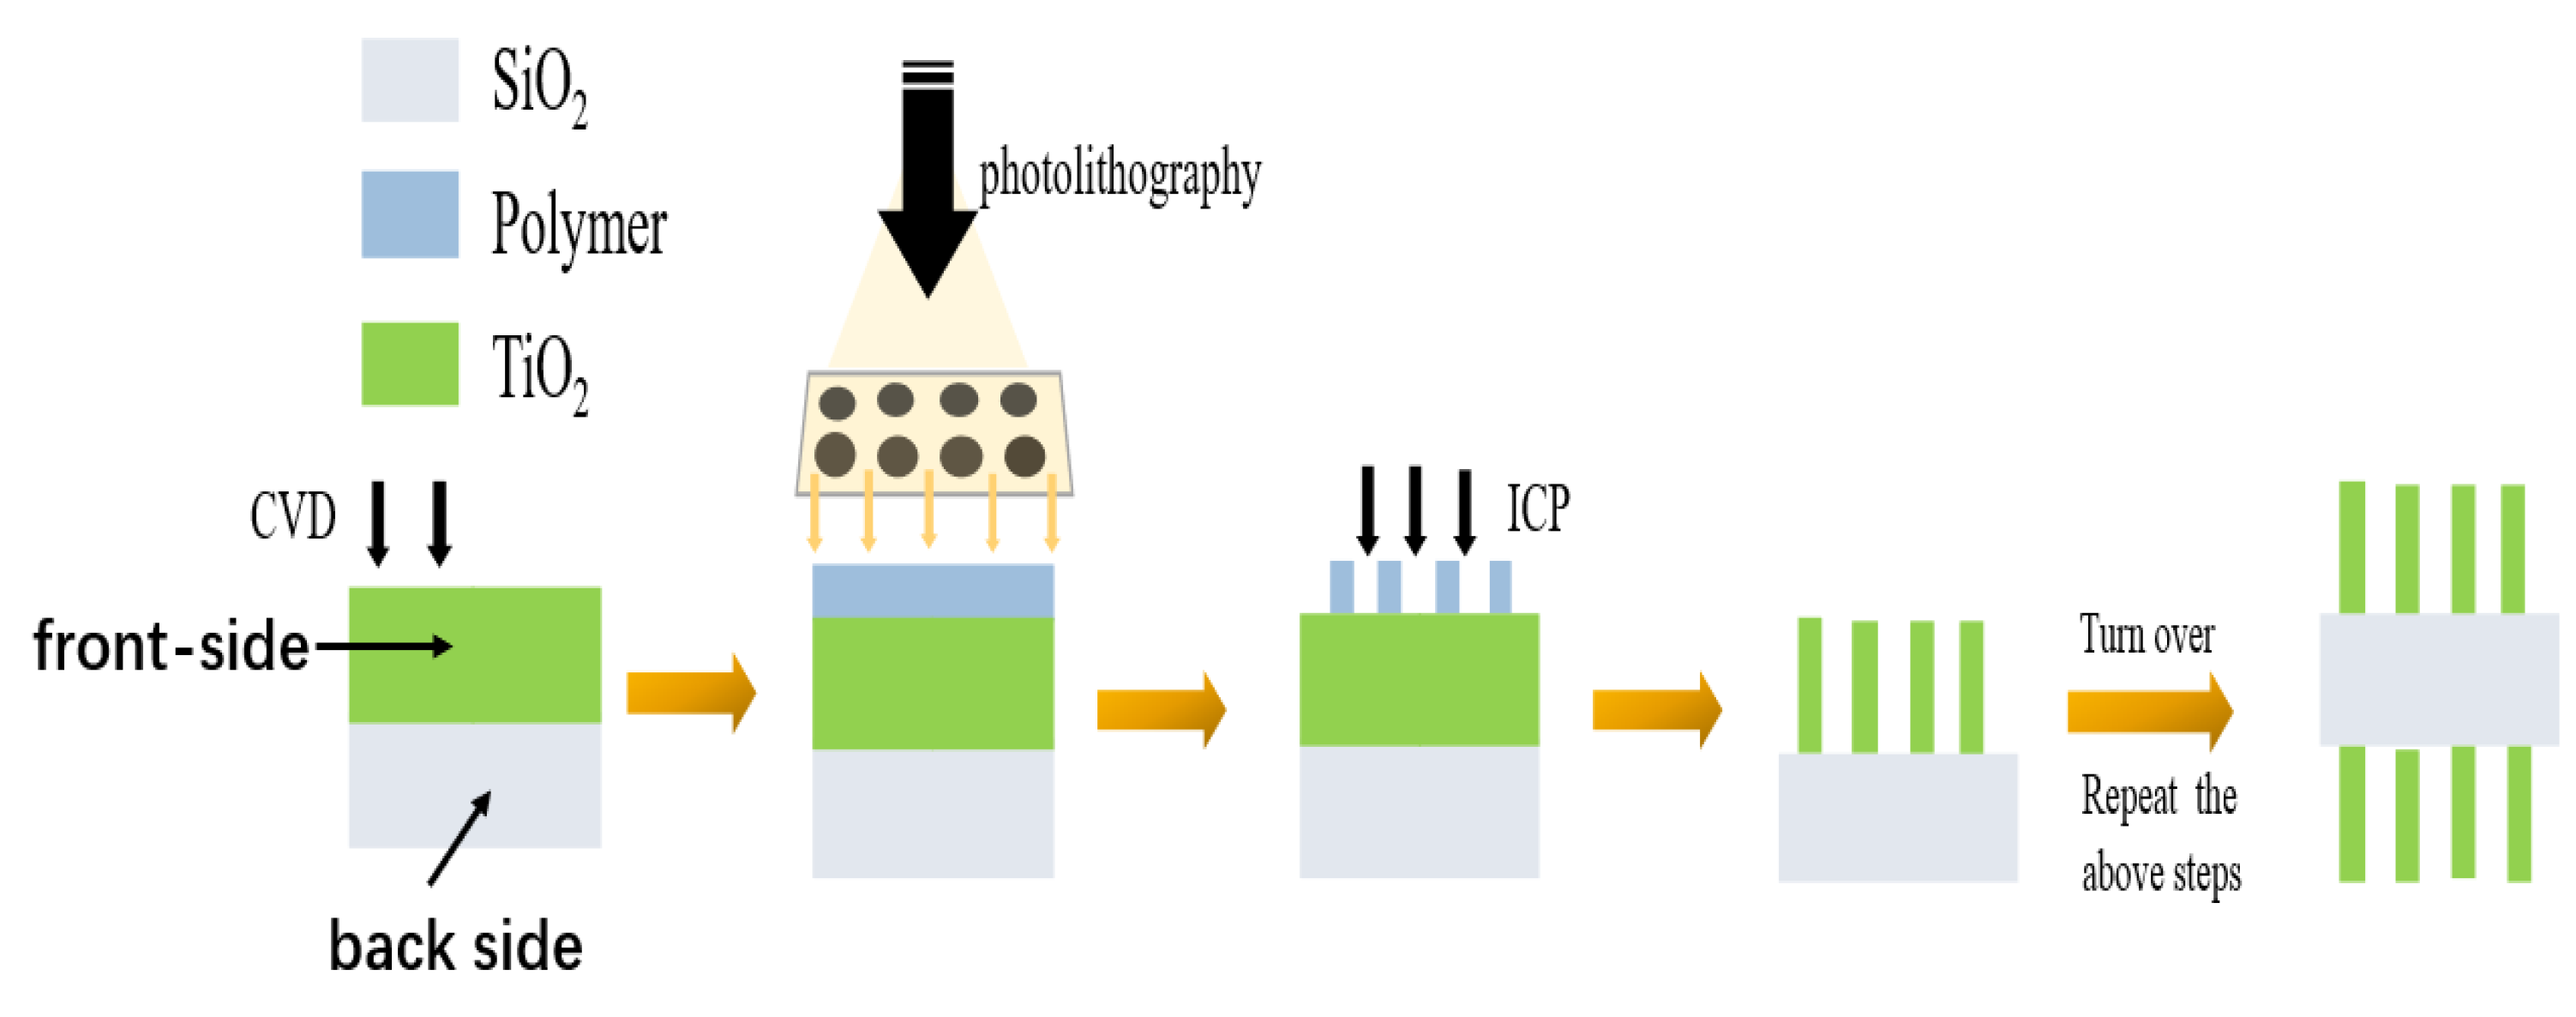
In addition to the numerical simulations conducted to investigate the proposed metalens structure, we also present a potential fabrication process flow, as illustrated in Figure 9. Firstly, TiO2 is deposited on the front side of the substrate using chemical vapor deposition (CVD) [35]. A similar process is applied to the back side for TiO2 deposition, with the film thickness controlled by adjusting the deposition time. Then, A positive photoresist [36], such as EZP520, was then spin-coated onto the surface of the film and subsequently baked. Next, the films are etched using inductively coupled plasma etching technology (ICP) [37]. Finally, the excess photoresist was removed to obtain the desired metalens.

3.3. Results of 3D PA

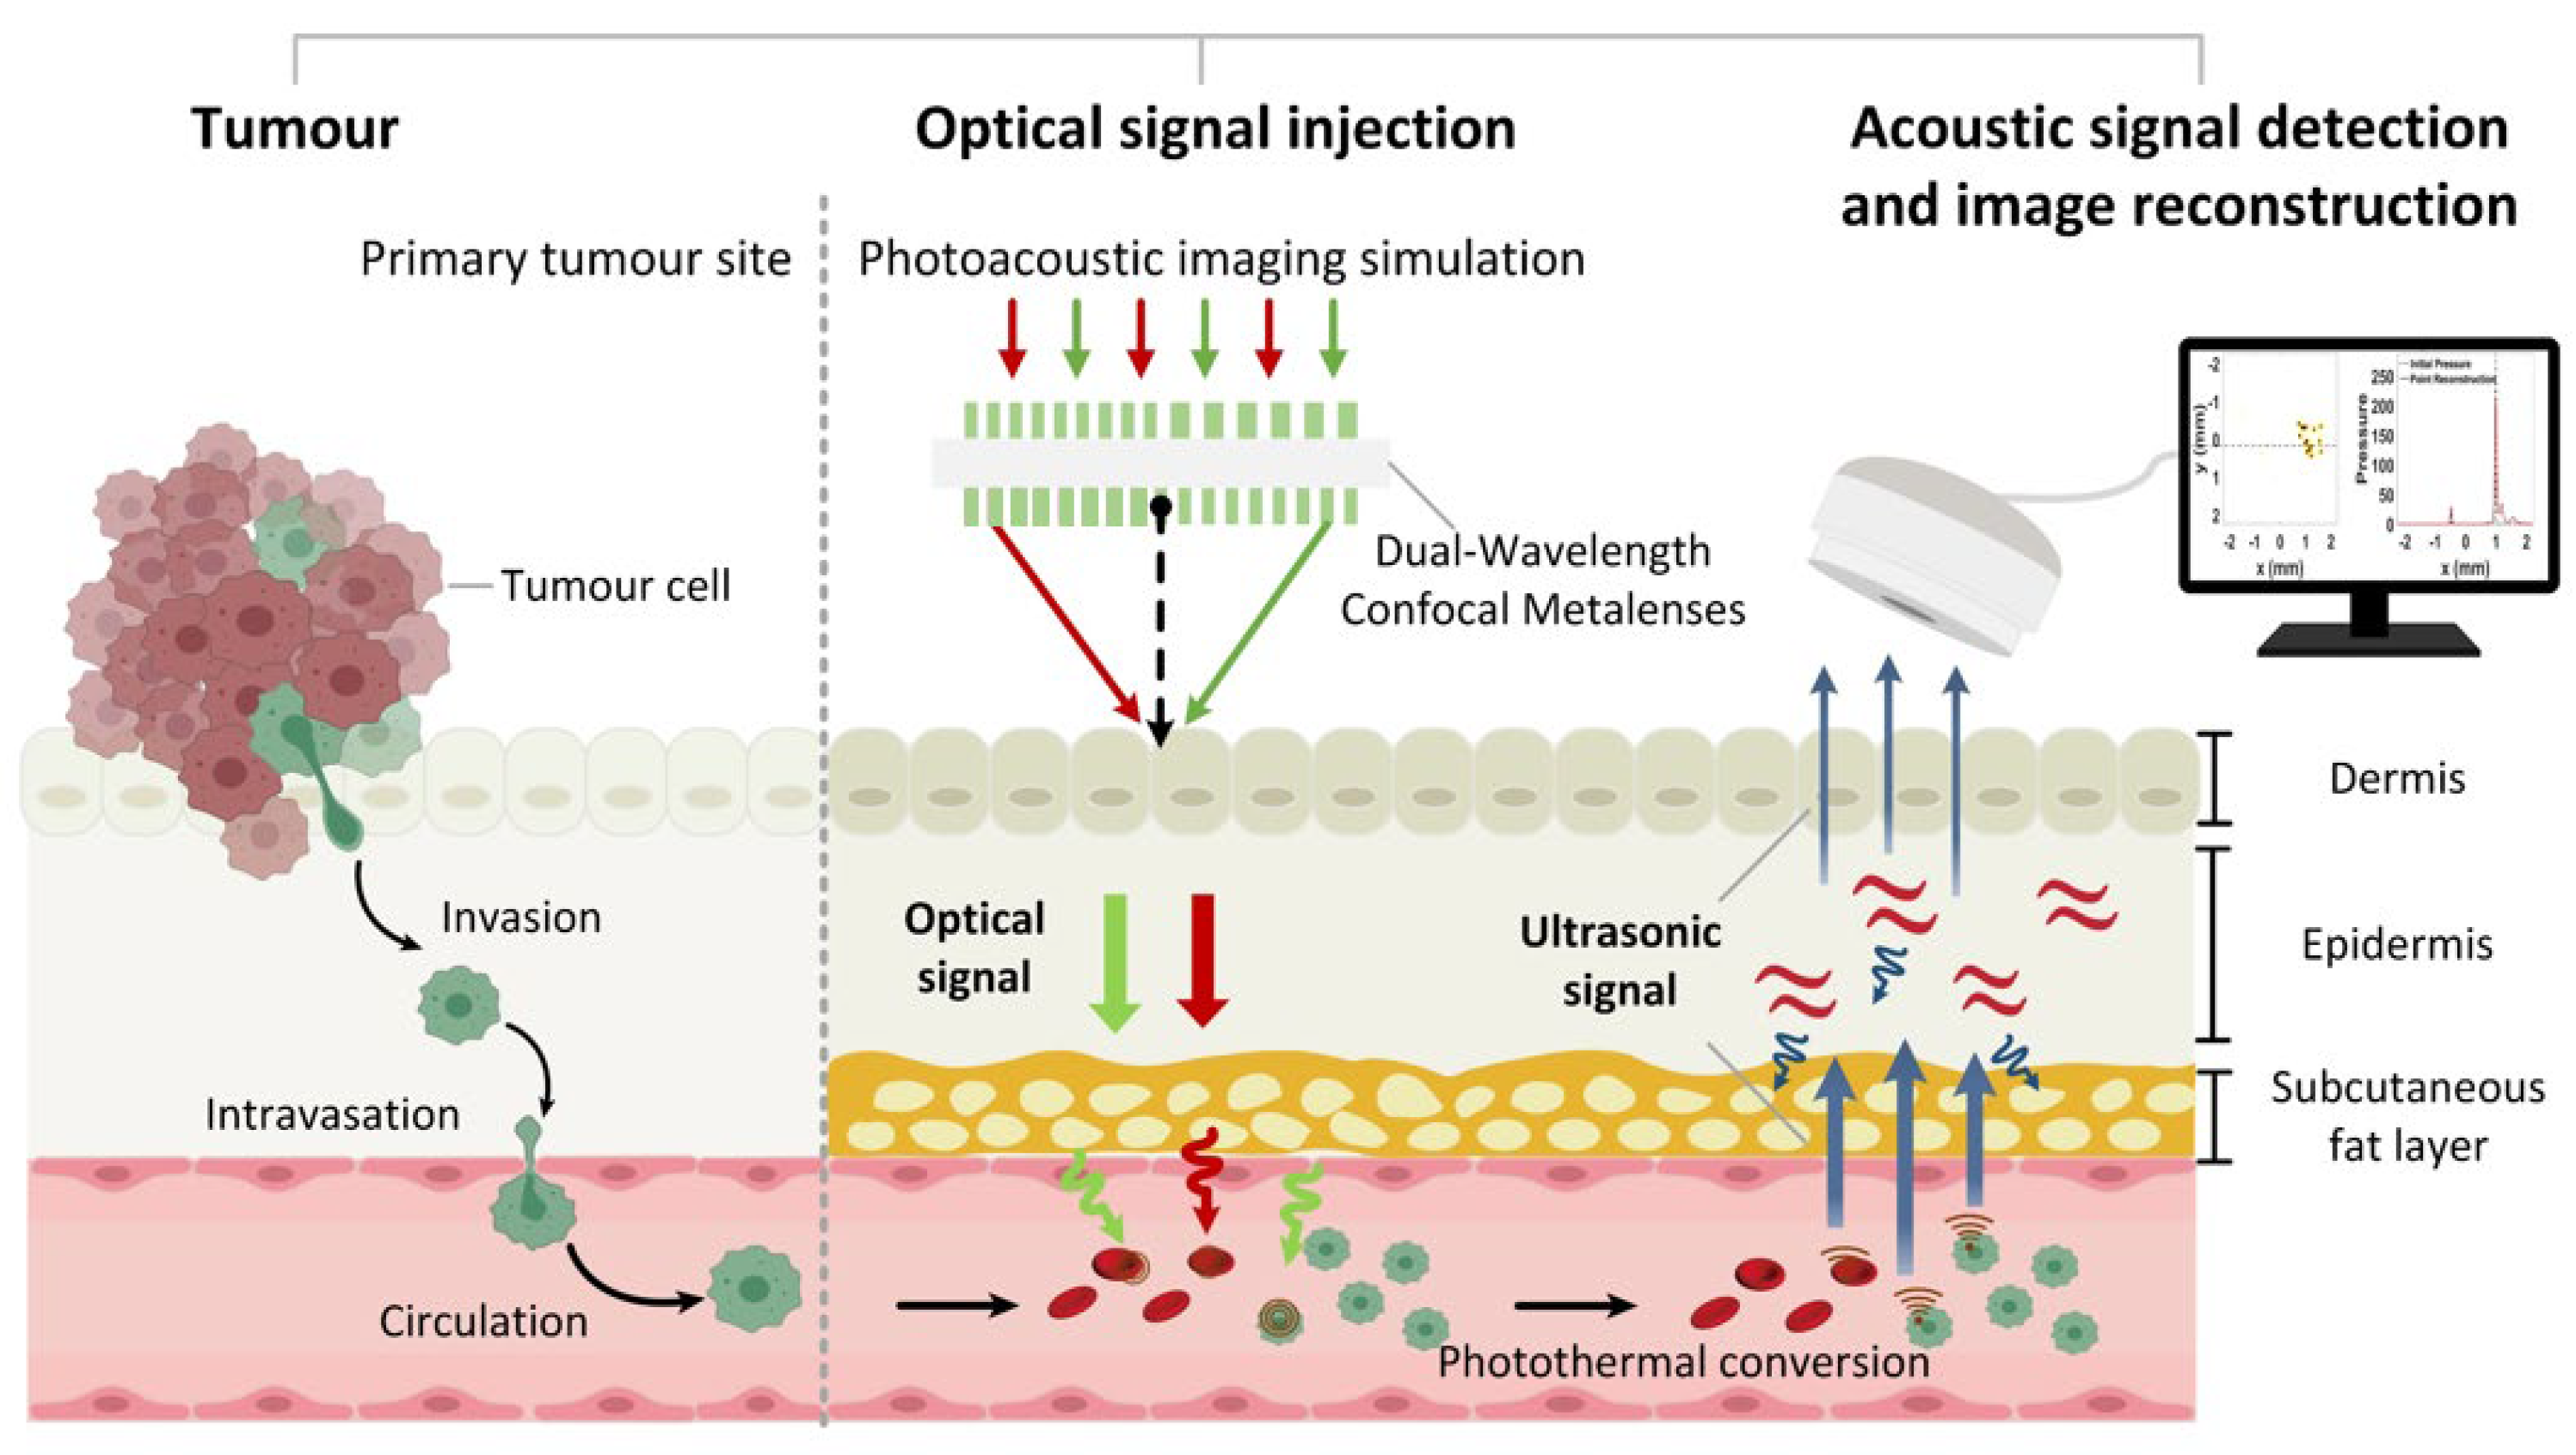
This work employs a method that combines Monte Carlo simulations with the photothermal conversion formula to convert optical field data into the initial pressure distribution within cells, which forms the basis for photoacoustic imaging simulation. The schematic diagram of photoacoustic imaging of cancer cells in blood vessels is shown in Figure 10. In order to take into account, the computing power of the computer and the accuracy of the results, the discrete grid points in the x, y and z directions are set to 450 in the three-dimensional calculation grid of MATLAB. The boundary condition is set as the perfect matching layer (PML), which can effectively suppress the interference of boundary reflection on the simulation results.
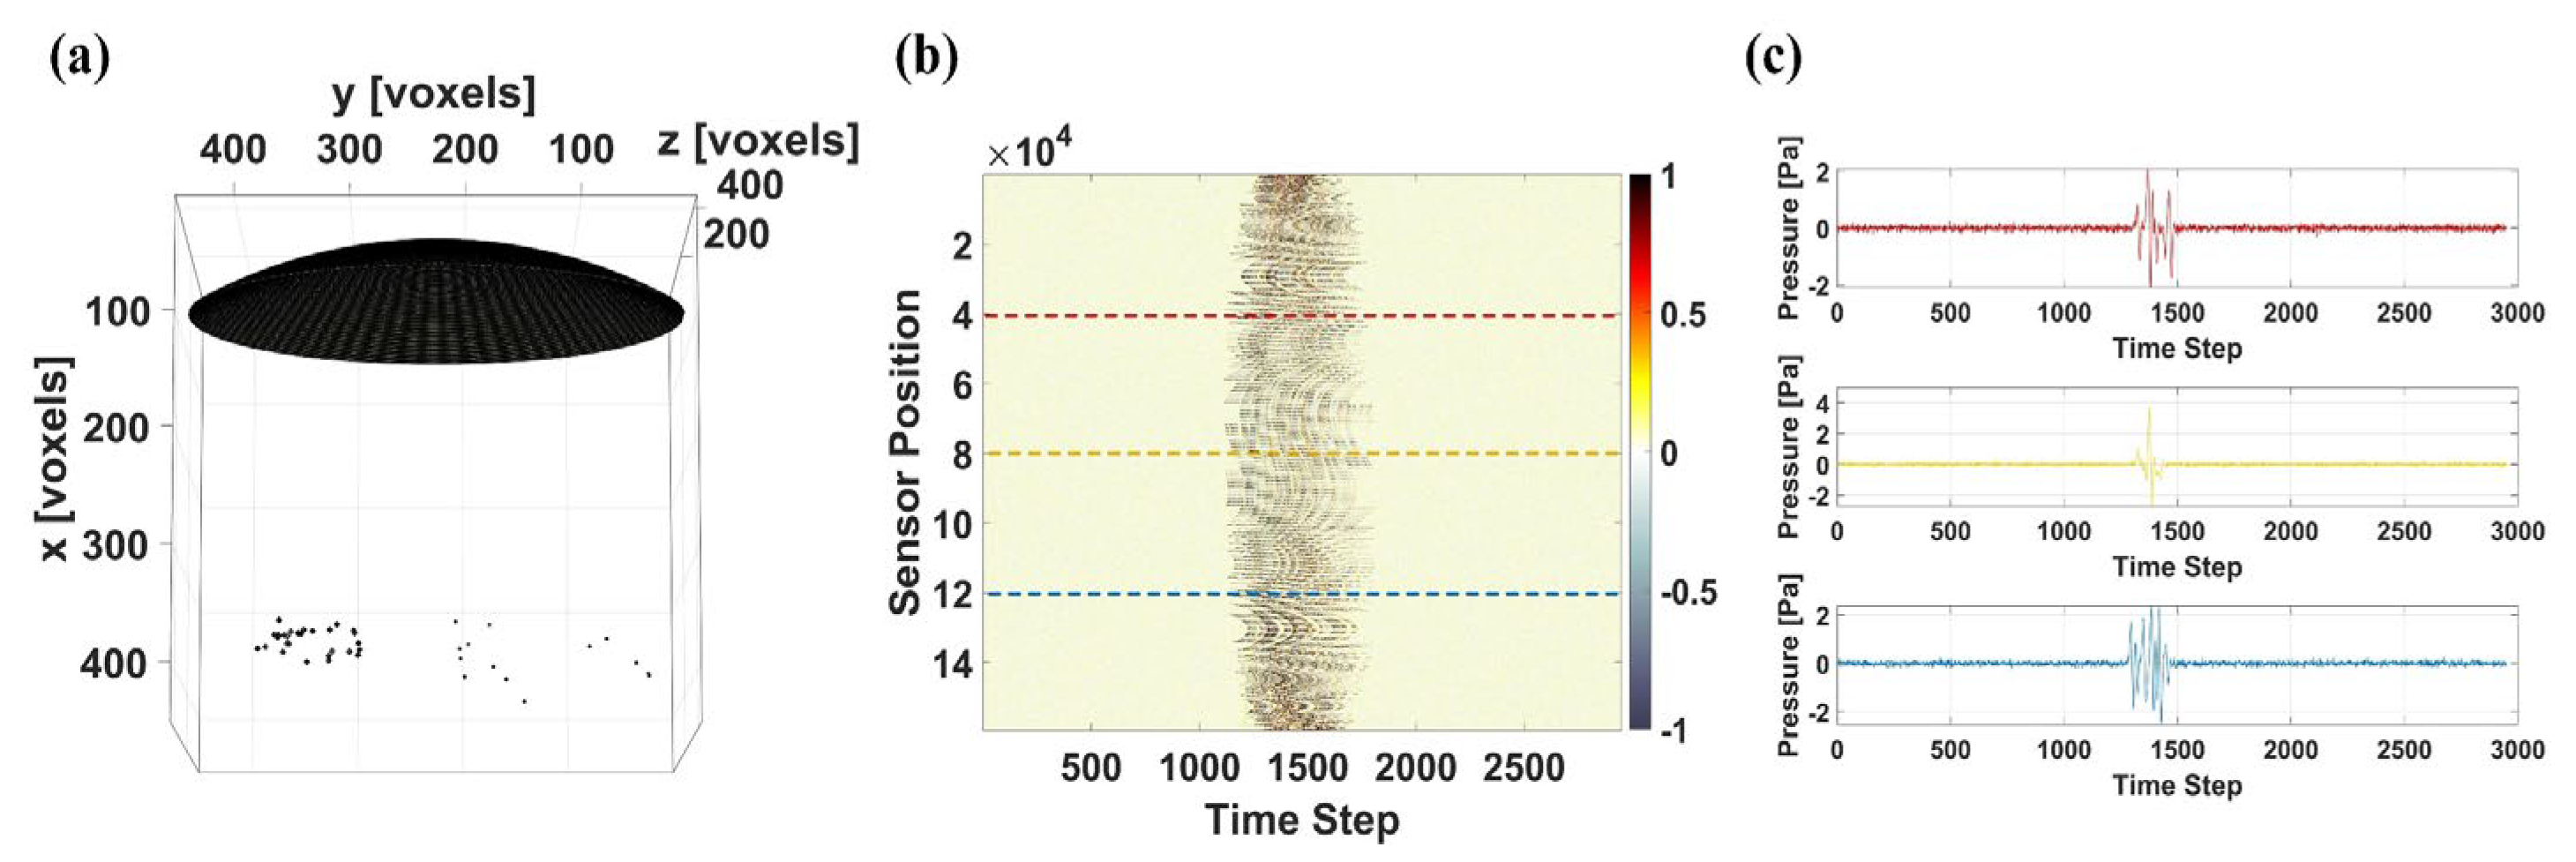
Then, based on the time inversion algorithm, we reconstruct the collected data after the sensor receives the photoacoustic signal. The sensor setup and initial pressure distribution are shown in Figure 11a. In order to more realistically simulate the effects of noise in real environment, the signal-to-noise ratio of 40% was set during the reconstruction process (Figure 11b). At the same time, to ensure the uncertainty of the distribution of cancer cells in blood vessels, they were randomly distributed in the imaging area in each photoacoustic imaging simulation. This contributes to enhancing the precision of the final results. Due to the limitation of computing power, the number of red blood cells is set to be small. Sufficient red blood cells are more conducive to developing blood vessels.
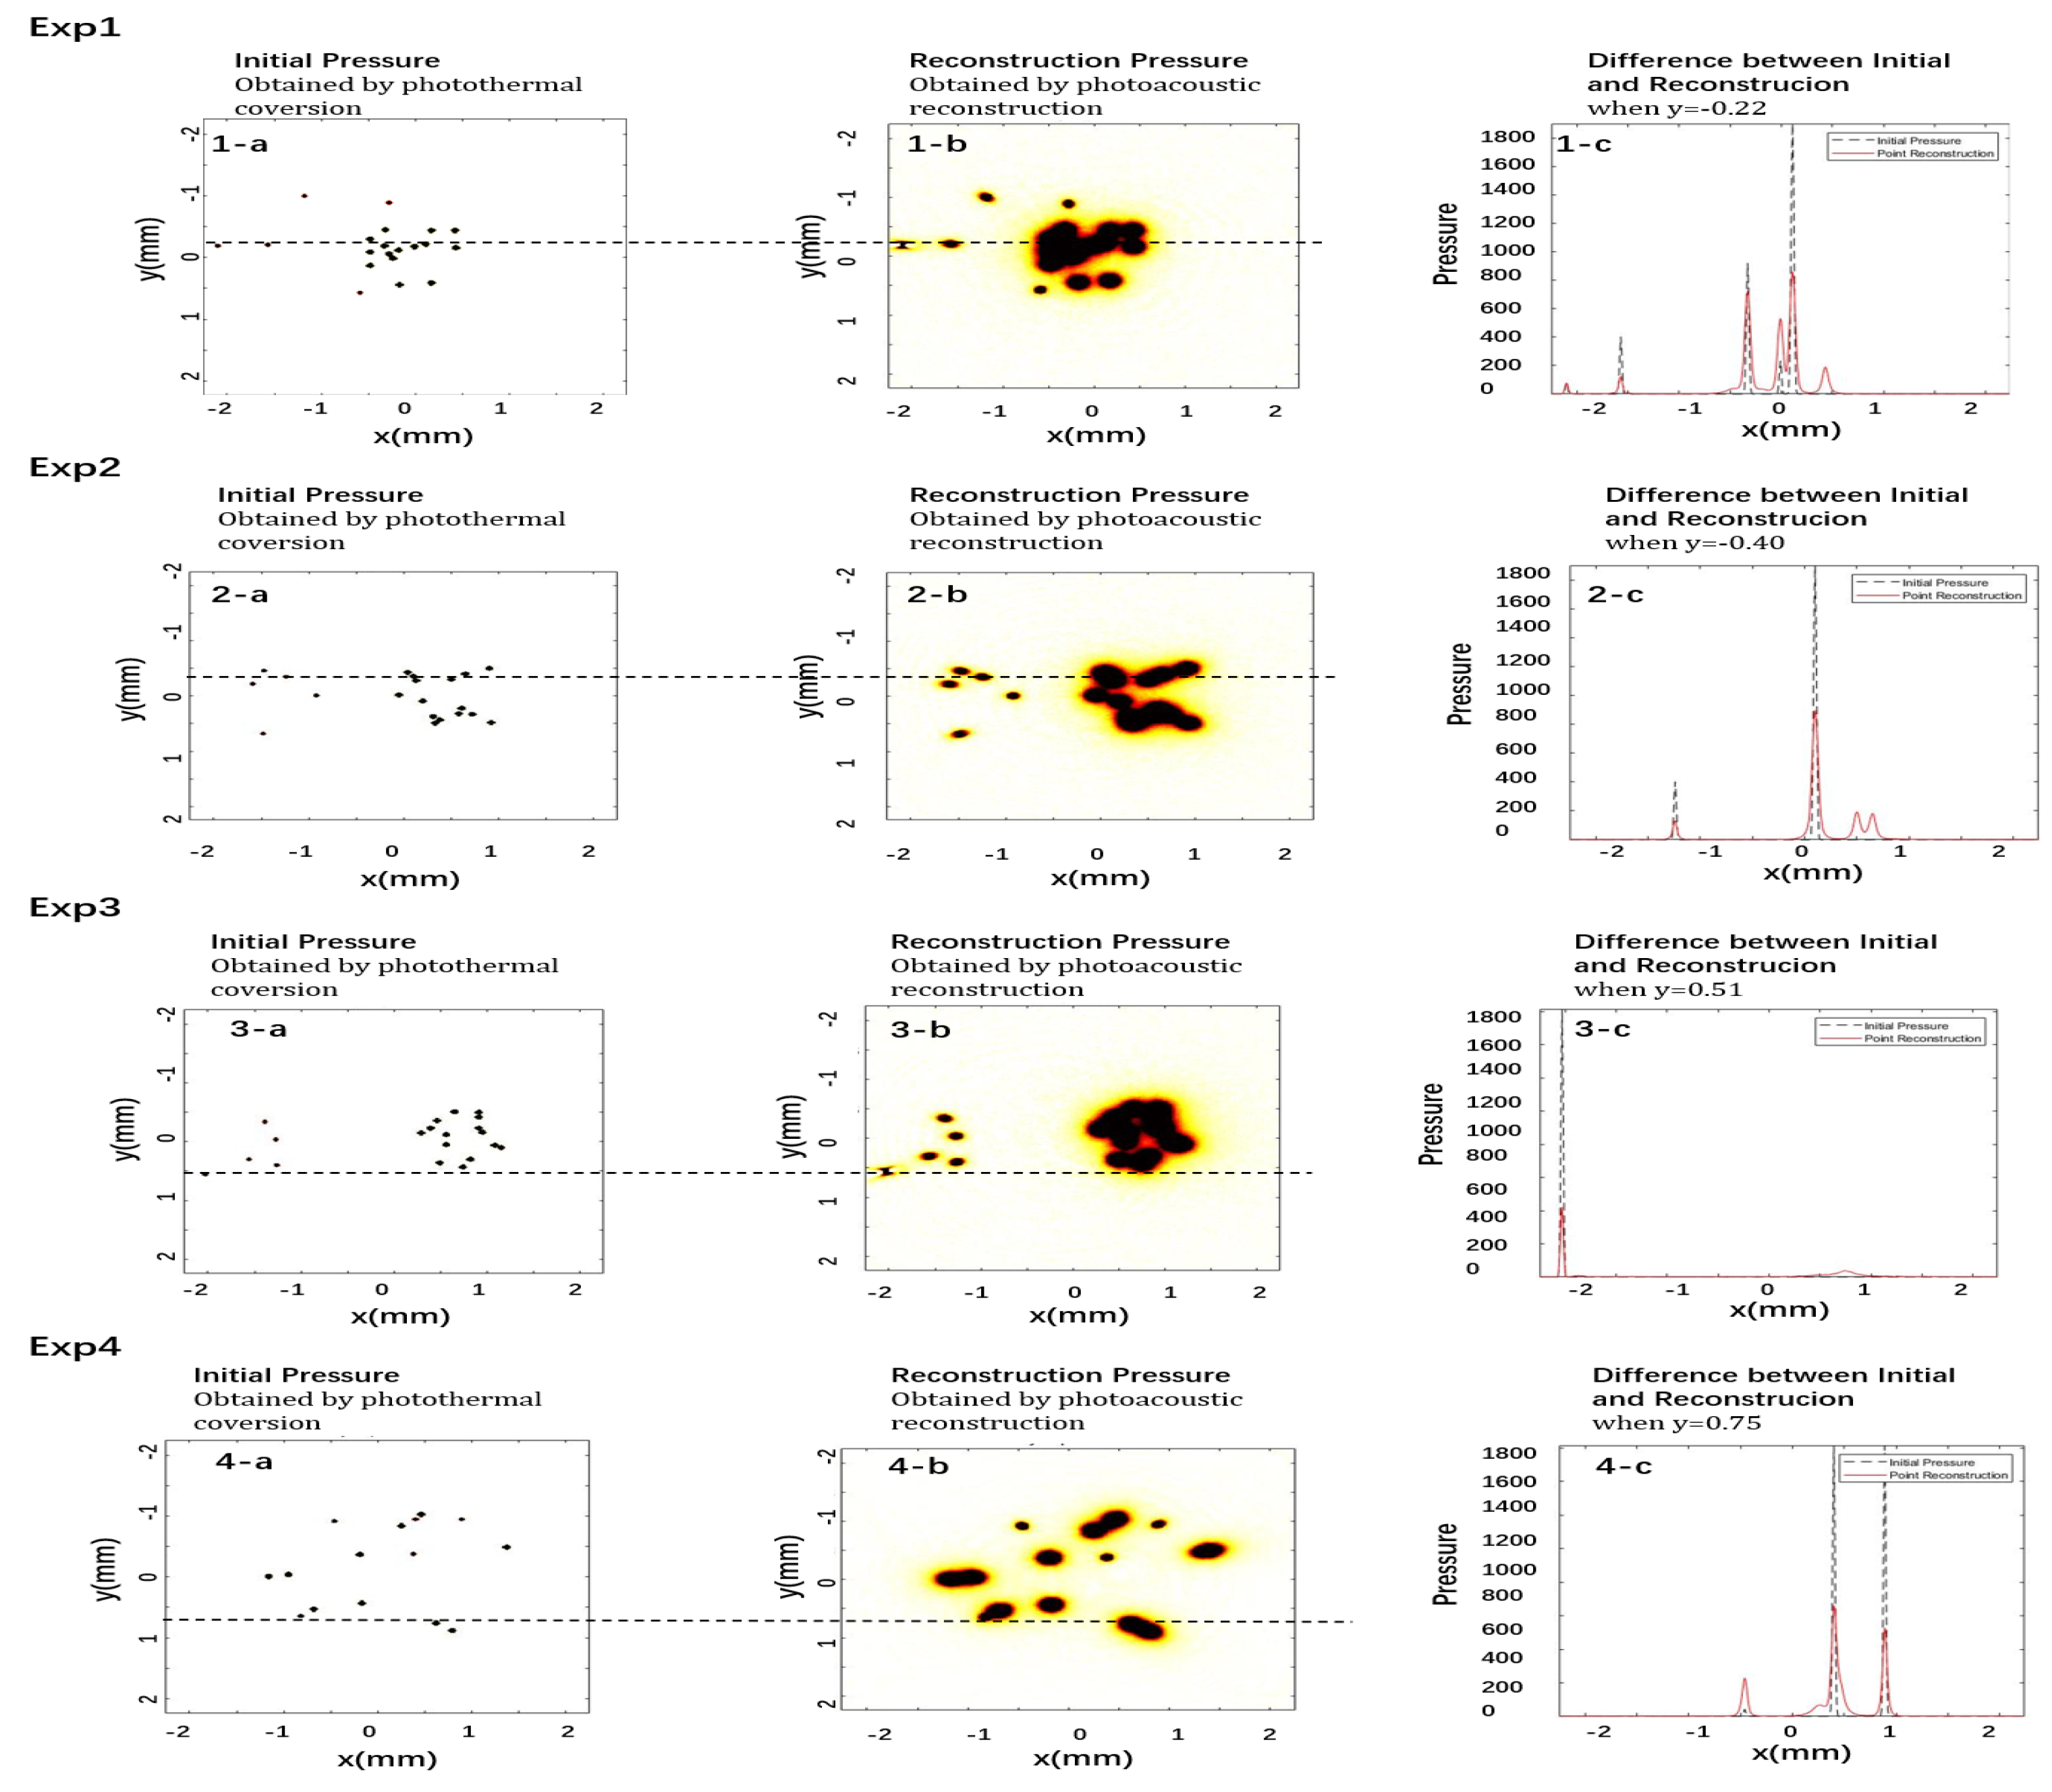
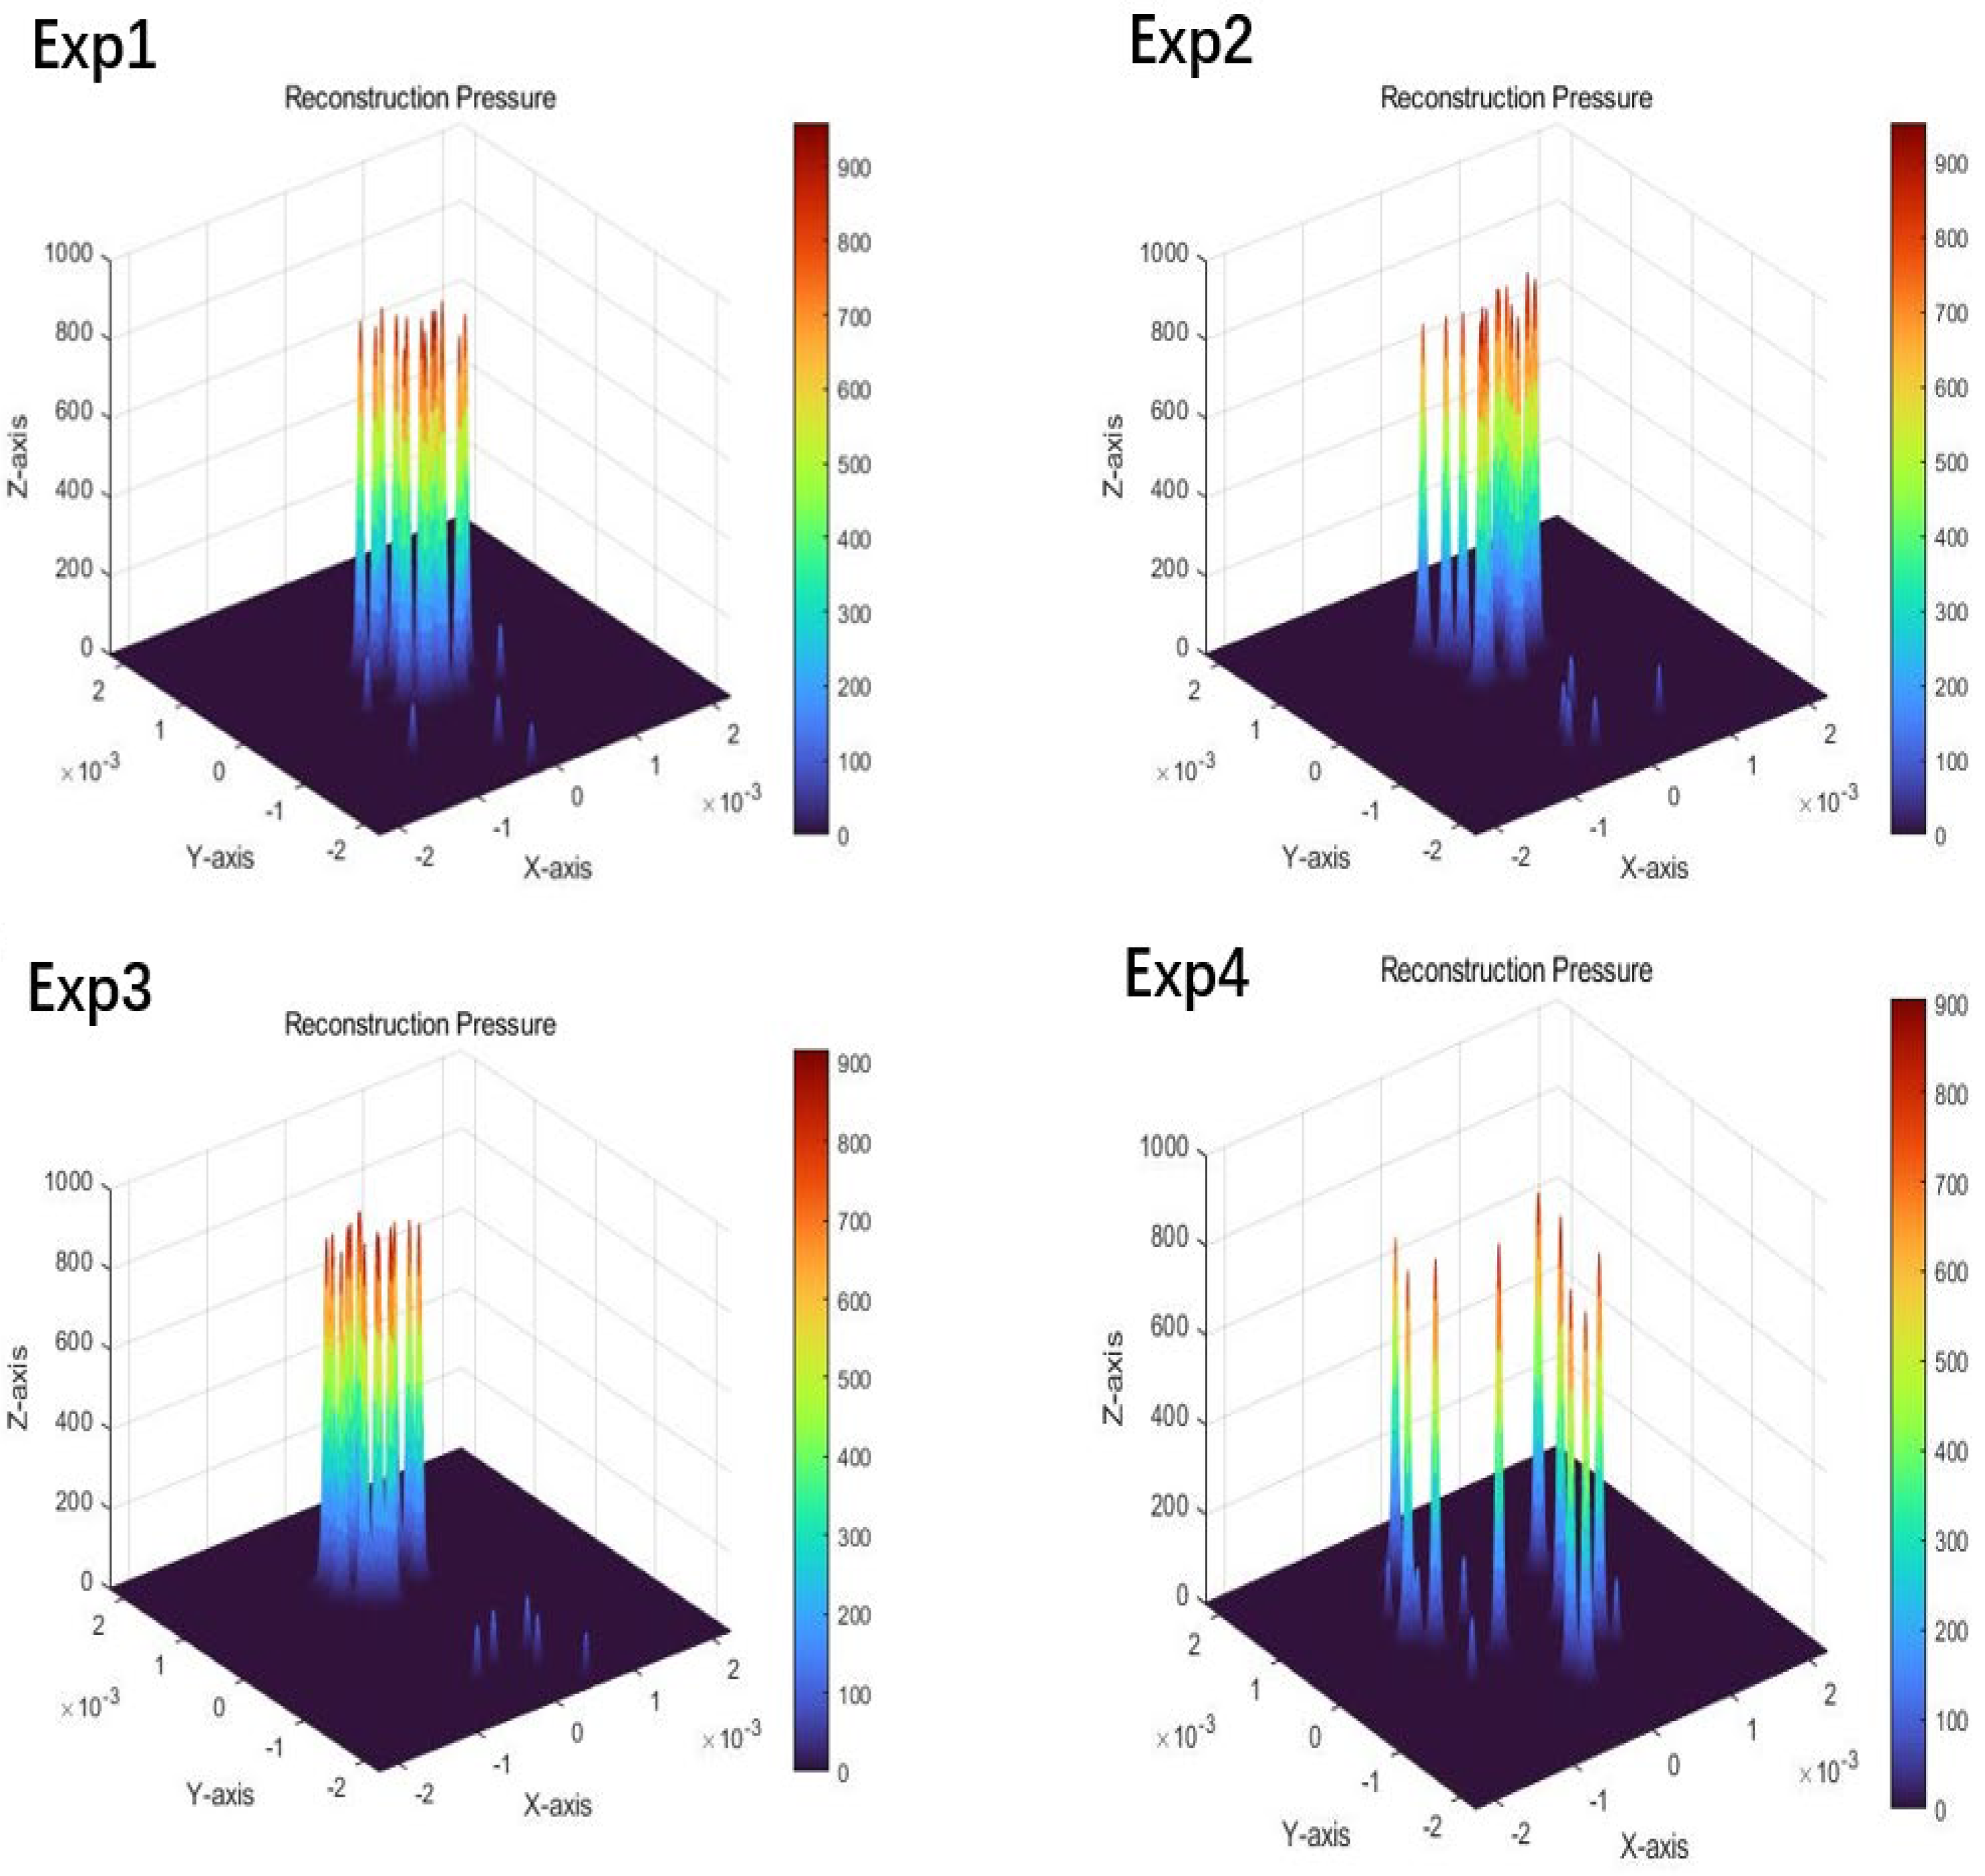
The photoacoustic signal reconstruction results are recorded in Figure 12. As shown in Figure 12(c(1–4)), although the reconstructed pressure has a slight numerical deviation under the influence of propagation loss and noise in the medium, its sound pressure distribution is highly consistent with it of the initial sound pressure. This shows that the location of cancer cell imaging is basically consistent with the initial, which is helpful to the diagnosis of cancer status and subsequent treatment. In addition, the average sound pressure of red blood cells and cancer cells was calculated for each experiment, and the results were recorded in Figure 13 and Table 5. The results showed that the acoustic pressure of cancer cells was significantly higher than that of normal cells. This implies that cancer cells can be more easily identified in photoacoustic images.
Integrated results demonstrate that the novel dual-wavelength confocal metalens structure we developed for photoacoustic imaging can effectively implement photoacoustic imaging and differentiate between cancerous and normal cells. Compared with related studies, while achieving comparable focusing efficiency, our design innovatively incorporates a filtering structure that effectively controls the transmission wavelengths of light, significantly enhancing the overall system stability [38]. The metalens structure can be configured into an array to enhance detection capability for cancer cells. Given the required high uniformity in optical performance across all constituent metalens units within the array [39], this study focuses on characterizing the focusing properties of a single metalens element, whose performance effectively represents the collective behavior of the entire array system.

4. Discussion and Conclusions

With the continuous advancement of technology, non-invasive cancer detection and treatment are gradually becoming feasible. Photoacoustic imaging has attracted widespread attention as a promising modality for enhancing therapeutic efficacy while minimizing side effects. This technique is a non-invasive or minimally invasive imaging method that does not require the use of radioactive materials, thus significantly reducing patient risk and discomfort. Additionally, photoacoustic imaging enables real-time imaging and dynamic monitoring of physiological parameters such as tumor blood flow and oxygenation status. This provides valuable insights into tumor angiogenesis, hypoxia, and metabolic activity, which are crucial for cancer staging and treatment planning. However, single-wavelength photoacoustic imaging is susceptible to background noise, and due to the lack of multi-spectral information, its imaging contrast may be limited.
This study demonstrates a novel dual-metasurface metalens capable of co-focusing visible and infrared light, with a minimal focal length difference of only 2.43 μm (f532 = 98.85 μm, f785 = 96.42 μm). The focused spot sizes for both wavelengths are nearly at the nanoscale, meeting the resolution requirements for photoacoustic imaging. Through dual-wavelength photoacoustic imaging, light absorption information at both wavelengths can be obtained, enabling more precise and efficient differentiation between normal and cancerous cells. This approach has significant application value, particularly in early cancer diagnosis, detection of micro-metastases, and precise delineation of tumor boundaries. Moreover, the gold nanoparticles used as contrast agents for tumor cells in this study are not only harmless to the human body at appropriate dosages but also significantly enhance the contrast of photoacoustic imaging. This technology shows significant potential for monitoring cancer progression and can provide effective guidance for developing subsequent treatment plans, such as photothermal therapy and photodynamic therapy.
The dual-wavelength co-focusing metalens-based high-contrast photoacoustic imaging method proposed in this study has achieved promising results in simulations, demonstrating its potential for cancer cell monitoring and treatment. However, the use of dual metasurface structures and spatial multiplexing techniques introduces optical losses, affecting focusing efficiency and requiring further optimization. Additionally, although the study simulated real-world conditions by constructing a skin model and incorporating noise, the complexity of practical applications necessitates experimental validation. Future studies are expected to build upon this work or refine existing approaches, advancing the clinical translation of dual-wavelength metalens-based photoacoustic imaging technology.

Author Contributions

Conceptualization, Z.C., R.Z., H.Z., B.Z., L.Q., J.D., T.Z. and B.W.; methodology, Z.C., H.Z. and R.Z.; software, Z.C., H.Z. and R.Z.; validation, Z.C., H.Z. and R.Z.; formal analysis, Z.C., H.Z. and R.Z.; investigation, B.Z., L.Q., J.D., T.Z. and B.W.; resources, Z.C., H.Z. and R.Z.; data curation, Z.C., R.Z. and H.Z.; writing—original draft preparation, Z.C., H.Z. and R.Z.; writing—review and editing, T.Z. and B.W.; visualization, Z.C., H.Z. and R.Z.; supervision, B.Z., L.Q., J.D., T.Z. and B.W.; project administration, T.Z. and B.W.; funding acquisition, T.Z. and B.W. All authors have read and agreed to the published version of the manuscript.

Funding

This research was supported by Key Technology Tackling and Industrialization Pilot Projects in Qingdao City(24-1-4-xxgg-20-nsh).

Institutional Review Board Statement

Not applicable.

Informed Consent Statement

Not applicable.

Data Availability Statement

The data presented in this study are available from the corresponding author upon request.

Conflicts of Interest

Author Bingqiang Zhang was employed by the company Qingdao Restore Medical Laboratory Co., Ltd. The remaining authors declare that the research was conducted in the absence of any commercial or financial relationships that could be construed as a potential conflict of interest.

References

  1. Bray, F.; Laversanne, M.; Sung, H.; Ferlay, J.; Siegel, R.L.; Soerjomataram, I.; Jemal, A. Global cancer statistics 2022: GLOBOCAN estimates of incidence and mortality worldwide for 36 cancers in 185 countries. CA A Cancer J. Clin. 2024, 74, 229–263. [Google Scholar] [CrossRef] [PubMed]
  2. Momose, A. Phase-sensitive imaging and phase tomography using X-ray interferometers. Opt. Express 2003, 11, 2303–2314. [Google Scholar] [CrossRef]
  3. Wang, Y.; Ge, X.; Ma, H.; Qi, S.; Zhang, G.; Yao, Y. Deep Learning in Medical Ultrasound Image Analysis: A Review. IEEE Access 2021, 9, 54310–54324. [Google Scholar] [CrossRef]
  4. Yao, J.; Wang, L.V. Perspective on fast-evolving photoacoustic tomography. J. Biomed. Opt. 2021, 26, 060602. [Google Scholar] [CrossRef]
  5. Wang, L.V.; Yao, J. A practical guide to photoacoustic tomography in the life sciences. Nat. Methods 2016, 13, 627–638. [Google Scholar] [CrossRef]
  6. Yao, J.; Wang, L.V. Photoacoustic tomography: Fundamentals, advances and prospects. Contrast Media Mol. Imaging 2011, 6, 332–345. [Google Scholar] [CrossRef]
  7. Bell, A.G. On the production and reproduction of sound by light. Am. J. Sci. 1880, 20, 305–324. [Google Scholar] [CrossRef]
  8. Xu, M.; Wang, L.V. Photoacoustic imaging in biomedicine. Rev. Sci. Instrum. 2006, 77, 041101. [Google Scholar] [CrossRef]
  9. Razansky, D. Volumetric multi-spectral optoacoustic tomography for high performance structural, functional, and molecular imaging. J. Acoust. Soc. Am. 2016, 140 (Suppl. 4), 2978–2979. [Google Scholar] [CrossRef]
  10. Tang, J.; Coleman, J.E.; Dai, X.; Jiang, H. Wearable 3-D Photoacoustic Tomography for Functional Brain Imaging in Behaving Rats. Sci. Rep. 2016, 6, 25470. [Google Scholar] [CrossRef]
  11. Gottschalk, S.; Fehm, T.F.; Deán-Ben, X.L.; Razansky, D. Noninvasive real-time visualization of multiple cerebral hemodynamic parameters in whole mouse brains using five-dimensional optoacoustic tomography. J. Cereb. Blood Flow Metab. Off. J. Int. Soc. Cereb. Blood Flow Metab. 2015, 35, 531–535. [Google Scholar] [CrossRef]
  12. Wang, L.; Maslov, K.; Xing, W.; Garcia-Uribe, A.; Wang, L.V. Video-rate functional photoacoustic microscopy at depths. J. Biomed. Opt. 2012, 17, 106007. [Google Scholar] [CrossRef]
  13. Ahmed, R.; Butt, H. Metalens sensors: Strain-Multiplex Metalens Array for Tunable Focusing and Imaging (Adv. Sci. 4/2021). Adv. Sci. 2021, 8, 2170019. [Google Scholar] [CrossRef]
  14. Cui, T.J. Microwave metamaterials. Natl. Sci. Rev. 2018, 5, 134–136. [Google Scholar] [CrossRef]
  15. Jahani, S.; Jacob, Z. All-dielectric metamaterials. Nat. Nanotechnol. 2016, 11, 23–36. [Google Scholar] [CrossRef]
  16. Jang, M.; Horie, Y.; Shibukawa, A.; Brake, J.; Liu, Y.; Kamali, S.M.; Arbabi, A.; Ruan, H.; Faraon, A.; Yang, C. Wavefront shaping with disorder-engineered metasurfaces. Nat. Photonics 2018, 12, 84–90. [Google Scholar] [CrossRef]
  17. Yang, Y.; Wang, W.; Moitra, P.; Kravchenko, I.I.; Briggs, D.P.; Valentine, J. Dielectric Meta-Reflectarray for Broadband Linear Polarization Conversion and Optical Vortex Generation. Nano Lett. 2014, 14, 1394–1399. [Google Scholar] [CrossRef] [PubMed]
  18. Aieta, F.; Genevet, P.; Yu, N.; Kats, M.A.; Gaburro, Z.; Capasso, F. Out-of-Plane Reflection and Refraction of Light by Anisotropic Optical Antenna Metasurfaces with Phase Discontinuities. Nano Lett. 2012, 12, 1702–1706. [Google Scholar] [CrossRef]
  19. Huang, L.; Chen, X.; Mühlenbernd, H.; Li, G.; Bai, B.; Tan, Q.; Jin, G.; Zentgraf, T.; Zhang, S. Dispersionless Phase Discontinuities for Controlling Light Propagation. Nano Lett. 2012, 12, 5750–5755. [Google Scholar] [CrossRef]
  20. Wang, S.; Wu, P.C.; Su, V.-C.; Lai, Y.-C.; Hung Chu, C.; Chen, J.-W.; Lu, S.-H.; Chen, J.; Xu, B.; Kuan, C.-H.; et al. Broadband achromatic optical metasurface devices. Nat. Commun. 2017, 8, 187. [Google Scholar] [CrossRef] [PubMed]
  21. Aieta, F.; Kats, M.A.; Genevet, P.; Capasso, F. Multiwavelength achromatic metasurfaces by dispersive phase compensation. Science 2015, 347, 1342–1345. [Google Scholar] [CrossRef]
  22. Khorasaninejad, R.; Shi, Z.; Zhu, A.; Chen, W.T.; Sanjeev, V.; Capasso, F. Achromatic Metalens over 60 nm Bandwidth in the Visible and Metalens with Reverse Chromatic Dispersion. Nano Lett. 2017, 17, 1819–1824. [Google Scholar] [CrossRef]
  23. Ou, X.; Zeng, T.; Zhang, Y.; Jiang, Y.; Gong, Z.; Fan, F.; Jia, H.; Duan, H.; Hu, Y. Tunable Polarization-Multiplexed Achromatic Dielectric Metalens. Nano Lett. 2022, 22, 10049–10056. [Google Scholar] [CrossRef]
  24. Cao, R.; Kilroy, J.P.; Ning, B.; Wang, T.; Hossack, J.A.; Hu, S. Multispectral photoacoustic microscopy based on an optical–acoustic objective. Photoacoustics 2015, 3, 55–59. [Google Scholar] [CrossRef]
  25. Chao, L.; Jiangbo, C.; Yachao, Z.; Jingyi, Z.; Lidai, W. Five-wavelength optical-resolution photoacoustic microscopy of blood and lymphatic vessels. Adv. Photonics 2021, 3, 016002. [Google Scholar] [CrossRef]
  26. Barulin, A.; Park, H.; Park, B.; Kim, I. Dual-wavelength UV-visible metalens for multispectral photoacoustic microscopy: A simulation study. Photoacoustics 2023, 32, 100545. [Google Scholar] [CrossRef] [PubMed]
  27. Kesharwani, P.; Ma, R.; Sang, L.; Fatima, M.; Sheikh, A.; Abourehab, M.A.S.; Gupta, N.; Chen, Z.-S.; Zhou, Y. Gold nanoparticles and gold nanorods in the landscape of cancer therapy. Mol. Cancer 2023, 22, 98. [Google Scholar] [CrossRef] [PubMed]
  28. Goddard, Z.R.; Marín, M.J.; Russell, D.A.; Searcey, M. Active targeting of gold nanoparticles as cancer therapeutics. Chem. Soc. Rev. 2020, 49, 8774–8789. [Google Scholar] [CrossRef]
  29. Vines, J.B.; Yoon, J.-H.; Ryu, N.-E.; Lim, D.-J.; Park, H. Gold Nanoparticles for Photothermal Cancer Therapy. Front. Chem. 2019, 7, 167. [Google Scholar] [CrossRef]
  30. Chen, X.; Huang, L.; Mühlenbernd, H.; Li, G.; Bai, B.; Tan, Q.; Jin, G.; Qiu, C.-W.; Zhang, S.; Zentgraf, T. Dual-polarity plasmonic metalens for visible light. Nat. Commun. 2012, 3, 1198. [Google Scholar] [CrossRef]
  31. Arbabi, E.; Arbabi, A.; Kamali, S.M.; Horie, Y.; Faraon, A. Controlling the sign of chromatic dispersion in diffractive optics with dielectric metasurfaces. Optica 2017, 4, 625–632. [Google Scholar] [CrossRef]
  32. Yu, N.; Genevet, P.; Kats, M.A.; Aieta, F.; Tetienne, J.-P.; Capasso, F.; Gaburro, Z. Light Propagation with Phase Discontinuities: Generalized Laws of Reflection and Refraction. Science 2011, 334, 333–337. [Google Scholar] [CrossRef]
  33. Treeby, B.; Zhang, E.; Cox, B. Photoacoustic tomography in absorbing acoustic media using time reversal. Inverse Probl. Inverse Probl. 2010, 26157, 115003–115020. [Google Scholar] [CrossRef]
  34. Sim, J.Y.; Ahn, C.-G.; Jeong, E.-J.; Kim, B.K. In vivo Microscopic Photoacoustic Spectroscopy for Non-Invasive Glucose Monitoring Invulnerable to Skin Secretion Products. Sci. Rep. 2018, 8, 1059. [Google Scholar] [CrossRef]
  35. Andrieux, A.; Mennemanteuil, M.-M.; Geoffroy, N.; Emo, M.; Markey, L.; Hammani, K. Optimized ICPCVD-Based TiO2 for Photonics. Materials 2022, 15, 2578. [Google Scholar] [CrossRef]
  36. Hassaan, M.; Saleem, U.; Singh, A.; Haque, A.J.; Wang, K. Recent Advances in Positive Photoresists: Mechanisms and Fabrication. Materials 2024, 17, 2552. [Google Scholar] [CrossRef]
  37. Fan, Z.; Xu, L.; Zhou, B.; Chen, T. Fabrication of Anti-Reflective Composite Structures on Inverted Pyramids Using Inductively Coupled Plasma Etching. Micromachines 2025, 16, 503. [Google Scholar] [CrossRef]
  38. Barulin, A.; Barulina, E.; Oh, D.K.; Jo, Y.; Park, H.; Park, S.; Kye, H.; Kim, J.; Yoo, J.; Kim, J.; et al. Axially multifocal metalens for 3D volumetric photoacoustic imaging of neuromelanin in live brain organoid. Science advances 2025, 11, eadr0654. [Google Scholar] [CrossRef] [PubMed]
  39. Zhang, Y.; Jiang, X.; Qu, G.; Han, J.; Li, C.; Bo, B.; Ruan, Q.; Liu, Z.; Song, Q.; Xiao, S. On-chip integration of achromatic metalens arrays. Nat. Commun. 2025, 16, 7485. [Google Scholar] [CrossRef]
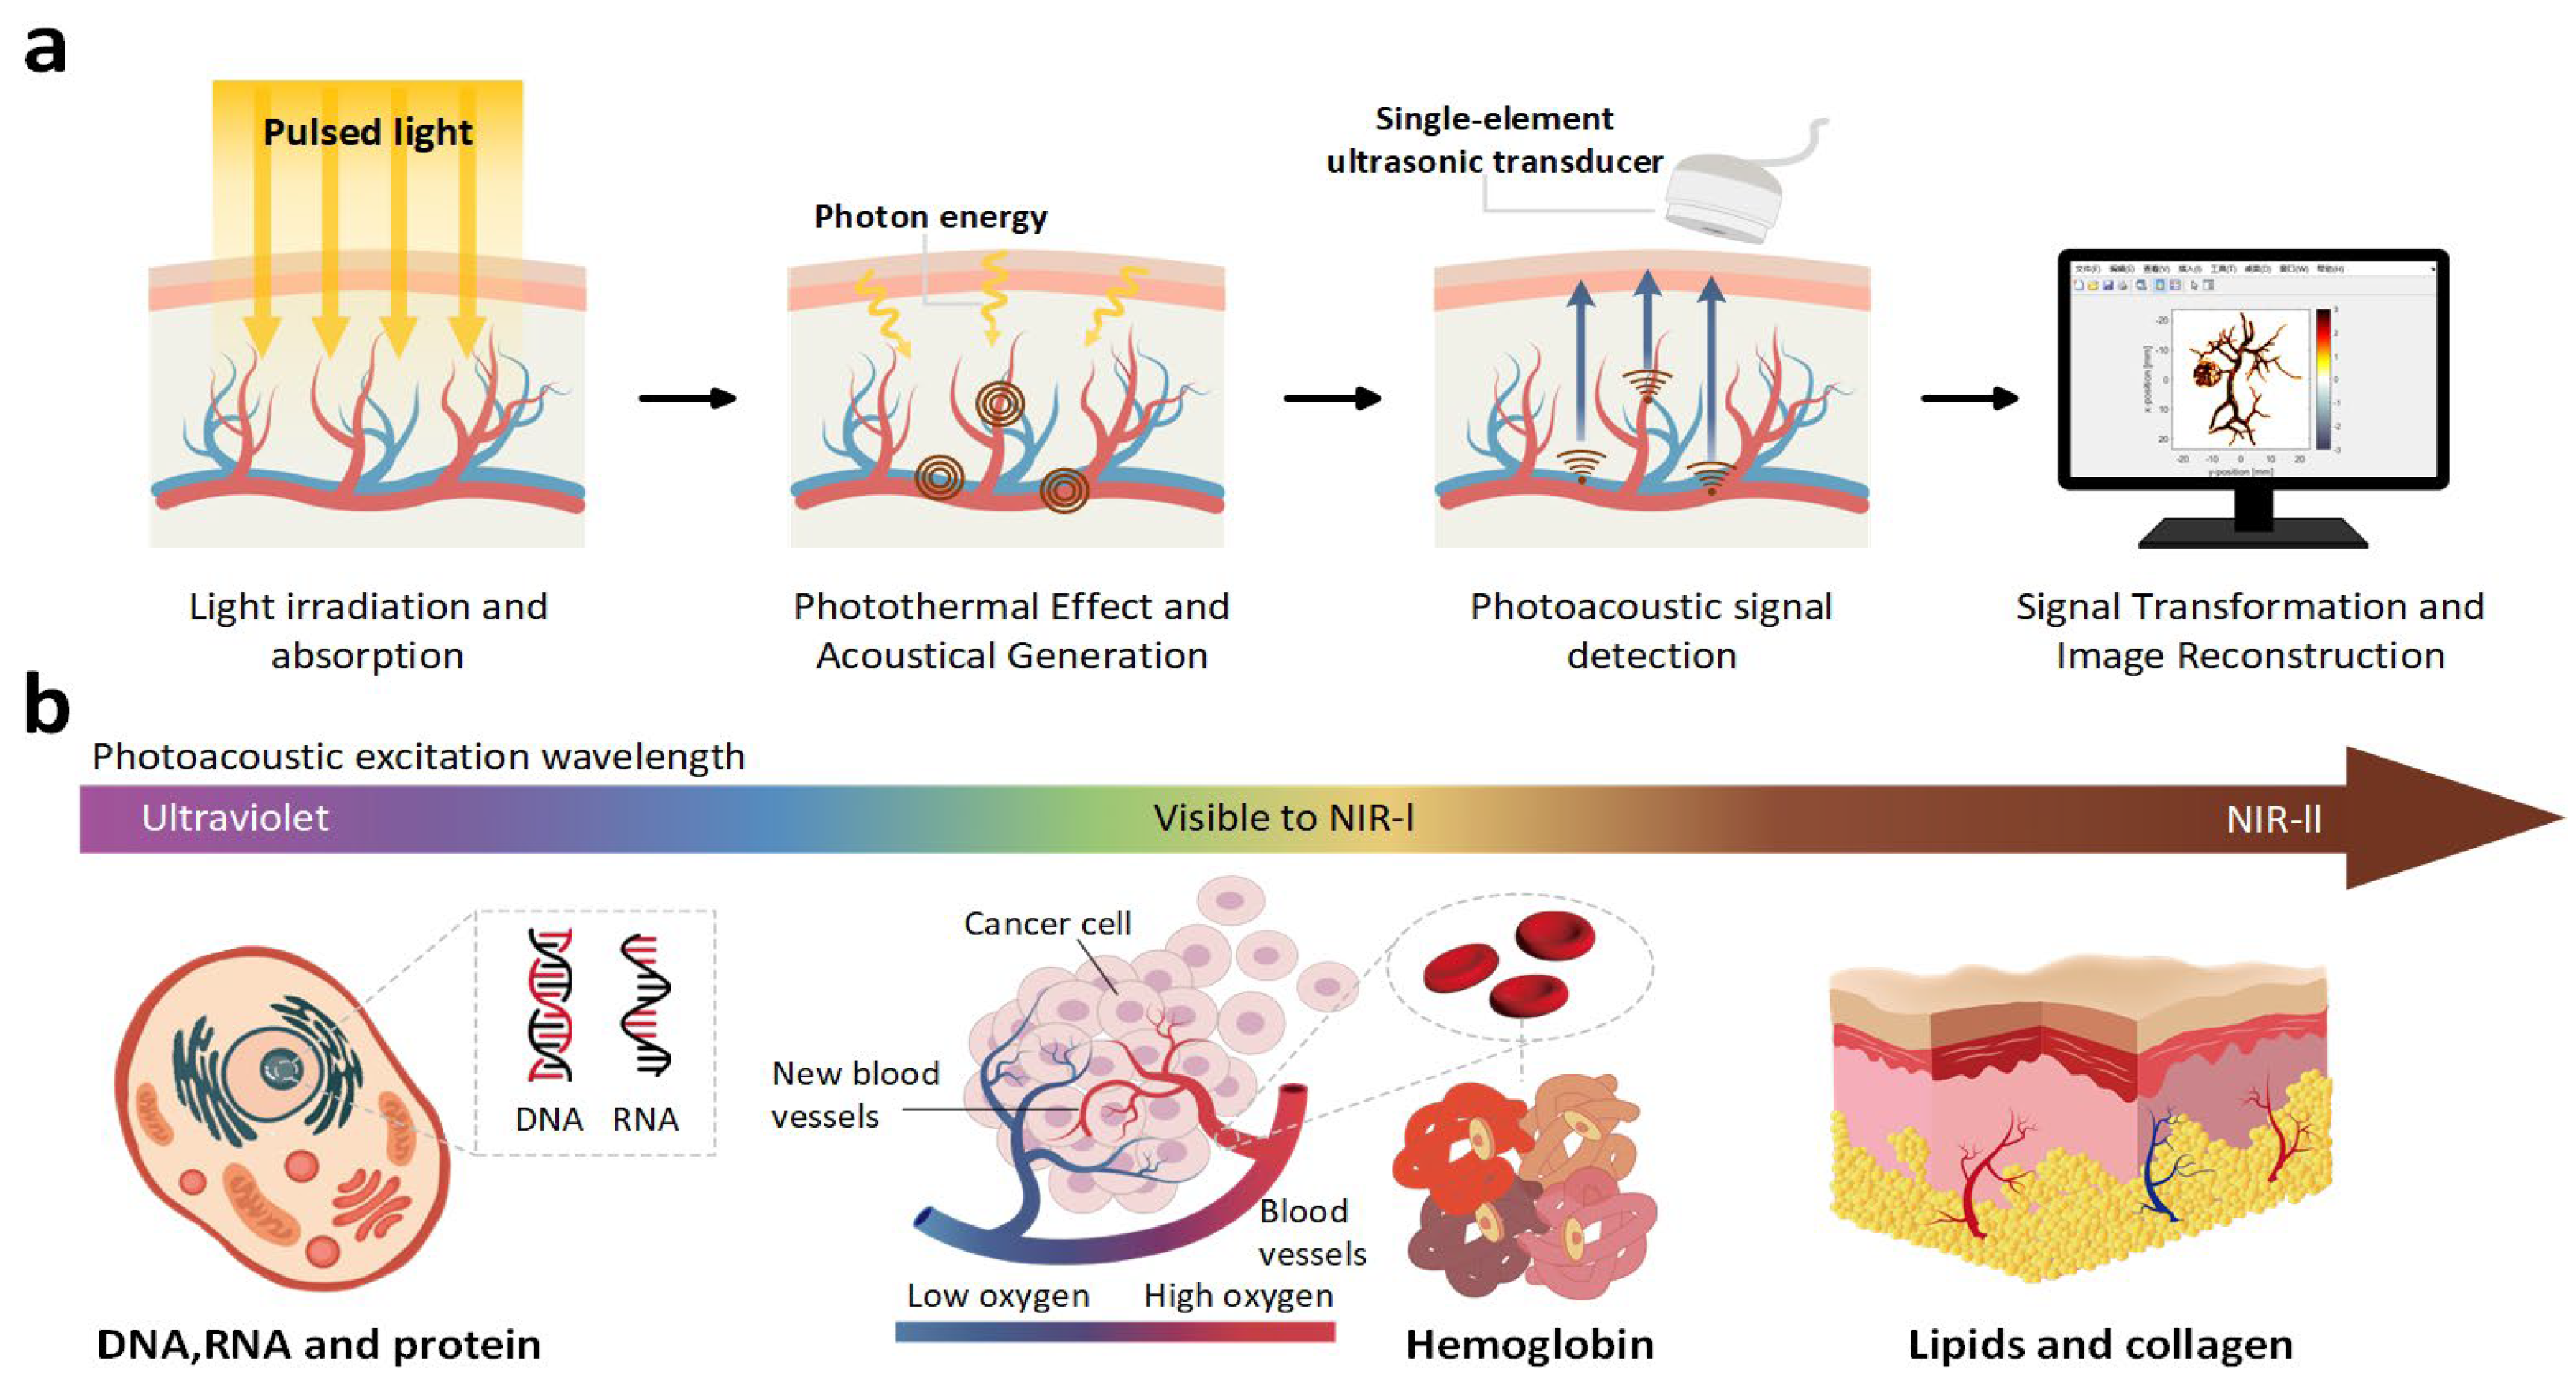
Figure 1. (a) Schematic diagram of photoacoustic imaging. (b) Schematic diagram of skin structure and cellular architecture.
Photonics 12 01053 g001
Figure 2. Flowchart of the overall simulation strategy.
Photonics 12 01053 g002
Figure 3. Unit structure and phase response: (a) Design for 532 nm operation. (b) Phase shift vs. radius at 532 nm. (c) Design for 785 nm operation. (d) Phase shift vs. radius at 785 nm.
Photonics 12 01053 g003
Figure 4. Scanning optimization results of the unit structures. For 532 nm: (a) Phase of the outgoing light as a function of the unit radius and height. (b) Transmission distribution of the unit structure. (c,d) Phase and Transmission of the outgoing light as a function of the unit radius at a fixed height (H) of 0.8 μm. For 785 nm: (e) Phase of the outgoing light as a function of the unit radius and height. (f) Transmission distribution of the unit structure. (g,h) Phase and Transmission of the outgoing light as a function of the unit radius at a fixed height (H) of 1.0 μm.
Photonics 12 01053 g004
Figure 5. (a) The unit structure used for filtering wavelength of 532 nm. (b) The transmittance of the unit structure in the 532 nm–785 nm band. (c) The unit structure used for filtering wavelength of 785 nm. (d) The transmittance of the unit structure in the 532 nm–785 nm band.
Photonics 12 01053 g005
Figure 6. The diagram of skin model.
Photonics 12 01053 g006
Figure 7. (a) Phase error between target and simulation (532 nm). (b) Light field propagation diagram and intensity profile along the z-axis at 532 nm. (c) Intensity distribution at the focal plane and transverse intensity profile at 532 nm. (d) Phase error between target and simulation (785 nm). (e) Light field propagation diagram and intensity profile along the z-axis at 785 nm. (f) Intensity distribution at the focal plane and transverse intensity profile at 785 nm.
Photonics 12 01053 g007
Figure 8. (a) Schematic diagram of the metalens structure: Side view of the metalens (Left), Top view (middle-upper), and bottom view (middle-lower). (b) Light field propagation diagram. (c) Intensity profile along the z-axis at wavelengths of 532 nm and 785 nm. (d) Left: Intensity distribution at the focal plane for 532 nm. Right: Intensity distribution at the focal plane for 785 nm.
Photonics 12 01053 g008
Figure 9. Potential simple diagram of the manufacturing process. Three black arrows point to the front side, the back side, and the photolithography area, respectively.
Photonics 12 01053 g009
Figure 10. Schematic illustration of cancer cell dissemination and photoacoustic imaging detection.
Photonics 12 01053 g010
Figure 11. (a) Sensor setup and initial pressure distribution diagram. (b) Acoustic signal received by the sensor after adding noise. (c) Schematic diagram of acoustic signal received by the sensor at different positions on the time step.
Photonics 12 01053 g011
Figure 12. Reconstruction diagram of the photoacoustic signal: (a(14)). Initial pressure distribution profile. (b(14)). Reconstruction pressure distribution profile. (c(14)). Difference between initial and reconstruction (Random location.).
Photonics 12 01053 g012
Figure 13. Three-dimensional reconstruction histogram of pressure distribution. (Corresponding to Exp1–4 in Figure 12).
Photonics 12 01053 g013
Table 1. The acoustic properties of the physical layer.
Physical LayerAcoustic Properties
Ρ (kg·m−3)Vc (m·s−1)Zc
(kg·m−2s−1)
L (mm)
Dermis120016451.7 × 10−60.1
Epidermis120015951.7 × 10−61.4
Subcutaneous fat layer100014501.7 × 10−62
Blood10015001.7 × 10−61
Table 2. The optical properties of the physical layer at 532 nm.
Physical LayerOptical Properties (532 nm)
μ a (mm−1) μ s (mm−1)gnL (mm)
Dermis1.44 ± 0.697.04 ± 1.480.91.340.1
Epidermis0.10 ± 0.033.96 ± 0.890.91.391.4
Subcutaneous fat layer0.15 ± 0.071.89 ± 0.450.91.442
Table 3. The optical properties of the physical layer at 785 nm.
Physical LayerOptical Properties (785 nm)
μ a (mm−1) μ s (mm−1)gnL (mm)
Dermis0.17 ± 0.093.17 ± 0.850.91.330.1
Epidermis0.07 ± 0.011.45 ± 0.290.91.401.4
Subcutaneous fat layer0.04 ± 0.021.18 ± 0.170.91.442
Table 4. Cell photothermal conversion parameters.
Cell Type532 nm785 nm
Γ μ a Γ μ a
Red blood cell0.20.150.10.01
Cancer cells (with AuNPs)0.30.20.20.2
Table 5. The results of 3D PA.
Exp CodeInitialReconstruction
NumberNumberPressure (Pa)
NormalCancerNormalCancerNormalCancer
Exp1515515123.75861.78
Exp2515515132.61897.67
Exp3718515117.12904.5
Exp41411510132.31818.82
Disclaimer/Publisher’s Note: The statements, opinions and data contained in all publications are solely those of the individual author(s) and contributor(s) and not of MDPI and/or the editor(s). MDPI and/or the editor(s) disclaim responsibility for any injury to people or property resulting from any ideas, methods, instructions or products referred to in the content.