Article

Numerical Simulation and Microstructure Examination of a Low-Alloy Structural Steel for Laser Transformation Hardening Treatment

School of Mechanical Engineering, Nantong Institute of Technology, Nantong 226001, China
*
Author to whom correspondence should be addressed.
Photonics 2025, 12(10), 992; https://doi.org/10.3390/photonics12100992
Submission received: 18 July 2025 / Revised: 28 September 2025 / Accepted: 7 October 2025 / Published: 8 October 2025
(This article belongs to the Section Lasers, Light Sources and Sensors)

Abstract

The surface treated by laser phase transformation hardening exhibits superior hardness, enhanced wear resistance, and refined grain structure. In this study, both single-track and two-track laser phase transformation hardening processes were numerically simulated, with the simulation accuracy being verified experimentally. Furthermore, the optimal overlap rate for laser two-track overlay was predicted based on the simulation results. An S355J2G3 metal block specimen was used as a case, numerical simulations of the phase transformation coupled with the temperature field on the specimen’s surface under laser irradiation were carried out using SYSWELD2019 software. The surface temperature distribution and the evolution of phase volume fractions were analyzed. Additionally, the changes in the temperature field within the softening zone and the distribution of tempering structures resulting from two-track laser overlay were examined. The discrepancy between experimental and simulated results for the hardening layer width was approximately 10%, while the error rates for the hardening layer depth and the tempering softening zone were below 5% and 10%, respectively. Based on simulations conducted with varying overlap rates, the flatness metric produces the best results at 50% overlap under these laser processing parameters.

1. Introduction

S355J2G3 is a low-alloy high-strength structural steel widely used in construction, bridges, vehicle manufacturing, and engineering machinery due to its excellent mechanical properties and good weldability. However, in practical applications, its surface is prone to wear, corrosion, or fatigue damage when exposed to harsh environments over time, which can affect its service life and performance stability. Laser surface treatment, such as laser hardening, laser cladding, laser-induced periodic surface structures, or laser surface modification, can effectively enhance its surface hardness, wear resistance, and corrosion resistance. This significantly improves the material’s overall performance, extends its service life, reduces maintenance costs, and meets the requirements for high strength and long service life. Laser phase transformation hardening is a widely utilized surface treatment technique that enhances the surface properties of materials without compromising their overall structure or intrinsic properties [1,2]. The process involves using a high-energy laser as a heat source to rapidly elevate the surface temperature of the metal to a level between the phase transformation point and the melting point. Once the laser beam moves away from the irradiated area, the surface cools rapidly, completing the phase transformation hardening in an instant. This rapid cooling produces a high-hardness, ultrafine martensitic structure on the surface without requiring external cooling media such as oil or water [3,4,5]. As a result, the surface hardness and wear resistance are improved, compressive stresses are induced, and the fatigue strength of the material is increased [6,7]. Laser surface phase transformation hardening significantly enhances the performance of parts, thereby extending their service life. However, when large areas require hardening, multi-track overlay techniques must be employed, and the softening that occurs between overlapping tracks has emerged as a critical challenge limiting broader application [8].
Numerical simulation involves the use of models to replicate the essential processes occurring in real systems, enabling the study of both existing and designed systems through experimentation on system models. In laser phase transformation hardening simulations, most researchers rely on temperature fields to approximate the phase transformation areas. However, due to the impact of subsequent laser passes, the martensite produced during initial phase transformation hardening undergoes tempering to varying degrees within certain temperature ranges. As a result, relying on the temperature field alone does not allow for precise definition of the softening zone morphology or the volume fraction of tempered martensite. Numerous studies have focused on the process parameters and numerical simulation methods for laser phase transformation hardening. For example, Li et al. [9] utilized the CALPHAD method to calculate the physical parameters of the temperature field post-phase transformation hardening, emphasizing the interaction with plastic deformation, thereby establishing a theoretical basis for predicting residual stresses and optimizing process parameters. Muthukumaran et al. [10] reviewed the development of laser phase transformation hardening methods, studying the effects of various laser types and process parameters on hardening depth, width, wear, corrosion resistance, and validating results through numerical simulations and experiments. Wang et al. [11] examined the influence of laser power and scanning speed on the friction, vibration, and noise performance of gray cast iron, finding that surface phase transformation hardening increased the surface hardness by over fourfold, shifted surface residual stresses from tensile to compressive, and significantly altered the friction coefficient, vibration, and noise characteristics. Zhang et al. [12] constructed a finite element model to conduct transient thermal analysis based on real process parameters, demonstrating that laser phase transformation hardening increased surface hardness by approximately 3.8 times compared to the base material. Hichem et al. [13] used SYSWELD for both experimental and numerical simulations of deformation caused by laser welding, achieving excellent agreement between experimental and simulation results in both thermal and mechanical aspects. Li et al. [14] studied the laser surface treatment of 1.0C-1.5Cr steel through numerical simulation, analyzing the effects of process parameters on peak temperature distribution and developing an empirical equation to predict peak temperature. Zhang et al. [15] used ABAQUS software to build a three-dimensional finite element model of pitch-bearing bushings and conducted temperature field analysis, examining the influence of laser power, scanning speed, and spot radius on the depth of hardening. Simplifying numerical simulation models for engineering applications can be advantageous, as demonstrated by Xu et al. [16], who developed a laser phase transformation hardening simulation for Cr12MoV materials using ANSYS’s transient thermal analysis module to predict the depth and width of the hardened layer and optimize process parameters. Schüßler et al. [17] proposed a finite element simulation model that incorporates the tempering effects occurring during laser surface phase transformation hardening of AISI 4140, aiming to enhance the accuracy of hardness and residual stress predictions in simulation models. There are a number of challenges in the laser phase change hardening process, including uneven thickness of the hardened layer, incomplete phase change, and tempering softening in the lap region of multi-lap laser phase change hardening, which directly affect the quality of the hardening. In addition, the main method of obtaining the laser phase change hardening process parameters is through experiments, but it is difficult to obtain the temperature field distribution of the phase change hardening process of the material during the experiments, which limits the precise control of the laser. Scholars have carried out the simulation of laser phase hardening on the workpiece, but most of them just simulate the change in its temperature field, and speculate the change in metallurgical organization through the change in temperature field, and the change in each phase of the specimen under different experimental parameters has been less studied.
Therefore, laser phase transformation hardening of S355J2G3 steel is investigated through a combination of experimental and simulation approaches. Microstructural analysis and performance characterization of the hardened samples were conducted using metallographic and scanning electron microscopy, hardness testing, and other analytical techniques. Finite element simulation was employed to analyze temperature variations within the hardened zone during the laser phase transformation hardening process and to examine the evolution of metallographic phases. The simulation also tracked the volume fraction changes in various phases during two-track overlay hardening to assess whether the process outcomes meet the desired performance criteria. Furthermore, the optimal overlap rate for a specific set of laser parameters was identified, providing valuable insights for the design and optimization of laser phase transformation hardening processes.

2. Materials and Methods

2.1. Heat Source Model

During laser phase transformation hardening, the temperature remains below the material’s melting point, preventing any melting throughout the process. The workpiece remains entirely in the solid state during phase transformation hardening. Consequently, the heat conduction partial differential equation provides a mathematical framework for describing the temperature field during laser phase transformation hardening. In this process, the laser irradiates the specimen surface in the form of a spot, with the heat flux density distribution within the circular spot approximately following a Gaussian distribution function [8]. The heat is primarily concentrated at the center of the spot and diffuses longitudinally into the material’s depth. Laser phase transformation hardening can improve the hardness and wear resistance of the specimen surface through micro-melting treatment, while increasing the width and depth of the hardened layer. However, this process also increases the residual stress and surface roughness of the material surface. In the experimental expectations, the specimen surface should not exhibit melting phenomena. The 2D Gaussian heat source model is suitable for simulating the situation where the sample surface does not melt under laser exposure. Therefore, a two-dimensional Gaussian heat source (Figure 1) is employed as the heat source model for laser phase transformation hardening. The temperature field during this process can be described by the following heat conduction partial differential equation:
x λ T x + y ( λ T y ) + z λ T z + Q ( x ,   y ,   z ,   t ) = ρ C p T t
where C p is the heat capacity, Q ( x ,   y ,   z ,   t ) is the latent heat of phase transformation, ρ is the material density, λ is the thermal conductivity.

2.2. Establishment of the Numerical Model

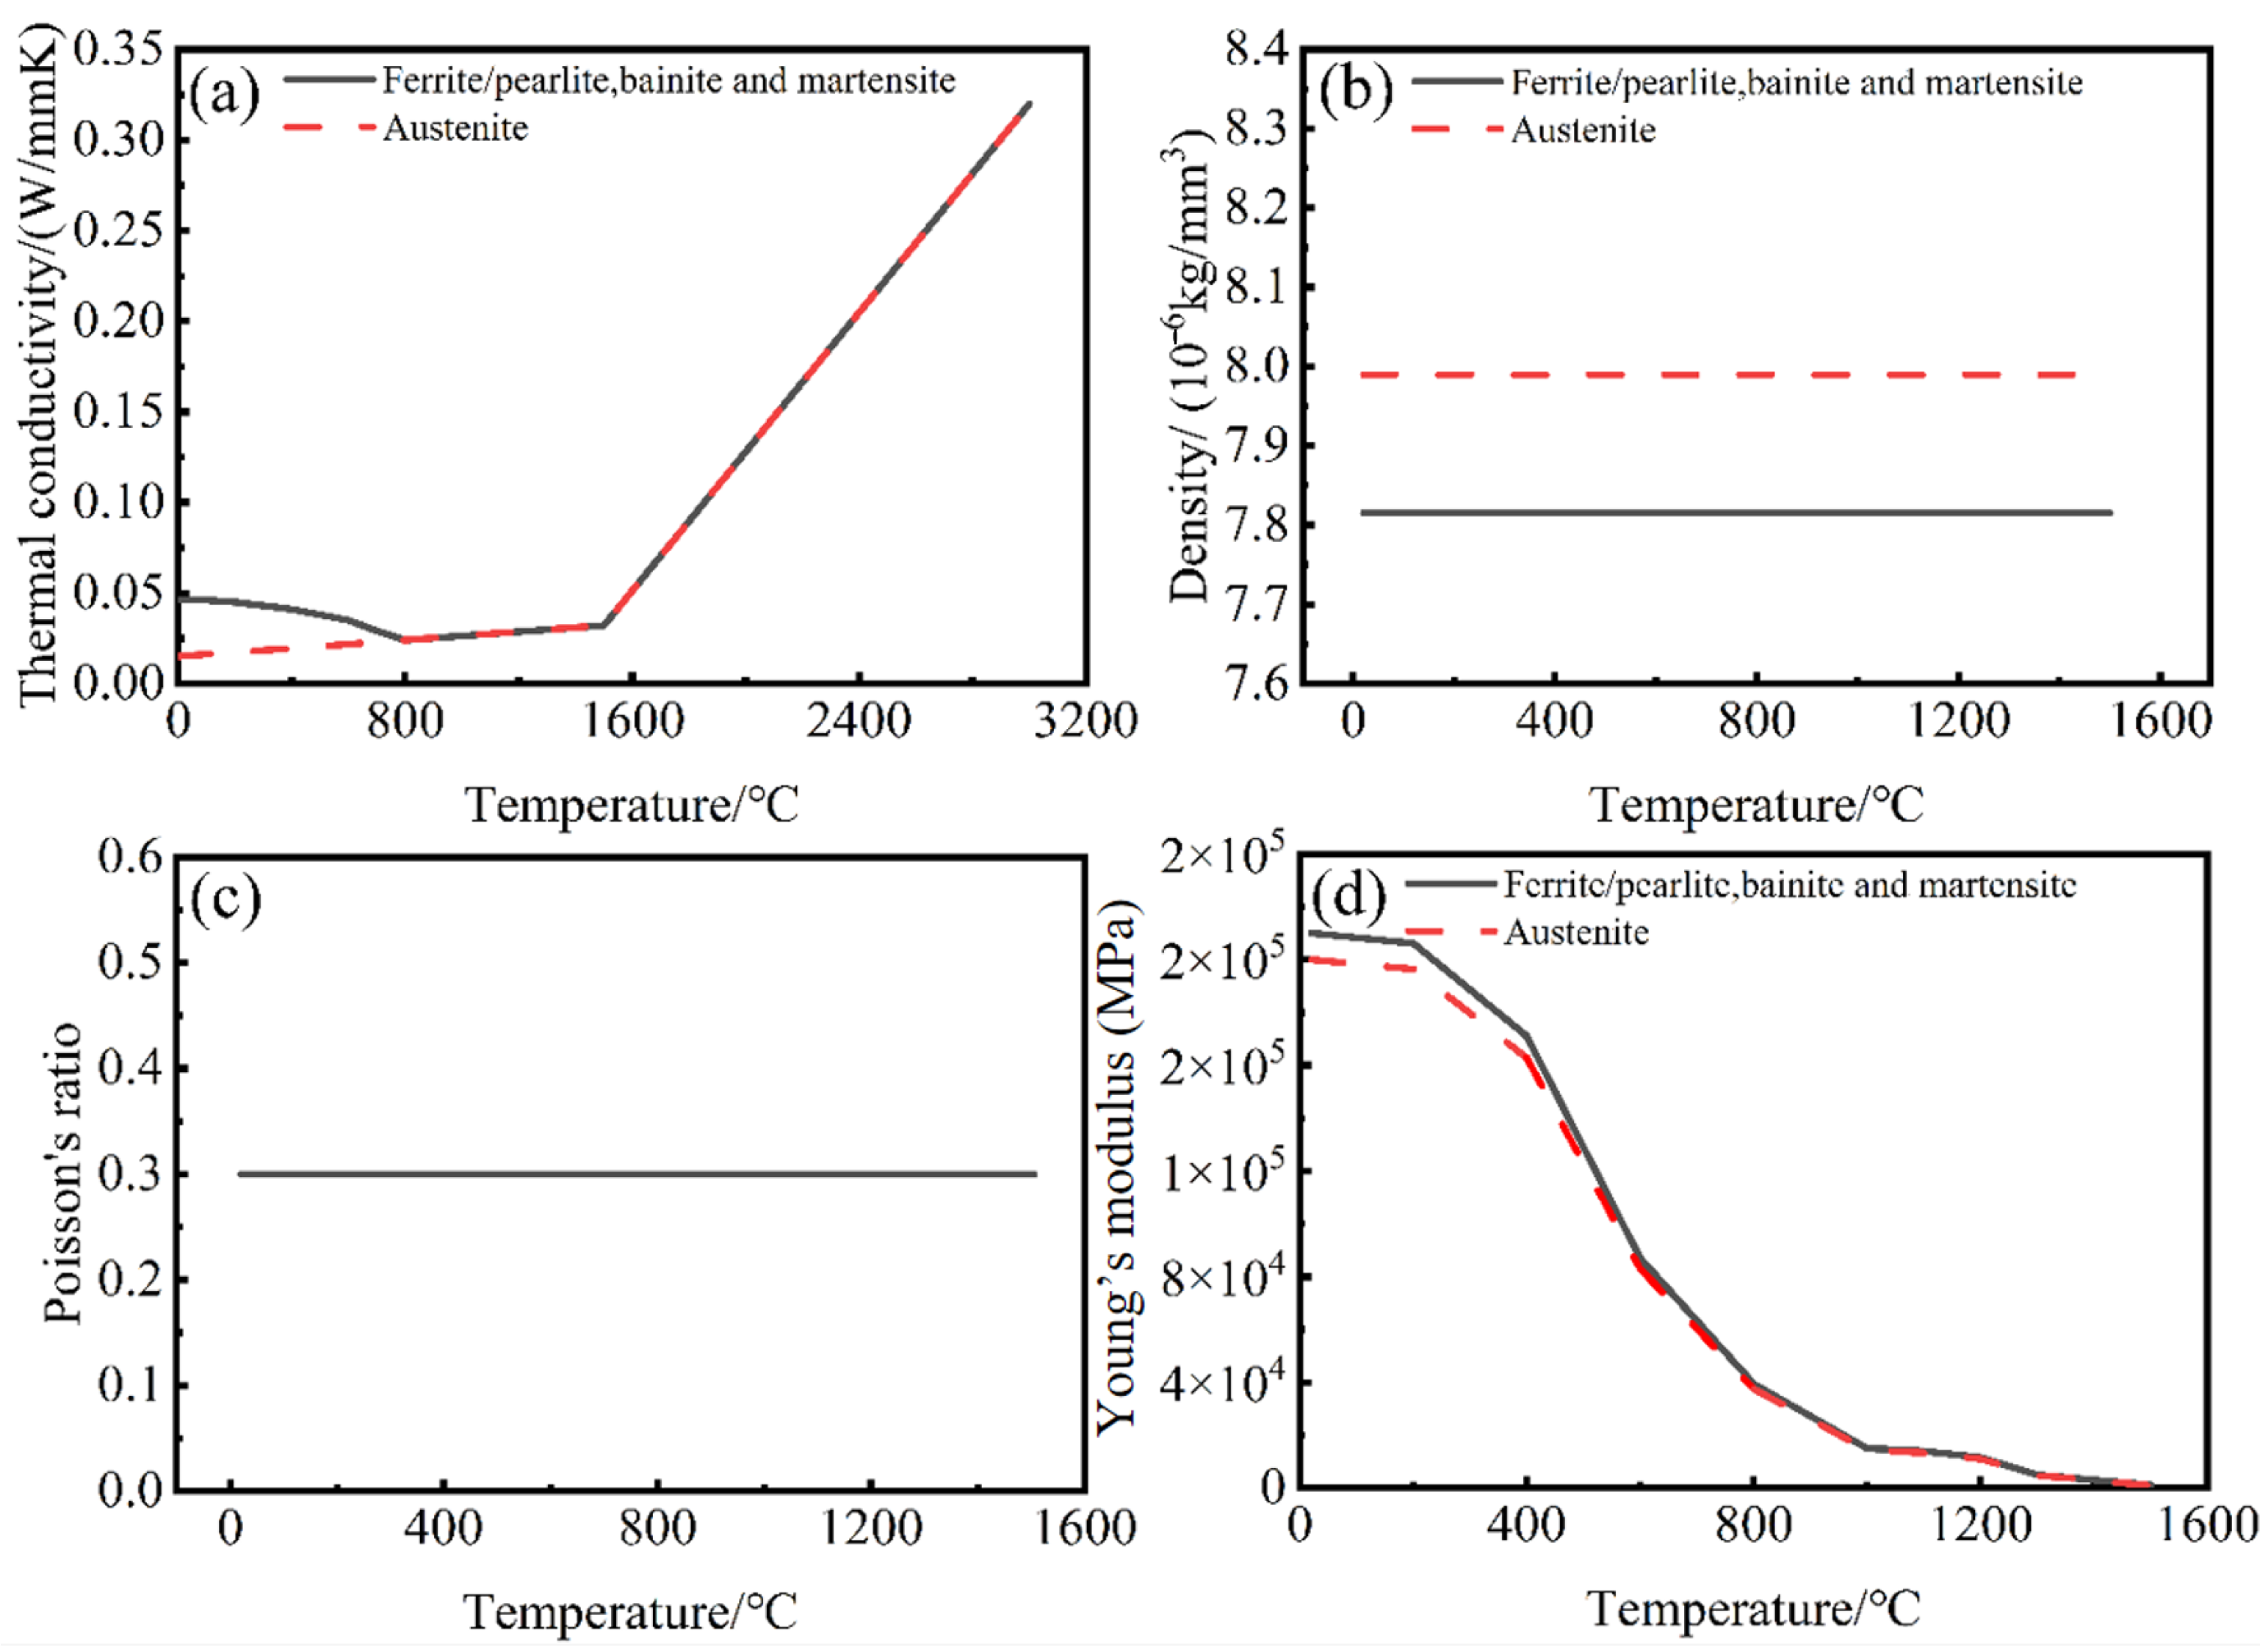
The experimental material selected for this study is cast S355J2G3 steel, with its main chemical composition listed in Table 1 [18]. During laser processing, the material undergoes rapid temperature fluctuations, leading to significant changes in its thermal and physical properties. These properties vary with temperature due to the heat input, and it is essential to account for this variation in the simulation process. The thermal and physical properties of the material are influenced by the different phases present, and together they define the overall properties of the S355J2G3 steel. The temperature-dependent variations in the thermal and physical properties of S355J2G3 steel are illustrated in Figure 2. The interaction between laser and S355J2G3 metal is essentially a coupling process between photon energy and the metal’s microstructure (crystal lattice, electrons, and second phases). From the perspective of photonics, it can be elaborated into the following mechanisms: the selectivity of photon absorption and energy transfer paths, the spatial distribution effect of photon scattering, the nonlinear optical effects under high power, and the quantitative laws of photon energy deposition. These mechanisms reveal the intrinsic connection between laser photon characteristics (wavelength, intensity, pulse characteristics) and the evolution of S355J2G3’s microstructure, providing theoretical support for optimizing the process parameters of laser phase transformation hardening. Phase Transformation Kinetics are determined from the SYSWELD2019 software’s own database. The integrated JMAK (austenitization) and Koistinen–Marburger (martensitic transformation) models can be extended by user-defined subroutines (UDS).
A simulation model for single-pass laser phase transformation hardening was developed using Visual-Mesh to construct a rectangular model, which was then discretized with rectangular elements, as depicted in Figure 3. Due to the steep temperature gradients in the phase transformation zone induced by the laser spot, compared to the smaller temperature gradients in the heat-affected zone and base material caused by delayed heat transfer, steps were taken to enhance the simulation efficiency. This was achieved by reasonably reducing the specimen size and applying a finer mesh to the surface within the phase transformation area, transitioning gradually to a coarser mesh in the non-phase transformation areas. The specimen dimensions are 35 mm × 30 mm × 10 mm. The orange section represents the Gaussian 2D laser heat source model, the red arrow indicates the movement direction of the laser spot, and the yellow dashed box marks the thermal influence zone, which was designated in the software to receive the heat input. During the simulation, the bottom surface of the specimen was fixed, all external surfaces were treated as cooling surfaces, and the cooling period was set to 150 s.

3. Results and Discussion

3.1. Temperature Field Simulation Analysis of Laser Phase Transformation Hardening Process

S355J2G3 is a widely used structural steel with a melting point similar to that of ordinary carbon steel, approximately 1420–1460 °C. During laser phase transformation hardening, the workpiece surface is heated to just below the melting point. Consequently, in the simulation, the maximum temperature does not exceed 1400 °C [16]. Prior to the laser hardening experiments, the specimen surface is polished, cleaned with ethanol, and dried. A blackening treatment is then applied to the surface. The black coating material used in this study has an absorption rate of approximately 90% to 95%. For the laser phase transformation hardening simulation, the material’s laser energy absorption rate is set at 93%. Based on the optimal power range of the GLS-I B-type CO2 laser used in the experiment, the process parameters for the simulation are detailed in Table 2.

3.1.1. Single-Pass Laser Phase Transformation Hardening Simulation Analysis

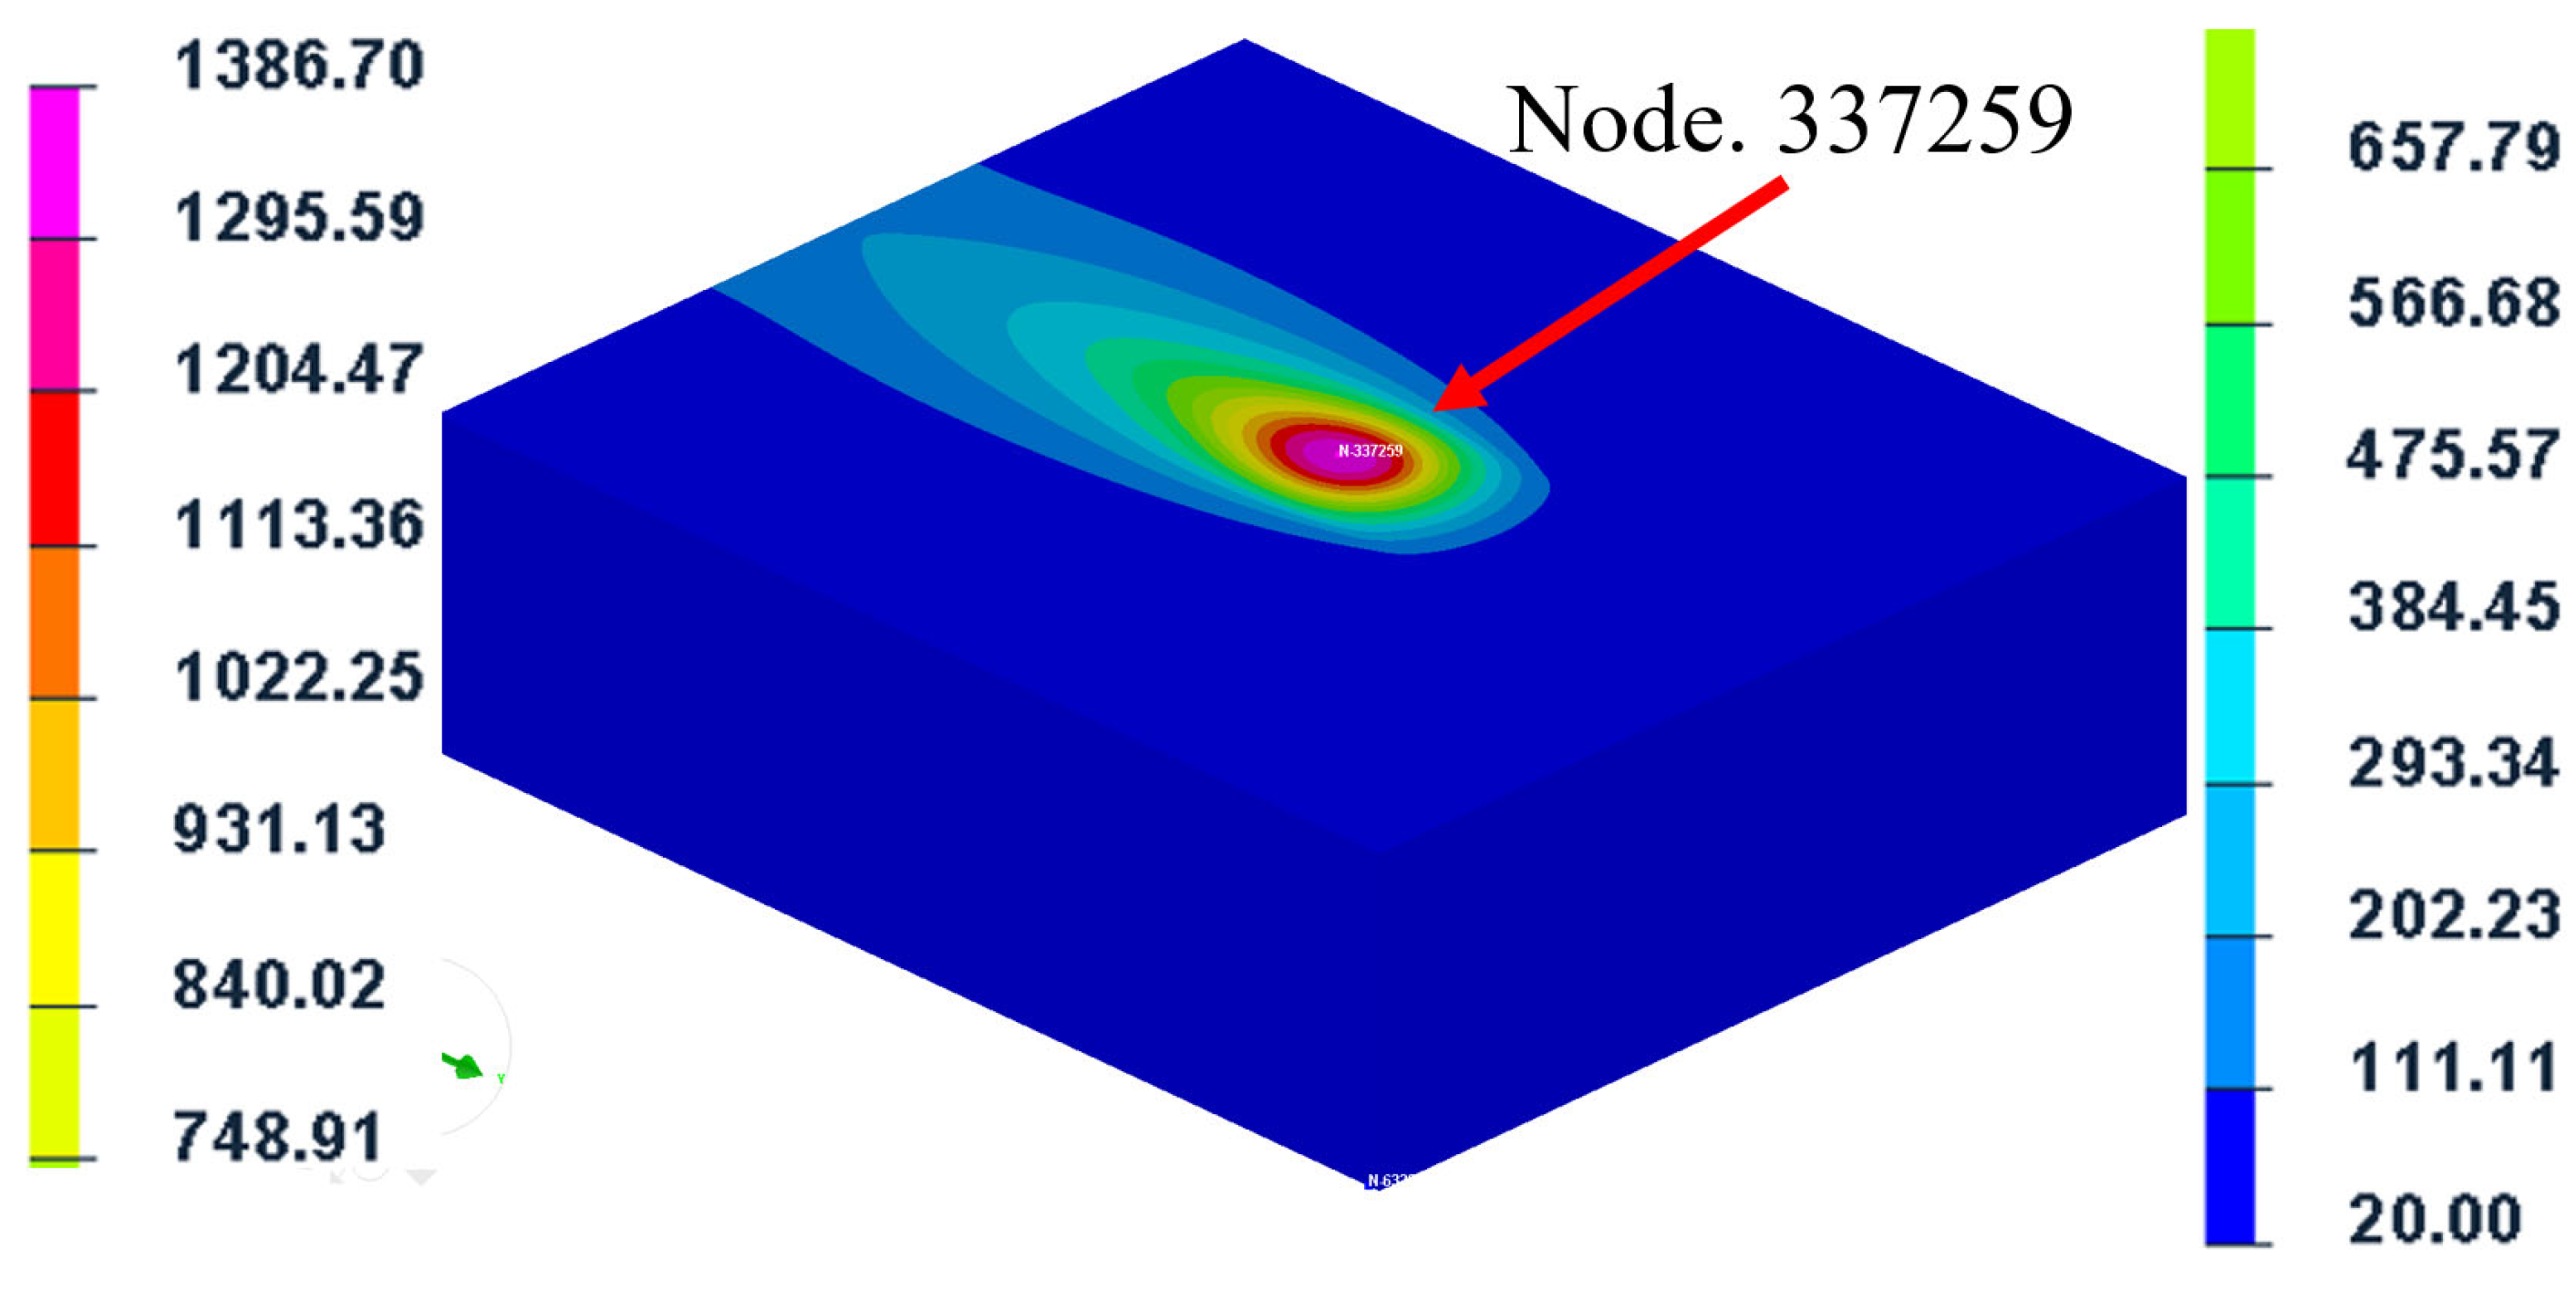
A simulation of single-pass laser phase transformation hardening was conducted on the specimen. To avoid edge effects, the laser scanning path was initiated from the center of one end of the specimen and proceeded in the y-axis direction until it neared the opposite edge, at which point the scan was halted. The laser spot moved from left to right. Figure 4 presents the isothermal contour map of the temperature field when the laser scanned the central area of the specimen, where the temperature variation had stabilized. It is evident that as the laser spot moved from left to right, heat accumulation occurred in the scanned region, resulting in a higher temperature compared to the unscanned right side, where the temperature rapidly decreased due to heat dissipation. A “tailing effect” in the temperature distribution of the high-temperature region is also observed. On the right side of the laser spot, which consists of the cold base material, the temperature only increased when the spot directly scanned over this area, leading to a “sharp” temperature gradient. On the left side of the spot, which had already been scanned, rapid heat conduction within the material matrix caused the heat to disperse in all directions, creating a “circular tail” distribution.
The temperature variation curve and phase volume fraction curve of Sample 1 from Table 2, simulated under the designated process parameters, are presented in Figure 5. These curves cover the period from 0 to 6 s along the laser scanning path on the material’s surface. Figure 5a displays the temperature variation curve at node 337259, located in the middle of the laser scanning path. From the graph, it can be observed that the temperature at this node begins to rise at 0.63 s, reaching a peak of 1383.92 °C at 0.98 s, before decreasing to 70 °C by 6 s. Figure 5b shows the phase volume fraction variation curve for neighboring cell 449067 near node 337259 over the 6 s period. Between 0 and 0.63 s, the heat source has not yet reached this point, and no structural changes are observed in the base material, with ferrite being the predominant phase. After 0.84 s, as the temperature surpasses the eutectoid temperature Ac1, the ferrite content decreases rapidly while the austenite content increases. At 0.98 s, when the temperature peaks at 1383.92 °C, the austenite content reaches its maximum of 99.9%. As the temperature drops to around 500 °C at 1.33 s, the austenite content begins to decline, reaching 0.48% by 150 s. At 1.4 s, the temperature falls to approximately 420 °C, triggering the martensite transformation, with the martensite content continuing to increase. By 150 s, the temperature stabilizes at 46 °C, and the microstructure is primarily composed of martensite, with a minor presence of austenite and minimal ferrite and bainite. Figure 6 displays the martensite volume fraction contour map of the cross-section perpendicular to the laser scanning direction. Using the measurement tool within the software, the hardened layer width was determined to be 4531 μm, while the hardened layer depth was measured at 765 μm.

3.1.2. Two-Pass Overlaying Laser Phase Transformation Hardening Simulation Analysis

Due to the limited size of the laser spot, overlapping passes are necessary when treating workpieces with large machining areas in practical manufacturing processes. During the overlapping process, heat from the subsequent laser pass significantly affects the microstructure of the previous pass, leading to the tempering of the martensitic structure into tempered martensite and bainite. This results in a noticeable reduction in the depth of the phase transformation hardening layer in the overlapping regions compared to the non-overlapping areas, with reduced hardness in these zones [1]. When laser surface modification is applied to large workpieces, tempering softening is unavoidable, making it difficult to achieve a uniformly hardened layer. Therefore, the accuracy of two-pass overlapping laser phase transformation hardening in numerical simulations is critical. The overlap ratio φ is the ratio of the area of overlapping phase hardening areas to the area covered by a single laser scan, and the definition of the overlap ratio can be simplified as follows:
ϕ = 1 D d × 100 %
where φ is laser overlap rate, D is the distance between the centers of adjacent spots, d is the laser spot diameter.
The simulation of two-pass overlapping laser phase transformation hardening was conducted using the same laser process parameters described in Section 3.1.1. The distance between the two laser scanning paths was set to 4 mm, resulting in a 33% overlap rate. The time interval between the two laser hardening processes was set to 150 s, with a total duration of 300 s for the two hardening and cooling cycles. Figure 7a illustrates the volumetric fraction of martensite, and Figure 7b shows the tempered martensite in a cross-section perpendicular to the laser scanning direction. The tempering of martensite occurs at the outer region where the second laser hardening zone overlaps the first, as indicated in Figure 6. Measurements show that the depth of the hardened layer after the first laser pass is 0.783 mm, while the second pass produces a hardened depth of 0.814 mm. Tempering softening occurs in the overlapping region where the second laser hardening layer intersects with the first. In the first hardened region, martensite above the transformation temperature re-cools into martensite after transforming into austenite, while martensite below the transformation temperature undergoes tempering, resulting in the microstructure shown in Figure 7.

3.2. Laser Phase Transformation Hardening Experimental Verification

The samples underwent laser phase transformation hardening using the same laser processing parameters as those applied in the simulation experiments. Following the hardening process, the samples were cut with a wire cutting machine, centering the hardened layer, to produce dimensions of 10 mm × N mm × 4 mm (length × width × thickness), where the width NNN mm was adjusted to fully encompass the hardened layer within the cut sample block. The cut samples were then embedded, cooled, and their cross-sections were ground, polished, and cleaned using sandpaper. The prepared surface was subsequently etched with a 4% nitric acid–alcohol solution. The laser processing system used in the experiment is the GLS.IB type 3000 W two-functional laser processing system produced by Han’s Laser Technology Industry Group Co., Ltd., Shenzhen, China. The specific parameters of its laser radiation are as follows: the wavelength is 1064 nm (fiber laser); in pulsed mode, the pulse width is adjustable within the range of 100 ns–1 ms; the single pulse energy can reach 1–100 mJ depending on different pulse parameters; the laser beam presents a two-dimensional Gaussian spatial distribution (with a focal plane spot diameter of 6 mm and σ = 2 mm); the M2 parameter is 1.2; the maximum power density at the focal plane is 1.7 × 10⁴ W/cm2; the pulse repetition frequency is set to 500 Hz to ensure stable energy input. The above parameters have been incorporated into the experimental and simulation settings.

3.2.1. Single-Pass Laser Phase Transformation Hardening Metallographic Structure

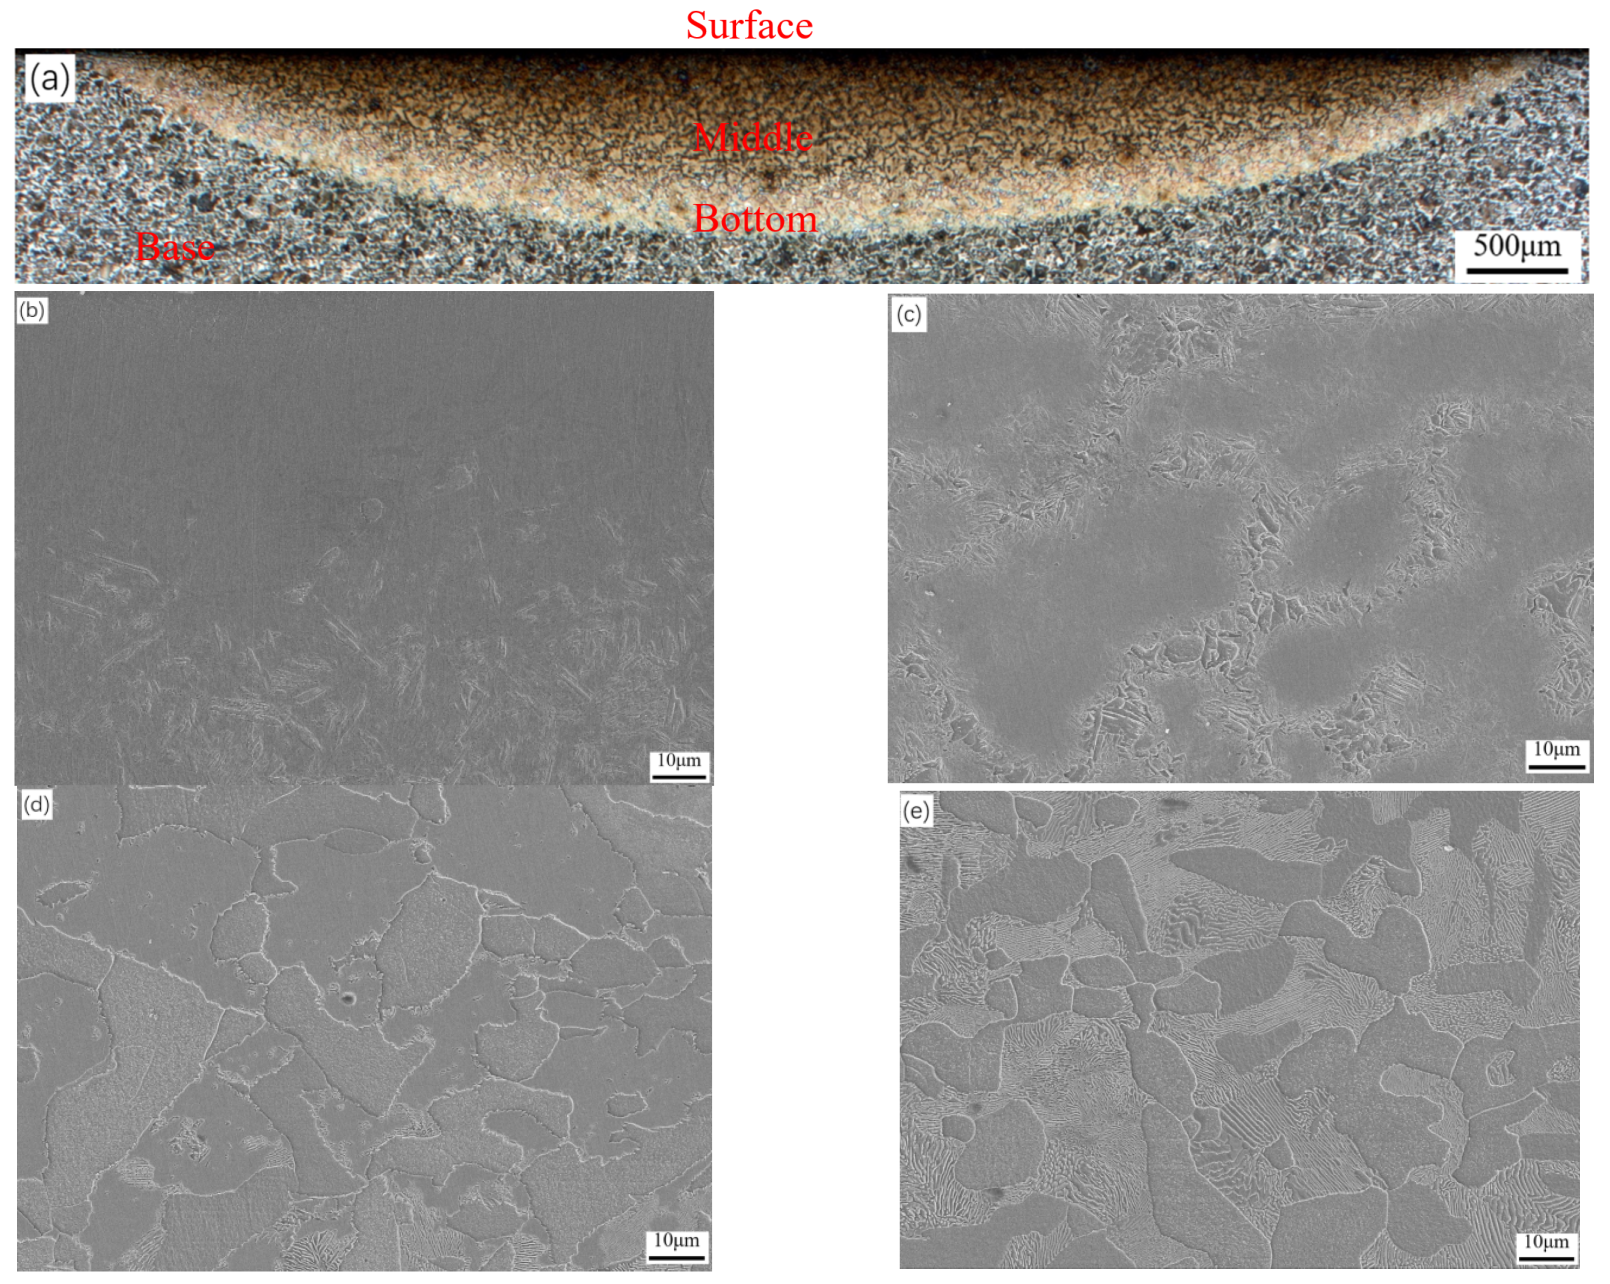
Optical and electron microscopy were employed to observe the microstructure of the samples. Martensite usually exhibits a finer lamellar organization, with grain shape and orientation significantly different from ferrite and austenite. Figure 8a presents the morphology of the single-pass laser phase transformation-hardened sample as captured by an optical microscope, revealing that the width and depth of the hardened layer were 5123 μm and 811 μm, respectively. A comparison between the simulation results and the experimental cross-sections showed that both exhibited a crescent-shaped hardened layer. However, the experimental measurements indicated that the width and depth of the hardened layer obtained from the simulation were slightly lower than those observed in the experiment. The source of error may come from (1) the simulation model of the material is homogeneous and smooth, the test of the material there is a certain error and surface roughness; (2) the test process, the surface of the specimen is coated, the thickness and uniformity of the coating layer there are errors; and (3) the stability of the laser process and the distance and direction between the laser head and the specimen, etc. Figure 8b, Figure 8c, Figure 8d, and Figure 8e display electron microscope images of the surface, middle portion, bottom, and base material of the sample, respectively.
As shown in Figure 8b, the surface structure of the laser phase transformation-hardened layer primarily consists of lath martensite with a small amount of residual austenite. Due to the prolonged exposure of the laser spot on this surface, the martensite structure appears relatively coarse. Figure 8c depicts the phase transformation-hardened area, where as depth increases, the degree of overheating, uncontrolled heat diffusion, and uneven temperature distribution in the microregions lead to an increased number of austenite nuclei. However, insufficient growth time results in the transformation of austenite into fine martensite during martensitic transformation. Figure 8d shows the transition zone, where the temperature is lower than in the phase transformation-hardened area due to the increased depth. This leads to a shorter heating period and a faster cooling rate, resulting in incomplete transformation. Consequently, this zone has a complex structure consisting of tempered martensite, residual austenite, ferrite, and pearlite. As illustrated in Figure 8e, the temperature rise in the base material is minimal due to the limited heat transfer from the heat source center. This low temperature is insufficient for structural transformation, leading to little to no atomic diffusion or migration, and the original microstructure remains largely unchanged, consisting of ferrite and pearlite.

3.2.2. Analysis of Two-Pass Laser Phase Transformation Hardened Area Structure

Experimental two-pass laser phase transformation hardening was conducted using the same laser process parameters as described in Section 3.1.2. The center-to-center distance between the two laser scanning paths was set to 4 mm, resulting in a 33% overlap rate, and the time interval between the two laser scans was set to 150 s. Figure 9a shows the cross-sectional morphology of the two-pass laser phase transformation hardening in the overlapped area of the two passes. The overlap area and the heat-affected zone of the subsequent pass are the main focus of two-pass laser hardening research, while the structural changes in other regions are generally consistent with those observed in single-pass laser phase transformation hardening. Therefore, detailed observations were made in the overlap region of the first pass (Zone 1), the overlap boundary (Zone 2), and the edge of the second hardened layer (Zone 3), as shown in Figure 9b–d. Zone 1 in Figure 9b is located within the heat-affected zone of the first pass, where the structure was primarily martensite and residual austenite following single-pass hardening. After the second laser phase transformation hardening treatment, this region underwent a secondary phase transformation, resulting in a structure mainly composed of martensite, with the overall morphology remaining largely unchanged. Zone 2 in Figure 9c is the boundary where the second hardened layer meets the first. In this area, the tempering temperature was relatively high, leading to the formation of a tempered sorbite structure, primarily composed of martensite, tempered sorbite, and tempered martensite. Figure 9d depicts the structure at a distance from the overlap area, where the influence of tempering from the second laser pass was minimal. As a result, the martensite in this region mostly transformed into tempered martensite, with a morphology similar to that of the original martensite structure.

3.2.3. Laser Phase Transformation Hardening Hardness Test

The surface and cross-sectional microhardness distributions of the laser-treated specimens were measured using a Vickers hardness tester. The schematic diagrams of the hardness testing on the surface and cross-section of the specimens after laser processing are shown in Figure 10. Figure 10a illustrates the direction of hardness testing on the surface of the specimen, while Figure 10b provides a schematic of hardness measurements taken at depths of 100 μm, 250 μm, and 400 μm on the cross-section. The hardness measurements started from the boundary between the two hardened layers, near the second hardened layer, with intervals of 150 μm progressing towards the first hardened layer. Figure 10c displays the surface hardness variation as a function of distance, while Figure 10d presents a 3D waterfall plot of hardness at the three measured depths on the cross-section. The surface hardness in the laser phase transformation-hardened area exceeds 600 Hv, as shown in Figure 10c, whereas the softened area shows lower hardness, with the minimum hardness value around 340 Hv. According to the hardness test results, when the overlap width was set to 2 mm, the width of the softened area on the specimen surface was approximately 0.72 mm, while the simulated softened band width was about 0.77 mm, resulting in an error of around 6.5%. Figure 10d reveals three distinct regions on the surface and cross-section of the specimen. At depths of 100 μm and 250 μm from the surface, two regions are apparent: the hardened area produced by laser phase transformation hardening and the softened area at the overlap of the two hardened layers. At a depth of 400 μm from the surface, in addition to the hardened area, a region with significantly lower hardness is observed, much lower than the softened area. The hardened layer exhibits a crescent shape, and at the edges, the layer does not extend to a depth of 400 μm, resulting in no phase transformation at this measurement location. Consequently, the hardness in this region is similar to that of the base material. The simulated width of the tempered softened band at a depth of 250 μm from the surface is approximately 0.55 mm, whereas the experimentally measured width is about 0.5 mm, yielding an error of approximately 9.1%.

3.3. Study on Laser Phase Transformation Hardening Overlap Rate

To investigate the influence of overlap rate on the hardness of the two-pass laser surface phase transformation-hardened layer, this study modified only the overlap rate based on the original experimental laser process parameters and used simulation to verify the two-pass overlap. The overlap widths were set to 0 mm, 1 mm, 2 mm, and 3 mm, with the simulation for a 2 mm overlap width already validated for accuracy through experimental results. As shown in Figure 11, to evaluate the uniformity of two-pass hardening, the minimum depth of the overlap transition zone is denoted as “a”, and the maximum depth of the subsequent laser phase transformation-hardened zone is denoted as “b”. The ratio a/b, represented as Y, indicates the level of flatness. A larger Y value suggests a tendency toward a flatter hardened layer, indicating a more uniform hardening depth.
Simulation results for samples with four different overlap widths were measured, and Y values were calculated as shown in Table 3. A Y value of 0 for the 0 mm and 1 mm overlap width samples indicates no overlap. The highest flatness is observed in the sample with a 3 mm overlap width, with a Y value of 0.592.
Figure 12 illustrates the martensite distribution in the overlap region for different overlap rates. When the overlap width is 0 mm or 1 mm, there is a region between the two laser phase transformation hardening passes where no phase transformation occurs, leaving the base material between the two passes unaffected. In contrast, when the overlap width is 2 mm or 3 mm, tempered regions are observed in the overlap area between the two passes. For an overlap width of 0 mm, the non-transformed region is more significant, with a base material width of 1.64 mm. At an overlap width of 1 mm, the non-transformed region on the sample surface narrows to 0.52 mm. With an overlap width of 2 mm, continuous hardened layers begin to form, and tempered regions emerge in the overlap area. The softened zone on the sample surface measures 0.77 mm in width, and the shallowest depth of the hardened layer is 0.318 mm. When the overlap width is increased to 3 mm, the softened zone widens to approximately 0.89 mm, and the shallowest depth of the hardened layer reaches 0.481 mm.
Different overlap rates impact the depth and width of the hardened layer in laser phase transformation hardening experiments. As the overlap rate increases, the depth of the hardened layer increases, while the hardness near the surface of the phase transformation-hardened zone remains relatively unaffected, indicating a uniform hardness distribution. When the overlap width is 0 mm or 1 mm, areas without overlap leave sections of base material between the two laser phase transformation hardening passes, causing noticeable fluctuations in hardness due to the overlap of the heat-affected and tempered softened zones. For samples with overlap widths of 2 mm and 3 mm, softened regions appear in the overlap area of the phase transformation hardening zone. However, the sample with a 2 mm overlap exhibits lower flatness, while the sample with a 3 mm overlap displays a longer softened zone on the surface compared to the 2 mm overlap experiment. The 3 mm overlap demonstrates improved flatness and a more uniform hardened layer depth. Comparing the simulations of the 2 mm and 3 mm overlaps indicates that a larger overlap rate results in a wider tempered softened zone and smaller fluctuations in the hardened layer depth. Both experiments and simulations reveal that the tempered softened zone in two-pass laser phase transformation hardening is unavoidable. Therefore, Optimization of the laser phase change hardening parameters (laser power, scanning speed and spot diameter size, scanning sequence and direction, etc.) and overlap rate is essential to mitigate the effects of tempered soft zones.

4. Conclusions

This study utilized simulations of the temperature field and volume fractions of various metallographic structures during the two-pass laser phase transformation hardening process. The main conclusions of this research are as follows:
(1)
The error between the width of the hardened layer obtained from single-pass laser phase transformation hardening simulations and experimental results is 10.7%, while the error in depth is 1.2%, both within an acceptable range. The results of two-pass overlapping laser phase transformation hardening experiments are generally consistent with the simulation results in terms of morphology. The error between the simulated and measured softened zone widths on the surface is approximately 6.5%, while at a depth of 250 μm, the error in softened zone width is about 9.1%.
(2)
A comparison between simulations and experiments of two-pass overlapping laser phase transformation hardening revealed that the depth of the second laser pass is slightly greater than that of the first. This is attributed to heat accumulation from the initial laser processing, resulting in a higher starting temperature during the second pass, which increases the overall temperature during the second phase transformation hardening. Optimizing laser phase transformation hardening parameters and overlap rates is essential for mitigating the effects of the tempered softened zones and achieving more uniform hardening results. The choice of the degree of overlapping will vary depending on the conditions of the laser exposure.
Numerical simulation ignores the fluctuation of laser absorptivity due to surface topography changes, which may actually trigger localized overheating or uneven hardening. In the follow-up study, the combination of molecular dynamics (MD) simulation of grain boundary behavior, finite element (FEM) simulation of macroscopic temperature field, and optimization of parameters by machine learning are used to improve the cross-scale prediction capability. Research on the composite treatment of laser hardening with other technologies (e.g., nitriding, shot peening) to enhance the comprehensive performance. Other critical aspects (such as hardness uniformity, softening zone extent, and experimental validation) are crucial to the laser processing quality rating metrics, and that subsequent studies should be multi-dimensional and multi-perspective to analyze the optimal overlap. and multiple perspectives to analyze the optimal overlap rate. The discussion on the relationship between wear tests and microhardness distribution should be analyzed in more depth in subsequent studies.

Author Contributions

All authors have contributed to the development of the research and the elaboration of this paper. Particularly, P.H. and L.Q. contributed to the writing, the investigation, and the simulation; J.R. and Y.W. carried out the experimental research and edited the manuscript. All authors have read and agreed to the published version of the manuscript.

Funding

The authors gratefully acknowledge the support provided by the National Natural Science Foundation of China (No. 52105259), Jiangsu Province’s “Blue Project” (Su Teacher’s Letter [2024] No. 2), and Sixth batch of external teacher doctoral studio scientific research projects of Nantong Institute of Technology (WP202505), Nantong Institute of Technology Science and Technology Innovation Fund (KCTD004).

Data Availability Statement

All datasets generated in this study are available from the corresponding author upon reasonable request.

Conflicts of Interest

The authors declare that there is no conflict of interest.

References

  1. Li, Z.-X.; Tong, B.-Q.; Zhang, Q.-L.; Yao, J.-H.; Kovalenko, V. Microstructure refinement and properties of 1.0C-1.5Cr steel in a duplex treatment combining double quenching and laser surface quenching. Mater. Sci. Eng. A 2020, 776, 138994. [Google Scholar] [CrossRef]
  2. Wang, G.; Wang, J.; Cheng, K.; Yang, K.; Zhang, W. Nano hierarchical hill-like structure with TA1 surface manufactured by LIPSS for anti-corrosion and anti-icing. J. Mater. Res. Technol. 2025, 35, 562. [Google Scholar] [CrossRef]
  3. Makarov, A.V.; Korshunov, L.G.; Malygina, I.Y.; Osintseva, A.L. Effect of laser quenching and subsequent heat treatment on the structure and wear resistance of a cemented steel 20KhN3A. Phys. Met. Met. 2007, 103, 507–518. [Google Scholar] [CrossRef]
  4. Chen, Z.; Zhu, Q.; Wang, J.; Yun, X.; He, B.; Luo, J. Behaviors of 40Cr steel treated by laser quenching on impact abrasive wear. Opt. Laser Technol. 2018, 103, 118–125. [Google Scholar] [CrossRef]
  5. Zhang, T.; Fan, Q.; Ma, X.; Wang, W.; Wang, K.; Shen, P.; Yang, J. Microstructure and Mechanical Properties of Ti-35Nb-2Ta-3Zr Alloy by Laser Quenching. Front. Mater. 2019, 6, 318. [Google Scholar] [CrossRef]
  6. Adel, K. Enhancement of Dry Sliding Wear Characteristics of CK45 Steel Alloy by Laser Surface Hardening Processing. Procedia Mater. Sci. 2014, 6, 1639–1643. [Google Scholar] [CrossRef]
  7. Babu, P.D.; Marimuthu, P. Status of laser transformation hardening of steel and its alloys: A review. Emerg. Mater. Res. 2019, 8, 188–205. [Google Scholar] [CrossRef]
  8. Karamimoghadam, M.; Moradi, M.; Azami, M. A comparative investigation of different overlaps of the diode laser hardening in low-carbon steel and stainless steel. Optik 2022, 251, 168093. [Google Scholar] [CrossRef]
  9. Li, C.; Gao, H.; Chen, X.; Liu, Z.; Han, X. Study on Multi-Field Coupled Evolution Mechanism of Laser Irradiated 40Cr Steel Quenching Process Based on Phase Change Induced Plasticity. Met. Mater. Int. 2021, 28, 1919–1937. [Google Scholar] [CrossRef]
  10. Muthukumaran, G.; Babu, P.D. Laser transformation hardening of various steel grades using different laser types. J. Braz. Soc. Mech. Sci. Eng. 2021, 43, 1–29. [Google Scholar] [CrossRef]
  11. Wang, S.; Yan, S.; Lin, J.; Batako, A.D. Study on the effects of laser quenching power and scanning speed on the property of cast iron. J. Phys. Conf. Ser. 2022, 2198, 012050. [Google Scholar] [CrossRef]
  12. Zhang, H.; Zhu, M.; Ji, S.; Zhang, J.; Fan, H. Numerical simulation and experimental study on laser hardening process of the 42CrMo4 steel. Adv. Mech. Eng. 2021, 13, 1–9. [Google Scholar] [CrossRef]
  13. Aberbache, H.; Mathieu, A.; Bolot, R.; Bleurvacq, L.; Corolleur, A.; Laurent, F. Experimental analysis and numerical simulation of Laser welding of thin austenitic stainless-steel sheets using two models: Bilinear isotropic strain hardening model and Johnson–Cook model. J. Adv. Join. Process. 2024, 9, 100198. [Google Scholar] [CrossRef]
  14. Li, Z.-X.; Wang, X.-N.; Chen, J.; Zhang, Z.-Y.; Hu, Z.-R.; Chu, Y.-J.; Chen, J.-S.; Han, Y.-J. Influence of laser surface treatment on the microstructure distribution, bearing capacity and impact property of 1.0C-1.5Cr steel. Mater. Today Commun. 2023, 35, 106216. [Google Scholar] [CrossRef]
  15. Zhang, H.; Zhu, M.; Ji, S.; Dou, Y. Combining the Finite Element Analysis and Kriging Model for Study on Laser Surface Hardening Parameters of Pitch Bearing Raceway. Materials 2022, 15, 2681. [Google Scholar] [CrossRef] [PubMed]
  16. Xu, X. Research on Numerical Simulation and Temperature Control Technology of Laser Transformation Hardening; Shandong University: Jinan, China, 2022. [Google Scholar] [CrossRef]
  17. Schüßler, P.; Damon, J.; Mühl, F.; Dietrich, S.; Schulze, V. Laser surface hardening: A simulative study of tempering mechanisms on hardness and residual stress. Comput. Mater. Sci. 2023, 221, 112079. [Google Scholar] [CrossRef]
  18. Zhu, Q.; Zhang, B.; Zheng, M.; Zhao, X.; Xu, J. Corrosion Behaviors of S355 Steel under Simulated Tropical Marine Atmosphere Conditions. J. Mater. Eng. Perform. 2022, 31, 10054–10062. [Google Scholar] [CrossRef]
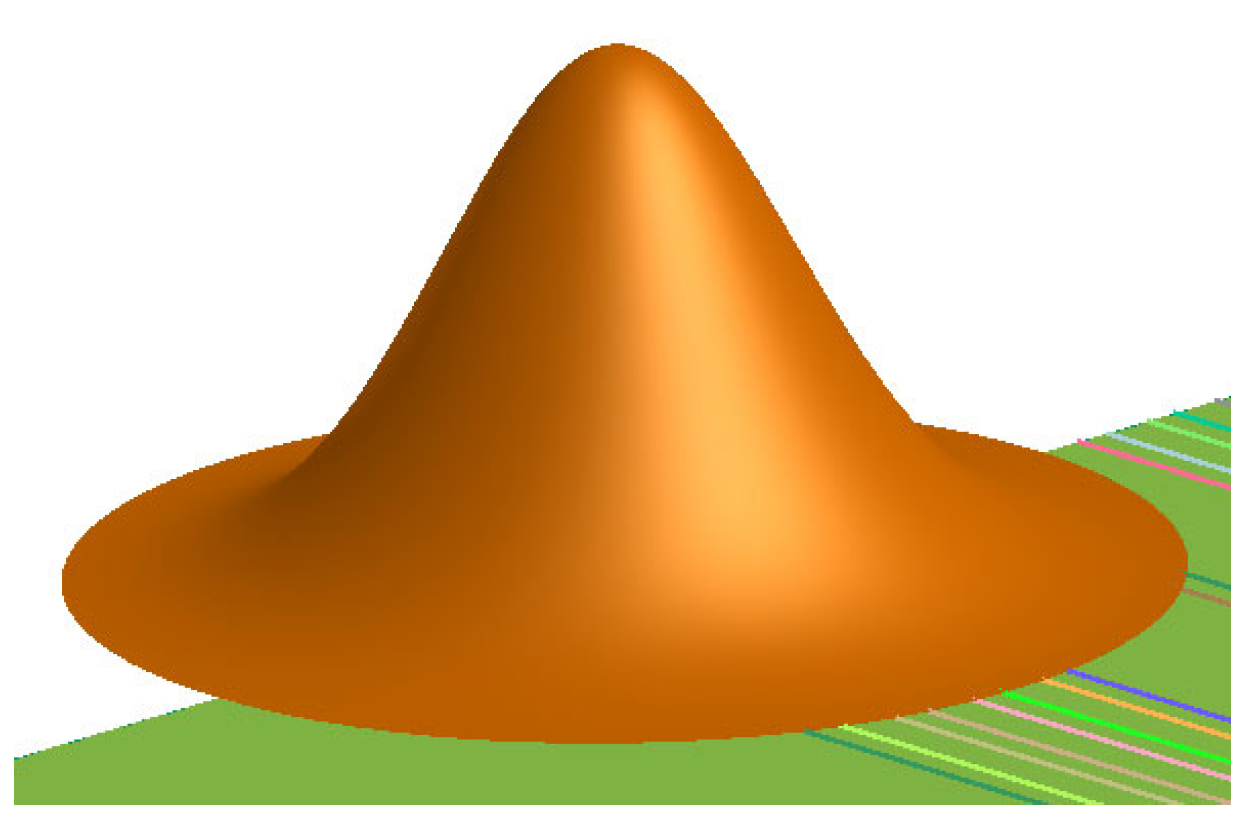
Figure 1. Gauss heat source (2D).
Photonics 12 00992 g001
Figure 2. S355J2G3 material parameters (a) thermal conductivity; (b) density; (c) Poisson’s ratio; (d) Young’s modulus.
Photonics 12 00992 g002
Figure 3. Laser phase transformation hardening model of shield main bearing.
Photonics 12 00992 g003
Figure 4. Workpiece surface temperature cloud map.
Photonics 12 00992 g004
Figure 5. (a) Temperature change curve; (b) volume fraction curve.
Photonics 12 00992 g005
Figure 6. Cross-section martensite cloud diagram.
Photonics 12 00992 g006
Figure 7. (a) Cross-section martensite cloud diagram; (b) cross-section tempered martensite cloud diagram.
Photonics 12 00992 g007
Figure 8. (a) Laser single hardening layer morphology; (b) surface; (c) middle; (d) junction of hardened layer and substrate; (e) base material.
Photonics 12 00992 g008
Figure 9. (a) Two-pass laser quenching lap zone morphology; (b) second quenching region Zone 1; (c) laser hardening overlapped areas Zone 2; (d) first quenching region Zone 3.
Photonics 12 00992 g009
Figure 10. (a) Laser phase-change hardening two-pass overlap; (b) specimen cross-section hardness test diagram; (c) sample surface hardness distribution; (d) hardness distribution of specimen cross-section.
Photonics 12 00992 g010
Figure 11. Diagram of the flatness of two-channel lap joint.
Photonics 12 00992 g011
Figure 12. Distribution of martensite: (a) 0 mm; (b) 1 mm; (c) 2 mm; (d) 3 mm.
Photonics 12 00992 g012
Table 1. S355J2G3 chemical composition (mass fraction, %).
MaterialCSiMnSPFe
Concentration0.180.451.350.0320.036Bal.
Table 2. Experimental parameters of single laser quenching.
Laser Irradiation
Power (W)
Scanning Speed
(mm/s)
Spot Diameter
Φ (mm)
Overlapping
Ratio
1000206/
Table 3. Two channel hardening zone flatness data table.
Lap Width (mm)Least Depth (mm)Maximum Depth (mm)Flatness (Y)
000.7980
100.7970
20.3180.8010.397
30.4810.8130.592
Disclaimer/Publisher’s Note: The statements, opinions and data contained in all publications are solely those of the individual author(s) and contributor(s) and not of MDPI and/or the editor(s). MDPI and/or the editor(s) disclaim responsibility for any injury to people or property resulting from any ideas, methods, instructions or products referred to in the content.