Article

Optical Coherence Imaging Hybridized Deep Learning Framework for Automated Plant Bud Classification in Emasculation Processes: A Pilot Study

by
Dasun Tharaka
1,2,†,
Abisheka Withanage
1,†,
Nipun Shantha Kahatapitiya
3,
Ruvini Abhayapala
4,
Udaya Wijenayake
5,
Akila Wijethunge
6,
Naresh Kumar Ravichandran
7,*,
Bhagya Nathali Silva
1,8,
Mansik Jeon
3,
Jeehyun Kim
3,
Udayagee Kumarasinghe
4,* and
Ruchire Eranga Wijesinghe
8,9
1
Department of Information Technology, Faculty of Computing, Sri Lanka Institute of Information Technology, Malabe 10115, Sri Lanka
2
Advanced Power Conversion Center, School of Automation, Beijing Institute of Technology, Beijing 100811, China
3
School of Electronic and Electrical Engineering, College of IT Engineering, Kyungpook National University, 80, Daehak-ro, Buk-gu, Daegu 41566, Republic of Korea
4
Department of Biosystem Technology, Faculty of Technology, University of Sri Jayewardenepura, Pitipana 10200, Sri Lanka
5
Department of Computer Engineering, Faculty of Engineering, University of Sri Jayewardenepura, Nugegoda 10250, Sri Lanka
6
Department of Materials and Mechanical Technology, Faculty of Technology, University of Sri Jayewardenepura, Pitipana 10200, Sri Lanka
7
Department of Engineering Design, Indian Institute of Technology (IIT) Madras, Chennai 600036, India
8
Center for Excellence in Informatics, Electronics & Transmission (CIET), Sri Lanka Institute of Information Technology, Malabe 10115, Sri Lanka
9
Department of Electrical and Electronic Engineering, Faculty of Engineering, Sri Lanka Institute of Information Technology, Malabe 10115, Sri Lanka
*
Authors to whom correspondence should be addressed.
These authors contributed equally to this work.
Photonics 2025, 12(10), 966; https://doi.org/10.3390/photonics12100966
Submission received: 30 July 2025 / Revised: 17 September 2025 / Accepted: 25 September 2025 / Published: 29 September 2025

Abstract

A vision-based autonomous system for emasculating okra enhances agriculture by enabling precise flower bud identification, overcoming the labor-intensive, error-prone challenges of traditional manual methods with improved accuracy and efficiency. This study presents a framework for an adaptive, automated bud identification method to assist the emasculation process, hybridized optical coherence tomography (OCT). Three YOLOv8 variants were evaluated for accuracy, detection speed, and frame rate to identify the most efficient model. To strengthen the findings, YOLO was hybridized with OCT, enabling non-invasive sub-surface verification and precise quantification of the emasculated depth of both sepal and petal layers of the flower bud. To establish a solid benchmark, gold standard color histograms and a digital imaging-based method under optimal lighting conditions with confidence scoring were also employed. The results demonstrated that the proposed method significantly outperformed these conventional frameworks, providing superior accuracy and layer differentiation during emasculation. Hence, the developed YOLOv8 hybridized OCT method for flower bud identification and emasculation offers a powerful tool to significantly improve both the precision and efficiency of crop breeding practices. This framework sets the stage for implementing scalable, artificial intelligence (AI)-driven strategies that can modernize and optimize traditional crop breeding workflows.

1. Introduction

Abelmoschus esculentus (L.) Moench, commonly known as okra, is a warm-season vegetable that belongs to the Malvaceae family [1]. Okra is primarily propagated through seeds, with new plants arising from germination. In hybrid seed production, pollination is essential, involving the transfer of pollen from the male to the female reproductive organs of the flower. In hybrid seed production, high-quality parent lines are selected to ensure superior offspring traits. Hybrid seeds boost yield, enhance pest and disease resistance, and promote uniform, high-quality produce, supporting sustainable agriculture. The process of artificial pollination is crucial for hybrid okra seed production to avoid self-pollination and to maximize the harvest. Emasculation is an essential process in plant breeding, which removes the male reproductive organs [2,3]. The existing manual emasculation process requires expert training to avoid damaging the deep layers of the reproductive parts of the flower. Additionally, the existing current practices are labor-intensive [4] and can pose a health risk to workers as direct contact with the okra flowers can trigger allergic reactions. Therefore, pollinators and labors must be well-trained and skillful for proper manual emasculation, and it is necessary to use protective suits to safeguard avoid adverse effects on the skin.
In addition to manual inspection, digital image analysis incorporating RGB (red, green, and blue) color segmentation, histogram analysis, and intensity-based detection methods has been widely adopted as a gold standard framework. A study investigating the utilization of color histogram data demonstrated its potential in predicting the maturity index of olives, providing valuable insights into their ripening process [5]. It produced color histograms of each image and used several algorithms to forecast the maturity index and indicate the ripening process of the olives. Although the aforementioned method demonstrates the potential of digital imaging technology as an efficient tool to accelerate the identification of okra buds for emasculation, variations in lighting conditions hinder the accurate detection of pixel intensity.
Emerging technologies, such as artificial intelligence (AI), machine learning (ML), deep learning (DL), image processing, computer vision, and robotics, are significantly impacting modern agriculture [6,7,8,9]. These technologies can be utilized to develop automated systems for real-time monitoring and detection of plant flower conditions. A computer vision-based study on soybean flower and pod drop rate was proposed by R. Zhu et al. [10] to evaluate a few potential DL algorithms for identifying and counting soybean flowers and pods, which achieved the highest accuracy of 94.36% and 91% for soybean flowers and pods, respectively, by incorporating Faster Region-based Convolutional Neural Networks (Faster R-CNN). Although You Only Look Once (YOLO) version 5 (YOLOv5) showcased notable accuracy, it significantly lacked in training compared to Faster R-CNN. Even though a higher performance in training in soybean detection was demonstrated, subsequently, newer versions of the YOLO model offered great accuracy and efficiency. A study was conducted to detect the correct flowering time of rice, which is essential in the pollination of hybrid rice seed production [11], using the YOLOv8s model. In their study, YOLOv8s achieved a 62.80% mAP@50 value and which is considerably higher than the other models while compared to Faster R-CNN (52.89%), SSD (56.59%), and EfficientDet (59.57%). Furthermore, YOLOv8s obtained the best value of 54.62% for F1 scores, real-time speed of 109 FPS, indicating that YOLOv8s is capable of reaching the optimal trade-off between precision and recall and showing more stable and reliable detection than such earlier detection algorithms [12]. Takefumi Hiraguri et al. developed a system to classify tomato flowers, which are ready to pollinate, while a drone is flying [13]. It identified the shape of tomatoes that are ready for pollination. An ML-based classification algorithm was used to classify the maturity stages of tomato flowers by Bataduwaarachchi et al. [14]. According to their analysis of the five different ML algorithms, the support vector classifier (SVC) algorithm has shown an 85% accuracy level. A study was conducted using the YOLOv5 model for the detection of early-stage apple flowers and flower clusters for pollination, with a mean average precision of 50% (mAP@0.5) of 0.819, which has sufficient accuracy for the real field [15]. Real-time detection of Kiwifruit flowers and buds simultaneously allows for precise pollination by robots. A comparison between YOLOv3 and YOLOv4 for the detection of flowers and buds for kiwifruit for pollination revealed a higher accuracy in YOLOv4 [16,17].
Optical coherence tomography (OCT) is a non-invasive imaging technique that provides high-resolution, depth-resolved, and cross-sectional images using near-infrared light and interferometric principles [18]. OCT offers a high signal-to-noise ratio (SNR) and micrometer-level resolution, making it highly effective for visualizing internal structures. As agricultural research increasingly adopts advanced optical technologies, OCT has been used as a crucial tool for the non-destructive assessment of plant materials. Although its use in agriculture was initially limited, recent studies have highlighted its growing potential across various domains [19].
One of the main advantages of adopting swept source OCT (SS-OCT), which has higher sensitivity, makes it ideal for biological and medical applications [20]. Furthermore, by introducing high-speed scanning in OCT techniques, with compromises with high image quality of 2 µm axial and lateral resolution, it enables real-time imaging, especially beneficial for robotic imaging applications [21]. In addition to that, recent advances have introduced portable and smart OCT devices, which significantly reduce the cost and complexity while enabling the feasibility of OCT for practical field applications. For instance, a backpack-type OCT was developed to meet the demand for non-contact inspection for both indoor and outdoor environments [19]. This device was able to reduce the limitations of complex table inspection by providing real-time and portable capabilities, which enabled it to integrate into a fully automated system. Another development of OCT combines robotics used to inspect monolithic storage devices (MSDs) [22], which illustrates the feasibility of OCT miniaturization for robotic inspection tasks. Hence, these developments highlight the OCT system developments toward compact and real-time applications in agriculture and Robotics.
The integration of DL with OCT presents significant potential in agricultural research, which represents a potential approach, enabling non-destructive, high-resolution analysis supported by automated learning-based interpretation [23]. A successful integration of OCT and DL was reported by our group for the early identification of circular leaf spot (CLS) disease on persimmon leaf specimens, which demonstrated its effectiveness in early disease [8]. In the reported approach, OCT cross-sectional images of persimmon leaf specimens were initially captured and subsequently used to train DL models to differentiate between healthy and infected leaves. Despite AI integration in pollination and crop detection, a major research gap persists in automating okra emasculation. Although AI models such as YOLO and Faster R-CNN are used in various crops, their application to okra bud detection for emasculation remains largely unexplored. A critical aspect of the emasculation is the identification of the okra bud layer thickness that needs to be removed. Therefore, the incorporation of OCT enables multidimensional data assessments, which demonstrate its potential in enhancing the accuracy and efficiency of the emasculation process.
This study introduces a robust vision-based framework for adaptive and automated okra bud identification and depth assessment for emasculation, integrating DL with OCT imaging. The proposed approach leverages the strengths of both surface-level image recognition and subsurface structural analysis to support precise bud selection and targeted emasculation. By aligning with existing gold standard evaluation frameworks, such as RGB histogram analysis and intensity-based detection, the method aims to overcome current limitations posed by lighting variability and subjective manual assessment.

2. Materials and Methods

The overall framework of the proposed method for autonomous okra bud identification and depth estimation is shown in Figure 1. It integrates a deep learning-based vision system with OCT imaging to achieve precise bud selection and multi-dimensional structural assessment. The following subsections describe the dataset preparation, training process, optical coherence imaging, and validation methods in detail.

2.1. Acquisition of the Plant Material Images

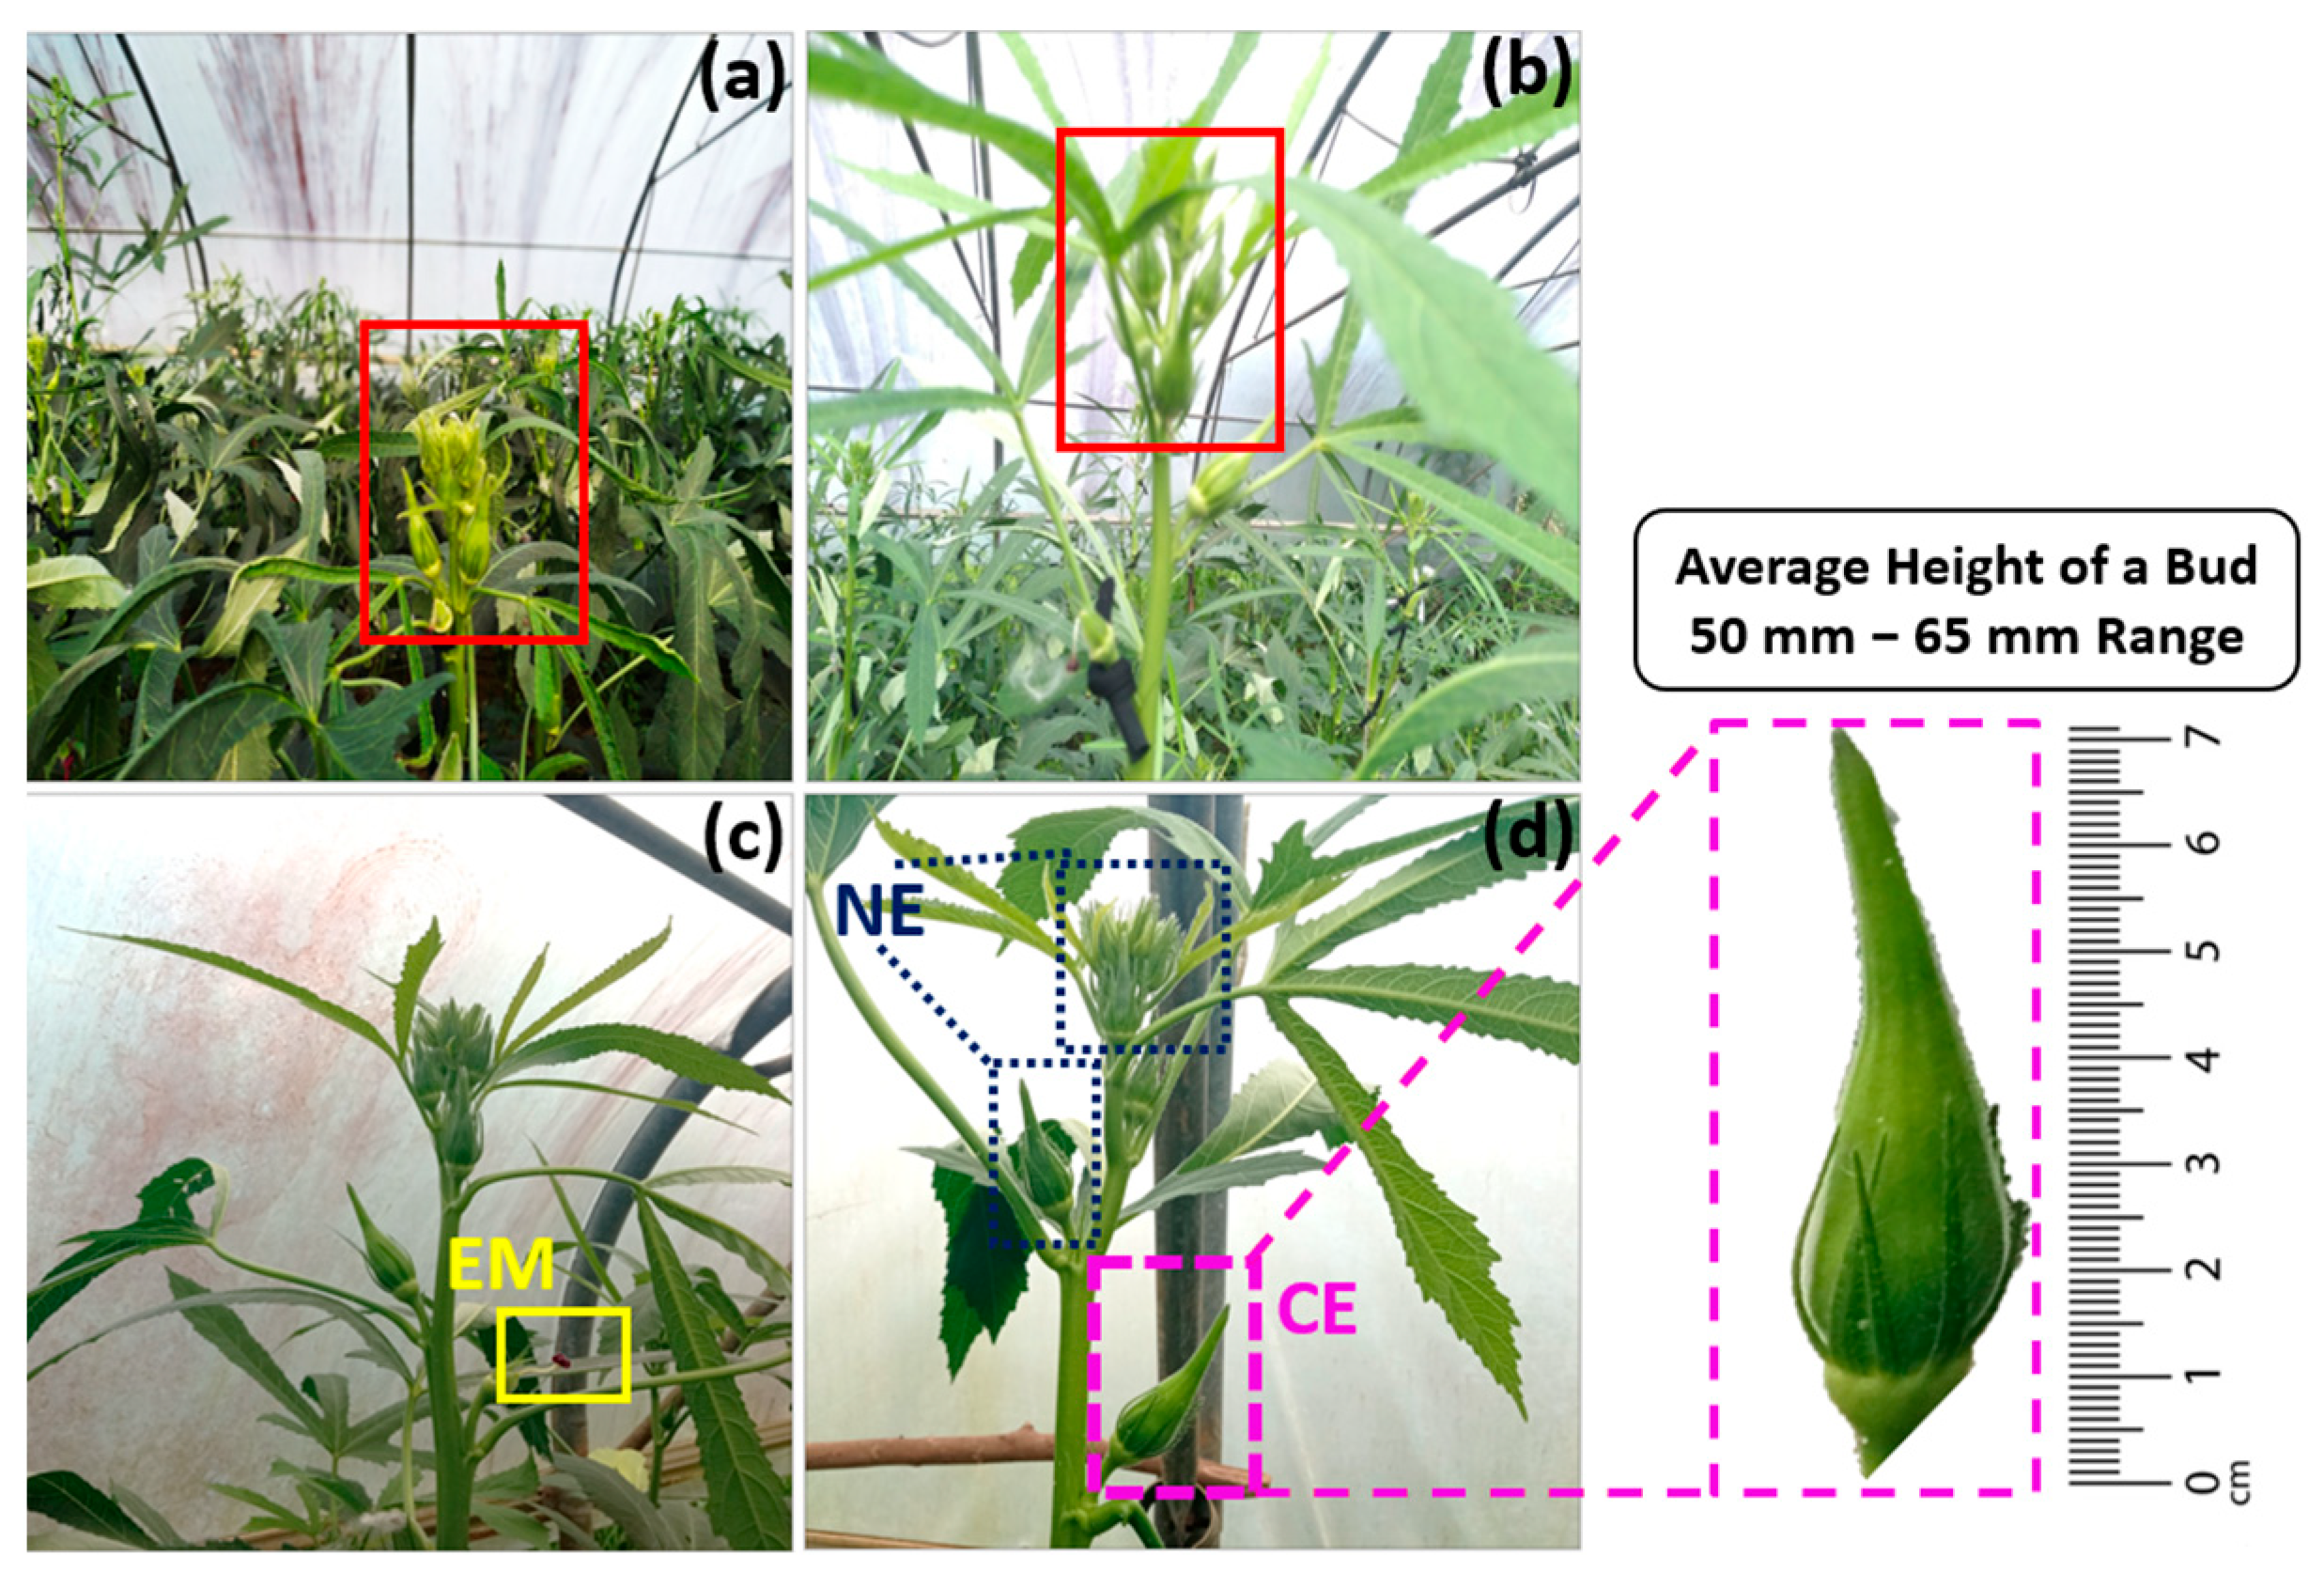
The images of okra buds at various developmental stages were captured at an okra hybrid seed facility, located in the Central Province of Sri Lanka, both in poly-tunnels and open fields. Images of okra buds (illustrated in Figure 2a,b) were captured using a vision camera module with 13 (wide), 8 (ultrawide), and 5 megapixels (depth). The camera was strategically positioned in front of the okra buds under natural lighting for optimal clarity. In total, okra bud’s images were taken under natural daylight conditions, with the environmental temperature recorded at 36 °C.

2.2. Preprocessing and Augmentation of Data

A large volume of training data in the object detection model improves its robustness against interference in complex conditions and helps prevent overfitting. Moreover, in DL-based recognition approaches, several image augmentation techniques were used to increase the recognition performance of the object detection model. Using Roboflow [24] a total of nine image augmentation techniques were applied. These included horizontal and vertical flip, 90-degree rotation, random rotations between −150° and +150°, ±10° horizontal shear, ±100° vertical shear, saturation adjustments between −25% and +25%, brightness adjustments between −15% and +15%, exposure adjustments between −10% and +10%, blur up to 2.5 pixels, and noise up to 0.14% of pixels. Through these augmentations, 2057 images were generated from the original 800 images. The original dataset was annotated into three classes using LabelImg, based on the developmental stage of okra buds. The yellow solid rectangular region (labeled as ‘EM’ with 651 bounding boxes) of Figure 2c shows the already emasculated bud, while magenta dashed rectangular region (labeled as ‘CE’ with 757 bounding boxes) depicts the buds that can be emasculated based on the observable size and maturity of the bud (Figure 2d), and the buds, which are not grown up to the emasculated level are indicated in blue dotted regions (labeled as ‘NE’ with 4975 bounding boxes). After annotating the augmented dataset, all images were resized to 640 × 640 pixels and randomly split into training (80%) and validation sets (20%).

2.3. Training the Network

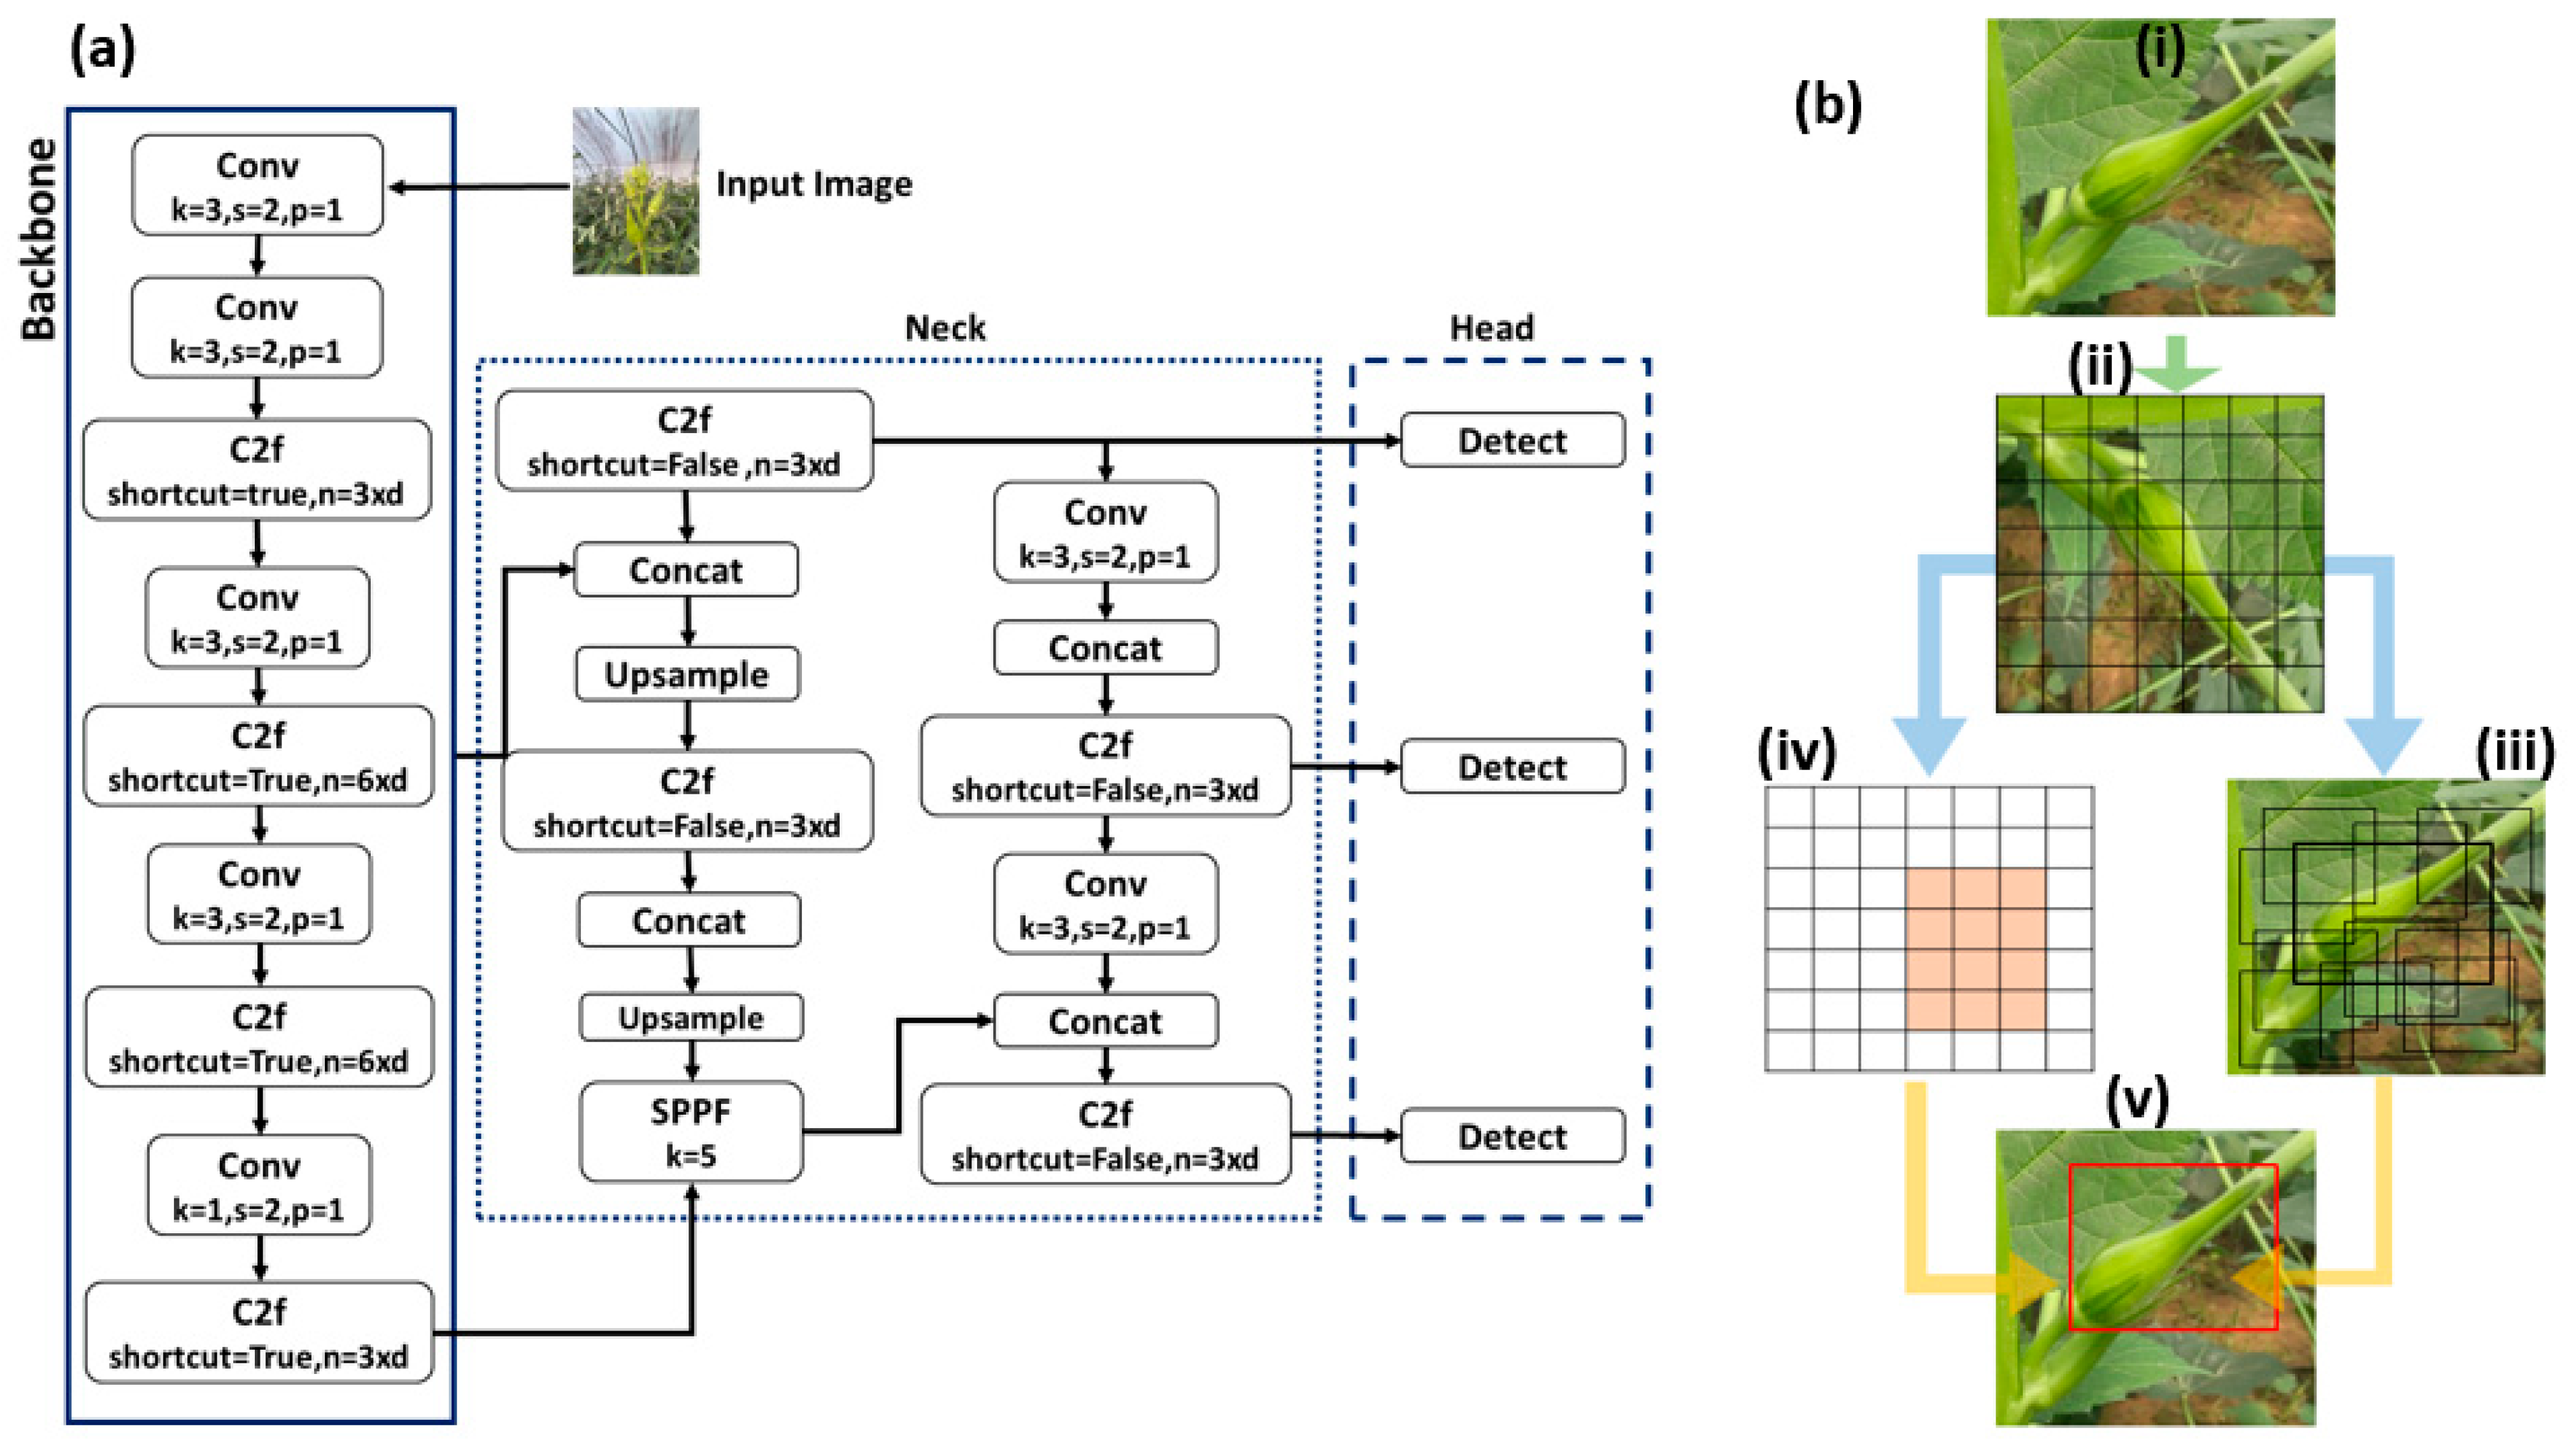
As one of the fastest object detection DL algorithms, the YOLO redefines object detection as a regression problem, making a good balance of detection accuracy and speed. YOLOv8 architecture uses several types of common blocks for its operation, such as convolution block (Conv), Spatial Pyramid Pooling Fast Block, bottleneck block, C2f block, and detection block. In general, YOLO architecture is divided into three parts: the backbone, neck, and head (depicted in Figure 3a). The backbone acts as the feature extractor from the input image of the object detection model. The neck combines the features acquired from various layers of the backbone model. The head predicts the bounding box regions, the final output produced by the object detection model. Different types of YOLOv8 model variants exist, such as YOLOv8n (Nano), YOLOv8s (Small), YOLOv8m (Medium), YOLOv8l (Large), and YOLOv8x (Extra-Large). As a one-stage network, YOLO divides an image into regions and predicts boundary boxes, probabilities, and conditional class probabilities, whose detection pipeline is shown in Figure 3b.

2.4. Training Process

Experiments were conducted using three distinct variations in YOLOv8 object detection models on two different computer systems. The system specifications were identified as follows: an Intel Core i7-8565U (1.80 GHz) quad-core CPU, an AMD Radeon 530 with 4 GB of graphics memory, and 8 GB of RAM, running on Windows 11 (HP Pavilion 15-cu1000tx, HP Inc., Beijing, China); and an Intel Core i3-1005G1 CPU operating at 1.20 GHz with 12 GB of RAM, also running on Windows 11 (Dell Inspiron 3593, Dell, Shenzhen, China). The trained model was executed using PyCharm Community Edition version 2023.1.1 [26], while the training process was conducted using Google Colab notebooks [27]. YOLOv8, based on the Darknet framework, was utilized to train the okra bud stage detection network through transfer learning. For model training, the hyperparameters were systematically optimized to ensure both efficient convergence and robust performance. Specifically, the number of epochs was varied between 10 and 40 in increments of 5, enabling us to observe performance trends across shorter and longer training cycles. A batch size of 16 was selected after preliminary trials showed that larger batch sizes led to unstable convergence and reduced precision on the validation set. The learning rate was maintained at 0.01, consistently providing stable convergence without oscillations or premature plateauing. Weight decay was set at 0.0005 as a default regularization parameter to prevent overfitting. Among these trials, training with 25 epochs achieved the most favorable trade-off between accuracy and efficiency, giving the highest mAP@50 values. Especially, while 25 epochs delivered peak performance, all tested YOLOv8 variants demonstrated consistently strong detection capability on the test dataset, achieving high confidence scores across classes.

2.5. Performance Evaluation

Performance metrics are essential for evaluating the accuracy and efficiency of object detection models. They assess the ability of the model to identify and localize objects, and handle the false positivity and negativity. Typical indicators used to evaluate the trained models on the dataset include Precision (P), Recall (R), F1 Score, Average Precision (AP), mAP, specificity, and detection speed. IoU is a measurement that quantifies the overlap between a predicted bounding box and the ground truth bounding box. An IoU score greater than 0.5 is generally considered a good and acceptable detection. The calculation of IoU is defined in Equation (1).
  I o U = A r e a   o f   O v e r l a p A r e a   o f   U n i o n
APk was defined as the area under the Pk-Rk curve (the Pk as the vertical axis and the Rk as the horizontal axis) as given in Equation (2), which evaluates the performance of models in detecting each class. The average AP of the two classes is given by mAP as defined in Equation (3). Higher AP and mAP indicate better detection results of DL models for a given object. The value k represents each class of objects.
AP k = 0 1 P k ( R k ) d R k    
mAP = 1 k i = 1 k A P i

2.6. Non-Invasive Multi-Dimensional Optical Coherence Imaging

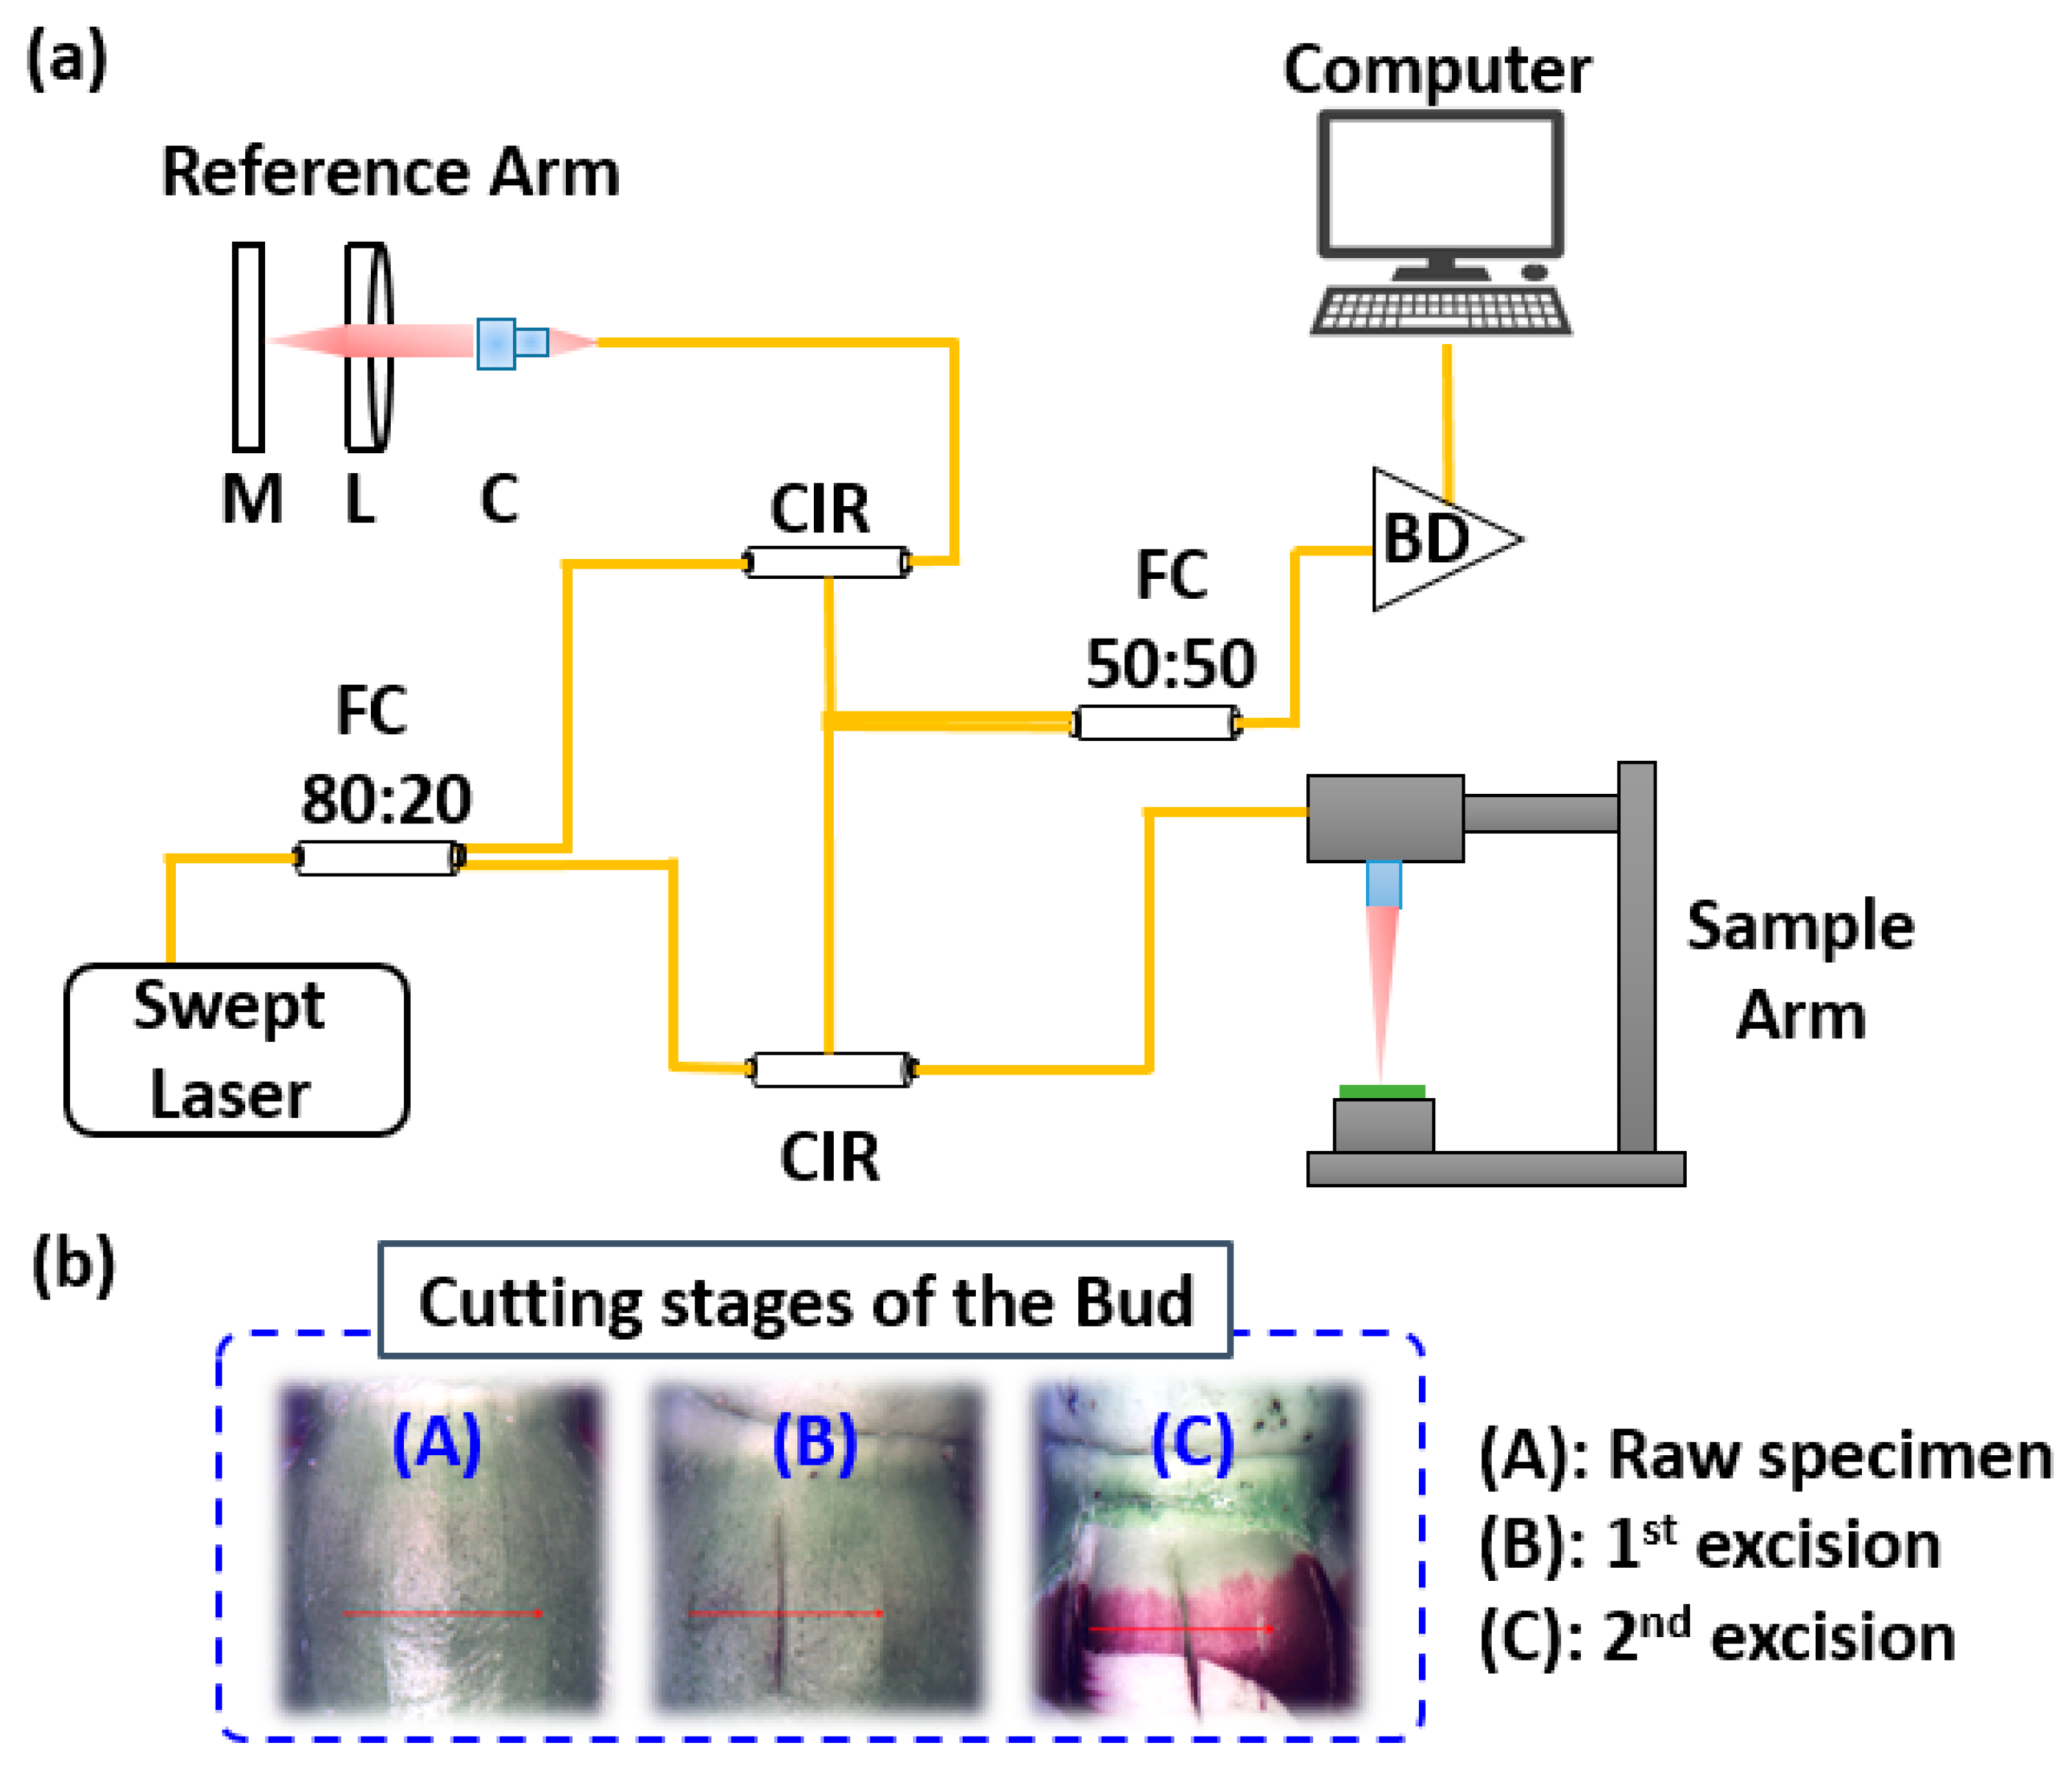
The schematic of the employed OCT system is depicted in Figure 4a. The system used was the Vega™ Series SS-OCT (Model: VEG210C1) developed by Thorlabs (Newton, NJ, USA) which operates at a 1300 nm center wavelength with a 100 nm tuning bandwidth and a sweeping rate of 100 kHz [28]. The light source is a MEMS-VCSEL swept laser, optimized for long-range imaging. The system offers an imaging depth of 11 mm in air (8.3 mm in water) and achieves an axial resolution of 14 µm in air (10.6 µm in water) with 102 dB sensitivity. The laser beam is split at the optical fiber coupler into the sample and reference arms in a 1:1 ratio. The backscattered and reference signals are recombined and detected using a balanced photodetector, and digitized via a 12-bit ATS9353 waveform digitizer integrated with the system’s computer.
The samples were scanned continuously with a scan area of 4 mm × 4 mm, and the used refractive index was 1.42. All the samples were scanned with a sufficient cross-sectional scanning (B-scans) range of 10 mm × 10 mm dimensions, while C-scans were acquired to construct volumetric and enface images towards multiple depths. The axial resolution of the system was measured as 7.5 μm (in air), and the lateral resolution was 10 μm (in air) and 7 μm (in plant tissues). The typical diagram of the OCT system and the excising stages of the okra buds (photographs captured at the laboratory) are illustrated in Figure 4b.

2.7. Histograms and Intensity Variations Based on Light Conditions: Gold Standard Framework Based on Digital Images

Given the advanced capabilities of the proposed DL and OCT imaging, the approach was further validated through histogram and intensity variation analysis under varying light conditions, aligning with existing gold standard frameworks for image evaluation. Thus, two sets of okra images were captured as an alternative qualitative approach, containing 10 digital images each of the sepal and petal layers. Figure S1a illustrates the sepals layer of the okra bud, and Figure S1c shows the petals layer of the bud. The Region of Interest (ROI) of the buds was selected using image analysis software to ensure that they were removed from the white background. The average RGB color frequency of each intensity, which ranges between 0 and 255, was taken and plotted to create histograms for each channel. Figure S1b showcases RGB color histograms that represent the color intensity distribution. Each layer’s RGB indicates the red, green, and blue channels, respectively. Moreover, lighting changes pose challenges for vision-based robots, since bright environments provide better object recognition. Since direct sunlight can cause glare or shadows, while low-light conditions reduce detection accuracy, the detection of the correct buds under different lighting conditions was assessed during daytime as the secondary approach of the gold standard framework. For vision-based service robots, changing light conditions is one of the important problems. Thus, the test video clips were recorded under both cool and warm light conditions (made with an incandescent lamp) to obtain the average confidence scores and their standard deviations for both lighting conditions. The model was trained using images captured between 9 AM and 2 PM, where the standard period for okra bud emasculation under both cool (>5000 K) and warm (<4000 K) lighting, to account for daylight variations caused by weather conditions.

3. Results

3.1. Training Evaluation of YOLOv8 Variants

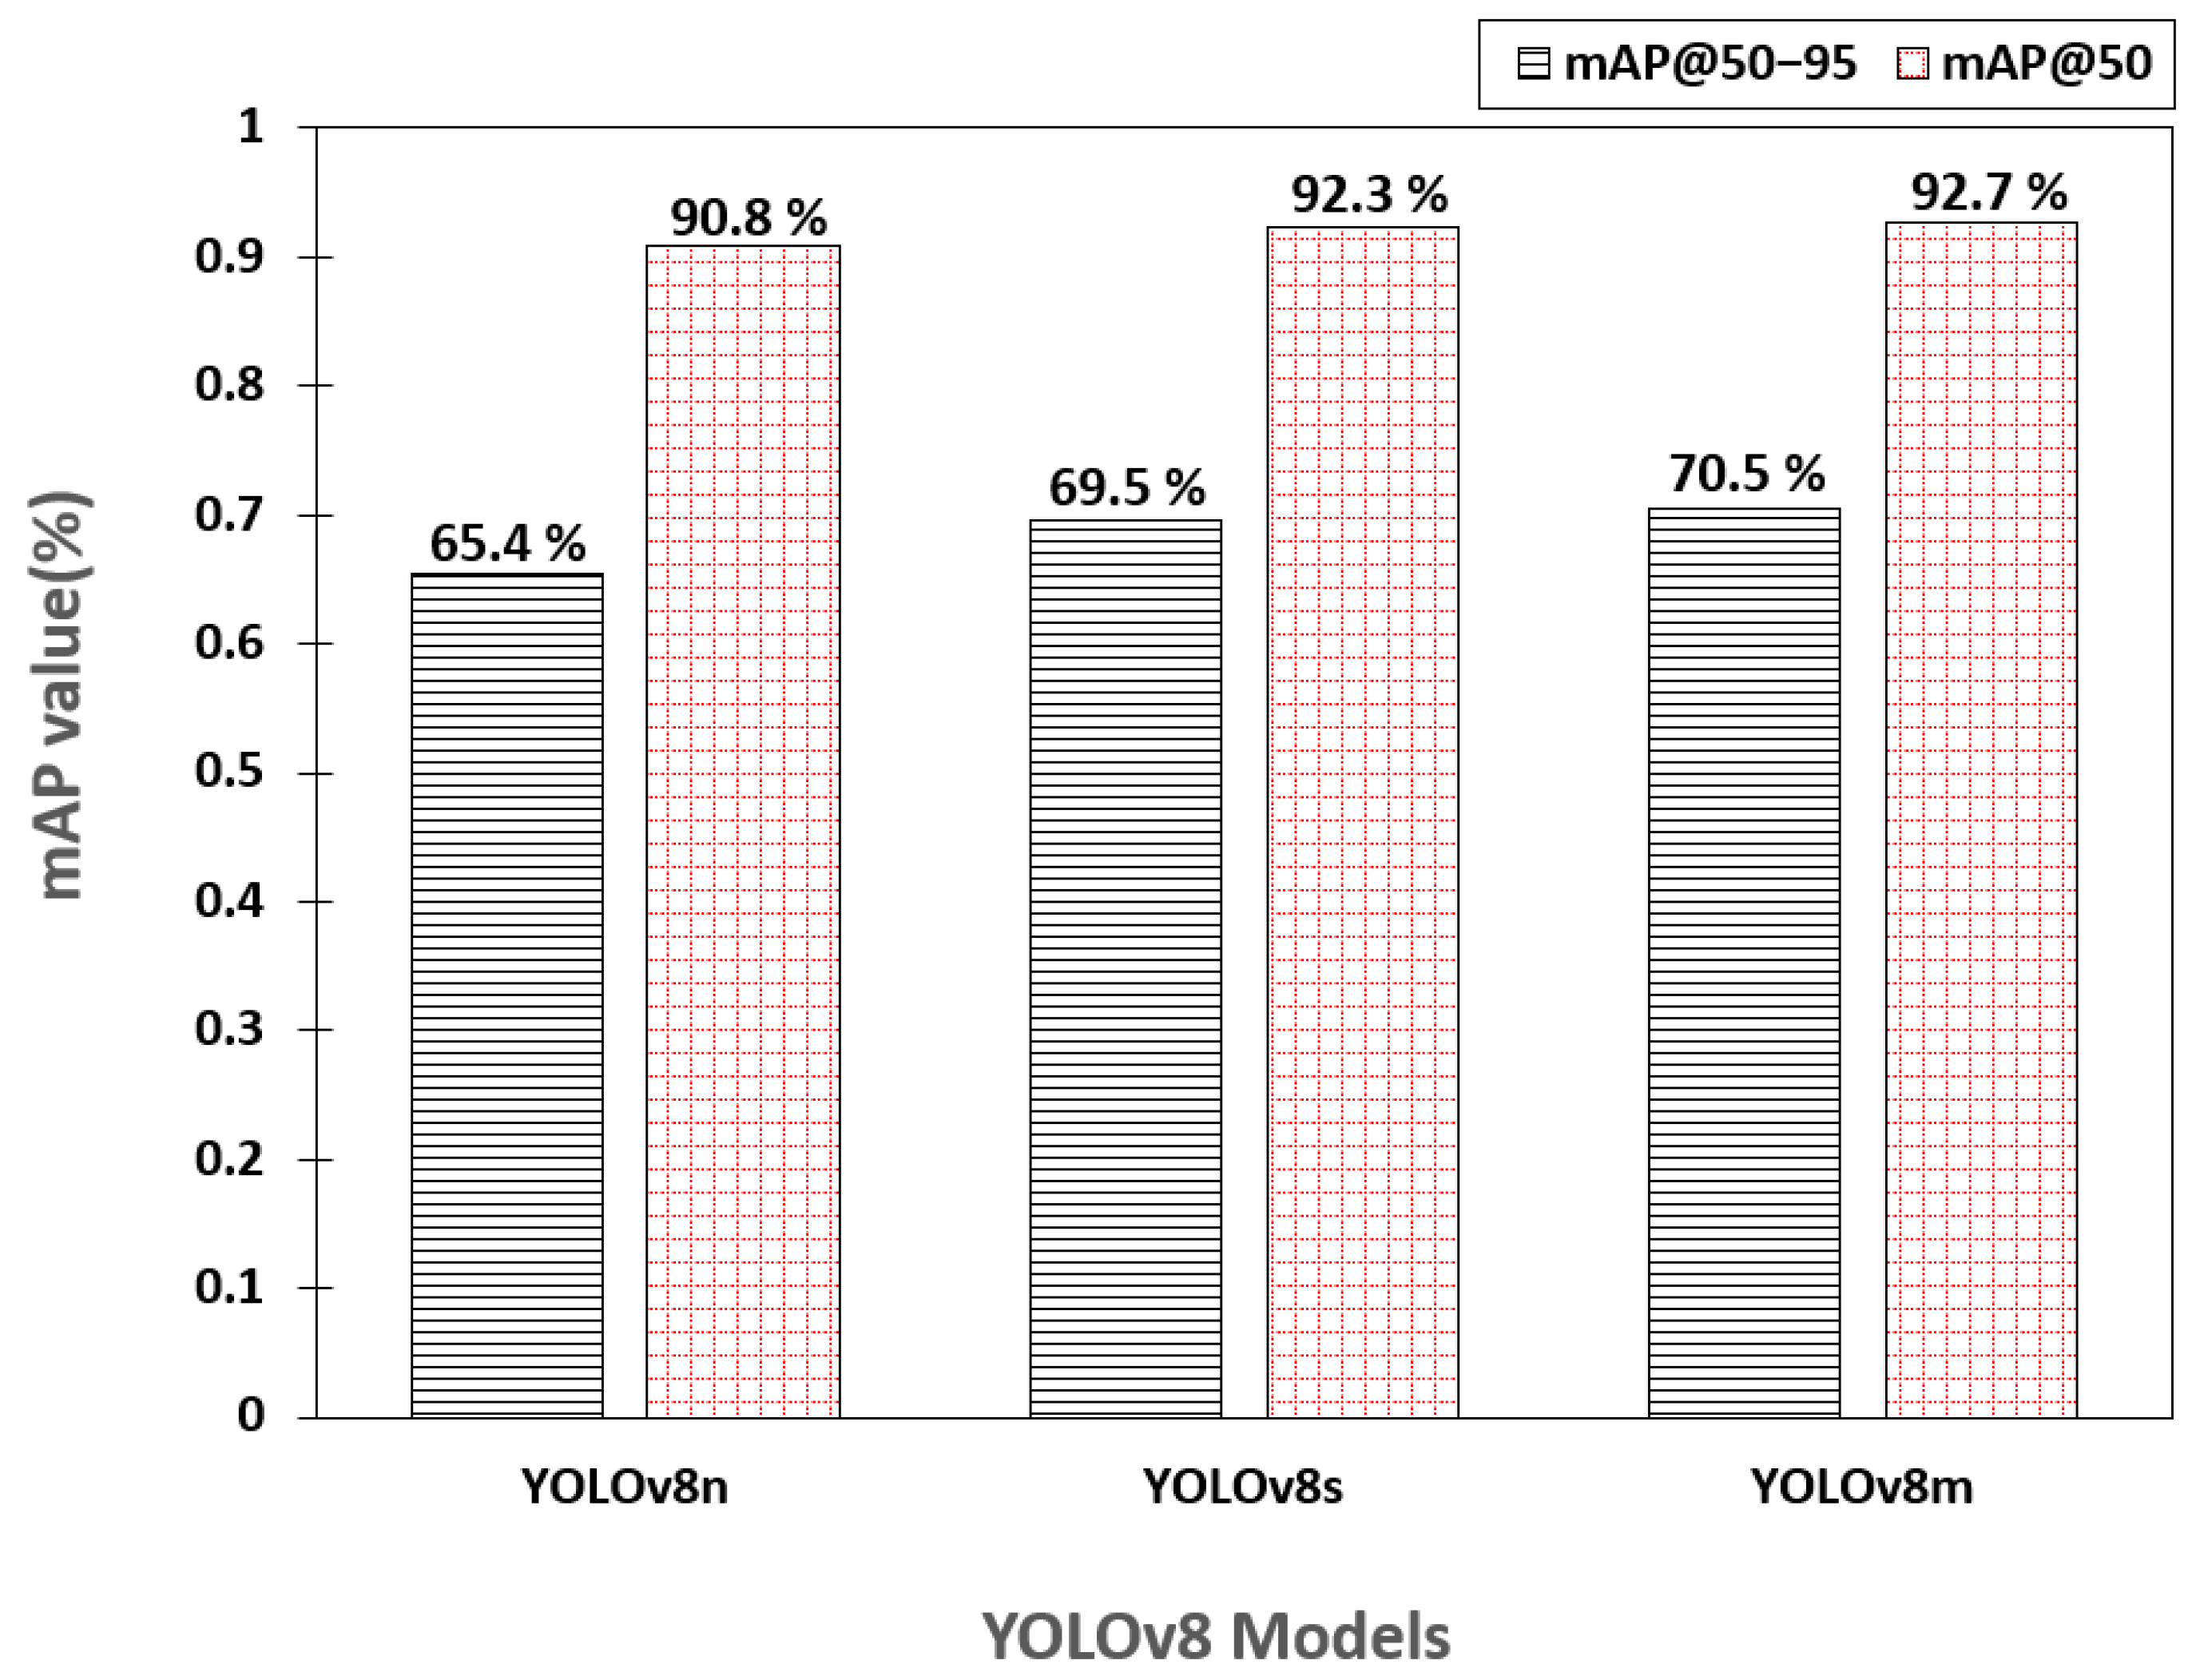
This section evaluates the performance of YOLOv8n, YOLOv8s, and YOLOv8m, variants of the YOLOv8 object detection model for the detection of okra buds. The performance of variants were assessed using mAP@50 and mAP@50–95 to determine the ideally fitting model for the study. Figure 5 demonstrates the comparative performance analysis of the YOLOv8n, YOLOv8s, and YOLOv8m models. The performance of variants was assessed using mAP@50 and mAP@50–95. The metric mAP@50 refers to the mean average precision calculated at a fixed Intersection over Union (IoU) threshold of 0.5. The mAP@50–95 represents the mean average precision with multiple IoU thresholds ranging from 0.5 to 0.95 with a step size of 0.05. These metrics were selected to determine the ideally fitting model for the study.
Overall, all models achieved a mean average precision at 50% Intersection over Union (mAP@50) value exceeding 90% for the detection of okra buds. Although all models performed more than 60% with respect to mAP@50–95, the YOLOV8s model achieved close to 70%, and YOLOv8m slightly surpassed 70%, obtaining the highest accuracy among the experimented models. Additionally, YOLOv8n misclassified 897 images (calculating based on false positive and true negative values), whereas YOLOv8s misclassified 660 images, and YOLOv8m misclassified 580 images only. The recognition time of each custom object detection model was also evaluated using 15 out-of-distribution images. YOLOv8n, YOLOv8s, and YOLOv8m accurately predicted all images and consumed 3.15 s, 4.5 s, and 11.3 s, respectively. Thus, the YOLOv8n model demonstrated a faster detection speed than the other model variants.

3.2. Frame Rate Comparison Across YOLOv8 Variants

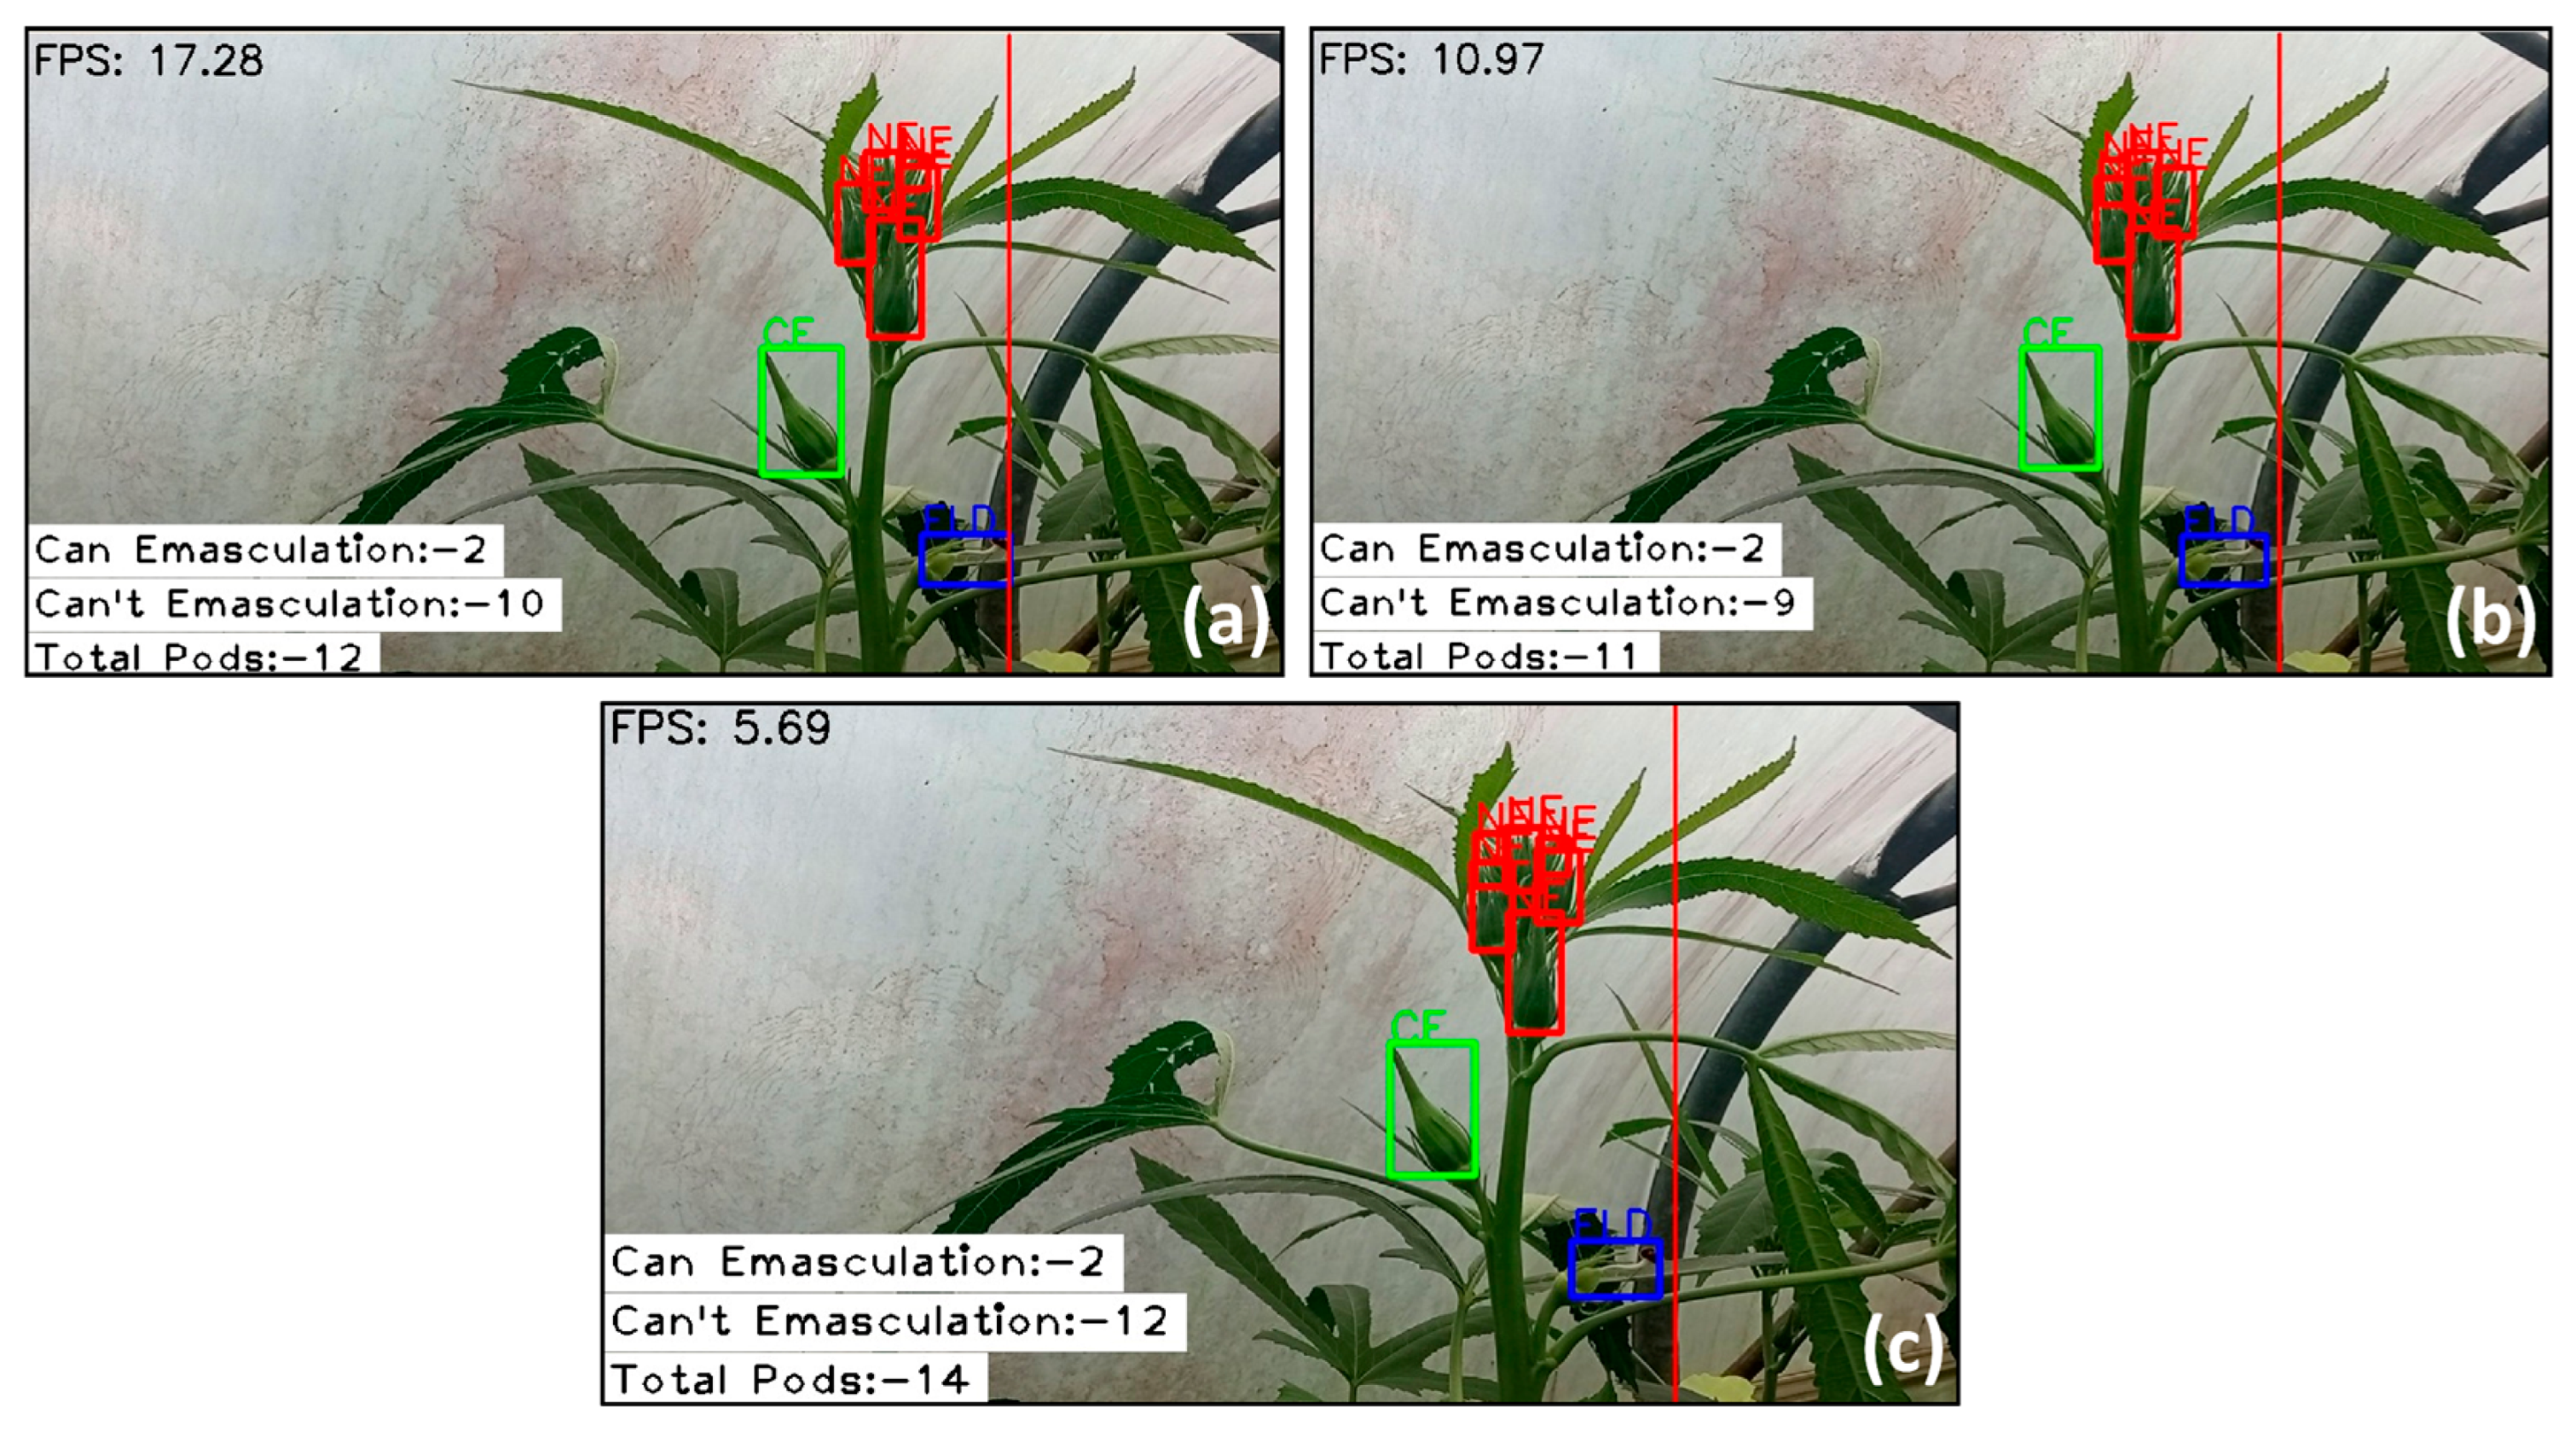
Frames per second (FPS) is an important factor when implementing an object detection model in real time. A higher FPS rate indicates improved real-time performance. This capability is essential, as a lower FPS may increase the risk of missing critical objects or events in the video stream. Low FPS rate leads to missed detections consequent to frequent frame skipping. Furthermore, lower FPS can cause less accurate object tracking for a robot. Tracking algorithms rely on frequent updates from successive frames to maintain accurate object trajectories. Lower FPS refers to fewer updates and potentially inaccurate tracking. As illustrated in Figure 6, YOLOv8n achieved a 15 to 20 FPS range (Figure 6a), whereas YOLOv8s and YOLOv8m achieved 5 to 11 FPS (Figure 6b) and 2 to 6 FPS (Figure 6c), respectively. Therefore, the results indicate that the YOLOv8n model is best suited for detecting okra buds in real-field conditions for our study. Although YOLOv8m and YOLOv8s demonstrate higher mAP values, YOLOv8n emerges as the optimal choice due to its lower rate of missed detections and superior FPS performance. Consequently, we selected YOLOv8n for a more detailed analysis in this study.

3.3. Comprehensive Evaluation of the YOLOv8n Detection Model: Performance and Insights

Since YOLOv8n was recommended for the efficient and reliable recognition of okra buds, considering the overall performance, including its suitability for real-time implementation, the proposed model achieved an overall 90.8% mAP@50 value for detection. The confusion matrix for YOLOv8n is depicted in Figure 7 with respect to multi-class detection. The model demonstrates a commendable accuracy in detection with a 95% correct rate at bud detection for the CE class, 88% accuracy for the ELD class, and over 87% for the NE class.
To identify a suitable confidence threshold value, the precision-confidence curve, recall-confidence curve, and F1 score-confidence curve of the YOLOv8n custom object detection model were analyzed. By analyzing the F1 score-confidence score, the optimal balance between precision and recall was found with a thresholding value of 0.405. Figure S2 depicts how the confidence threshold changes the performance of the object detection model.

3.4. Depth Analysis of the Okra Bud Layers Using OCT Imaging

In this study, a 2D-OCT analysis was performed to observe the depth variations in an okra bud during the sequential excision of its layers until the staminal column was reached. Figure 8 represents the progressive removal of the external layers of an okra bud. The white dashed box regions on Figure 8a–d illustrate the morphological stages of the first excision of the okra bud, highlighting the structural changes that occur at each step. By quantitatively analyzing these cross-sectional images, the total depth (d) from the sepals layer to the petal layer was measured as 0.6 mm. Figure 8e represents the volumetric reconstruction of the bud surface. After the removal of the sepal layer, it was required to remove the petals to avoid damage to the style and the stigma. Therefore, the petal layer was removed by making two consecutive excisions in the same layer. The structural changes in the cross-sections and volumetric images are depicted in the 2nd excision Figure 8f,g and the 3rd excision Figure 8h,i, respectively. According to the acquired 2D and 3D qualitative representations, it was revealed that the total depth from the petals layer to the pollen layer was measured as 3.69 mm. Based on the depth analysis from the OCT images, the precise depth of the staminal layer of the bud was determined. Repeating the OCT analysis on multiple buds enables the establishment of a relationship between the depth of internal layers and the physical properties of the bud, such as weight and size. This relationship can be leveraged to accurately predict the depth required to reach the staminal layer based on a bud’s physical characteristics, thereby improving the precision of the emasculation process.

3.5. Qualitative Depth Analysis Based on 3D-Enface-OCT Representations

The internal structure of the buds Figure 9 presents the 3D morphological stages of all three excision steps, along with the corresponding enface views extracted from the indicated depth range. Figure 9a–c show the morphological stages of the three excision steps, while the subset images Figure 9i–vi represent six representative images extracted from different depth levels. The excision depth ranges of the first, second, and third excision stages are marked with red solid, dashed, and dot-dashed box regions, respectively. These images provide a clear visualization of the internal structures, starting from the beginning to the end of the bud’s sepal layer. Moreover, red arrows indicate the structural differences at each excision stage, highlighting the comparative features across successive tissue layers. To remove the petal layer, care was taken to avoid damaging the stigma layer during manual excision. Therefore, two successive excisions were performed, and the resulting morphological changes were analyzed using OCT imaging. The detailed 3D and enface OCT images revealed the internal layers of the bud, providing a non-invasive and precise method to support the emasculation process. By obtaining accurate depth information of these layers, the potential for automating the emasculation process is significantly enhanced, ensuring that vital reproductive structures remain intact. Furthermore, owing to the high resolution and depth sensitivity of OCT, the acquired enface images revealed distinct structural differences at each excision stage, enabling each stage to be clearly distinguished.

3.6. Correlation with YOLOv8 Prediction and the OCT Depth Analysis

In the proposed method, OCT imaging was fundamentally applied to confirm the most precise excision depth of the buds, which were suitable for the emasculation. The excision depth for each bud, which falls within a confidence score range of 78% to 88%, was chosen for the stepwise excision followed by the OCT imaging process. Since most of the tested buds fall within this confidence range, the results shown in Table 1 clearly emphasize that OCT is capable of determining the approximate excision depth using amplitude scans (A-scans) [29]. This capability is essential for excising buds within the previously mentioned confidence range. The 2D-OCT image provides an estimate for the excision depth, highlighting the relationship between YOLOv8 and OCT as a viable approach for other reasonable confidence score levels. This procedure provided a non-invasive and quantitative validation of the YOLOv8 model’s classification results, connecting surface-level predictions with structural depth information obtained from OCT.

3.7. Gold Standard Analysis of Histogram and Intensity Variations with Varying Light Conditions

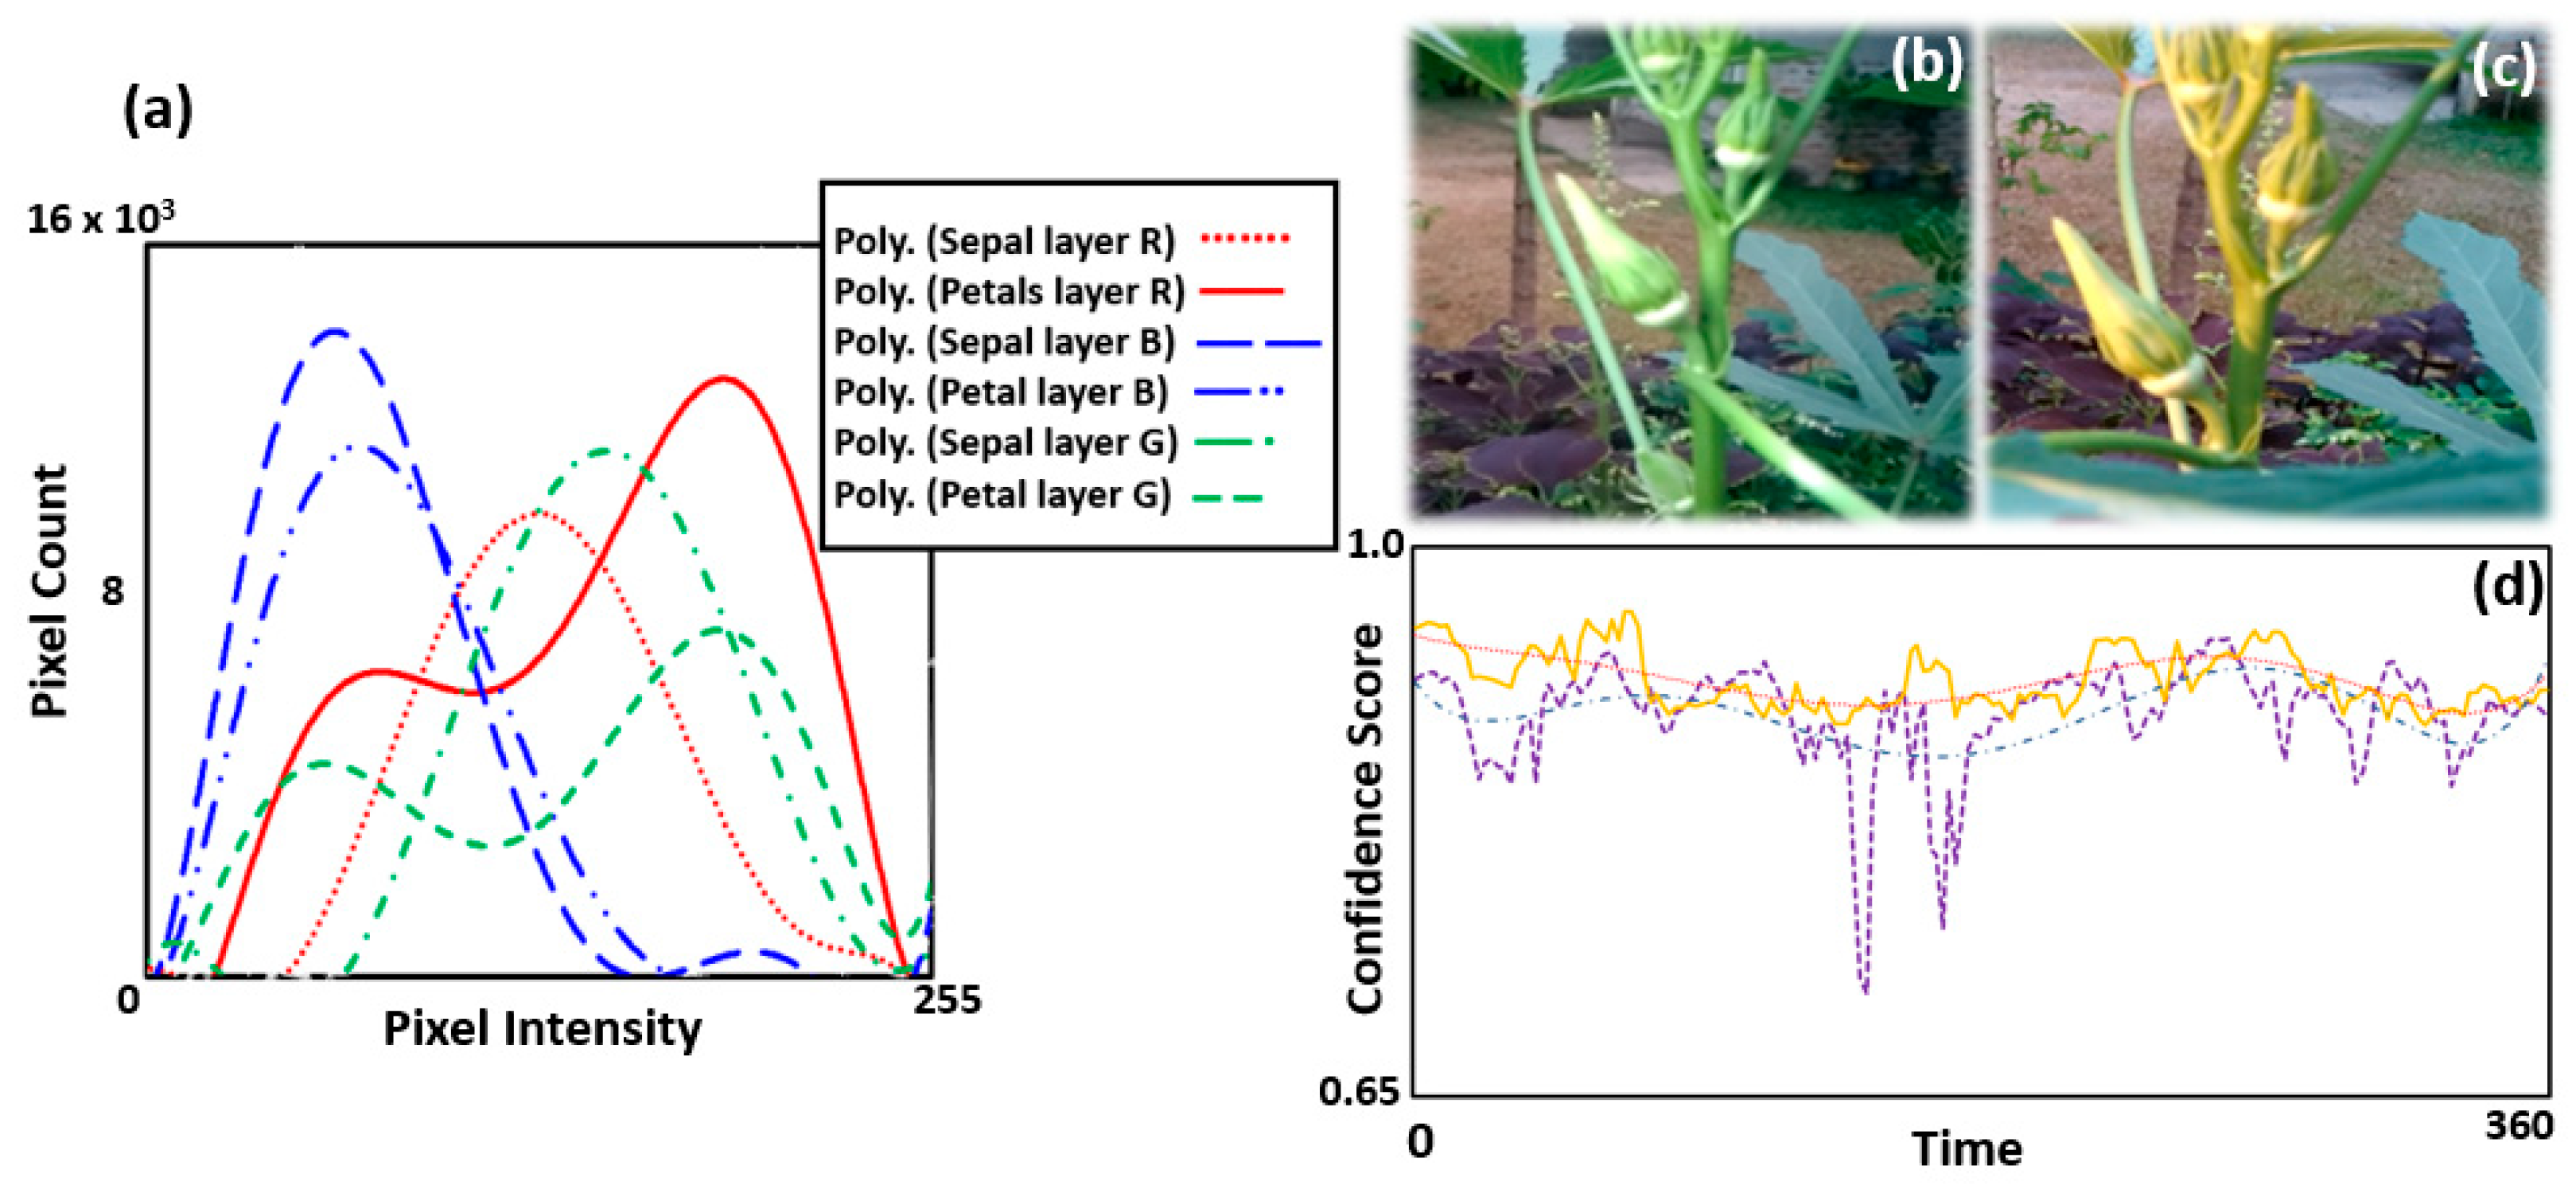
RGB histograms were generated to analyze the color distribution of the sepal and petal layers of the okra bud, as shown in Figure 10a. According to the graph, the red channel of the petal layer exhibits the highest pixel intensity, with values concentrated in the 200–250 range and a pixel count exceeding 14,000. This indicates that the R-values of the petal layer are shifted closer to 255, signifying a higher red intensity compared to the sepal layer. In the green channel, the petal layer shows fluctuating pixel intensities across the 100–250 range, with pixel counts between 4000 and 6000. Conversely, the sepal layer displays a higher concentration of green intensities in the 150–200 range. As illustrated in Figure 10, the blue (B) channel values for both layers are primarily concentrated in the 0–100 range, representing the lowest intensity among the three-color channels.
Although the acquired RGB values are highly influenced by external illumination conditions, analyzing the histograms of the bud’s layers provides valuable insights into the RGB color differences. This aids in the precise identification of color variations across the layers of the bud, which is crucial for developing an automated bud emasculation system. Overall, the red value is the most dominant feature across each layer, while the blue value exhibits the lowest pixel intensities. Thus, these values provide a comprehensive identification of the layers that need to be removed during the emasculation process.
As a secondary component of the gold standard framework, accurately detecting the correct buds under varying lighting conditions is essential for ensuring reliable emasculation during daylight hours. The test video clip of cool light and the confidence score (dotted plot) are shown in Figure 10b,d, respectively, while the same assessment for the warm light system (made with an incandescent lamp) is depicted in Figure 10c,d. The average confidence scores and standard deviation for both cases were calculated after the plotting operation. In the cool light setup, the average confidence score and standard deviation values are 0.85 and 0.03, respectively, whereas in the warm light setup average confidence score and standard deviation values are 0.88 and 0.01. Additionally, in the cool lighting setup, the probability of a confidence score, which is more than 0.85, is 0.5, and that of warm lighting is 0.98. Hence, it was found that the warm light system performed more effectively than the cool light system.

4. Discussion

The outcomes of this study demonstrate the feasibility of integrating deep learning with OCT to achieve accurate, real-time identification of okra buds suitable for emasculation. Compared with earlier studies on soybean, rice, tomato, and kiwifruit, where object detection models achieved mean average precision values ranging between 50% and 94%, the proposed YOLOv8n model achieved an mAP@50 of 90% under field conditions, confirming its suitability for real-time agricultural applications. Although the YOLOv8s and YOLOv8m variants provided slightly higher accuracy, YOLOv8n offered the best trade-off between precision and speed, making it more appropriate for robotics-based implementation. In terms of imaging, this work demonstrates the added value of employing an SS-OCT system for non-invasive depth analysis of okra bud layers. SS-OCT provides a recognized sensitivity advantage over conventional time-domain OCT systems [20], which was essential for visualizing delicate bud structures without damaging reproductive tissues.
Furthermore, the sensitivity and resolution characteristics of OCT are directly tied to the reliability of DL/ML validation in this framework. Higher OCT sensitivity enhances the SNR, enabling clearer visualization of weakly scattering tissues such as early petal and sepal layers and ensuring more accurate depth measurements. The axial resolution of approximately 7.5–10 μm (air) achieved in this study allowed discrimination of thin structural layers, while the lateral resolution provided sharper delineation of sub-surface boundaries. State-of-the-art OCT systems can now achieve axial and lateral resolutions near 2 μm [21], offering even finer structural definition. These parameters are critical for correlating YOLOv8 confidence scores with anatomical depth information, particularly within the boundary range of 78–88% where validation is most essential. In practical terms, improved OCT image fidelity translates into higher-quality validation data, reduced noise, sharper layer boundaries, and more discriminative depth features, which strengthen the interpretability of YOLOv8 predictions and lower misclassification risks.
By combining OCT depth assessment with YOLOv8-based image detection, this study advances beyond traditional RGB histogram and intensity-based frameworks. While lighting variations remain a challenge for vision-based detection, the hybrid system presented reduces dependency on external conditions and enhances robustness. Nevertheless, some limitations remain, including the need for larger datasets from diverse environments and the current reliance on controlled imaging conditions. Future improvements in OCT miniaturization and higher-resolution imaging, together with continued advances in deep learning algorithms, are expected to support the development of fully automated, field-deployable emasculation systems for hybrid okra seed production. As a result, this technique presents a critical advancement in the domains of agricultural biotechnology, agronomy, and seedling production, highlighting the sensitivity advantage of SS-OCT and its suitability for integration with robotics-based applications. While the resolution achieved in this study was sufficient, state-of-the-art OCT systems can provide even higher precision. This pilot investigation primarily served as a feasibility study, confirming that a hybrid YOLOv8–OCT framework can reliably identify okra flower buds suitable for emasculation and quantify internal depth information. Although the dataset was limited to a single geographical location, the results demonstrated that the approach is technically viable and offers a strong baseline for further development. To strengthen generalization, future studies will validate the framework with datasets collected from multiple geographical regions and diverse cultivation environments, thereby addressing variability in bud morphology, environmental conditions, and lighting.

5. Conclusions

The development of an autonomous vision-based system for the assisted emasculation of okra (Abelmoschus esculentus (L.) Moench) enables significant advancement in smart agriculture. The integration of computer vision, AI, and high-resolution OCT offers better solutions to challenges faced by farmers in modern agriculture. In this study, OCT was primarily used as an experimental validation tool to estimate the internal structural layers of the bud. These depth layers served as ground truth for establishing a reliable relationship between bud size and external physical features, which is critical for training and validating computer vision-based models. The proposed non-invasive YOLOv8 hybridized OCT imaging method detects the optimal okra bud, which is suitable for emasculation in real time. The developed YOLOv8 algorithm confirmed the performance accuracy of (mAP50) 90% (overall) with a 3.15-s detection rate. Further, the robustness of the proposed non-invasive, on-field optimal okra bud detection method for emasculation was validated through comparative analyses with established gold standard frameworks, including histogram and intensity variation techniques. While these traditional methods demonstrated satisfactory performance, the developed approach, leveraging a YOLOv8-based detection model integrated with multidimensional OCT imaging, exhibited markedly superior capabilities. This hybrid system not only achieved precise identification of the optimal okra bud for emasculation but also enabled accurate, real-time depth penetration assessment, thereby minimizing the risk of damage to internal floral structures. The ability to measure depth in real time ensures safe and effective bud cover removal, significantly enhancing the emasculation process. As a result, this technique presents a critical advancement in the domains of agricultural biotechnology, agronomy, and seedling production. Its implementation promises to improve the success rate of emasculation and accelerate the overall harvesting process, making it a valuable tool for future precision agriculture applications. While this study primarily focuses on demonstrating the feasibility of okra flower bud emasculation using a hybrid YOLOv8–OCT framework, future research will validate the model with datasets collected from diverse geographical regions to enhance its robustness and generalization ability. In addition, future efforts will explore real-time prediction models capable of estimating emasculation depth without direct OCT input, thereby improving scalability, practicality, and cost-effectiveness for broader agricultural deployment.

Supplementary Materials

The following supporting information can be downloaded at https://www.mdpi.com/article/10.3390/photonics12100966/s1: Figure S1: Histograms and intensity variations based on light Conditions: Gold Standard framework based on digital images; Figure S2: Confidence Threshold Optimization for Object Detection.

Author Contributions

Conceptualization, D.T., A.W. (Abisheka Withanage) and R.E.W.; methodology, D.T. and A.W. (Abisheka Withanage); software, A.W. (Abisheka Withanage); validation, N.S.K., R.E.W. and B.N.S.; formal analysis, B.N.S.; investigation, D.T. and A.W. (Abisheka Withanage); resources, U.W.; data curation, U.K. and R.A.; writing—original draft preparation, D.T., A.W. (Abisheka Withanage) and N.S.K.; writing—review and editing, N.S.K. and R.E.W.; visualization, D.T., A.W. (Abisheka Withanage) and B.N.S.; supervision, R.E.W., U.K., R.A., A.W. (Akila Wijethunge) and B.N.S.; project administration, R.E.W., U.K. and N.K.R.; funding acquisition, R.E.W., N.K.R., M.J. and J.K. All authors have read and agreed to the published version of the manuscript.

Funding

This work was supported by the Sri Lanka Institute of Information Technology, Sri Lanka (Grant Nos. PVC(R&I)/RG/2025/15 and PVC(R&I)/RG/2025/28).

Institutional Review Board Statement

Not applicable.

Informed Consent Statement

Not applicable.

Data Availability Statement

Data is contained within the article and Supplementary Materials.

Conflicts of Interest

The authors declare no conflicts of interest.

Abbreviations

The following abbreviations are used in this manuscript:
2DTwo-Dimensional
3DThree-Dimensional
AIsArtificial Intelligence
CLSCircular Leaf Spot
DLDeep Learning
Faster R-CNNFaster Region-based Convolutional Neural Networks
FPSFrames Per Second
MLMachine Learning
OCTOptical Coherence Tomography
SNRSignal-to-Noise Ratio
SSDSingle Shot MultiBox Detector
SVCSupport Vector Classifier
YOLOYou Only Look Once

References

  1. Kwok, C.T.-K.; Ng, Y.-F.; Chan, H.-T.L.; Chan, S.-W. An Overview of the Current Scientific Evidence on the Biological Properties of Abelmoschus esculentus (L.) Moench (Okra). Foods 2025, 14, 177. [Google Scholar] [CrossRef]
  2. Mishra, G.P.; Seth, T.; Karmakar, P.; Sanwal, S.K.; Sagar, V.; Priti; Singh, P.M.; Singh, B. Breeding Strategies for Yield Gains in Okra (Abelmoschus esculentus L.). In Advances in Plant Breeding Strategies: Vegetable Crops: Volume 9: Fruits and Young Shoots; Al-Khayri, J.M., Jain, S.M., Johnson, D.V., Eds.; Springer International Publishing: Cham, Switzerland, 2021; pp. 205–233. ISBN 978-3-030-66961-4. [Google Scholar]
  3. Suma, A.; Joseph John, K.; Bhat, K.V.; Latha, M.; Lakshmi, C.J.; Pitchaimuthu, M.; Nissar, V.A.M.; Thirumalaisamy, P.P.; Pandey, C.D.; Pandey, S.; et al. Genetic Enhancement of Okra [Abelmoschus esculentus (L.) Moench] Germplasm through Wide Hybridization. Front. Plant Sci. 2023, 14, 1284070. [Google Scholar] [CrossRef]
  4. Pitchaimuthu, M.; Dutta, O.P.; Swamy, K.R.M. Studies on Inheritance of Geneic Male Sterility (GMS) and Hybrid Seed Production in Okra [Abelmoschus esculentus (L.) Moench.]. J. Hortic. Sci. 2012, 7, 199–202. [Google Scholar] [CrossRef]
  5. Ezenarro, J.; García-Pizarro, Á.; Busto, O.; de Juan, A.; Boqué, R. Analysing Olive Ripening with Digital Image RGB Histograms. Anal. Chim. Acta 2023, 1280, 341884. [Google Scholar] [CrossRef]
  6. Akkem, Y.; Biswas, S.K.; Varanasi, A. Smart Farming Using Artificial Intelligence: A Review. Eng. Appl. Artif. Intell. 2023, 120, 105899. [Google Scholar] [CrossRef]
  7. Ghazal, S.; Munir, A.; Qureshi, W.S. Computer Vision in Smart Agriculture and Precision Farming: Techniques and Applications. Artif. Intell. Agric. 2024, 13, 64–83. [Google Scholar] [CrossRef]
  8. Kalupahana, D.; Kahatapitiya, N.S.; Silva, B.N.; Kim, J.; Jeon, M.; Wijenayake, U.; Wijesinghe, R.E. Dense Convolutional Neural Network-Based Deep Learning Pipeline for Pre-Identification of Circular Leaf Spot Disease of Diospyros Kaki Leaves Using Optical Coherence Tomography. Sensors 2024, 24, 5398. [Google Scholar] [CrossRef] [PubMed]
  9. Patel, K.K.; Kar, A.; Jha, S.N.; Khan, M.A. Machine Vision System: A Tool for Quality Inspection of Food and Agricultural Products. J. Food Sci. Technol. 2012, 49, 123–141. [Google Scholar] [CrossRef]
  10. Zhu, R.; Wang, X.; Yan, Z.; Qiao, Y.; Tian, H.; Hu, Z.; Zhang, Z.; Li, Y.; Zhao, H.; Xin, D.; et al. Exploring Soybean Flower and Pod Variation Patterns During Reproductive Period Based on Fusion Deep Learning. Front. Plant Sci. 2022, 13, 922030. [Google Scholar] [CrossRef]
  11. Chen, B.; Liang, J.; Xiong, Z.; Pan, M.; Meng, X.; Lin, Q.; Ma, Q.; Zhao, Y. An Improved YOLOv8 Approach for Small Target Detection of Rice Spikelet Flowering in Field Environments. arXiv 2025, arXiv:2507.20506. [Google Scholar] [CrossRef]
  12. Khan, Z.; Shen, Y.; Liu, H. ObjectDetection in Agriculture: A Comprehensive Review of Methods, Applications, Challenges, and Future Directions. Agriculture 2025, 15, 1351. [Google Scholar] [CrossRef]
  13. Hiraguri, T.; Kimura, T.; Endo, K.; Ohya, T.; Takanashi, T.; Shimizu, H. Shape Classification Technology of Pollinated Tomato Flowers for Robotic Implementation. Sci. Rep. 2023, 13, 2159. [Google Scholar] [CrossRef] [PubMed]
  14. Bataduwaarachchi, S.D.; Sattarzadeh, A.R.; Stewart, M.; Ashcroft, B.; Morrison, A.; North, S.; Huynh, V.T. Towards Autonomous Cross-Pollination: Portable Multi-Classification System for In Situ Growth Monitoring of Tomato Flowers. Smart Agric. Technol. 2023, 4, 100205. [Google Scholar] [CrossRef]
  15. Khanal, S.R.; Sapkota, R.; Ahmed, D.; Bhattarai, U.; Karkee, M. Machine Vision System for Early-Stage Apple Flowers and Flower Clusters Detection for Precision Thinning and Pollination. IFAC-PapersOnLine 2023, 56, 8914–8919. [Google Scholar] [CrossRef]
  16. Li, G.; Suo, R.; Zhao, G.; Gao, C.; Fu, L.; Shi, F.; Dhupia, J.; Li, R.; Cui, Y. Real-Time Detection of Kiwifruit Flower and Bud Simultaneously in Orchard Using YOLOv4 for Robotic Pollination. Comput. Electron. Agric. 2022, 193, 106641. [Google Scholar] [CrossRef]
  17. Ahmad, K.; Park, J.-E.; Ilyas, T.; Lee, J.-H.; Lee, J.-H.; Kim, S.; Kim, H. Accurate and Robust Pollinations for Watermelons Using Intelligence Guided Visual Servoing. Comput. Electron. Agric. 2024, 219, 108753. [Google Scholar] [CrossRef]
  18. Huang, D.; Swanson, E.A.; Lin, C.P.; Schuman, J.S.; Stinson, W.G.; Chang, W.; Hee, M.R.; Flotte, T.; Gregory, K.; Puliafito, C.A.; et al. Optical Coherence Tomography. Science 1991, 254, 1178–1181. [Google Scholar] [CrossRef]
  19. Saleah, S.A.; Kim, S.; Luna, J.A.; Wijesinghe, R.E.; Seong, D.; Han, S.; Kim, J.; Jeon, M. Optical Coherence Tomography as a Non-Invasive Tool for Plant Material Characterization in Agriculture: A Review. Sensors 2023, 24, 219. [Google Scholar] [CrossRef]
  20. Choma, M.A.; Sarunic, M.V.; Yang, C.; Izatt, J.A. Sensitivity Advantage of Swept Source and Fourier Domain Optical Coherence Tomography. Opt. Express 2003, 11, 2183–2189. [Google Scholar] [CrossRef]
  21. Cogliati, A.; Canavesi, C.; Hayes, A.; Tankam, P.; Duma, V.-F.; Santhanam, A.; Thompson, K.P.; Rolland, J.P. MEMS-Based Handheld Scanning Probe with Pre-Shaped Input Signals for Distortion-Free Images in Gabor-Domain Optical Coherence Microscopy. Opt. Express 2016, 24, 13365–13374. [Google Scholar] [CrossRef] [PubMed]
  22. He, B.; Zhang, Y.; Zhao, L.; Sun, Z.; Hu, X.; Kang, Y.; Wang, L.; Li, Z.; Huang, W.; Li, Z.; et al. Robotic-OCT Guided Inspection and Microsurgery of Monolithic Storage Devices. Nat. Commun. 2023, 14, 5701. [Google Scholar] [CrossRef] [PubMed]
  23. Wang, X.; Feng, Y.; Wang, Y.; Zhu, H.; Song, D.; Shen, C.; Luo, Y. Enhancing Optical Non-Destructive Methods for Food Quality and Safety Assessments with Machine Learning Techniques: A Survey. J. Agric. Food Res. 2025, 19, 101734. [Google Scholar] [CrossRef]
  24. Roboflow: Computer Vision Tools for Developers and Enterprises. Available online: https://roboflow.com/ (accessed on 11 November 2024).
  25. Zhai, X.; Huang, Z.; Li, T.; Liu, H.; Wang, S. YOLO-Drone: An Optimized YOLOv8 Network for Tiny UAV Object Detection. Electronics 2023, 12, 3664. [Google Scholar] [CrossRef]
  26. PyCharm: The Python IDE for Data Science and Web Development. Available online: https://www.jetbrains.com/pycharm/ (accessed on 12 November 2024).
  27. Colab. Google. Available online: https://colab.google/ (accessed on 12 November 2024).
  28. VegaTM Series SS-OCT Systems. Available online: https://www.thorlabs.com (accessed on 27 July 2025).
  29. Ravichandran, N.K.; Wijesinghe, R.E.; Shirazi, M.F.; Park, K.; Lee, S.-Y.; Jung, H.-Y.; Jeon, M.; Kim, J. In Vivo Monitoring on Growth and Spread of Gray Leaf Spot Disease in Capsicum Annuum Leaf Using Spectral Domain Optical Coherence Tomography. J. Spectrosc. 2016, 2016, 1–6. [Google Scholar] [CrossRef]
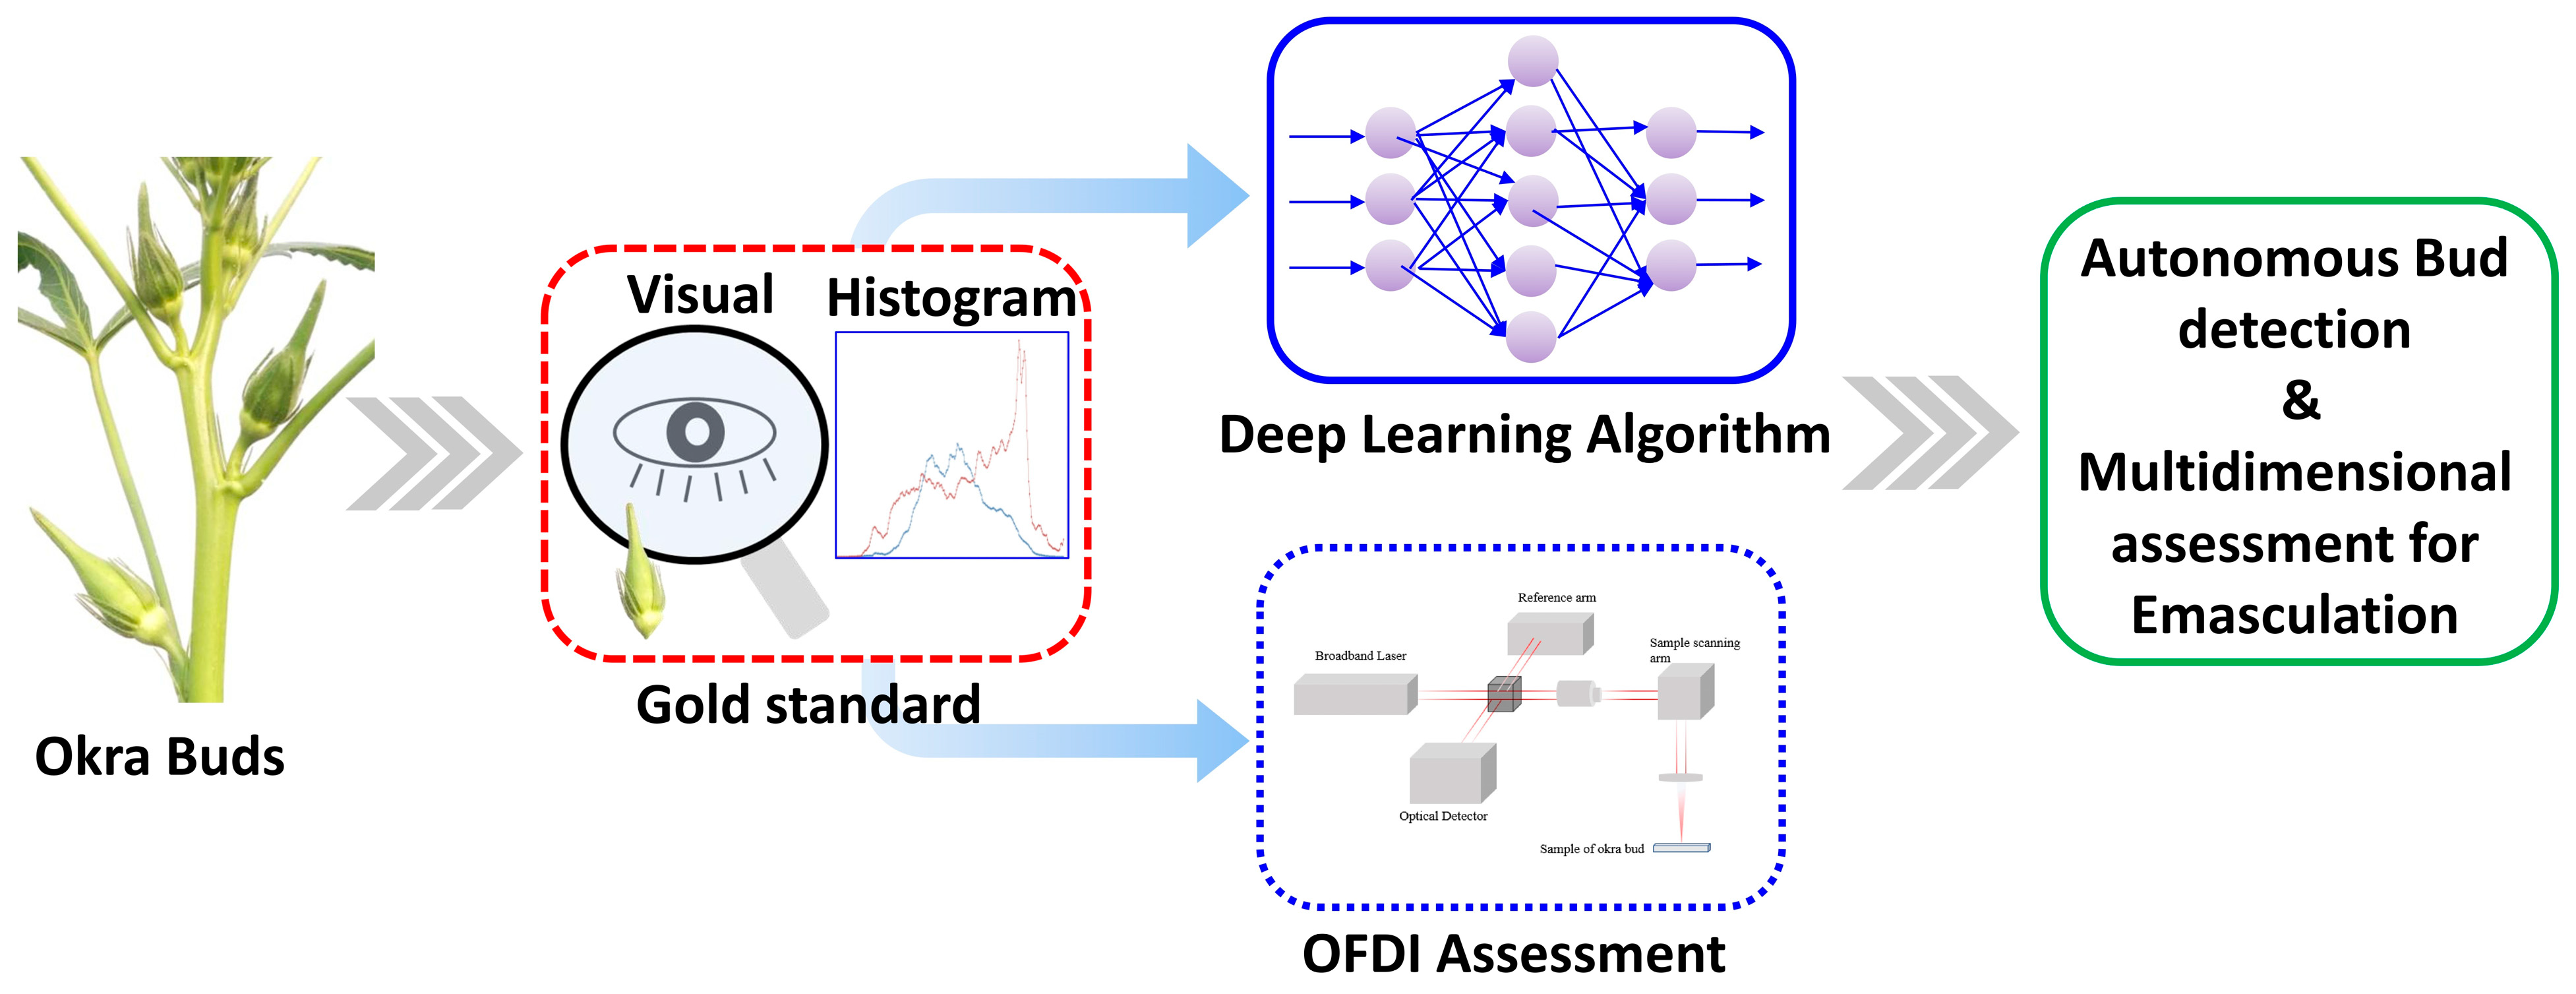
Figure 1. Proposed framework for autonomous bud identification and depth estimation.
Photonics 12 00966 g001
Figure 2. (a,b) Representative images of okra buds acquired in a polytunnel, with buds highlighted using red rectangles (c,d) Detection of okra buds based on emasculation status: emasculated buds (EM) labeled with yellow solid rectangles, buds suitable for emasculation (CE) labeled with magenta dashed rectangles, and buds unsuitable for emasculation (NE) labeled with blue dotted rectangles. The average bud size ranges between 50 mm and 60 mm.
Photonics 12 00966 g002
Figure 3. (a) Architecture of the YOLOv8 model, illustrating its key components, including the backbone, neck, and detection head, which work together to enhance feature extraction, multi-scale processing, and object detection accuracy [25]. (b) The detection pipeline of the YOLO model (i) Input image, (ii) Input image divided into an S × S grid, (iii) Each grid cell predicts bounding boxes (shown as black boxes) and confidence scores, (iv) each grid cell predicts class probability maps, and (v) final detection result (shown as a red box).
Photonics 12 00966 g003
Figure 4. (a) Schematic diagram of the swept source OCT (SS-OCT) system configuration, highlighting key components, including the reference arm, sample arm, spectrometer, computer, fiber coupler (FC), collimator (C), lenses (L), mirror (M), and balanced detector (BD). (b) Schematic illustration of different excision stages of the okra bud.
Photonics 12 00966 g004
Figure 5. mAP@50–95 and mAP@50 values of different YOLOv8 variants, illustrating their performance in object detection accuracy.
Photonics 12 00966 g005
Figure 6. Frames per second (FPS) comparison among different YOLOv8 variants (a) FPS count for YOLOv8n, (b) FPS count for YOLOv8s, and (c) FPS count for YOLOv8m. (refer to Figure S2 in the Supplementary for threshold values.)
Photonics 12 00966 g006
Figure 7. Test results are represented by the normalized confusion matrix, illustrating the classification performance of the model.
Photonics 12 00966 g007
Figure 8. (ad) Morphological (2D-OCT) stages of the first excision of the okra bud, illustrating the structural changes at each step. (red arrows show the scanning direction) (e) 3D-OCT visualization of the bud layers for enhanced structural analysis. (f,g) and (h,i) depict the cross-sectional and volumetric visualizations of the second and third excisions, respectively.
Photonics 12 00966 g008
Figure 9. (ac) 2D-OCT visualizations acquired from the 1st to 3rd excision stages, highlighting the depth levels for enface extraction, while subset images (ivi) depict the corresponding acquired multiple enface depth images that represent six different depth levels. The inset short arrow signs indicate the exact location of excision, while the red color solid, dashed, and dot-dashed long arrows depict the visualized depth levels of each corresponding excisions.
Photonics 12 00966 g009
Figure 10. (a) Color histograms (R, G, B) representing the intensity distribution for different layers of the okra buds, (b,c) acquired real-time cool light and warm light images, (d) confidence levels over time in cool light and warm light conditions. Description of legend, (a): Red dotted line: Red pixel count of sepal layer, Red solid line: Red pixel count of petals layer, Green dashed with dotted line: Green pixel count of sepal layer, Green small dashed line: Green pixel count of petals layer, Blue long dashed line: Blue pixel count of sepal layer, Blue long dashed with dotted line: Blue pixel count of petals layer. (d): Yellow solid line, warm light condition, confidence level variation over time. Purple dashed line: warm light condition confidence level variation over time.
Photonics 12 00966 g010
Table 1. The details of the OCT Amplitude Scan Derived Excision Depths of Okra Buds Classified as Suitable for Emasculation.
Confidence ScoresExcision StepAverage Depth (mm)Standard Deviation
78–88%1st excision0.530.15
2nd excision1.790.23
3rd excision2.160.22
Total average depth4.48
Disclaimer/Publisher’s Note: The statements, opinions and data contained in all publications are solely those of the individual author(s) and contributor(s) and not of MDPI and/or the editor(s). MDPI and/or the editor(s) disclaim responsibility for any injury to people or property resulting from any ideas, methods, instructions or products referred to in the content.