Article

Prediction of Shock Wave Velocity Temporal Evolution Induced by Ms-Ns Combined Pulse Laser Based on Attention-LSTM

School of Information and Control Engineering, Jilin University of Chemical Technology, Jilin 132022, China
*
Author to whom correspondence should be addressed.
Photonics 2025, 12(10), 1040; https://doi.org/10.3390/photonics12101040
Submission received: 18 September 2025 / Revised: 15 October 2025 / Accepted: 18 October 2025 / Published: 21 October 2025
(This article belongs to the Special Issue Lasers and Complex System Dynamics)

Abstract

This study systematically examined shock wave velocity induced by millisecond–nanosecond combined-pulse laser (ms–ns CPL) at a fixed ns laser energy density of 6 J/cm2, exploring the effects of varying pulse delays of 0 to 3 ms and ms laser energy densities of 226.13 J/cm2, 301 J/cm2 and 376.89 J/cm2. The temporal evolution of shock wave velocity induced by varying laser parameters was predicted by an attention mechanism-based long short-term memory algorithm (Attention-LSTM). The dependence between laser parameters and the evolution of shock wave velocity was captured by the LSTM layer. An attention mechanism was utilized to adaptively increase the weights of important time points during the propagation of the shock wave, thereby improving prediction accuracy. The experimental data corresponding to ms laser energy densities of 226.13 J/cm2 and 301 J/cm2 were set as the training set. The ms laser energy density of 376.89 J/cm2 experimental data was set as test set to evaluate the generalization ability of the model under unknown ms laser energy. The results indicate that when ms laser energy density is 376.8 J/cm2, the pulse delay is 2.2 ms. The shock wave velocity induced by the CPL increased by 50.77% compared with that induced by a single ns laser. The proposed Attention-LSTM model effectively predicts the evolutionary characteristics of shock wave velocity. The mean absolute error (MAE), root mean square error (RMSE), mean bias error (MBE) and the correlation coefficient (R2) of the test set are 7.65, 9.01, 1.47 and 0.98, respectively. This study provides a new data-driven approach for predicting the shock wave behavior induced by combined laser parameters and provides valuable guidance for optimizing laser process parameter combinations.

1. Introduction

Shock wave is a high-intensity stress wave induced by the interaction between high-energy laser and matter [1,2,3]. It has been extensively applied in material science, precision manufacturing, biomedicine and national defense technology [4,5,6,7]. For instance, the laser shock peening (LSP) technology uses the residual compressive stress induced by the shock wave to improve the fatigue life of materials, while the shock wave is the key physical process to achieve target compression strengthening [8,9,10,11]. However, the propagation of shock waves involves complex multi-physical field coupling processes, including laser energy absorption, plasma formation and wavefront evolution [12,13]. Consequently, a comprehensive investigation of the temporal-spatial evolution and variation patterns of propagation velocity in shock waves is of great scientific significance.
At present, the research on shock wave propagation mainly relies on experimental observation and numerical simulation. However, the accuracy of numerical methods strongly depends on the rationality of constitutive models and boundary conditions [14,15,16,17]. J. Li et al. [15,17] conducted a series of studies on the evolution of shock waves induced by millisecond–nanosecond combined-pulse laser (ms-ns CPL) with pulse durations of 12 ns and 1 ms and wavelengths of 1064 nm on silicon with different pulse delays and laser energies. They demonstrated that inverse bremsstrahlung absorption acts simultaneously with surface absorption during ns laser irradiation, resulting in the formation of a double shock wave. Moreover, their results indicated that the plasma induced by the ms laser serves as a propagation medium that can effectively accelerate the ns laser-induced shock wave. J. Radziejewska et al. [18] investigated the pressure of shock wave induced by an Nd: YAG pulse laser with a wavelength of 1064 nm and a pulse duration of 10 ns on different inertial layer steel plates. When glass was used as the inertial layer, the pressure reached approximately twice that obtained with water, at 92 MPa and 53.3 MPa, respectively. Heesuk Jang et al. [19] studied the propagation of shock waves induced by 1064 nm Nd: YAG (pulse duration: 9 ns) and 2940 nm Er: YAG (pulse duration: 194 ns) lasers in water, using a high-speed shadowgraph method for visualization. The results show that the shock wave induced by the near-infrared Nd: YAG laser has a narrow propagation range in the horizontal direction, while the mid-infrared Er: YAG shock wave has a wide propagation range in the vertical direction. Rehman, Z.U. et al. [20] used an Nd: YAG laser beam with a pulse width of 6 ns and a wavelength of 1064 nm to ablate a copper target. They found that the shock wave velocity and pressure increased rapidly with rising laser energy density and tended to saturate at higher energy levels, and the shock wave velocity has a power-law relationship with the propagation distance. Haili Jiang et al. [21] found a similar trend in the propagation of air plasma shock waves induced by a 532 nm Nd: YAG laser with energies of 9.14, 10.83 and 12.31 mJ. Yaode Wang et al. [22] simulated the spatial distribution of shock wave pressure induced by laser ablation of an aluminum target using a 1064 nm laser with a pulse width of 5 ns, based on the kinetic theory. They obtained the variation of the shock wave pressure field distribution with time by simulation. X. Jiang et al. [23] used the two-phase flow gas dynamics theory to study the pressure of shock wave on Al 2024 induced by Nd: YAG laser with a pulse width of 20 ns. The calculation results were verified by the polyvinylidene fluoride (PVDF) transducers. In addition, existing theoretical models still exhibit limitations in describing nonlinear propagation effects, and the accurate prediction of shock wave propagation velocity has become a key scientific challenge in this field [24,25,26].
Currently, research on the integration of artificial intelligence (AI) algorithms into laser technology mainly focuses on predicting the mechanical properties of targets after LSP. Silva Sajin Jose et al. [27] used a 1064 nm Nd: YAG laser with a pulse width of 15 ns to perform shock peening on Nimonic 263. They found the XGBoost could predict the defection of a scanning electron microscope (SEM) image with an accuracy of 0.95. Jiajun Wu et al. [28] employed a 1064 nm Nd: YAG laser with a pulse width of 12 ns to perform shock peening on TC4 titanium alloy. The artificial neural network (ANN) was used to predict the residual stress of the target after LSP with the R2, MAE and RMSE values of 0.997, 7.226 and 9.956, respectively. However, there are few reports on the application of AI to the prediction of laser-induced shock wave velocity. As an illustration, Jingyi Li et al. [29] investigated the propagation law of shock wave induced by 1064 nm ms-ns CPL. The laser parameters are 6, 12 and 24 J/cm2 of the ns laser energy density, 226.13 J/cm2 of the ms laser energy density, and 0, 0.4 and 0.8 ms of the pulse delay. The convolutional neural network (CNN) is used to predict the shock wave velocity induced by CPL with the R2, MAE and RMSE values of 0.9865, 3.54 and 3.01, respectively. Nevertheless, The CNN model in the above literature is primarily used to predict the shock wave velocity induced by CPL with different ns laser energy density. At present, the prediction of the shock wave velocity induced by CPL with the same ns laser energy density and varying ms laser energy density has not been reported.
Based on the combination of experiment and AI prediction, this study systematically examines the dynamic propagation behavior of shock wave induced by CPL with different laser delay conditions. By designing a controllable CPL loading experiment, and employing high spatial and temporal resolution diagnostic technology, the variation law and propagation evolution process of shock wave velocity are explored. The Attention-LSTM shock wave velocity prediction model is further established to realize the accurate prediction of the shock wave velocity induced by the CPL. The results provide theoretical guidance for the engineering application of laser shock technology.

2. Materials and Methods

2.1. Experiment

The experimental apparatus used in this study is shown in Figure 1, including an oscilloscope, a ms laser (Beijing Guoke Century Laser Technology Co., Beijing, China), a ns laser (Beamtech Optronics Co., Beijing, China), a laser energy meter (Ophir, Jerusalem, Israel), a digital pulse delay generator DG645 (Stanford Research Systems, Sunnyvale, CA, USA), three focusing lens with a focal length of f = 500 mm, a spectroscope with 10% reflection and 90% transmission, a 532 nm continuous green laser (New Industries, Changchun, China), a beam expander, an attenuator and a high-speed camera (Photron, Tokyo, Japan). The wavelength of the ms laser is 1064 nm. The ns laser used in this experiment is a Nd: YAG laser operating at a wavelength of 1064 nm. The pulse durations of ms pulse and ns pulse are 1 ms and 12 ns. The laser diameters of ms pulse and ns pulse are 1.3 mm and 1 mm. The repetition frequency of ns laser is 1 Hz. The continuous green laser is only used for high-speed camera lighting and is not involved in the generation of plasma. Two laser beams irradiate the same point on the target through the focusing lens (Lens 1, Lens 2), with an angle of 5° between them. The laser energy is measured in real time by a spectroscope (S) and a laser energy meter. The pulse delay of the two lasers is controlled by the DG645 pulse delay generator (DG645) and monitored by photoelectric detectors (PD1, PD2) in real time on the oscilloscope. The target used in the experiment is silicon (100), N-doped, with a surface roughness of 0.2 nm and a purity of 6N; its thickness is 4 mm, and the radius is 12.7 mm. Prior to laser irradiation, the target surface is cleaned sequentially with alcohol and deionized water to remove surface contaminants and ensure a uniform surface condition. The time from the beginning of ns laser irradiation is defined as t. The delay time between the ms laser and the ns laser is defined as Δt. The ns laser energy density is defined as Ens. The ms laser energy density is defined as Ems.
In the experiment, the high-speed camera has an exposure time of 1/6,300,000 s, a frame rate of 200,000 fps, and a resolution of 384 × 160. The 532 nm continuous green laser beam is perpendicular to the plasma expansion zone through the beam expander, enabling the high-speed camera to capture the temporal evolution of plasma and shock waves in real time. By measuring the spatial position of the shock wave front from the target surface, the propagation velocity of the shock wave is calculated.
v = L n + 1 L n t n + 1 t n   ,
where L n and L n + 1 are the propagation distances of the laser shock wave from the target surface with different time sequences t n and t n + 1 .

2.2. LSTM

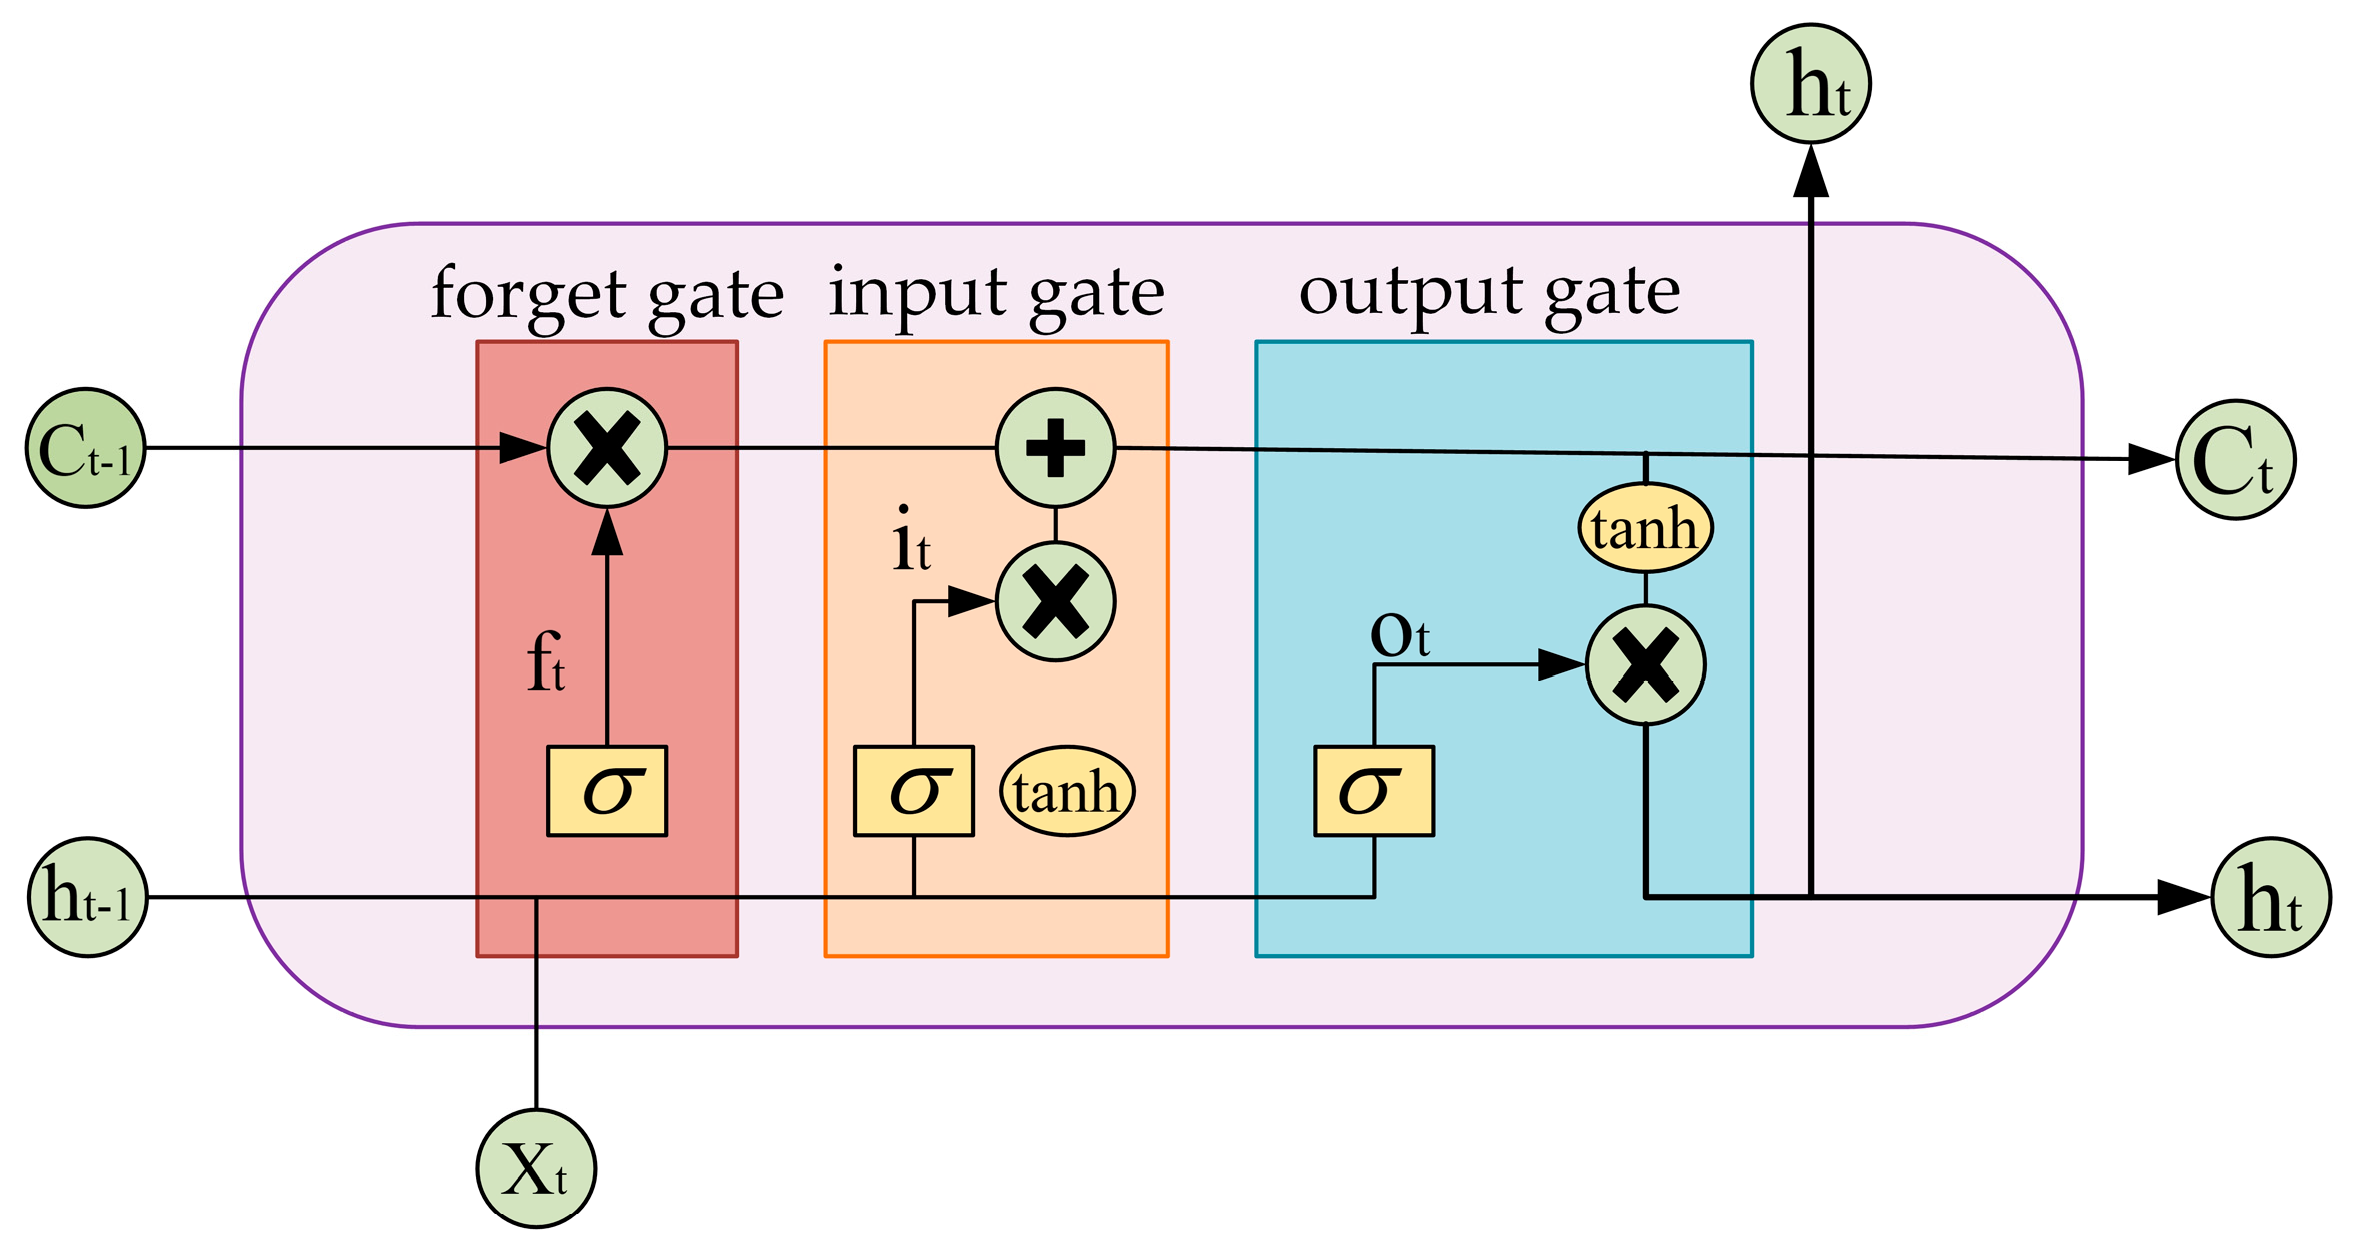
As a crucial variant of recurrent neural networks (RNNs), LSTM can effectively capture long-term dependencies from sequential data to model and predict more accurately. Based on the concepts of “cell state” and gating mechanisms, LSTM can avoid the common problems of gradient vanishing or explosion in the RNN. The LSTM unit structure is shown in Figure 2. The sequence is input into the LSTM unit and sequentially passes through the forget gate f t , the input gate i t and the output gate O t . The current hidden state h t and the cell state C t are calculated. f t is responsible for adjusting the forget extent of the current input x t and the previous hidden state h t 1 to forget unrelated information from the current task. i t can adjust the update extent of the input x t to the current cell state. The current cell state C t can be updated by f t and i t to retain important information and discard irrelevant information. O t can calculate the current output according to the previous hidden state h t 1 and the current cell state C t . The design of the LSTM can retain the influence of previous laser parameters on shock wave velocity while filtering out irrelevant information, thereby capturing the dependencies between laser parameters and the shock wave velocity sequential evolution accurately. The equations are given as follows:
f t = σ W f h t 1 , x t + b f ,
i t = σ W f h t 1 , x t + b i ,
C ˜ t = t a n h W c h t 1 , x t + b c ,
t a n h ( x ) = x , x > 0 α e x 1 , x 0 ,
C t = i t C ˜ t + f t C t 1 ,
O t = σ W o h t 1 , x t + b o ,
h t = O t t a n h ( C t ) ,
where σ is the sigmoid activation function. C t 1 is the previous cell state. b f and W f are the bias value and input weight of the forget gate f t , respectively. C ˜ t represents the new candidate cell state obtained by the activation function tanh. b o and W o are the bias value and input weight of the output gate O t , respectively.
In this study, based on the state dependencies of shock wave velocity, the ms laser energy density and pulse delay are used as static input characteristics and concatenated with the previous shock wave velocity as the current input x t . LSTM captures the non-linear time-varying characteristics of shock wave velocity through its gating mechanism and continuously updates them via the cell states. The shock wave velocity also depends on the laser parameters. LSTM establishes the dependencies between laser parameters and shock wave velocity attenuation through the gradient preservation mechanism (controlled by the forget gate).

2.3. Attention Mechanism

The attention mechanism can quickly locate the focus of attention by scanning globally to obtain more detailed information through imitating the human visual attention. Incorporating the attention mechanism into LSTM enables the model to focus on the most important information dynamically during data processing, thereby improving the prediction accuracy.
The attention mechanism consists of three steps. Firstly, the attention score e t i is calculated. Secondly, the attention scores are normalized by the softmax function to obtain the attention weights α t i , which reflect the importance of each time for the current prediction. Finally, the context vector F t for predicting the shock wave velocity is computed as a weighted sum of the inputs according to the attention weights. The calculation is defined by the following equations:
e t i = f W e h i , h t ,
α t i = e x p ( e t i ) j = 1 T e x p ( e t j ) ,
F t = i = 1 T a t i h i ,
In the equations, h i is the hidden state at each previous time i, and h t is the hidden state at the current time t. W e is the weight matrix, and f is the non-linear activation function. By leveraging the attention weights, the model can pay more attention to the previous time, which has the greatest impact on shock wave velocity prediction, enabling more accurate extraction of temporal dependencies within the sequential data.

2.4. Attention-LSTM Architecture

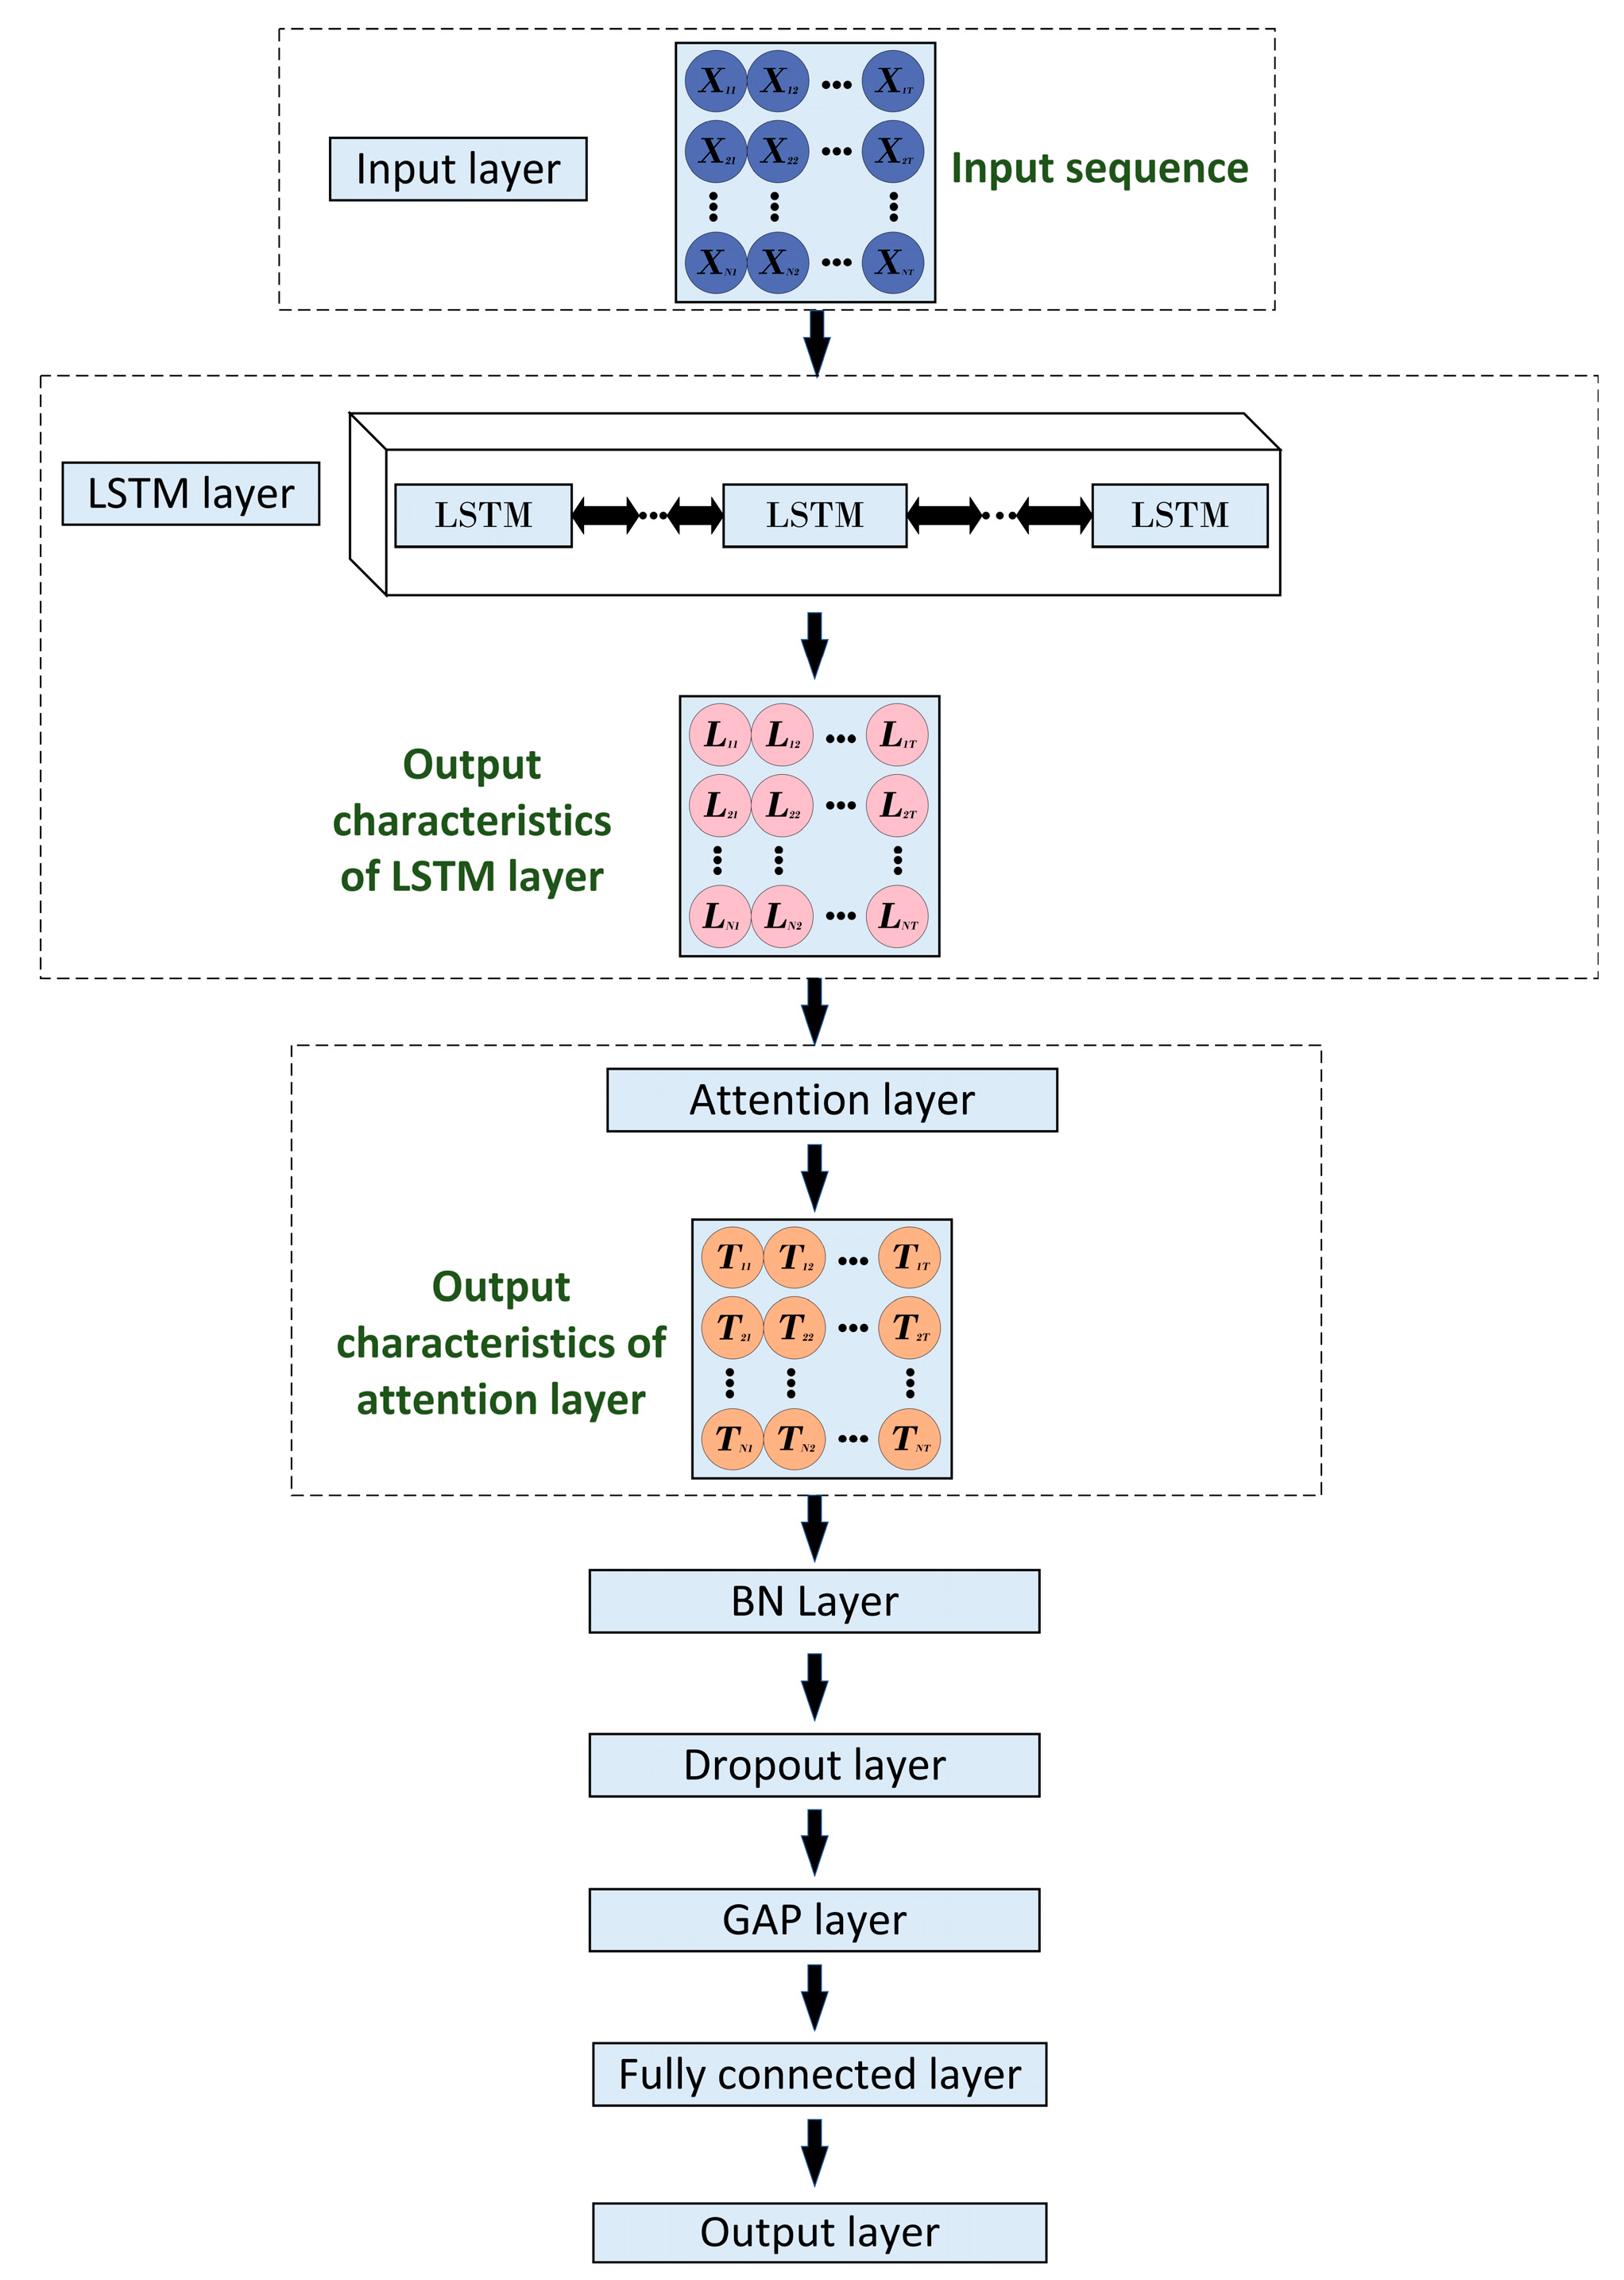
The Attention-LSTM is designed to fully leverage the sequence modeling ability of LSTM networks, and the attention mechanism was applied to improve the degree of concern about the important features in the shock wave velocity sequence. The structure of Attention-LSTM is shown in Figure 3. An 8-layer Attention-LSTM is established, consisting of an input layer, an LSTM layer, an attention layer, a batch normalization (BN) layer, a dropout layer, a one-dimensional global average pooling (GAP) layer, a fully connected layer, and a regression output layer. Firstly, the input layer is defined as X = x 1 ,   x 2 ,   x 3 ,   x 4   x t with 7 dimensions of feature, including ms laser energy density, pulse delay and historical shock wave velocity sequence. The sequence is input into the LSTM layer. Each LSTM unit receives the current sequence, the previous hidden state h t 1 and the cell state c t 1 . Thus, the current hidden state h t and the cell state c t are calculated. Subsequently, the calculated values are input into the attention layer to evaluate the degree of concern about the shock wave velocity at each time point, and the corresponding weights are adjusted. Then the sequence is input into the BN layer and the dropout layer. The BN layer realizes the dimensional unification of multiple features by automatic scaling and forms a complementary regularization mechanism with the dropout layer to enhance the prediction effect. GAP can reduce the parameter number of fully connected layers by dimensionality reduction to alleviate the risk of overfitting.
In this study, one “set” of data refers to a single temporal sequence of shock wave velocity measurements obtained under a specific combination of Ems, Δt and t. Each sequence consists of four time steps with a sampling interval of 5 µs. All data sets were acquired from independent experiments conducted under identical conditions. Each experiment was repeated five times, and the average values were used for analysis. As shown in Table 1, each sample number list in the table corresponds to its respective t in sequential order. A total of 264 sets of shock wave velocity data with ns laser energy density of 6 J/cm2, ms laser energy density of 226.13 J/cm2 and 301 J/cm2 of the CPL are set as the training set. A total of 128 sets of data with a ms laser energy density of 376.89 J/cm2 of the CPL are set as the test set. The results showed that after repeated verification, the training epochs are set to 60, the learning rate is 0.05, the LSTM hidden units are 15, the dropout rate is 0.2, and the batch size is 8. The model is trained using the Adam optimizer with RMSE as the loss function. LSTM weights are initialized with the Glorot method, biases set to 0, and the random seed is fixed at 100,000,000 for reproducibility. Weight updates are handled automatically by the Adam optimizer. The training is stopped when the preset number of epochs is reached. The number of epochs is determined experimentally based on the accuracy of the validation set. The initial learning rate is set to 0.05 and decayed by a factor of 0.5 every 10 epochs. A five-fold cross-validation strategy is adopted to ensure robustness and generalization. After finishing the training procedure, the testing samples are input into the trained model to obtain testing velocity results.

Model Evaluation Indicators

In order to quantitatively evaluate the prediction model, MAE, RMSE, MBE and R2 are selected as evaluation indices. The calculation equations of these indices are shown in Equations (12)–(15). MAE is the average of the absolute error between the predicted and actual values. A smaller MAE indicates a lower average error and a higher consistency between the predicted results and the actual observations.
M A E = 1 n i = 1 n y i y ^ i ,
RMSE is the square root average of the squared error between the predicted and actual values. The lower the RMSE, the smaller the fluctuation of the model and the better the stability of the prediction results.
R M S E = 1 n i = 1 n ( y i y ^ i ) 2 ,
MBE is a common metric for evaluating regression models which is used to measure the systematic deviation between predicted and actual values. A positive MBE indicates that the model generally overestimates the actual values, while a negative MBE indicates an overall underestimation.
M B E = 1 n i = 1 n y ^ i y i ,
R2 is one of the key indices to evaluate the performance of LSTM which quantifies the ability of the model to explain the variance of the target variable. A higher R2 value indicates a stronger explanatory capability of the model and greater reliability of the prediction results.
R 2 = 1 i = 1 n ( y i y ^ i ) 2 i = 1 n ( y i y ¯ ) 2 ,

3. Results and Discussion

3.1. The Variation Law of Shock Wave Velocity Induced by CPL

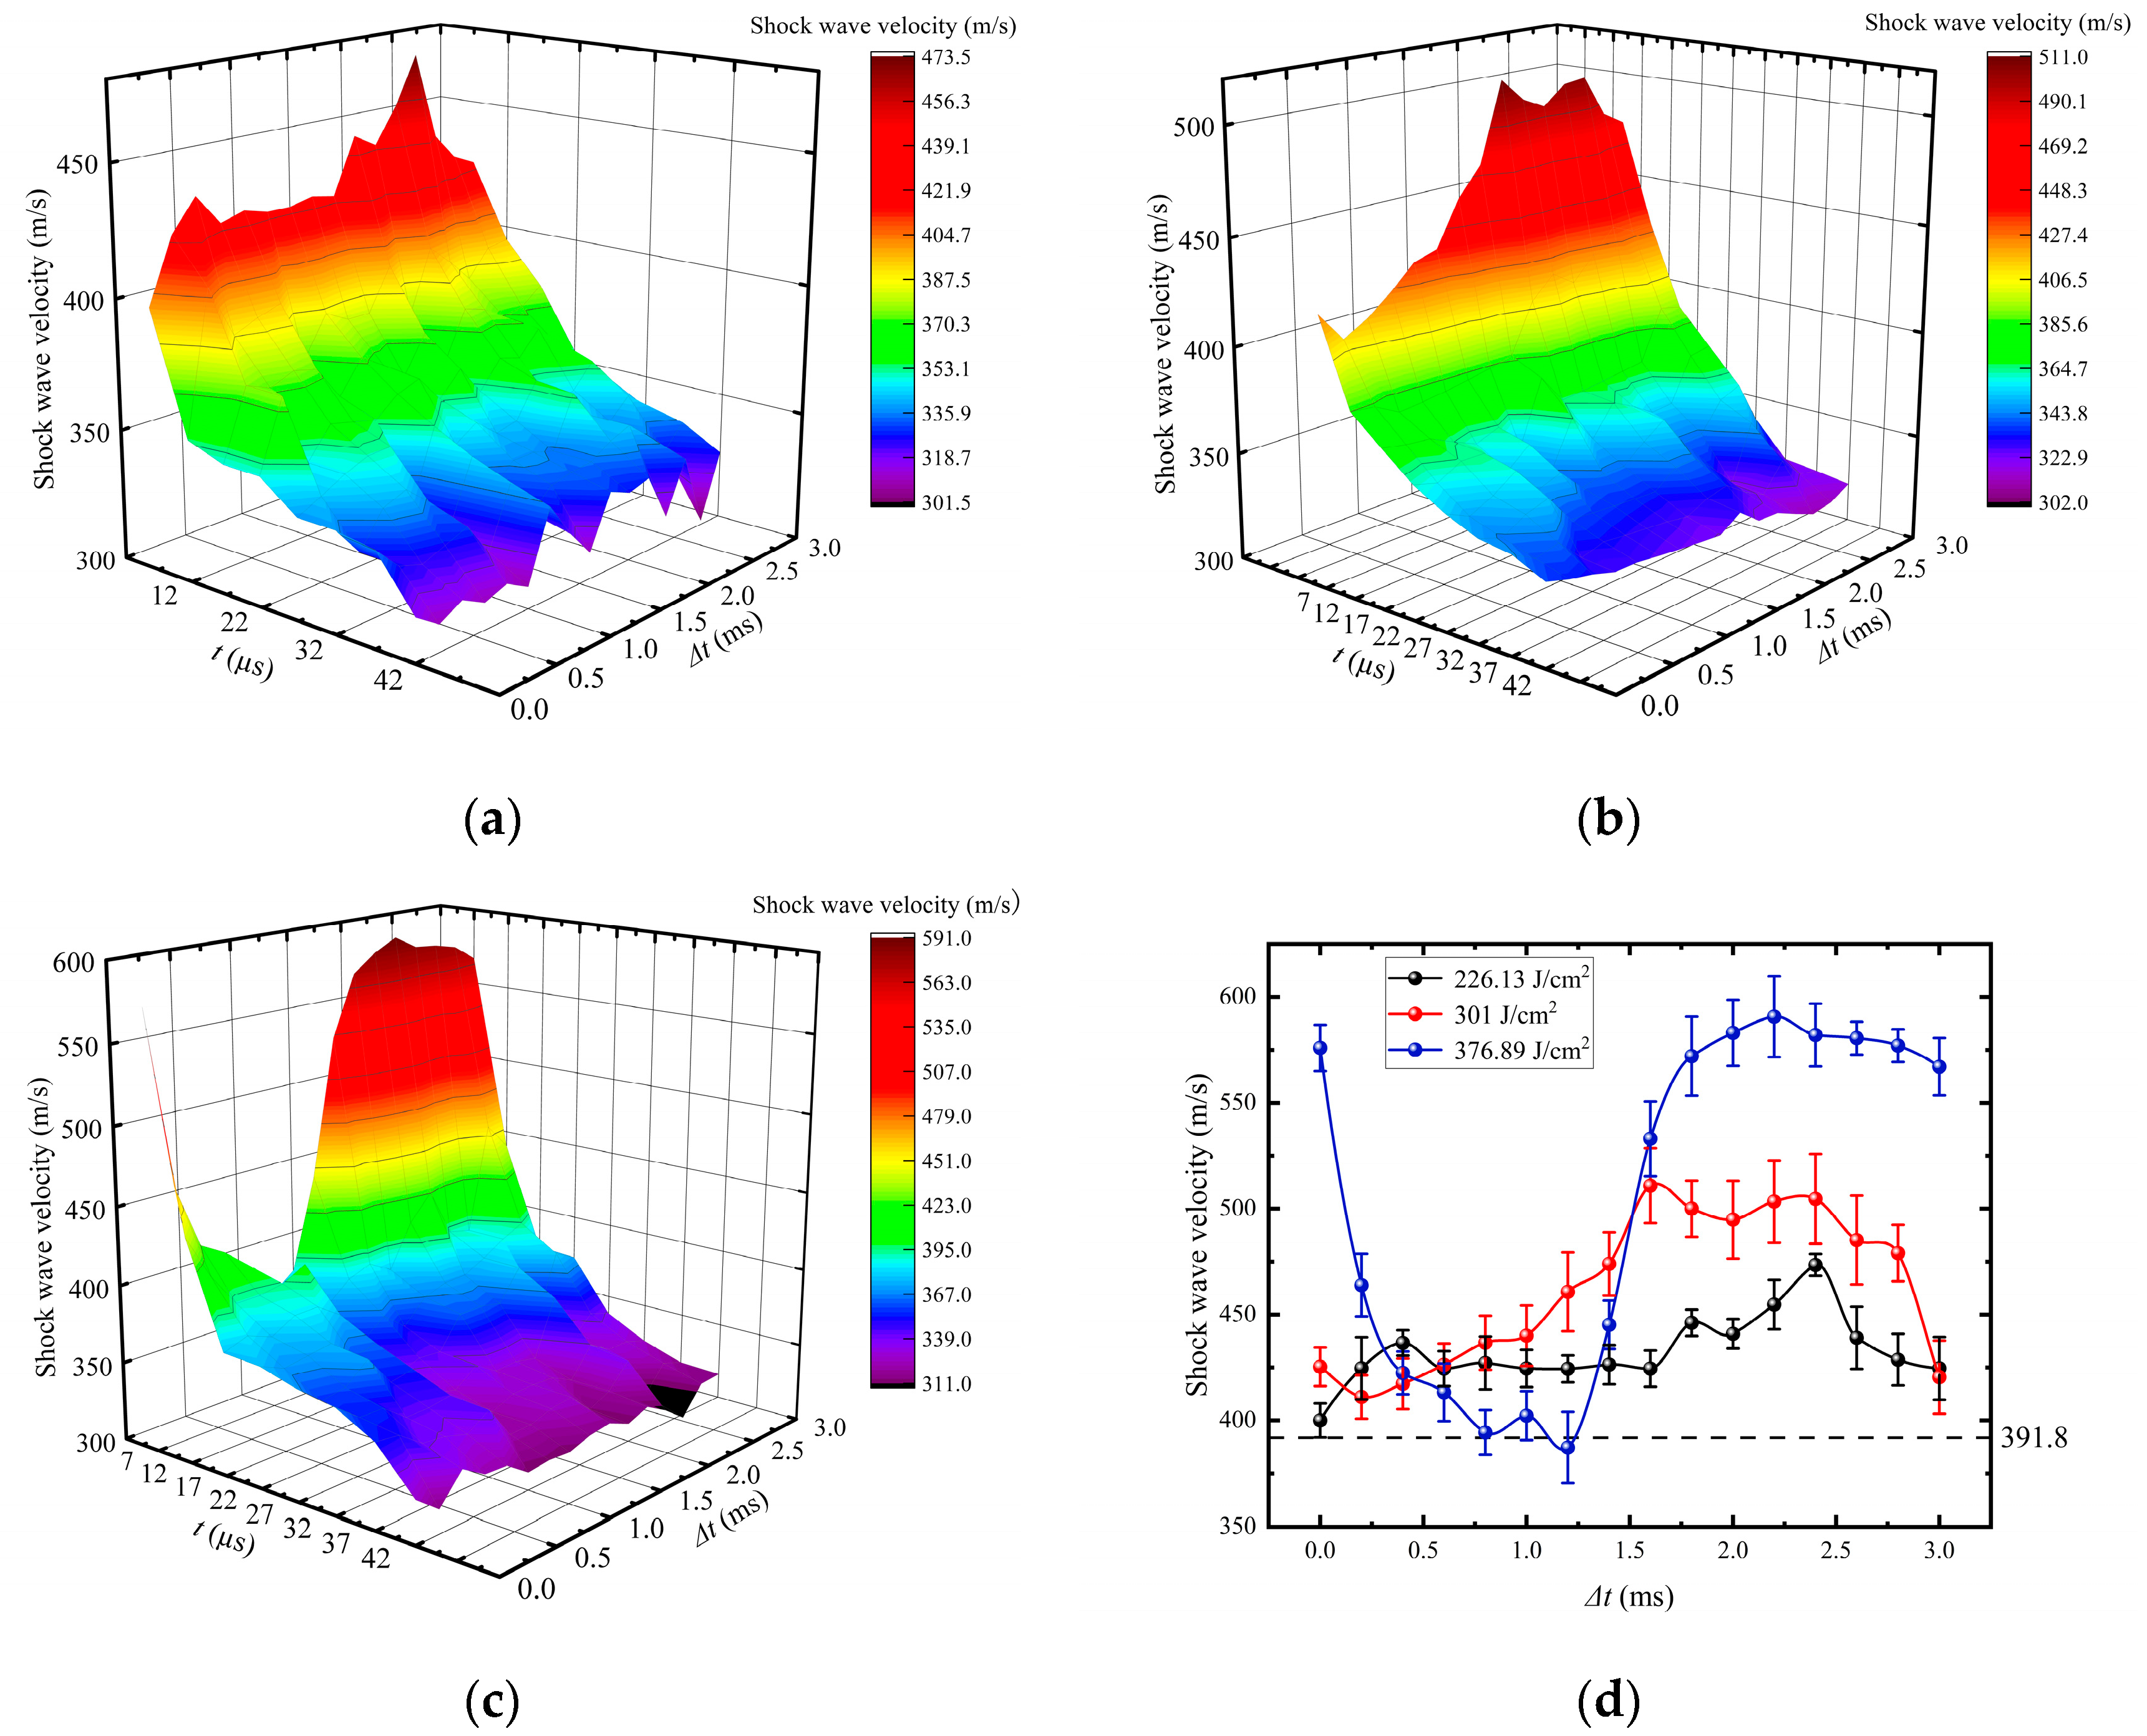
Figure 4a–c illustrate the variation trend of shock wave velocity induced by CPL at Ens = 6 J/cm2 for different Ems. The results indicate the shock wave velocity decreases exponentially with t. As shown in Figure 4d, the shock wave velocity induced by ns laser with Ems = 6 J/cm2 is 391.8 m/s at 7 µs. When Ems = 226.13 J/cm2 and Δt = 2.4 ms, the shock wave velocity reaches a maximum of 473.4 m/s at 7 µs, which is 20.83% higher than that induced by the ns laser. When Ems = 301 J/cm2 and 1.6 ms ≤ Δt ≤ 2.4 ms, the shock wave velocity increases by approximately 26.29–30.39% relative to that induced by the ns laser. The shock wave velocity increases by 46.98% while Ems = 376.89 J/cm2 and Δt = 0 ms. Furthermore, the shock wave velocity increases by 44.72% to 50.77% with 1.8 ms ≤ Δt ≤ 3.0 ms. It indicates a notable enhancement in the shock wave acceleration phenomenon at 7 μs. However, the influence of the shock wave acceleration phenomenon diminishes over time and becomes negligible at 42 µs, which is illustrated in Figure 4a–c. The peak velocity of shock wave acceleration and incremental percentage with Ems and Δt is shown in Table 2.
Figure 5 illustrates the shock wave propagation morphology induced by CPL with different Ems and Δt. As indicated in Figure 5a in case 1, after the ms laser stops irradiating for 1.4 ms, the plasma begins to dissipate gradually and can no longer absorb the ns laser energy through the reverse bremsstrahlung absorption mechanism. In addition, the plasma induced by ms laser provides a higher concentration of initial electrons, which enhances the expansion velocity of the plasma induced by ns laser and consequently increases the shock wave velocity. Figure 5b shows that in Case 2, after the ms laser irradiation is stopped for 0.6 ms, the plasma induced by ms laser cannot absorb energy from the ns laser through the reverse bremsstrahlung absorption mechanism as time increases, which is similar to case 1. However, the higher ms laser energy produces a larger plasma expansion distance (Dms) than that induced by the ns laser (Dns). During this process, the propagation medium of the shock wave changes from air to plasma induced by ms laser. The shock wave propagation fundamentally originates from the wavefront pressure, and the plasma induced by ms laser is essentially a high-temperature region formed by the thermal ionization mechanism. Therefore, the wavefront pressure in this high-temperature region increases, which is macroscopically manifested as an increase in shock wave velocity. It can be seen from Figure 5c that in Case 3, when the ms laser and ns laser irradiate the target simultaneously, the number of free electrons in the plasma increases, and the probability of collision ionization increases. Thus, this promotes faster plasma expansion and the shock wave velocity increases. Figure 5d indicates that in Case 4, the weakening of the inverse bremsstrahlung absorption mechanism and the enhancement of the thermal ionization mechanism lead to an increase in the shock wave velocity, which is similar to Case 2. However, the incremental percentage of shock wave velocity increases by 30.39% to 50.77%, which is attributed to the higher Ems to increase the free-electron density and the plasma temperature, which leads to the increase in the incremental percentage of case 4.

3.2. LSTM Prediction for Shock Wave Velocity

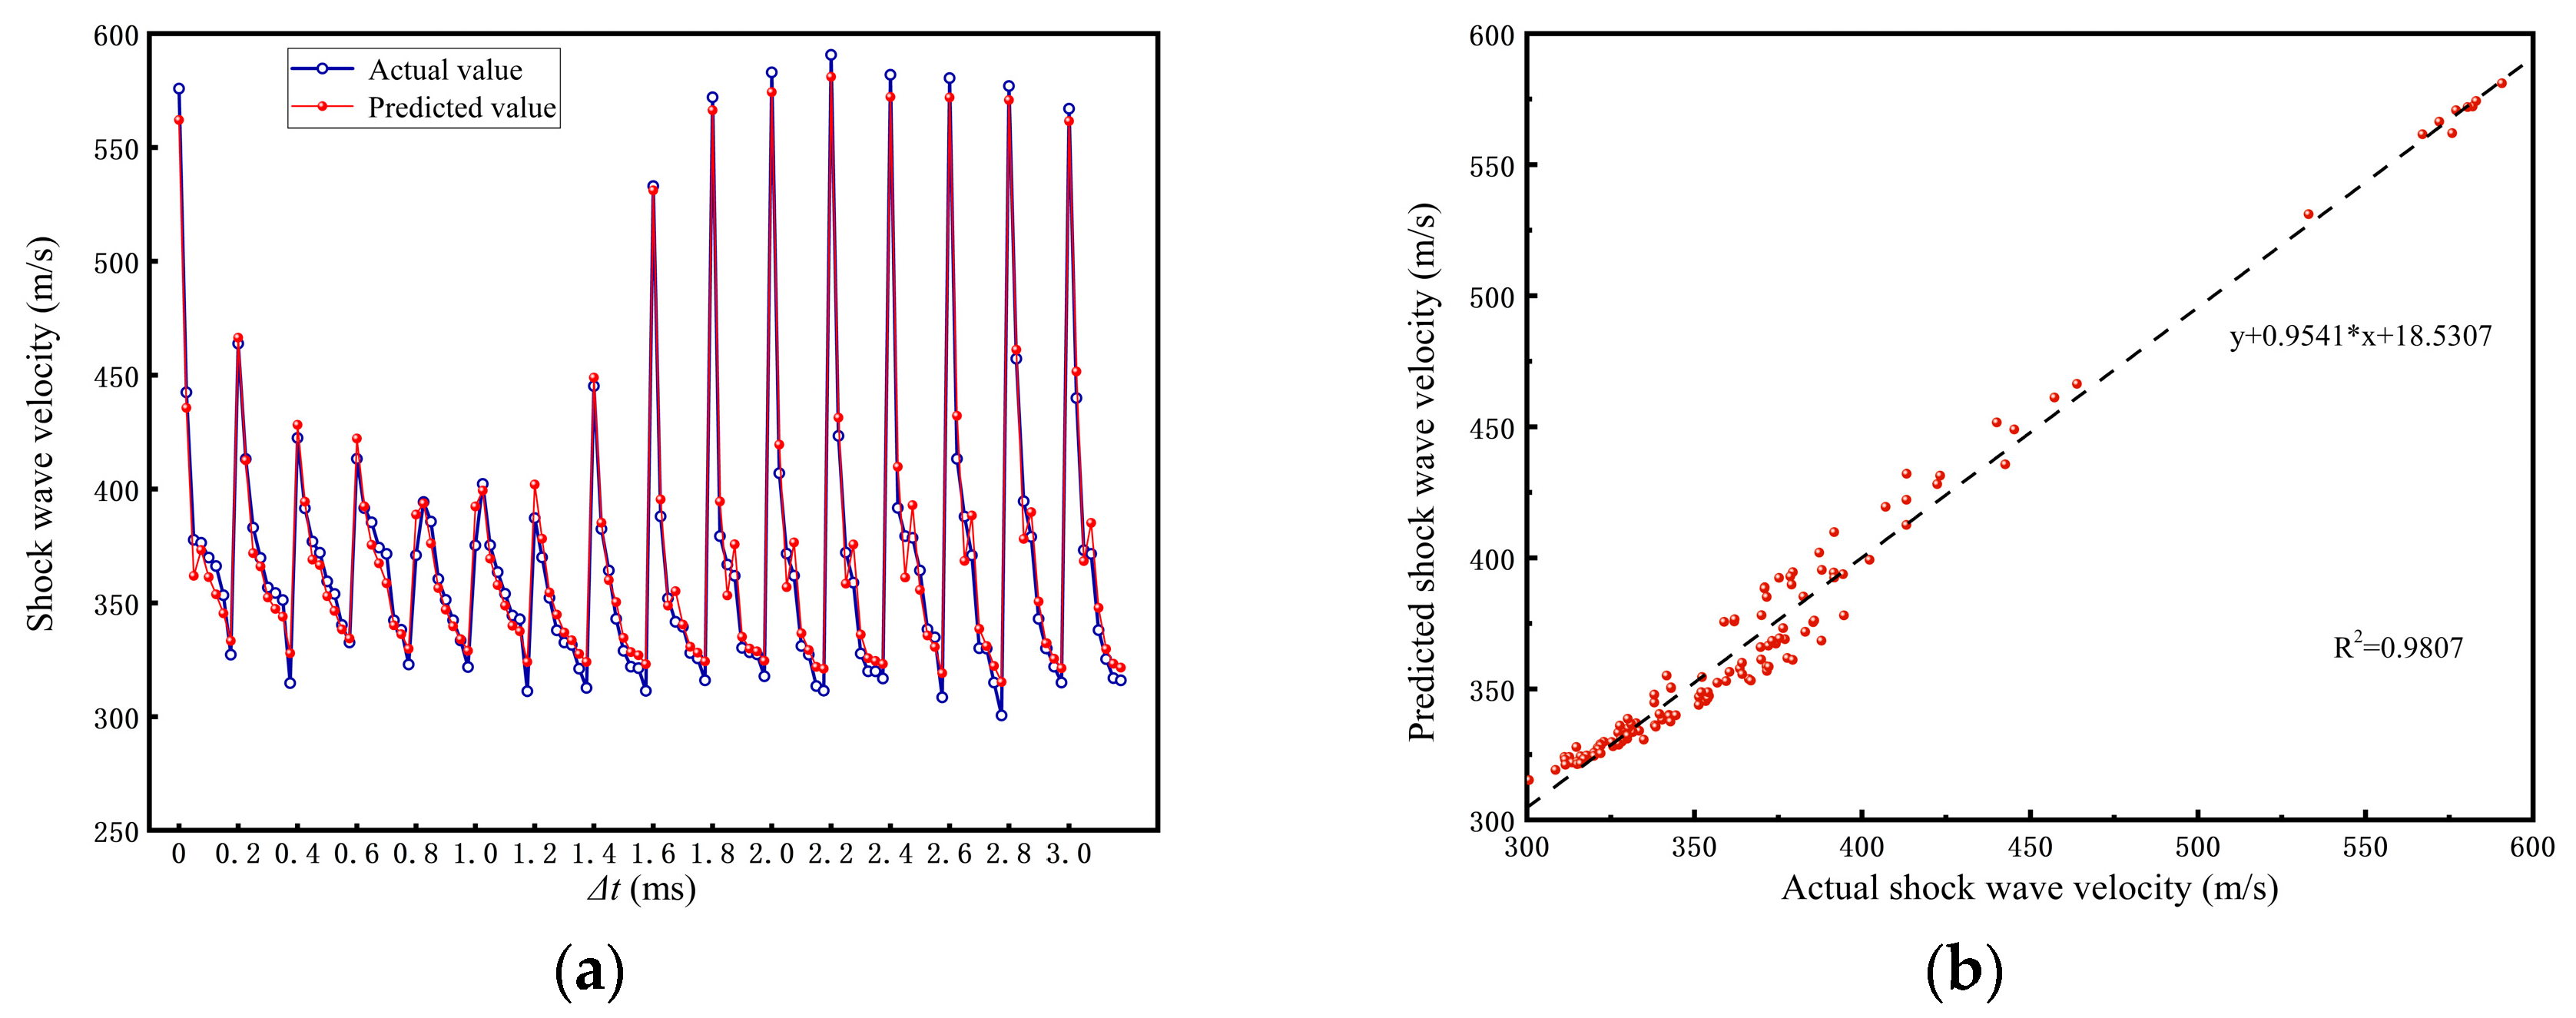
In this model, the shock wave velocity with Ems = 226.13 J/cm2 and Ems = 301 J/cm2 is chosen as the training set, and the shock wave velocity with Ems = 376.89 J/cm2 is chosen as the test set. The shock wave velocity prediction model results based on Attention-LSTM are shown in Figure 6. Figure 6a illustrates the comparison of actual value and predicted value, the predicted shock wave velocity trends for Δt < 1.6 ms are consistent with the experimental values. When Δt ≥ 1.6 ms, only the predicted trend of the shock wave velocity in the time series of 17 µs and 22 µs has a certain deviation from the actual value. Overall, the shock wave velocity predicted by the Attention-LSTM model is relatively consistent with the actual value. Therefore, the Attention-LSTM model has epitaxial capabilities at unknown ms energy densities. The correlation of the test set is shown in Figure 6b. The scattered points are all distributed near the linear regression line. The predicted and actual values exhibit excellent agreement. It indicates that Attention-LSTM has high fitting accuracy to predict the shock wave velocity induced by CPL.
The error of predictions is shown in Figure 7. It was found that the percentage error of the prediction at 7 µs is about 1% for Δt = 2.4 ms and 2.6 ms. However, at the time sequences of 12 µs, 17 µs and 22 µs, the percentage error of the prediction increases to about 5%. This is because the plasma expansion distance induced by the ms laser increases. As shown in Figure 5d, during ns laser irradiation, the shock wave is induced by the thermal ionization mechanism and propagates in the plasma induced by the ms laser. When 1.4 ms ≤ Δt ≤ 3.0 ms, although the shock wave generation mechanism remains unchanged, its attenuation behavior is affected by the plasma induced by ms laser. In addition, under the condition of 0.8 ms ≤ Δt ≤ 1.2 ms, the percentage error of the shock wave velocity is greater than 4% only at 7 µs and decreases to about 1% at time sequences of 12 to 37 µs. As shown in Figure 4d, the shock wave is at the transition between the acceleration and non-acceleration phenomenon. At this stage, the shock wave is induced by the combined effects of inverse bremsstrahlung absorption and thermal ionization. The interaction of complex physical mechanisms causes fluctuation of the shock wave velocity, leading to increased prediction errors at 7 μs. As time increases, its impact on the attenuation behavior of the shock wave gradually decreases, which leads to a reduction in absolute error of predictions. Although a few predicted values exhibit abnormal deviations, resulting in relatively large local errors between the predicted and actual values, the overall percentage error is small. The abnormal predicted values are mainly due to the complex propagation mechanism of the shock wave induced by CPL. This further illustrates that the Attention-LSTM model can be used to explain the dynamic behavior of shock wave induced by CPL.
The comparison of evaluation indices between plain LSTM and Attention-LSTM on the training set and test set are listed in Table 3. For the test set, MAE and RMSE of Attention-LSTM are 7.65 and 9.01, respectively. The values of MAE and RMSE are acceptable for the prediction of shock wave velocity in the range of 400–500 m/s. And MAE and RMSE of plain LSTM are 23.29 and 32.23. Compared with plain LSTM, the values of Attention-LSTM are increased by 67.15% and 72.04%, respectively. It demonstrates that the Attention-LSTM has high predictive performance. For the Attention-LSTM, the MBE value of 1.47 indicates that the overall predictions are slightly higher than the actual values, but the bias is minimal. The R2 of the test set is 0.98, which indicates that Attention-LSTM exhibits a high degree of fitness. The MBE and R2 of plain LSTM are 17.42 and 0.82, respectively. It shows that the overall prediction effect and fitting degree of Attention-LSTM are better than plain LSTM. Therefore, the model provides accurate and reliable predictions of shock wave velocity induced by CPL of the epitaxial ms laser energy.

4. Conclusions

In this paper, we studied the temporal variation of shock wave velocity induced by ms-ns CPL with different energy ratios experimentally. Moreover, a novel Attention-LSTM neural network architecture was developed to predict the shock wave velocity. The intrinsic relationship between laser parameters and the timing sequences of the velocity of shock wave is extracted through the attention mechanism and the LSTM neural network. The results reveal the shock wave acceleration induced by the CPL under different ms laser energy conditions. Among them, the maximum velocity increment is under the condition of ms laser energy density of 376.8 J/cm2. When the pulse delay is 2.2 ms, the shock wave velocity exhibits an increase rate of 50.77%. This phenomenon is primarily attributed to the weakening of the inverse bremsstrahlung absorption mechanism and the enhancement of the thermal ionization mechanism. The shock wave velocity predicted by the Attention-LSTM model shows excellent agreement with the experimental results. The MAE, RMSE, MBE and R2 of the model are 7.65, 9.01, 1.47 and 0.98, respectively. It is indicated that the model can predict shock wave velocity induced by CPL accurately with different ms laser energies. Previous studies have primarily focused on the mechanism of shock wave acceleration and prediction of shock wave velocity under known ns laser energy. In contrast, this study applies a deep learning approach to predict shock wave velocity under unknown ms laser energy, which effectively reduces experimental cost and improves prediction efficiency. It can also provide theoretical support for parameter optimization in the field of laser shock technology.

Author Contributions

Conceptualization, J.L. (Jingyi Li); methodology, J.L. (Jingyi Li) and R.L.; software, R.L.; validation, J.L. (Junjie Liu); formal analysis, R.L.; investigation, J.L. (Junjie Liu); resources, J.L. (Jingyi Li); data curation, J.L. (Junjie Liu); writing—original draft preparation, J.L. (Jingyi Li) and R.L.; writing—review and editing, J.L. (Jingyi Li) and J.S.; visualization, J.S.; supervision, J.L. (Jingyi Li); project administration and funding acquisition, J.L. (Jingyi Li). All authors have read and agreed to the published version of the manuscript.

Funding

This research was funded by the Jilin Province Science and Technology Development Plan Project, grant number YDZJ202401619ZYTS.

Institutional Review Board Statement

Not applicable.

Informed Consent Statement

Not applicable.

Data Availability Statement

The data presented in this study are available on request from the corresponding author.

Acknowledgments

Thanks to Yu Jun for the equipment support provided.

Conflicts of Interest

The authors declare no conflicts of interest.

References

  1. Eliezer, S.; Martinez-Val, J.M.; Henis, Z.; Nissim, N.; Pinhasi, S.V.; Ravid, A.; Werdiger, M.; Raicher, E. Physics and applications with laser-induced relativistic shock waves. High Power Laser Sci. 2016, 4, 46–59. [Google Scholar] [CrossRef]
  2. Su, B.; Xu, S.; Wang, H.; Wang, J.; Cao, Y.; Hua, G. Influence of high strain rate on the transient transmission of laser shock waves. Shock Waves 2022, 32, 451–460. [Google Scholar] [CrossRef]
  3. Nie, X.; Tang, Y.; Zhao, F.; Li, Y.; He, W.; Wei, C.; Wang, X.; Wu, H.; Yan, L. Experimental study on the pressure characteristics of laser-induced shock waves under different energy distribution. Phys. Scr. 2023, 98, 075602. [Google Scholar] [CrossRef]
  4. Garbaruk, A.V.; Gritskevich, M.S.; Kalmykov, S.G.; Sasin, M.E. Computational simulation of laser plasma emission with shockwave-affected density distribution in the gas-jet target. Technol. Phys. Lett. 2016, 42, 993–996. [Google Scholar] [CrossRef]
  5. Ukai, T.; Kontis, K.; Yang, L. Flow structure generated by laser-induced blast wave propagation through the boundary layer of a flat plate. Aerosp. Sci. Technol. 2018, 78, 569–573. [Google Scholar] [CrossRef]
  6. Sakhvadze, G.Z.; Sakhvadze, G.G. Strengthening Mechanisms upon Implantation of Nanoparticles in Materials Using Laser Shock Waves. J. Mach. Manuf. Reliab. 2024, 8, 53. [Google Scholar] [CrossRef]
  7. Wu, L.; Dai, F.; Chen, X. Effect of Surface Roughness and Compressive Residual Stress on the Fatigue Performance of TC4 Titanium Alloy Subjected to Laser Shock Wave Planishing. Fatigue Fract. Eng. M. 2024, 48, 371–381. [Google Scholar] [CrossRef]
  8. Liu, H.; Yang, H.; Tong, Z.; Yang, D.; Ge, Y.; Ren, X. Effects of laser shock peening post-treatment on microstructure and corrosion resistance of phosphate conversion coatings. Opt. Laser Technol. 2023, 162, 109289. [Google Scholar] [CrossRef]
  9. Zhu, D.; He, X.; Zhong, L.; Wang, G.; Wei, G.; Pang, G.; Liao, W. Effect of laser shock peening on tribological properties of 55SiMoVA bearing steel. Opt. Laser Technol. 2025, 181 Pt A, 111704. [Google Scholar] [CrossRef]
  10. Sakhvadze, G.Z. Application of laser shock waves in additive technology. Russ. Eng. Res. 2023, 7, 43. [Google Scholar] [CrossRef]
  11. Ouyang, P.; Dong, Z.; Luo, X.; Zhang, S.; Liu, L.; Sun, B.; Zhou, L. Effect of combined treatment of laser shock peening and shot peening on fatigue performance of laser-powder-bed-fusioned GH4169 nickel-based alloy. Opt. Laser Technol. 2025, 182 Pt B, 112141. [Google Scholar] [CrossRef]
  12. Bae, J.; Byun, H.; Yoon, T.; Carter, C.D.; Do, H. Novel calibration-free seedless velocimetry using laser-induced shockwave. Exp. Therm. Fluid Sci. 2021, 126, 110384. [Google Scholar] [CrossRef]
  13. Li, Y.; Li, J.; Dong, H.; Zhang, W.; Jin, G. Simulation and experimental study of the evolution of shock waves during laser paint removal. Jpn. J. Appl. Phys. 2024, 63, 012002. [Google Scholar] [CrossRef]
  14. Lapostolle, L.; Morin, L.; Derrien, K.; Berthe, L.; Castelnau, O. Modeling and simulation of laser shock waves in elasto-plastic polycrystalline microstructures. J. Mech. Phys. Solids 2023, 176, 105310. [Google Scholar] [CrossRef]
  15. Li, J.; Zhang, W.; Zhou, Y.; Yuan, B.; Cai, J.; Jin, G. The acceleration mechanism of shock wave induced by millisecond-nanosecond combined-pulse laser on silicon. Plasma Sci. Technol. 2021, 23, 055507. [Google Scholar] [CrossRef]
  16. Wu, H.; Cao, M.; Liu, F.; Chong, Z.; Zhang, Y. Dynamic modeling of the interfacial bonding strength of cfrp composites detected by laser shockwave. Opt. Laser Technol. 2025, 182 Pt B, 112184. [Google Scholar] [CrossRef]
  17. Li, J.; Zhang, W.; Li, Y.; Jin, G. The Acceleration Phenomenon of Shock Wave Induced by Nanosecond Laser Irradiating Silicon Assisted by Millisecond Laser. Photonics 2023, 10, 260. [Google Scholar] [CrossRef]
  18. Radziejewska, J.; Strzelec, M.; Ostrowski, R.; Sarzyński, A. Experimental investigation of shock wave pressure induced by a ns laser pulse under varying confined regimes. Opt. Laser. Eng. 2020, 126, 105913. [Google Scholar] [CrossRef]
  19. Jiang, H.; Song, H.; Koh, H.; Yoon, T.; Kwon, Y. Shock wave generation in water by nanosecond pulse laser irradiation with 1064 and 2940nm wavelengths. Opt. Laser Technol. 2023, 167, 109670. [Google Scholar] [CrossRef]
  20. Rehman, Z.U.; Raza, A.; Qayyum, H.; Ullah, S.; Mahmood, S.; Qayyum, A. Characterization of laser-induced shock waves generated during infrared laser ablation of copper by the optical beam deflection method. Appl. Opt. 2022, 61, 29. [Google Scholar] [CrossRef]
  21. Jiang, H.; Cheng, H.; He, Y.; Liu, L.; Liu, S.; Li, H. Propagation characteristics of nanosecond pulse laser-induced shock wave and the non-contact removal of particle. Appl. Phys. A Mater. Sci. Process. 2021, 127, 241. [Google Scholar] [CrossRef]
  22. Wang, Y.; Liu, C.; Li, C. Evolution of ns pulsed laser induced shock wave on aluminum surface by numerical simulation. Results Phys. 2021, 22, 103920. [Google Scholar] [CrossRef]
  23. Jiang, X.; Yu, X.; Deng, X.; Shao, Y.; Peng, P. Investigation on laser-induced shock pressure with condensed matter model and experimental verification. Exp. Tech. 2019, 43, 161–167. [Google Scholar] [CrossRef]
  24. Pretorius, J.G.; Desai, D.A.; Snedden, G. Effect of Laser Shock Peening on Fatigue Life at Stress Raiser Regions of a High-Speed Micro Gas Turbine Shaft: A Simulation Based Study. Int. J. Eng. Res. Afr. 2019, 4747, 15–27. [Google Scholar] [CrossRef]
  25. Xiang, Y.F.; Mei, R.L.; Wang, S.P.; Azad, F.; Zhao, L.Z.; Su, S.C. Numerical investigation of the effect of laser shock peening parameters on the residual stress and deformation response of 7075 aluminum alloy. Optik 2021, 243, 167446. [Google Scholar] [CrossRef]
  26. Wu, J.; Li, Y.; Zhao, J.; Qiao, H.; Lu, Y.; Sun, B.; Hu, X.; Yang, Y. Prediction of residual stress induced by laser shock processing based on artificial neural networks for FGH4095 superalloy. Mater. Lett. 2021, 286, 129269. [Google Scholar] [CrossRef]
  27. Jose, S.S.S.; Mishra, S.K.; Upadhyay, R.K.; Muthukannan, D. Prediction of irregularities and study of mechanical properties in laser shock peened nickel alloy. Discov. Mater. 2025, 5, 31. [Google Scholar] [CrossRef]
  28. Wu, J.; Huang, Z.; Qiao, H.; Zhao, Y.; Li, J.; Zhao, J. Artificial neural network approach for mechanical properties prediction of TC4 titanium alloy treated by laser shock processing. Opt. Laser Technol. 2021, 143, 107385. [Google Scholar] [CrossRef]
  29. Li, J.; Zhang, W.; Li, Y.; Jin, G. Prediction of Shock Wave Velocity Induced by a Combined Millisecond and Nanosecond Laser Based on Convolution Neural Network. Photonics 2023, 10, 1034. [Google Scholar] [CrossRef]
Figure 1. The experimental setup for laser-induced shock wave on silicon: ms laser, millisecond laser; ns laser, nanosecond laser; DG645, digital pulse delay generator 645; PD1, photoelectric detector 1; PD2, photoelectric detector 2; S, spectroscope.
Photonics 12 01040 g001
Figure 2. Schematic diagram of LSTM cell structure.
Photonics 12 01040 g002
Figure 3. The structure of Attention-LSTM.
Photonics 12 01040 g003
Figure 4. The shock wave velocity variation trend and maximum velocity induced by CPL. (a) Ems = 226.13 J/cm2; (b) Ems = 301 J/cm2; (c) Ems = 376.89 J/cm2; (d) the shock wave maximum velocity.
Photonics 12 01040 g004
Figure 5. The shock wave propagation morphology induced by CPL with Ems and Δt. (a) Ems = 226.13 J/cm2 and Δt = 2.4 ms; (b) Ems = 301 J/cm2 and Δt = 1.6 ms; (c) Ems = 376.89 J/cm2 and Δt = 0 ms; (d) Ems = 376.89 J/cm2 and Δt = 2.2 ms.
Photonics 12 01040 g005
Figure 6. The Attention-LSTM model results. (a) Comparison between experimental value and predicted value of shock wave velocity on the test set; (b) the correlation of the test set.
Photonics 12 01040 g006
Figure 7. The error of predictions. (a) The percentage error; (b) the absolute error.
Photonics 12 01040 g007
Table 1. Sample set.
Sample NumberEms/J/cm2Δt/mst/µs
1–8007, 12, 17, 22, 27, 32, 37, 42
9–16226.1307, 12, 17, 22, 27, 32, 37, 42
17–24226.132007, 12, 17, 22, 27, 32, 37, 42
25–32226.134007, 12, 17, 22, 27, 32, 37, 42
33–40226.136007, 12, 17, 22, 27, 32, 37, 42
41–48226.138007, 12, 17, 22, 27, 32, 37, 42
49–56226.1310007, 12, 17, 22, 27, 32, 37, 42
57–64226.1312007, 12, 17, 22, 27, 32, 37, 42
65–72226.1314007, 12, 17, 22, 27, 32, 37, 42
73–80226.1316007, 12, 17, 22, 27, 32, 37, 42
81–88226.1318007, 12, 17, 22, 27, 32, 37, 42
89–96226.1320007, 12, 17, 22, 27, 32, 37, 42
97–104226.1322007, 12, 17, 22, 27, 32, 37, 42
105–112226.1324007, 12, 17, 22, 27, 32, 37, 42
113–120226.1326007, 12, 17, 22, 27, 32, 37, 42
121–128226.1328007, 12, 17, 22, 27, 32, 37, 42
129–136226.1330007, 12, 17, 22, 27, 32, 37, 42
137–14430107, 12, 17, 22, 27, 32, 37, 42
145–1523012007, 12, 17, 22, 27, 32, 37, 42
153–1603014007, 12, 17, 22, 27, 32, 37, 42
161–1683016007, 12, 17, 22, 27, 32, 37, 42
169–1763018007, 12, 17, 22, 27, 32, 37, 42
177–18430110007, 12, 17, 22, 27, 32, 37, 42
185–19230112007, 12, 17, 22, 27, 32, 37, 42
193–20030114007, 12, 17, 22, 27, 32, 37, 42
201–20830116007, 12, 17, 22, 27, 32, 37, 42
209–21630118007, 12, 17, 22, 27, 32, 37, 42
217–22430120007, 12, 17, 22, 27, 32, 37, 42
225–23230122007, 12, 17, 22, 27, 32, 37, 42
233–24030124007, 12, 17, 22, 27, 32, 37, 42
241–24830126007, 12, 17, 22, 27, 32, 37, 42
249–25630128007, 12, 17, 22, 27, 32, 37, 42
257–26430130007, 12, 17, 22, 27, 32, 37, 42
265–272376.8907, 12, 17, 22, 27, 32, 37, 42
273–280376.892007, 12, 17, 22, 27, 32, 37, 42
281–288376.894007, 12, 17, 22, 27, 32, 37, 42
289–296376.896007, 12, 17, 22, 27, 32, 37, 42
297–304376.898007, 12, 17, 22, 27, 32, 37, 42
305–312376.8910007, 12, 17, 22, 27, 32, 37, 42
313–320376.8912007, 12, 17, 22, 27, 32, 37, 42
321–328376.8914007, 12, 17, 22, 27, 32, 37, 42
329–336376.8916007, 12, 17, 22, 27, 32, 37, 42
337–344376.8918007, 12, 17, 22, 27, 32, 37, 42
345–352376.8920007, 12, 17, 22, 27, 32, 37, 42
353–360376.8922007, 12, 17, 22, 27, 32, 37, 42
361–368376.8924007, 12, 17, 22, 27, 32, 37, 42
369–376376.8926007, 12, 17, 22, 27, 32, 37, 42
377–384376.8928007, 12, 17, 22, 27, 32, 37, 42
385–392376.8930007, 12, 17, 22, 27, 32, 37, 42
Table 2. Peak velocity of shock wave acceleration and incremental percentage with Ems and Δt.
Ems/J/cm2Δt/msShock Wave Velocity/m/sIncremental Percentage/%
case 1226.132.4473.420.83
case 23011.6510.8630.39
case 3376.890575.8746.98
case 4376.892.2590.750.77
Table 3. Comparison of evaluation indices between plain LSTM and Attention-LSTM.
ModelTraining SetTest Set
MAERMSEMBER2MAERMSEMBER2
Plain LSTM 9.95 14.13 0.55 0.87 23.29 32.23 17.42 0.82
Attention-LSTM4.485.830.170.987.659.011.470.98
Disclaimer/Publisher’s Note: The statements, opinions and data contained in all publications are solely those of the individual author(s) and contributor(s) and not of MDPI and/or the editor(s). MDPI and/or the editor(s) disclaim responsibility for any injury to people or property resulting from any ideas, methods, instructions or products referred to in the content.