Article

The Dependence of Spatial Aliasing on the Amount of Defocus and Spherical Aberration in a Model Eye

1
Institute of Solid State Physics, University of Latvia, LV-1063 Riga, Latvia
2
Department of Optometry and Vision Science, Faculty of Science and Technology, University of Latvia, LV-1586 Riga, Latvia
*
Author to whom correspondence should be addressed.
Photonics 2025, 12(10), 1003; https://doi.org/10.3390/photonics12101003 (registering DOI)
Submission received: 19 August 2025 / Revised: 20 September 2025 / Accepted: 8 October 2025 / Published: 12 October 2025
(This article belongs to the Special Issue Adaptive Optics Imaging: Science and Applications)

Abstract

The performance of the human eye is limited not only by optical factors but also capabilities of signal processing. The maximum spatial frequency that can be reliably processed depends on the sampling rate. If this frequency is exceeded, spatial aliasing occurs. In this study, we investigate the optimum amount of defocus and spherical aberration needed to avoid spatial aliasing. Measurements are carried out using a simple model eye with the optical and geometrical parameters close to those of a living human eye. A checkerboard pattern with the spatial frequency of 60 cycles/degree is used as a stimulus. A deformable mirror was used to control the amount of defocus and spherical aberration from 0 µm to 0.50 µm in steps of 0.05 µm. If the amount of aberrations is low, fringes of aliased signals are visible along the direction 35.5 degrees relative to the vertical edge of the image. This direction is close to the diagonal direction along which the sampling rate is the lowest. When the amount of aberrations reaches 0.45 µm, spatial aliasing is not observed. The results suggest that low amount of ocular aberrations is desired.

1. Introduction

The performance of any optical system including a human eye is limited by three main factors—diffraction, aberrations, and light scattering [1]. Diffraction sets the ultimate limit on the resolution of a human eye that can be achieved in the absence of aberration and light scattering. In a living human eye, a certain amount of aberration and scattering is always present, thereby complicating the point spread function (PSF) formed on the retina. In fact, aberration and scattering must be viewed together with diffraction as the PSF; the diffraction pattern formed on the retina is the squared modulus of the Fourier transform of the aperture function that can be either real or complex. The optical quality of an eye can be controlled by means of adaptive optics which use an adaptive optical element, i.e., either a deformable mirror or a spatial light modulator to control the phase of the ocular wavefront [2].
While the optical quality of an eye is crucial for its visual performance, attention is less often paid to the limits set by the capabilities of signal processing at various levels of the visual system, starting at the retinal level [3,4,5,6,7,8]. In signal processing, the Shannon–Nyquist theorem dictates that the maximum frequency that can be reliably detected is equal to half of the sampling rate. This frequency is known as the Nyquist frequency. If the requirements of the Shannon–Nyquist theorem are not met, aliasing occurs. Aliasing manifests itself as non-existing low frequencies arising from high spatial frequencies which lie above the Nyquist frequency and are not sampled at a sufficiently high rate. Among all fields involving signal processing, the Shannon–Nyquist theorem also applies to optical imaging. Many optical detectors are composed of discrete elements called pixels, and the pitch of a pixel array determines the sampling rate. In a human eye, these pixels are called photoreceptors or cones and rods. The sampling rate in a fovea is about 120 samples (cones)/degree, and the Nyquist frequency is therefore about 60 cycles/degree, corresponding to the decimal visual acuity visus = 2. The spatial frequencies reaching the retina depend on the modulation transfer function (MTF), while the MTF itself depends on the optical quality of an eye and falls to zero at the cut-off frequency. If the cut-off frequency does not exceed the Nyquist frequency, there is no spatial aliasing; however, if the size of a pupil of a diffraction-limited eye exceeds 4 mm, the Nyquist frequency is exceeded, and the spatial aliasing occurs [9]. If the size of a pupil in a diffraction-limited eye were 8 mm, the cut-off frequency would be about 210 cycles/degree, corresponding to the decimal visual acuity visus = 7, well beyond the limits imposed by the Shannon-Nyquist theorem [10]. Most often, the cut-off frequency in a living human eye is approximately equal to the Nyquist frequency, i.e., about 60 cycles/degree [6] because of the combined effects of diffraction and ocular aberrations. If the size of a pupil is small, diffraction smears out the PSF, while in the case of a large pupil the PSF is smeared due to the ocular aberrations. Nevertheless, a cut-off frequency significantly above the Nyquist frequency has been reported in certain population groups. A cut-off frequency as high as 120 cycles/degree has been reported among children [11], with values of about 80 cycles/degree in LASEK and LASIK patients [12]. A cut-off frequency exceeding 200 cycles/degree can be achieved only by means of adaptive optics in the case of a very large pupil.
In order to prevent spatial aliasing, small amounts of ocular aberrations may be desirable instead of a diffraction-limited eye, so that the cut-off frequency does not exceed the Nyquist frequency. The issue of the influence of optical and neural factors on the visual acuity in the peripheral field of view has been addressed by Lundstrom et al., who investigated the effect of remaining aberrations on the peripheral visual acuity [4]. A small but still insignificant improvement in peripheral visual acuity was found when the peripheral aberrations were corrected. These observations were attributed to the neural limits due to sparse sampling in the retinal periphery. Yang et al. studied the effects of diffraction caused by a transparent screen on the perception of objects behind the screen [13]. They investigated the effects of diffraction by studying the PSF, i.e., the squared modulus of the Fourier transform of the input object formed on the retina. Unlike in this study, we investigated the effects of ocular aberrations on the inverse Fourier transform of the diffraction pattern forming the image of a grating on the retina. We were interested in determining the amount of defocus and spherical aberration needed to prevent spatial aliasing in a model eye mimicking viewing conditions in a fovea. These two aberrations were selected because they are very frequently encountered in visual optics, especially in the case of wide pupils [14]. While any type of ocular aberrations, e.g., astigmatism, coma, trefoil, and others may be investigated, the selected aberrations also have radially symmetric PSFs and MTFs, cancelling out the influence of the radial direction on the cut-off frequency.

2. Materials and Methods

Measurements were taken with a simple model eye consisting of a thin converging lens with an optical power of +40 diopters and a CMOS sensor of a MD-UB130RC-T camera (MindVision, Adelaide, Australia) with a square pixel of size 3.45 µm. The focal length (25 mm) of the lens was chosen so that it approximately matched the axial length of a human eye [15], while the size of the pixel was chosen based on the size of cone photoreceptors in the fovea. The space between the lens and the sensor was filled by air. A checkerboard pattern projected on the retina was used as a stimulus. The stimulus was fabricated by thermally depositing a thin film of chromium (40 nm) on a glass substrate and structuring it with the techniques of direct-write lithography (µPG 101 (Heidelberg Instruments, Heidelberg, Germany)). The regions of the film exposed to UV radiation (λ = 375 nm) were oxidized to form chromium oxide Cr2O3 with high transmittance in the visible spectrum [16]. The dose of exposure was about 2 J/cm2.
The schematic diagram of the optical system used in the study is shown in Figure 1. The stimulus was placed at the primary focal plane of the lens L1 with the focal length fL1 = 60 mm. In order to avoid interference fringes, the stimulus was illuminated by red low-coherence light obtained by passing polychromatic light through a bandpass interference filter with the central wavelength λ = 650 nm and the full width at half maximum (FWHM) equal to 10 nm. The coherence length of the red light was approximately 20 µm. The far-field diffraction pattern of the checkerboard pattern was formed at the secondary focal plane of the lens L1, and it was optically conjugated with the primary focal plane of the model eye by the lenses L2 and L3. The focal lengths of the lenses L2 and L3 were fL2 = 150 mm and fL3 = 60 mm. The checkerboard pattern was optically conjugated to the retina as the lens of the model eye performed the inverse Fourier transform of the relayed far-field diffraction pattern. Between the lenses L1 and L2, a beam-splitter and a deformable mirror (Alpao Inc., Montbonnot-Saint-Martin, France) with 97 segments were placed. A deformable mirror was chosen because of its smooth surface, with a fill factor of 100%. The deformable mirror was optically conjugated with the corneal plane of the model eye and was used to introduce a controlled amount of defocus and spherical aberration in the optical system. The Zernike coefficients of both types of aberrations were changed in increments of 0.05 μm in a range spanning from 0 μm to 0.50 μm. Software supplied with a deformable mirror allowed us to select individual aberrations and move the actuators to generate these aberrations. The shape of the generated aberrations was estimated based on the PSFs captured by the camera. While a wavefront sensor is commonly used to measure the actual wavefront coming out of the eye, in the current optical system this was not possible because the retina (the sensor of the camera) was a specular reflector, while wavefront sensors typically require diffuse reflectors to measure a wavefront accurately [17,18].
The amount of aberrations generated in the optical system was converted to the equivalent defocus (in diopters) according to an equation [19]:
P d e f = c 2 0 4 3 r 2
where c 2 0 is the Zernike coefficient of defocus while r is the radius of pupil.
The checkerboard pattern used in this study had the fundamental vertical and horizontal spatial frequency of 60 cycles/degree; however, higher-order odd harmonics were also present. The amount of defocus and spherical aberration was varied by changing the value of the corresponding Zernike coefficients from 0 µm to 0.50 µm in increments of 0.05 µm. The images of the checkerboard pattern were captured using the software MindVision Platform (v2.1.5.10). The presence of spatial aliasing was assessed by performing Fourier analysis on the captured images. Fourier analysis and the calculation of the MTF were carried out using custom-built MATLAB (vR2020a) scripts.

3. Results

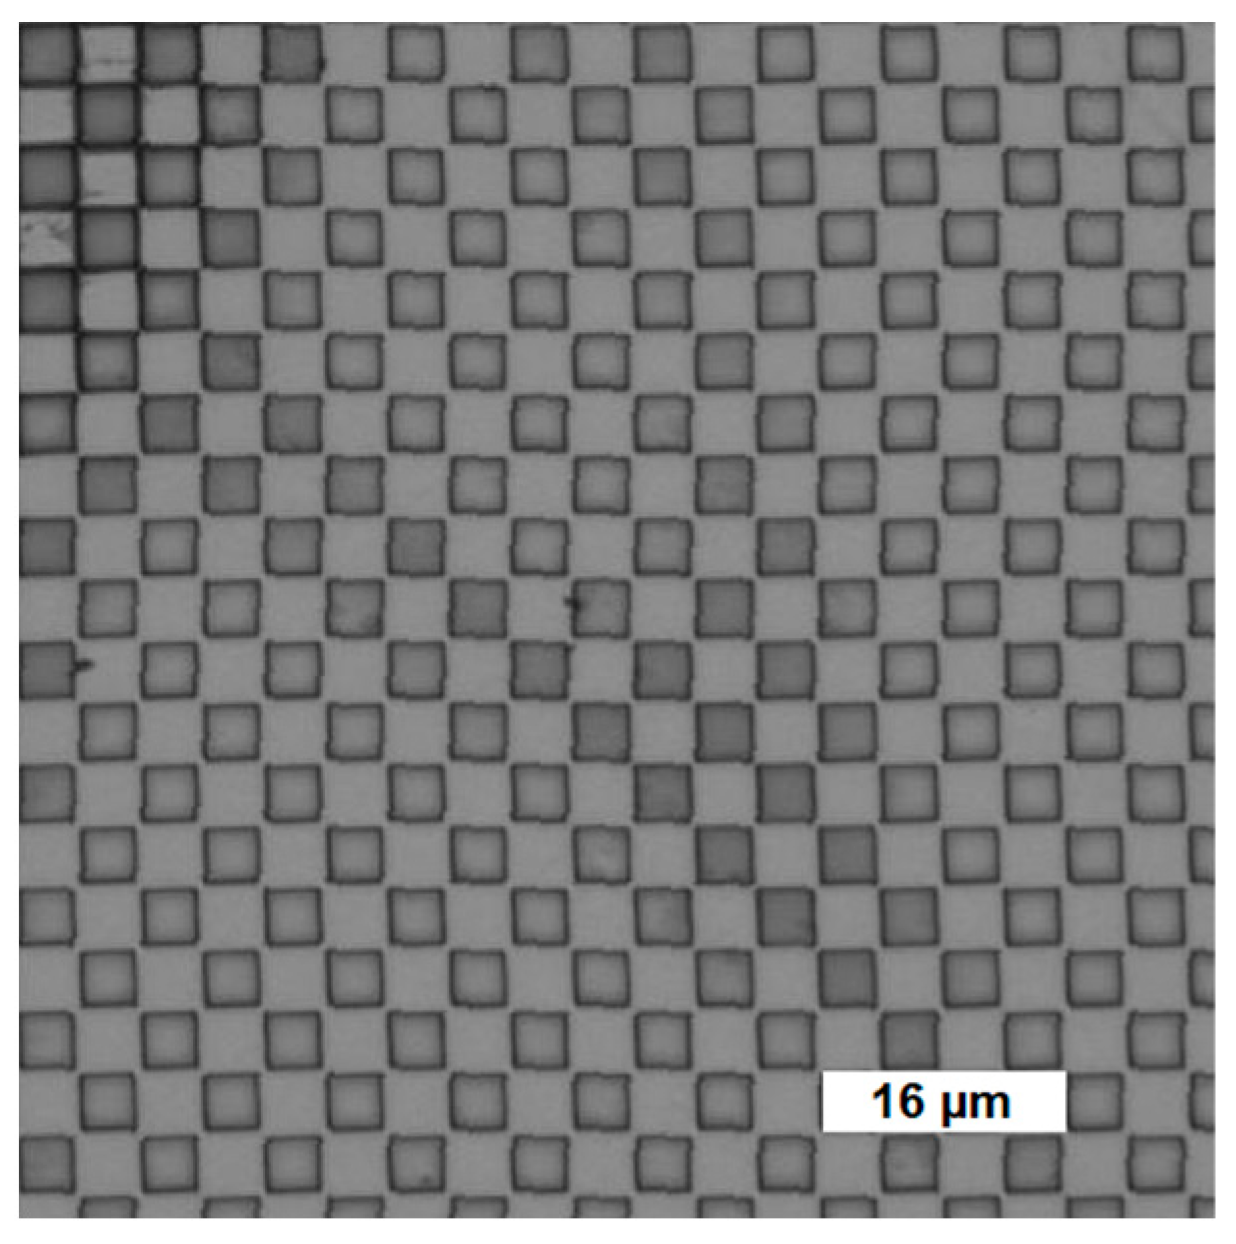
Figure 2 shows an image of the checkerboard pattern acquired with the optical microscope Nikon 150 (Nikon, Tokyo, Japan). A single square is 4 by 4 microns in size, corresponding to the fundamental vertical and horizontal spatial frequency of 60 cycles/degree as viewed from the nodal point of the model eye. The uneven edges of the squares are a consequence of rotating the image in MATLAB, which was necessary to remove the small amount of tilt in the image.
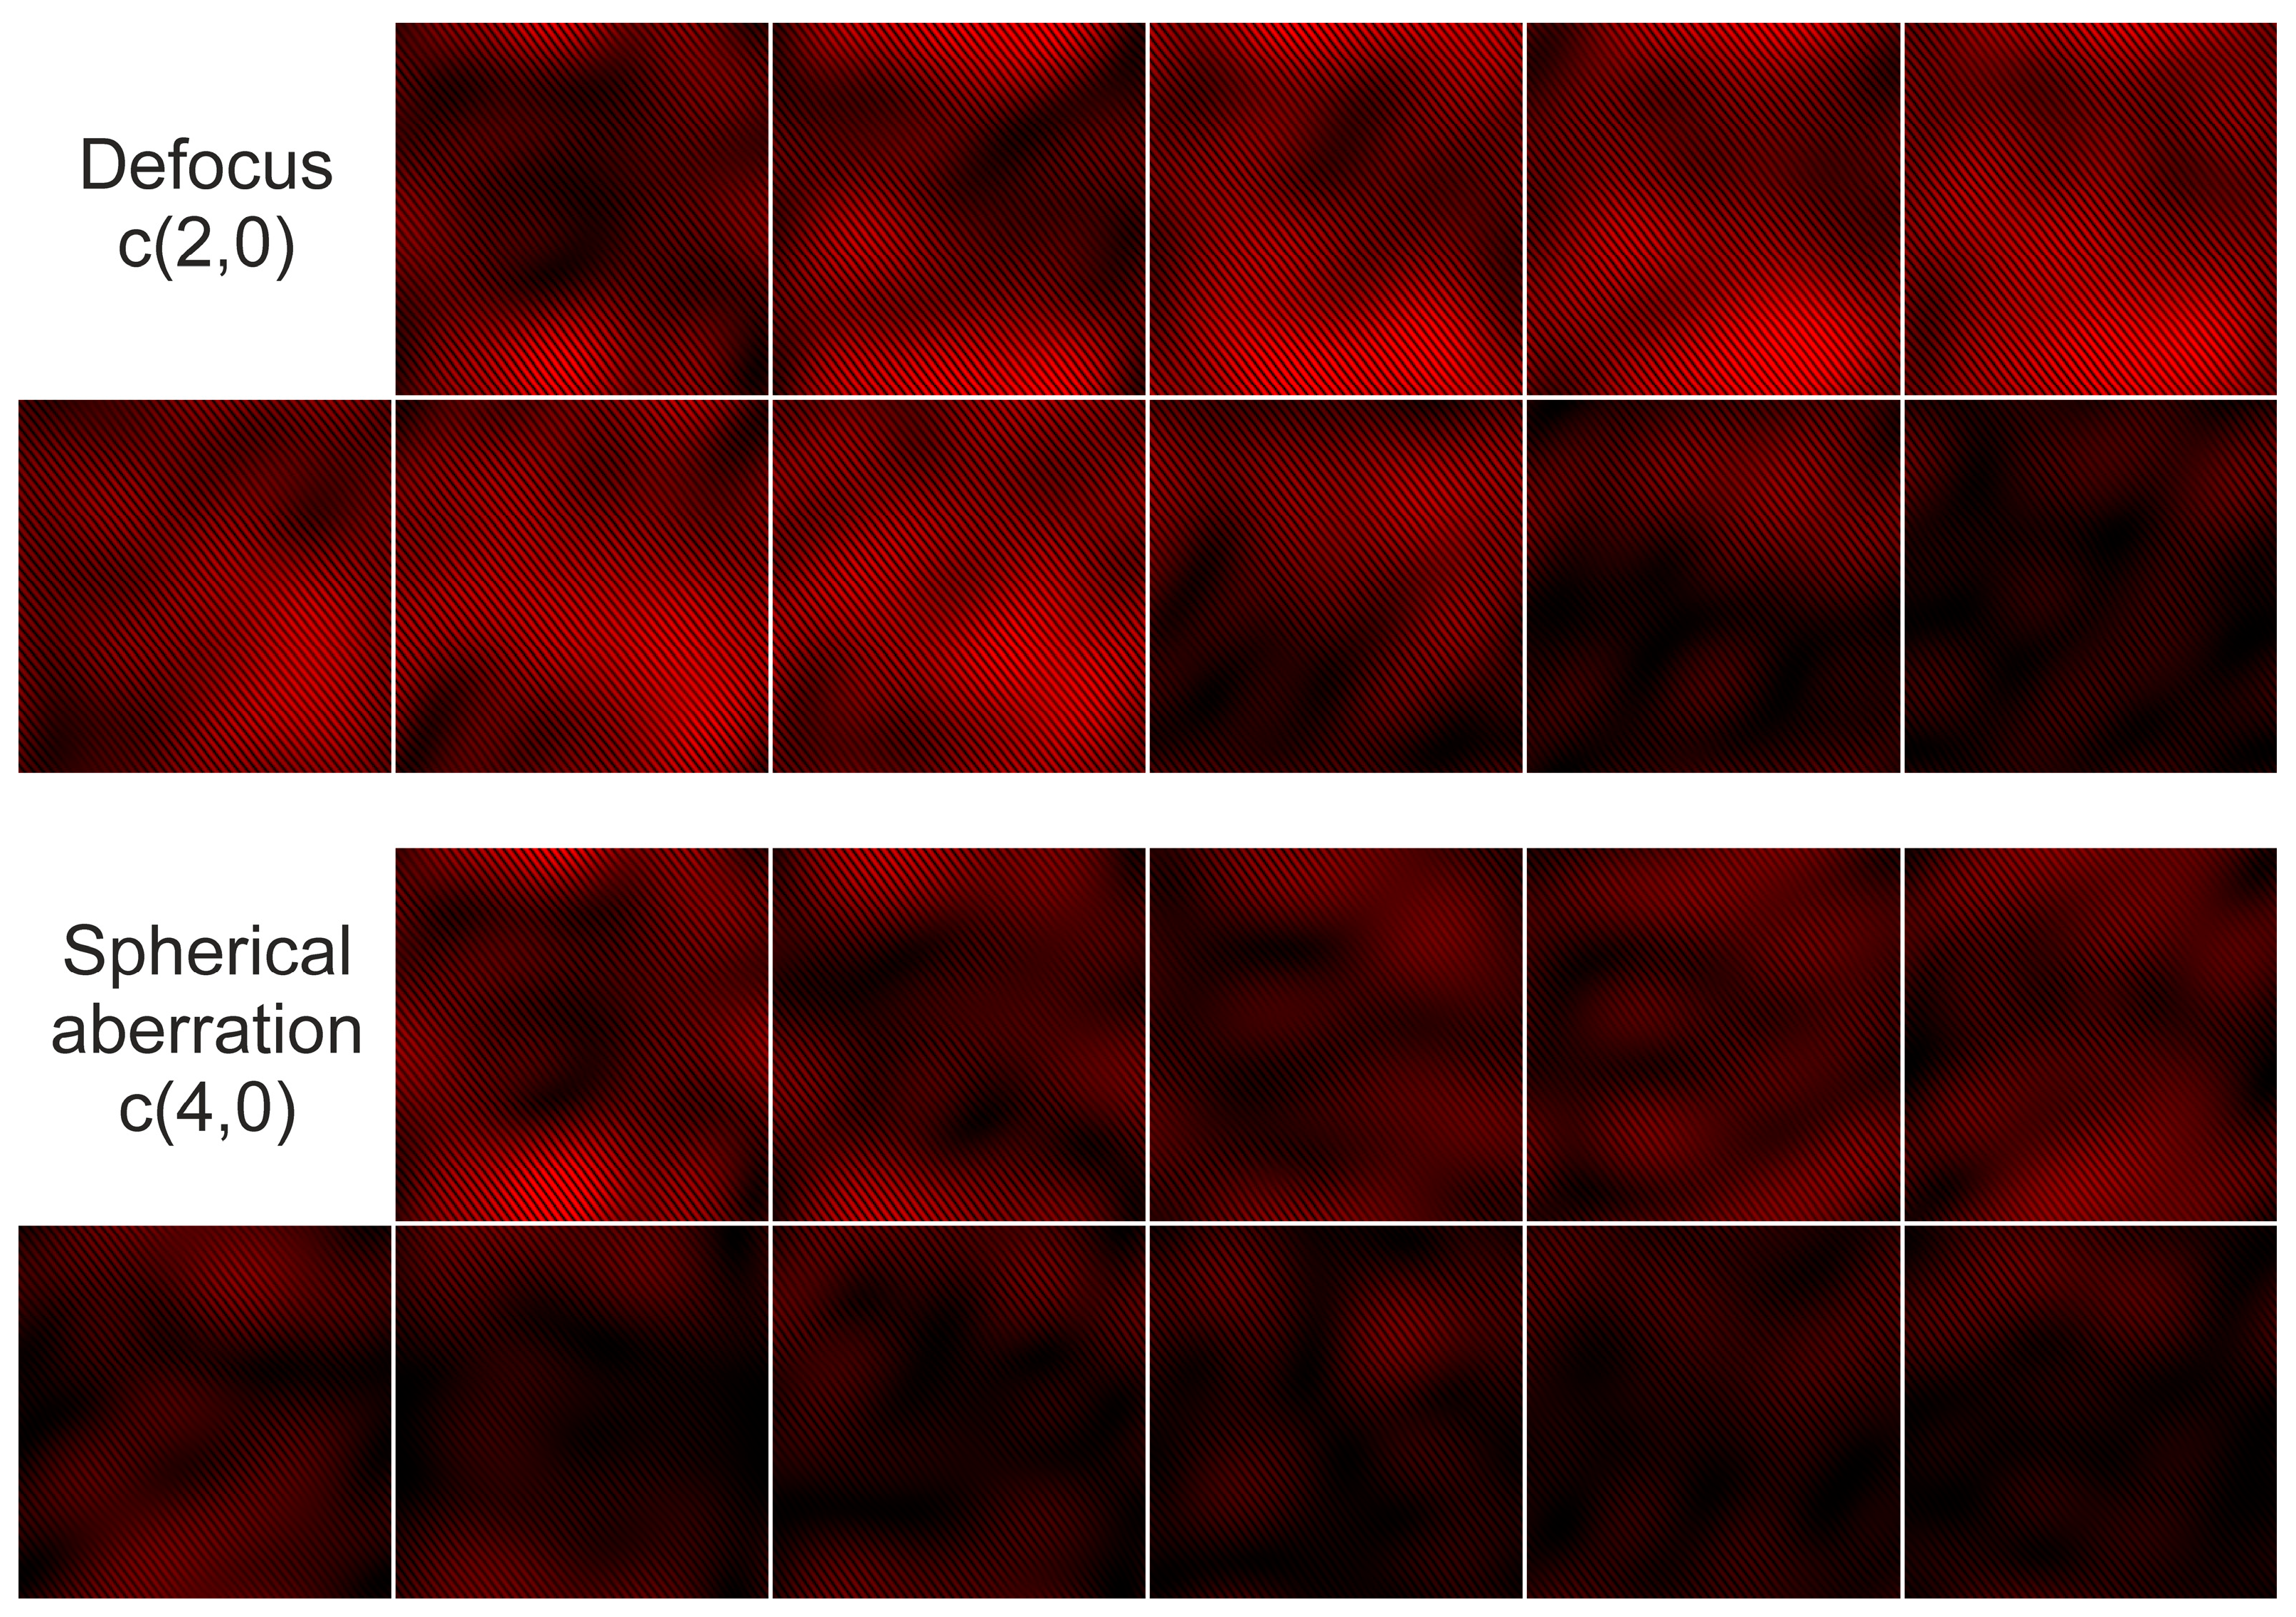
The effect of defocus and spherical aberration on spatial aliasing in the images of the checkerboard pattern is shown in Figure 3. Oblique bright and dark fringes of the aliased signals can be identified, masking the checkerboard pattern and resulting in an angle 35.5 degrees relative to the vertical edge of the squares. The standard direction for the fringes is nearly aligned with the diagonal of the image, as this is the direction along which the sampling rate is the lowest. When the camera was moved slightly around its resting state, the fringes of the aliased signals rapidly moved back and forth, and its polarity contrast changed.
The horizontal lines have resulted from interference in the thin chromium film having non-zero transmittance at places where it was not oxidized by the UV radiation. The interference fringes were created by interference between the transmitted beam and the beam exiting the chromium film after being reflected twice by the front and back surfaces of the thin chromium film. The presence of interference lines also indicates that the chromium film was wedge-shaped because of the characteristics of the thermal deposition of chromium. The source of the chromium was not placed directly under the sample, and this is why chromium was deposited at an oblique angle, resulting in a wedge-shaped thin film.
For each type of aberration, the corresponding Zernike coefficient increases from left to right in increments of 0.05 µm, starting from zero and reaching the maximum value 0.50 µm. The rightmost square of the upper row is followed by the leftmost square of the bottom row. It can be noticed that spatial aliasing deteriorates when a high amount of aberrations is reached, and the oblique fringes cannot be distinguished. The horizontal lines, however, remain present irrespective of the amount of aberrations introduced in the optical system by the deformable mirror.
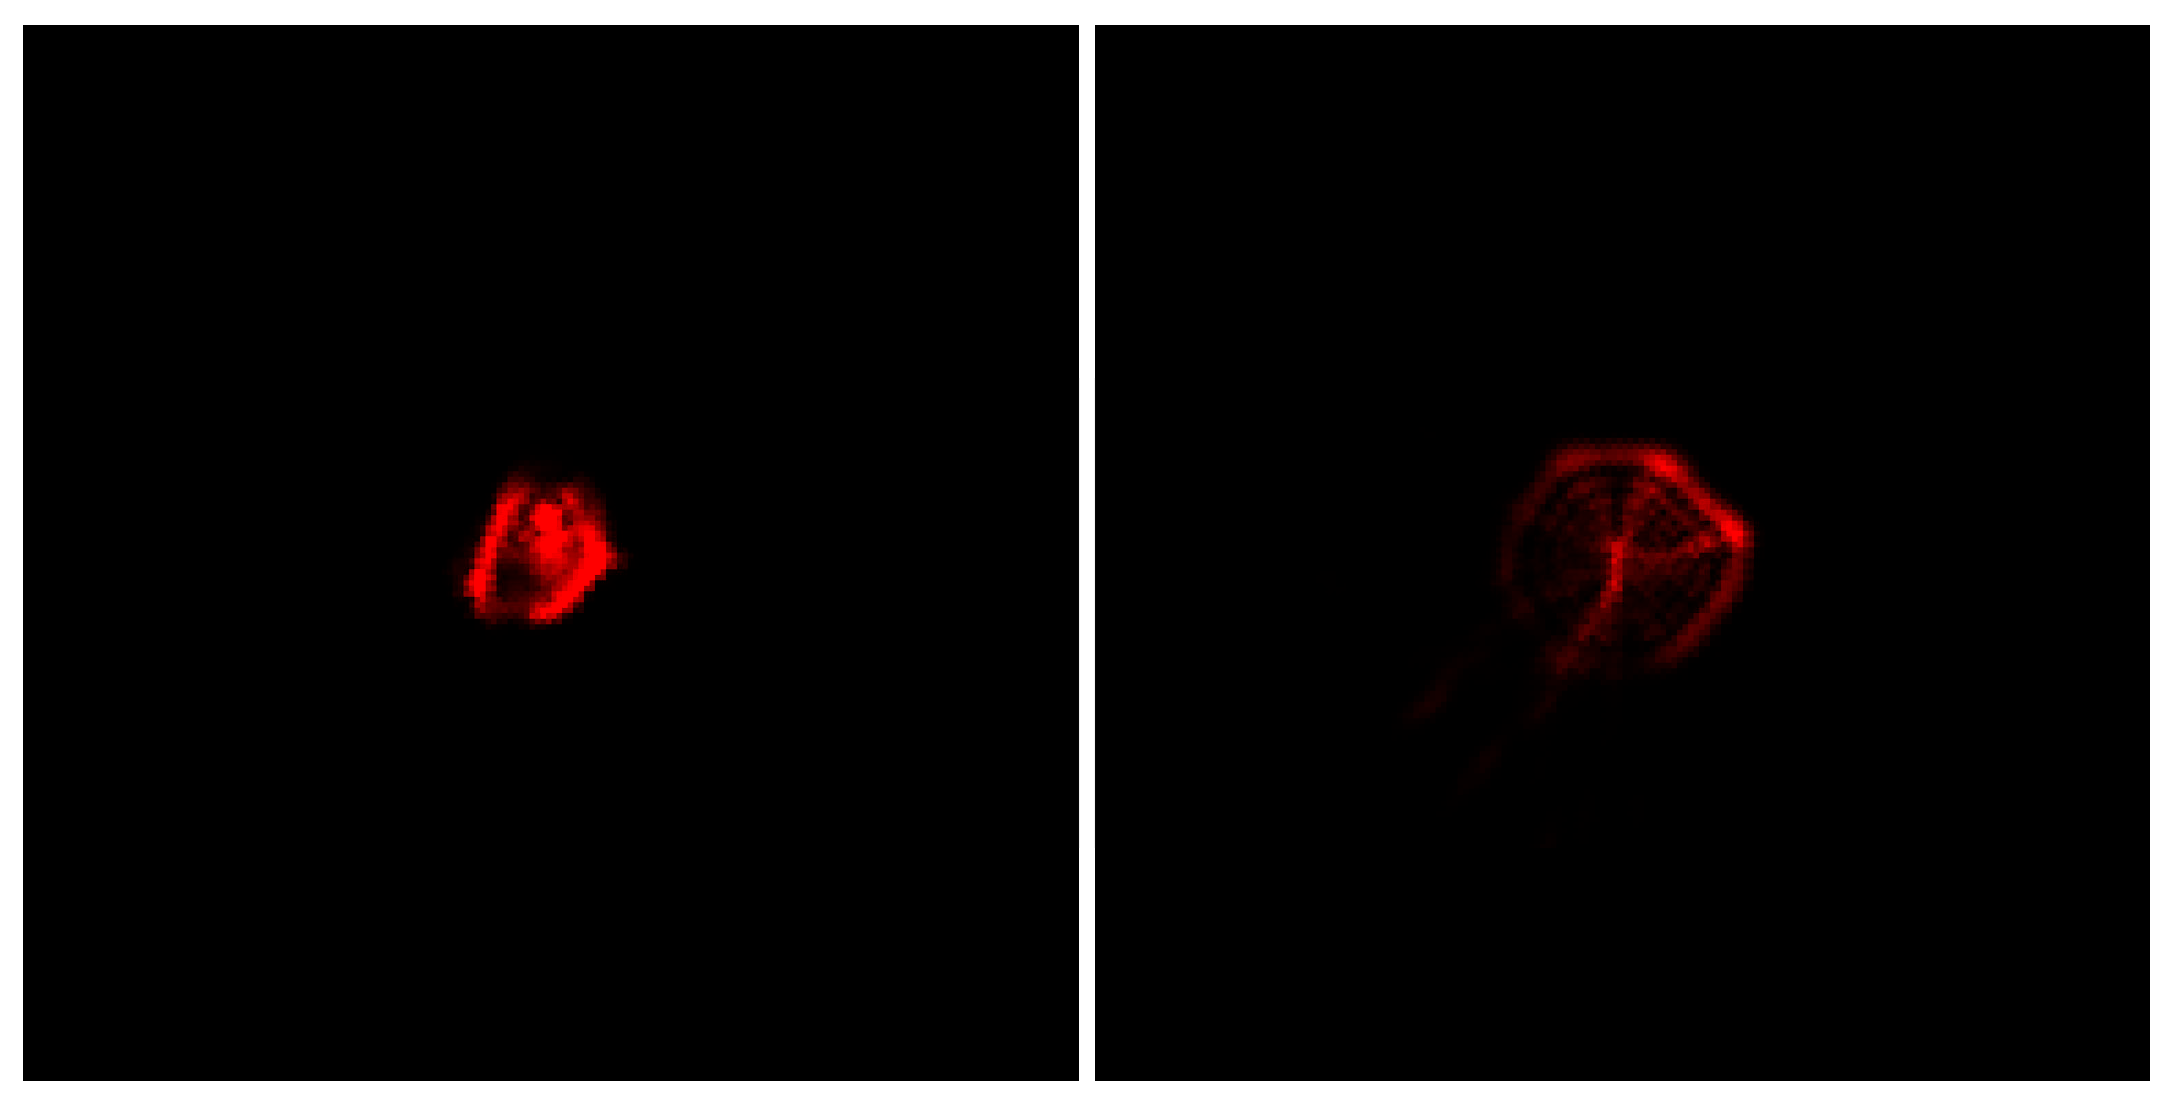
Figure 4 shows the PSFs of defocus (left) and the spherical aberration (right) generated with the deformable mirror. Here, the corresponding Zernike coefficients have values 0.70 μm. The PSFs were measured using a collimated He-Ne laser beam (λ = 632.8 nm). Deviations away from perfect PSFs can be noticed; however, the types of aberrations can still be easily identified from the PSFs. The deviations may have resulted from aberrations inherent to the optical system. The tail seen on bottom left from the center of the PSF shown for spherical aberration is obviously due to reflections from one side of the beam splitter.
The Fourier transforms of the checkerboard patterns captured for three different amounts of defocus and spherical aberration are shown in Figure 5. The top row (panels A, B, and C) is shown for defocus, while the bottom row (panels D, E, and F) is shown for spherical aberration. The left column is shown for the aberration-free case, i.e., the panels A and D are equal, while for the middle and right column the corresponding Zernike coefficients are 0.25 µm and 0.50 µm, respectively. The central peak has been made equal to zero so that higher frequencies of lower amplitude are visible. Two intense frequencies just above and below the central obstruction correspond to the horizontal lines due to the interference in the thin chromium film. The frequencies of the aliased signals (indicated by the red arrows) are found in the first and the third quadrant and have their orthogonal components ν x = 10.5 cycles/degree and ν y = 7.5 cycles/degree. Along the direction perpendicular to the fringes of the aliased signals, the spatial frequency is ν = 12.9 cycles/degree.
Figure 6 shows aliased signals for both types of aberrations extracted from Figure 2. The image was obtained by taking the inverse Fourier transform of the frequency map where all frequencies were masked except the aliasing frequencies. As before, for each type of aberrations, the corresponding Zernike coefficient increases from left to right in increments of 0.05 µm starting from zero and reaching the maximum value 0.50 µm. The rightmost square of the upper row is followed by the leftmost square of the bottom row. The brighter an image, the larger the amplitude of the aliasing signal.
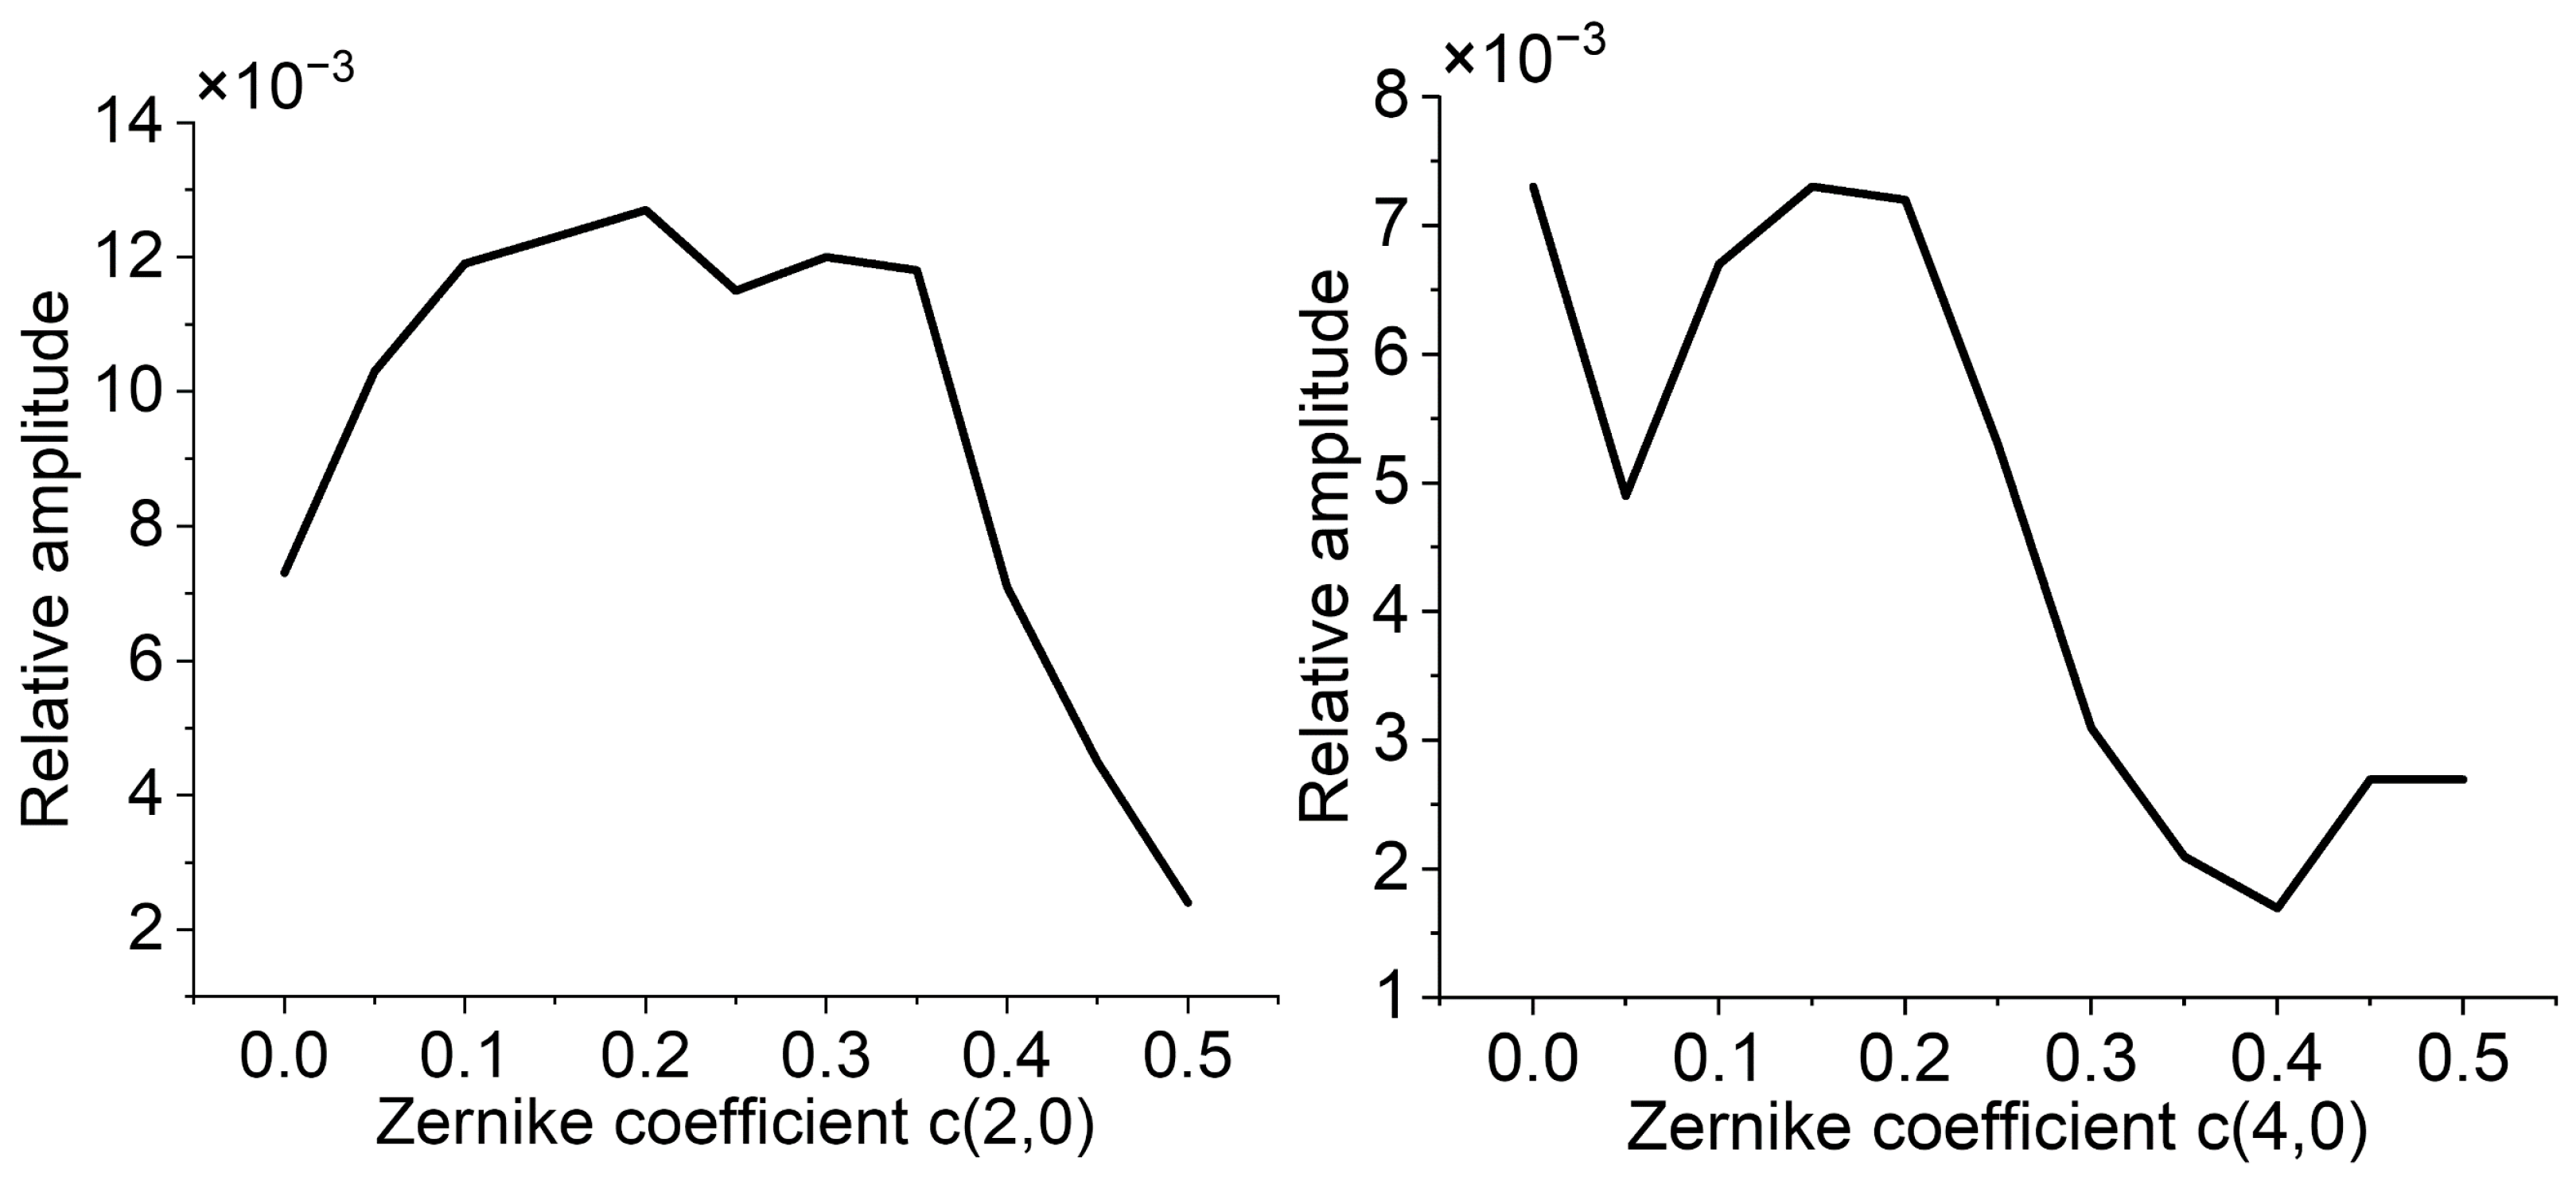
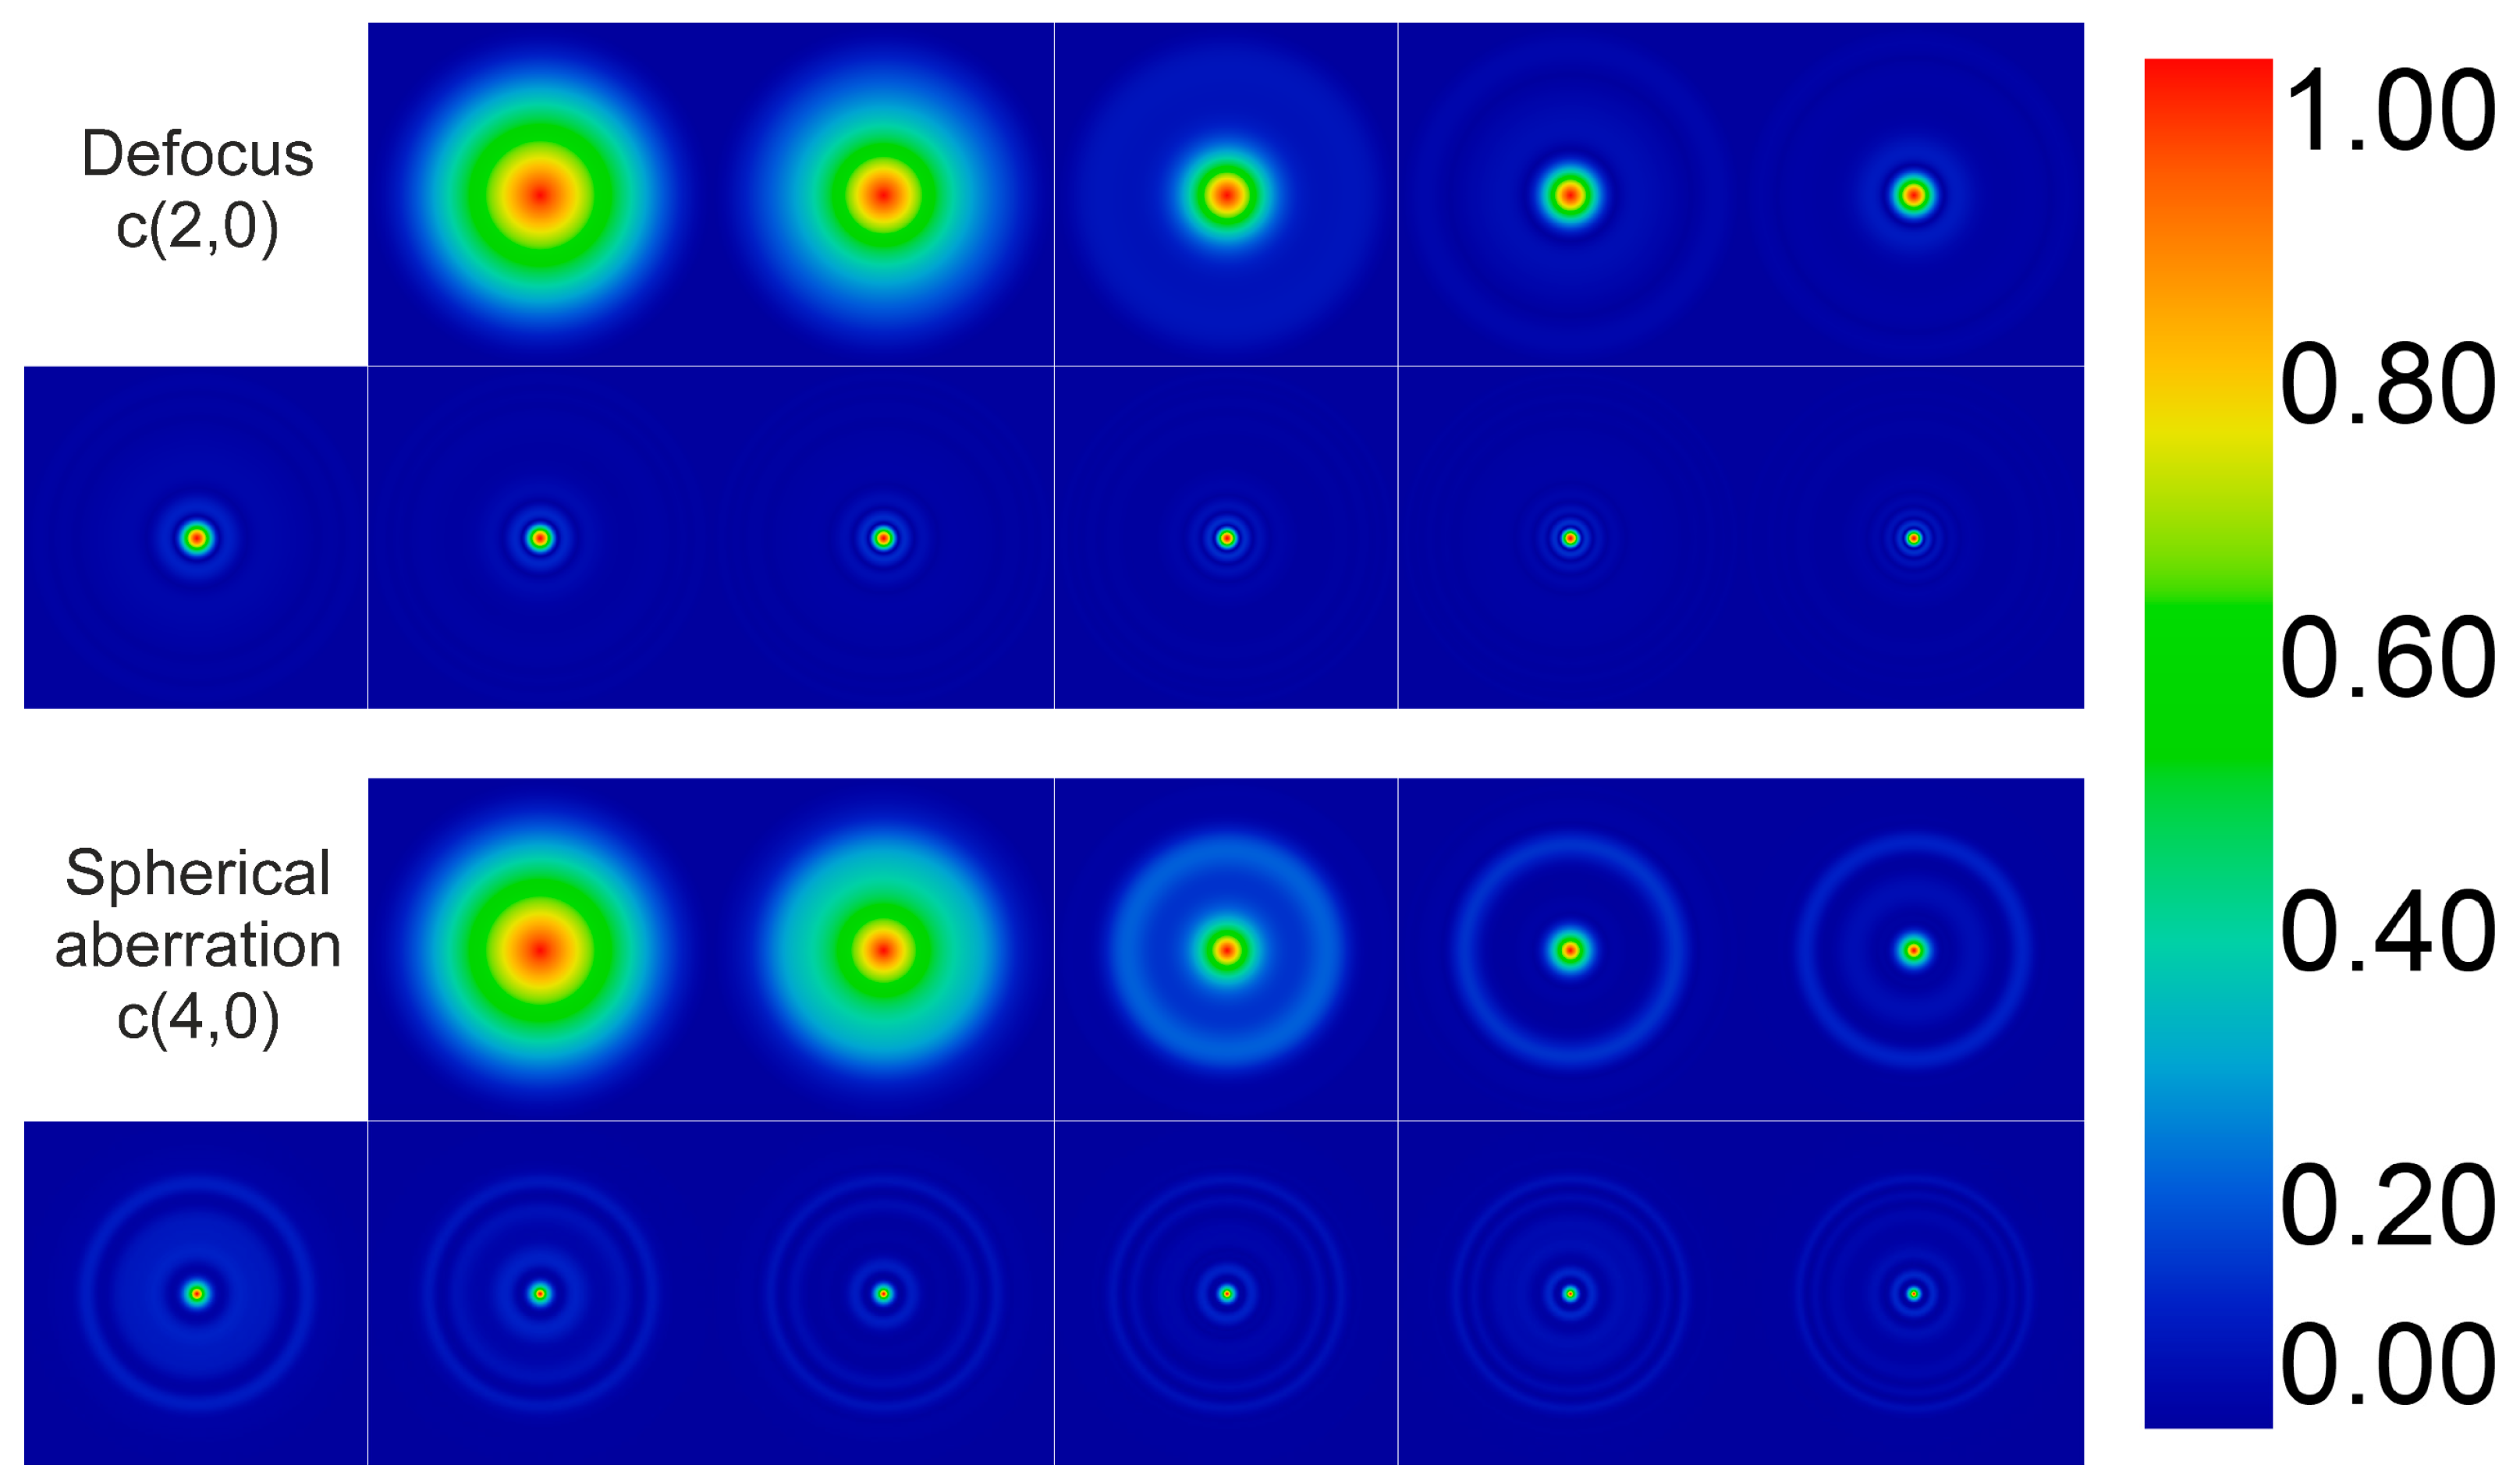
Figure 7 plots the amplitude of the aliased signals versus the amount of defocus (left) and spherical aberration (right). For defocus, the amplitude initially increased until the amount of defocus 0.20 µm was reached and then started to decline gradually. The increase in amplitude may be explained by the small defocus already present in the optical system before introducing additional defocus. Similar behavior can be observed for spherical aberration, as well. The sharp valley corresponding to the amount 0.05 µm may be attributed to the noise present in the image and hence its Fourier transform. The source of the noise in the images is obviously the high gain of the camera needed because of the low amount of light passing through the filter. The results are in accordance with MTF shown for both types of aberrations and all amounts of aberrations in Figure 8. Along both directions, the spatial frequency ranges from −150 cycles/degree to +150 cycles/degree. As soon as the amount of aberrations reaches 0.20 µm, the MTF starts to decline rapidly beyond the Nyquist frequency, while the MTF has already dropped down very low around the Nyquist frequency when the amount of aberrations reaches 0.45 µm.

4. Discussion

The results of this study reveal the presence of spatial aliasing in a model eye having the optical and geometrical parameters close to that of a living human eye. As seen in Figure 4, Fourier analysis did not reveal the fundamental frequency of the checkerboard pattern as it was masked by the aliased signals. While spatial aliasing has already been shown in psychophysical studies [6,7], here we have demonstrated what the aliased signals may look like to subjects participating in such studies and have assessed the influence of the amount of ocular aberrations on spatial aliasing. While the contrast of the aliased signals is low, the aliased signals can be identified. It is important to note that amplitude of the original signal may also be distorted besides aliasing. A typical imaging sensor has square pixels arranged in a regular two-dimensional grid, and the sampling rate is the lowest along the diagonal. While the angle between the aliasing fringes and the vertical edge was 35.5 degrees, it is still close to the diagonal direction along which the sampling rate is the lowest. The difference between the observed direction of the aliased signals and the diagonal may be attributed to a small possible misalignment between the edges of the sensor and the stimulus. Along the direction perpendicular to the aliasing fringes, the frequency of the aliased signals is about 12.9 cycles/degree. If the angle between the aliasing fringes and the edges of the squares were 45 degrees, this frequency would correspond to the spatial frequency about 73 cycles/degree given that the sampling rate along this direction is 120/ 2 = 85 samples/degree. This means that spatial aliasing could be observed along the oblique direction even if the spatial frequency was 45 cycles/degree corresponding to the decimal visual acuity visus = 1.5. In a living eye, the differences between the arrangement of the pixels of the camera and the photoreceptors of a human eye must also be considered. Hexagonal arrangement of the retinal cones and rods [20] may lead to different orientation and frequency of the aliased signals than those observed in this study.
Despite the differences between the arrangement of the pixels of the camera and the retinal photoreceptors, the aliased signals perceived by an observer should still be highly sensitive to small changes in the refractive state of an eye. Obviously, the amount of ocular aberrations needed to affect the visibility of the aliased signals is few tenths of a micron. For the size of a pupil 6 mm used in this study, the refractive error corresponding to the amount of defocus 0.50 µm is about 0.40 diopters. It should be noted that the high sensitivity of the aliased signals to small changes in the refractive state of the eye makes the measurements susceptible to any possible aberrations before introducing additional aberrations by the deformable mirror. Such aberrations present in the eye of the optical system may have caused an increase in the amplitude of the aliased signals as additional aberrations were brought into the optical system. The PSFs indicated the presence of inherent aberrations, and these aberrations may have contributed to the peaks and valleys seen in Figure 7. The high susceptibility of the aliased signals to the refractive state of an eye also justifies the election of the deformable mirror for the generation of aberrations compared to other means. As already noted, the deformable mirror has a smooth surface, while a spatial light modulator, despite having high spatial resolution (a pixel size of 8 μm), could introduce diffraction-related errors due to lines separating individual rows and columns (a fill factor of 92%). Aberrations can also be introduced into the optical system using phase plates [21] placed in front of the eye; however, the manufacturing of such phase plates is subject to possible variations in the lithographic process.
The results of this study imply the practical significance of spatial aliasing in visual experiments where either square-wave gratings or checkerboard patterns are used as visual stimuli [4,22,23,24]. Square-wave gratings and checkerboard patterns contain not only the fundamental frequencies but also higher-order odd harmonics. Even if the fundamental frequency meets the requirements of the Shannon–Nyquist theorem, the odd harmonics present in a rectangular grating may fail to do so, resulting in spatial aliasing. In this study, spatial aliasing was observed in an oblique direction when presenting a stimulus with the spatial frequency of 60 cycles/degree. However, it may also be encountered due to the third harmonics when presenting a stimulus with the spatial frequency of 30 cycles/degree (the decimal visual acuity visus = 1). In many studies, a subject is often asked to identify the orientation of a visual stimulus, for example, a grating [25,26]. When submitting a response, the subject may judge not the orientation of the true signal, but the aliased signal being influenced by the rotation of the stimulus relative to the mosaic of photoreceptors [27]. The angle of rotation may be hard to control because of head movements, thereby reducing the reliability of measurements.
The results also reveal that the visual perception may not always benefit from the complete correction of ocular aberrations, i.e., the optical quality of an eye may become too high for its capabilities to process fine spatial information correctly. As pointed out by Lundstrom [4], there must be a certain amount of ocular aberrations converting the visual resolution from sampling-limited to aberration-limited. However, attention must be paid not only to the cut-off frequency closely related to the sampling rate and the maximum achievable visual acuity, but also to contrast sensitivity. Ocular aberrations decrease not only the cut-off frequency but also the MTF at lower frequencies. We found that the refractive error about 0.5 D prevents spatial aliasing; however, it has also been shown that such a small refractive error lowers contrast sensitivity at spatial frequencies of 20 cycles/degree and below [28]. It must also be added that the desired amount of aberrations depends on the frequency spectrum of the stimulus, and this may be lower than 0.5 D if the aliasing signals are triggered by higher-order harmonics.
The level at which the correction of ocular aberrations also seems to be related to the size of a pupil is useful. If the size of a pupil is small enough so that the cut-off frequency is below the Nyquist frequency, then complete correction of ocular aberrations is preferred. If the size of a pupil is above 4 mm, then a small amount of ocular aberration should be left uncorrected to avoid exceeding the Nyquist frequency, because spatial aliasing is present in a diffraction-limited eye if the size of a pupil exceeds 4 mm [9].

5. Conclusions

This study has demonstrated the influence of the ocular aberrations on spatial aliasing based on a Fourier analysis of the aliased signals; it can be concluded that a small refractive error may be desired to prevent spatial aliasing. Various types of aberrations may affect spatial aliasing differently depending on the radial direction, as the PSF and hence the MTF can be asymmetric. The degree of spatial aliasing strongly depends on the spatial frequencies present in the stimulus and the orientation of the stimulus relative to the array of pixels.

Author Contributions

Conceptualization, V.K.; methodology, V.K. and M.J.; software, V.K.; validation, V.K. and M.J.; formal analysis, V.K., M.J. and M.O.; investigation, V.K. and M.J.; resources, V.K.; data curation, V.K., M.J. and M.O.; writing—original draft preparation, V.K.; writing—review and editing, V.K. and M.O.; visualization, V.K. and S.F.; supervision, V.K. and S.F.; project administration, V.K.; funding acquisition, V.K. All authors have read and agreed to the published version of the manuscript.

Funding

This research was funded by University of Latvia Foundation and company MikroTik, grant number 2257.

Data Availability Statement

The original contributions presented in this study are included in the article. Further inquiries can be directed to the corresponding author.

Conflicts of Interest

The authors declare no conflicts of interest.

Abbreviations

The following abbreviations are used in this manuscript:
MTFModulation transfer function
PSFPoint spread function

References

  1. Navarro, R. The Optical Design of the Human Eye: A Critical Review. J. Optom. 2009, 2, 3–18. [Google Scholar] [CrossRef]
  2. Atchison, D.A.; Guo, H. Subjective blur limits for higher order aberrations. Optom. Vis. Sci. 2010, 87, 890–898. [Google Scholar] [CrossRef]
  3. Williams, D.R.; Artal, P.; Navarro, R.; Mcmahon, M.J.; Brainard, D.H. Off-axis optical quality and retinal sampling in the human eye. Vis. Res. 1996, 36, 1103–1114. [Google Scholar] [CrossRef] [PubMed]
  4. Lundström, L.; Manzanera, S.; Prieto, P.M.; Ayala, D.B.; Gorceix, N.; Gustafsson, J.; Unsbo, P.; Artal, P. Effect of optical correction and remaining aberrations on peripheral resolution acuity in the human eye. Opt. Express 2007, 15, 12654–12661. [Google Scholar] [CrossRef]
  5. Williams, D.; Yoon, G.Y.; Porter, J.; Guirao, A.; Hofer, H.; Cox, I. Visual benefit of correcting higher order aberrations of the eye. J. Refract. Surg. 2000, 16, S554–S559. [Google Scholar] [CrossRef] [PubMed]
  6. Williams, D.R. Topography of the foveal cone mosaic in the living human eye. Vis. Res. 1988, 28, 433–454. [Google Scholar] [CrossRef] [PubMed]
  7. Williams, D.R. Aliasing in human foveal vision. Vis. Res. 1985, 25, 195–205. [Google Scholar] [CrossRef]
  8. Demirel, S.; Anderson, R.S.; Dakin, S.C.; Thibos, L.N. Detection and resolution of vanishing optotype letters in central and peripheral vision. Vis. Res. 2012, 59, 9–16. [Google Scholar] [CrossRef]
  9. Applegate, R.A. Limits to vision: Can we do better than nature? J. Refract. Surg. 2000, 16, S547–S551. [Google Scholar] [CrossRef]
  10. Artal, P.; Navarro, R. Monochromatic modulation transfer function of the human eye for different pupil diameters: An analytical expression. J. Opt. Soc. Am. A 1994, 11, 246–249. [Google Scholar] [CrossRef]
  11. Carkeet, A.; Leo, S.W.; Khoo, B.K.; Eong, K.G.A. Modulation transfer functions in children: Pupil size dependence and meridional anisotropy. Investig. Ophthalmol. Vis. Sci. 2003, 44, 3248–3256. [Google Scholar] [CrossRef]
  12. Wang, W.; Wan, Y.; Zhao, K. The aberration and the modulation transfer function in LASEK and LASIK: Pupil size dependence. Optik 2010, 121, 500–505. [Google Scholar] [CrossRef]
  13. Yang, Q.; Yang, Z.; Lan, Y.F.; Wu, S.T. Low-diffraction transparent micro light-emitting diode displays with optimized pixel structure. J. Soc. Inf. Disp. 2022, 30, 395–403. [Google Scholar] [CrossRef]
  14. Valentina, B.S.; Ramona, B.; Speranta, S.; Calin, T. The influence of optical aberrations in refractive surgery. Rom. J. Ophthalmol. 2015, 59, 217–222. [Google Scholar] [PubMed]
  15. De Almeida, M.S.; Carvalho, L.A. Different schematic eyes and their accuracy to the in vivo eye: A quantitative comparison study. Braz. J. Phys. 2007, 37, 378–387. [Google Scholar] [CrossRef]
  16. Kuts, R.I.; Korolkov, V.P.; Sametov, A.R.; Cherkashin, V.V.; Zaitseva, D.E.; Golubtsov, S.K. Thermochemical laser writing of chromium grayscale masks and their application for fabrication of multilevel diffractive optical elements. In Proceedings of the SPIE/COS Photonics Asia, Beijing, China, 27 November 2023. [Google Scholar]
  17. Artal, P.; Marcos, S.; Navarro, R.; Williams, D.R. Odd aberrations and double-pass measurements of retinal image quality. J. Opt. Soc. Am. A 1995, 12, 195–201. [Google Scholar] [CrossRef]
  18. Diaz-Santana, L.; Dainty, J.C. Effects of retinal scattering in the ocular double-pass process. J. Opt. Soc. Am. A 2001, 18, 1437–1444. [Google Scholar] [CrossRef]
  19. Thibos, L.N.; Hong, X.; Bradley, A.; Applegate, R.A. Accuracy and precision of objective refraction from wavefront aberrations. J. Vis. 2004, 4, 329–351. [Google Scholar] [CrossRef]
  20. Mustafi, D.; Engel, A.H.; Palczewski, K. Structure of cone photoreceptors. Prog. Retin. Eye Res. 2009, 28, 289–302. [Google Scholar] [CrossRef]
  21. Yi, A.Y.; Raasch, T.W. Design and fabrication of a freeform phase plate for high-order ocular aberration correction. Appl. Opt. 2005, 44, 6869–6876. [Google Scholar] [CrossRef]
  22. Maffei, L.; Morrone, C.; Pirchio, M.; Sandini, G. Responses of visual cortical cells to periodic and non-periodic stimuli. J. Physiol. 1979, 296, 27–47. [Google Scholar] [CrossRef] [PubMed]
  23. Allenmark, F.; Read, J.C.A. Detectability of sine- versus square-wave disparity gratings: A challenge for current models of depth perception. J. Vis. 2010, 10, 17. [Google Scholar] [CrossRef] [PubMed]
  24. Norcia, A.M.; Appelbaum, L.G.; Ales, J.M.; Cottereau, B.R.; Rossion, B. The steady-state visual evoked potential in vision research: A review. J. Vis. 2015, 15, 4. [Google Scholar] [CrossRef] [PubMed]
  25. Kirsch, W.; Kunde, W. Human perception of spatial frequency varies with stimulus orientation and location in the visual field. Sci. Rep. 2023, 13, 17656. [Google Scholar] [CrossRef] [PubMed]
  26. Rosa, C.; Aleci, C. Psychophysics in the ophthalmological practice—II. Contrast sensitivity. Ann. Eye Sci. 2022, 7, 35. [Google Scholar] [CrossRef]
  27. McTrusty, A.D.; Kennedy, G.J.; Strang, N.C.; Manahilov, V.; Gray, L.S. Foveal aliasing is orientation and luminance dependent. Investig. Ophthalmol. Vis. Sci. 2010, 51, 965. [Google Scholar]
  28. Kim, C.Y.; Chung, S.H.; Kim, T.I.; Cho, Y.J.; Yoon, G.; Seo, K.Y. Comparison of higher-order aberration and contrast sensitivity in monofocal and multifocal intraocular lenses. Yonsei Med. J. 2007, 20, 627–633. [Google Scholar] [CrossRef]
Figure 1. A schematic diagram of the optical system used in the study. LED—a light emitting diode; L—a lens; BS—a beam splitter; DM—a deformable mirror; FT—Fourier transform. The arrows indicate the direction of the propagation of light. See the text for details.
Photonics 12 01003 g001
Figure 2. An optical image of the checkerboard pattern used in the study. A single square is 4 µm by 4 µm in size. When used in the optical system, the spatial frequency of the checkerboard pattern was 60 cycles/degree.
Photonics 12 01003 g002
Figure 3. The effect of defocus and spherical aberration on spatial aliasing. The fringes of the aliased signals are the dark and bright oblique lines, while the horizontal lines are due to the interference in the thin chromium film. The amount of defocus and spherical aberrations increases from 0 µm to 0.50 µm in increments of 0.05 µm from left to right. The rightmost square of the upper row is followed by the leftmost square of the bottom row.
Photonics 12 01003 g003
Figure 4. The PSFs of defocus (left) and the spherical aberration (right) measured at a He-Ne laser wavelength (λ = 632.8 nm). The corresponding values of Zernike coefficients were 0.70 μm.
Photonics 12 01003 g004
Figure 5. The Fourier transforms of the checkerboard patterns captured for three different amounts of defocus and spherical aberration. The top row (AC) is shown for defocus, while the bottom row (DF) is shown for spherical aberration. The left column (panels (A) and (D)) is shown for the aberration-free case, while the Zernike coefficients for the middle and right column are 0.25 µm and 0.50 µm, respectively. The frequencies of the aliased signals are indicated by the red arrows.
Photonics 12 01003 g005
Figure 6. Aliased signals for both types of aberrations extracted from Figure 2. The images were obtained by taking the inverse Fourier transform of the frequency map where all frequencies were masked except the aliasing frequencies. For each type of aberration, the corresponding Zernike coefficient increases from left to right in increments of 0.05 µm starting from zero and reaching the maximum value 0.50 µm. The rightmost square of the upper row is followed by the leftmost square of the bottom row.
Photonics 12 01003 g006
Figure 7. The amplitude of the aliased signals vs. the amount of defocus (left) and spherical aberration (right). For both types of aberrations, the amplitude starts to decline when an aberration amount of 0.20 µm is reached, while the lowest point is observed when the amount of aberrations is about 0.45 µm.
Photonics 12 01003 g007
Figure 8. The MTF of the model eye depending on the amount of defocus and spherical aberration. The amount of defocus and spherical aberrations increases from 0 µm to 0.50 µm in increments of 0.05 µm from left to right. The rightmost square of the upper row is followed by the leftmost square of the bottom row. Along both directions, the spatial frequency ranges from −150 cycles/degree to +150 cycles/degree.
Photonics 12 01003 g008
Disclaimer/Publisher’s Note: The statements, opinions and data contained in all publications are solely those of the individual author(s) and contributor(s) and not of MDPI and/or the editor(s). MDPI and/or the editor(s) disclaim responsibility for any injury to people or property resulting from any ideas, methods, instructions or products referred to in the content.