Article

Optimization and Modeling of Optical Emission Spatial Coverage from Underwater Multi-Faceted Optical Base Stations

School of Information and Communication, Guilin University of Electronic Technology, Guilin 541004, China
*
Author to whom correspondence should be addressed.
Photonics 2025, 12(1), 4; https://doi.org/10.3390/photonics12010004
Submission received: 23 November 2024 / Revised: 14 December 2024 / Accepted: 23 December 2024 / Published: 24 December 2024

Abstract

:
Compared with point-to-point wireless optical communication systems, multi-faceted Optical Base Stations (OBSs) offer the advantages of supporting multi-user access and achieving omnidirectional dynamic communication. The emission structure of the multi-faceted OBSs, which offer wide beam coverage and ensure uniform distribution of optical signals, is essential for users to receive signals while in motion. This paper presents a modeling method for three-dimensional beam coverage based on the multi-faceted OBS architecture. Additionally, a Multi-Objective Particle Swarm Optimization (MOPSO) algorithm is used to optimize the configuration of the multi-faceted LED array by adjusting the deflection angles of the LED arrays and the emission half-angle of the LEDs at the OBS. These advancements aim to enhance beam coverage performance while also providing technical support for achieving omnidirectional communication in underwater optical wireless networks (UOWN).

1. Introduction

With the advancement of marine exploration, dependence on marine resources has increased, from extracting seabed minerals to protecting marine biodiversity [1]. Underwater unmanned vehicles (UUVs) have become widespread, and data collection and information exchange via underwater wireless communication (UWC) systems are used to improve exploration efficiency and broaden operational scope [2,3,4]. With the increasing demand for multimedia data transmission, underwater optical wireless communication (UWOC) offers advantages in transmission rate, link latency, and system power consumption, making it an effective complement to underwater wireless acoustic communication (UWAC) technology [5,6,7].
Due to the uneven density of seawater, establishing a stable UWOC link is challenging [8,9]. The line-of-sight transmission of the optical beam requires devices to remain within its effective coverage, which is critical in communication scenarios involving mobile UUVs [10]. The development of semiconductor technology has improved the luminous efficiency and emission power of blue light LEDs, offering new technological solutions for UWOC. Replacing a narrow-beam laser diode (LD) with a wide-beam LED relaxes the tracking and pointing requirements of transceivers, thereby reducing the risk of communication interruptions due to minor positional shifts of the transceivers [11,12,13]. A real-time UOWC system has demonstrated the feasibility of using a single commercial LED as a modulated light source [14]. In addition, a circular LED array used six commercial blue LEDs with a 7.5° emission half-angle, which enhanced the transmission power. Also, different packaging lenses can be applied to LEDs to design varying emission half-angles [15]. The quasi-omnidirectional UWOC transmitter uses freeform lenses in the LED array has been proposed. This design features an emission half-angle of 75°, making it easier to establish a UWOC link in underwater environments [16].
However, the aforementioned system still requires pointing and tracking mechanisms to establish and maintain the link [17]. Moreover, when multiple UUVs attempt to connect to a cellular UOWN through a single station, the typical design of a single-sided LED array is ineffective for establishing multi-user communication links. In such cases, the development of a multi-faceted LED array transmitter can efficiently provide access for multiple users [18]. The multi-faceted LED arrays place transceivers on each face, which allows for broader spatial coverage and reduces alignment constraints [19,20,21].
An early proof of concept for the OBS with a multi-faceted LED array architecture was explored, examining its potential for spatial reuse and angular diversity among multiple transceivers [19]. The three-faceted LED array of high-power blue LED modules was used to emit light signals in different directions, realizing a quasi-omnidirectional UWOC system [20]. The omnidirectional optical communication system was also proposed, consisting of six-faceted lensless transceivers. This system was integrated into a custom-designed underwater fish robot; after shaping, the maximum emission half-angle was set to 45°, and beam coverage was achieved through the six-faceted LED array [21].
Research on multi-faceted LED array systems has shown promising results, but there has been limited analysis on optimizing the layout of the multi-faceted OBS architecture. In underwater environments, when moving devices communicate with the OBS, they move dynamically in three-dimensional space. To establish a link between the stations and the moving devices, the system must remain within the effective coverage of the optical beam. The layout design of the transmitter determines the beam’s distribution in three-dimensional space, and uneven beam distribution prevents the system from achieving stable communication in the spatial domain [22].
This paper establishes a spatial coverage model of omnidirectional OBS beams in a three-dimensional space and analyzes the effective coverage and distribution uniformity of a multi-faceted LED array OBS. The deflection angle of the multi-faceted LED array at the base station and the emission half-angle of the LEDs determine the beam coverage in three-dimensional space. The MOPSO algorithm is used to optimize the LED emission half-angle and the LED array deflection angle for the OBS. Using a seven-faceted LED array OBS as an example, the optimal configuration is selected from the Pareto set for beam coverage modeling of OBSs. The modeling analysis shows that the optimized OBS configuration performs better in terms of signal coverage characteristics compared to typical configuration designs.
The structure of this paper is as follows. Section 2 introduces the underwater OBS beam emission model, Section 3 discusses the MOPSO algorithm used to optimize the optical emission model, and Section 4 presents the results and discussion.

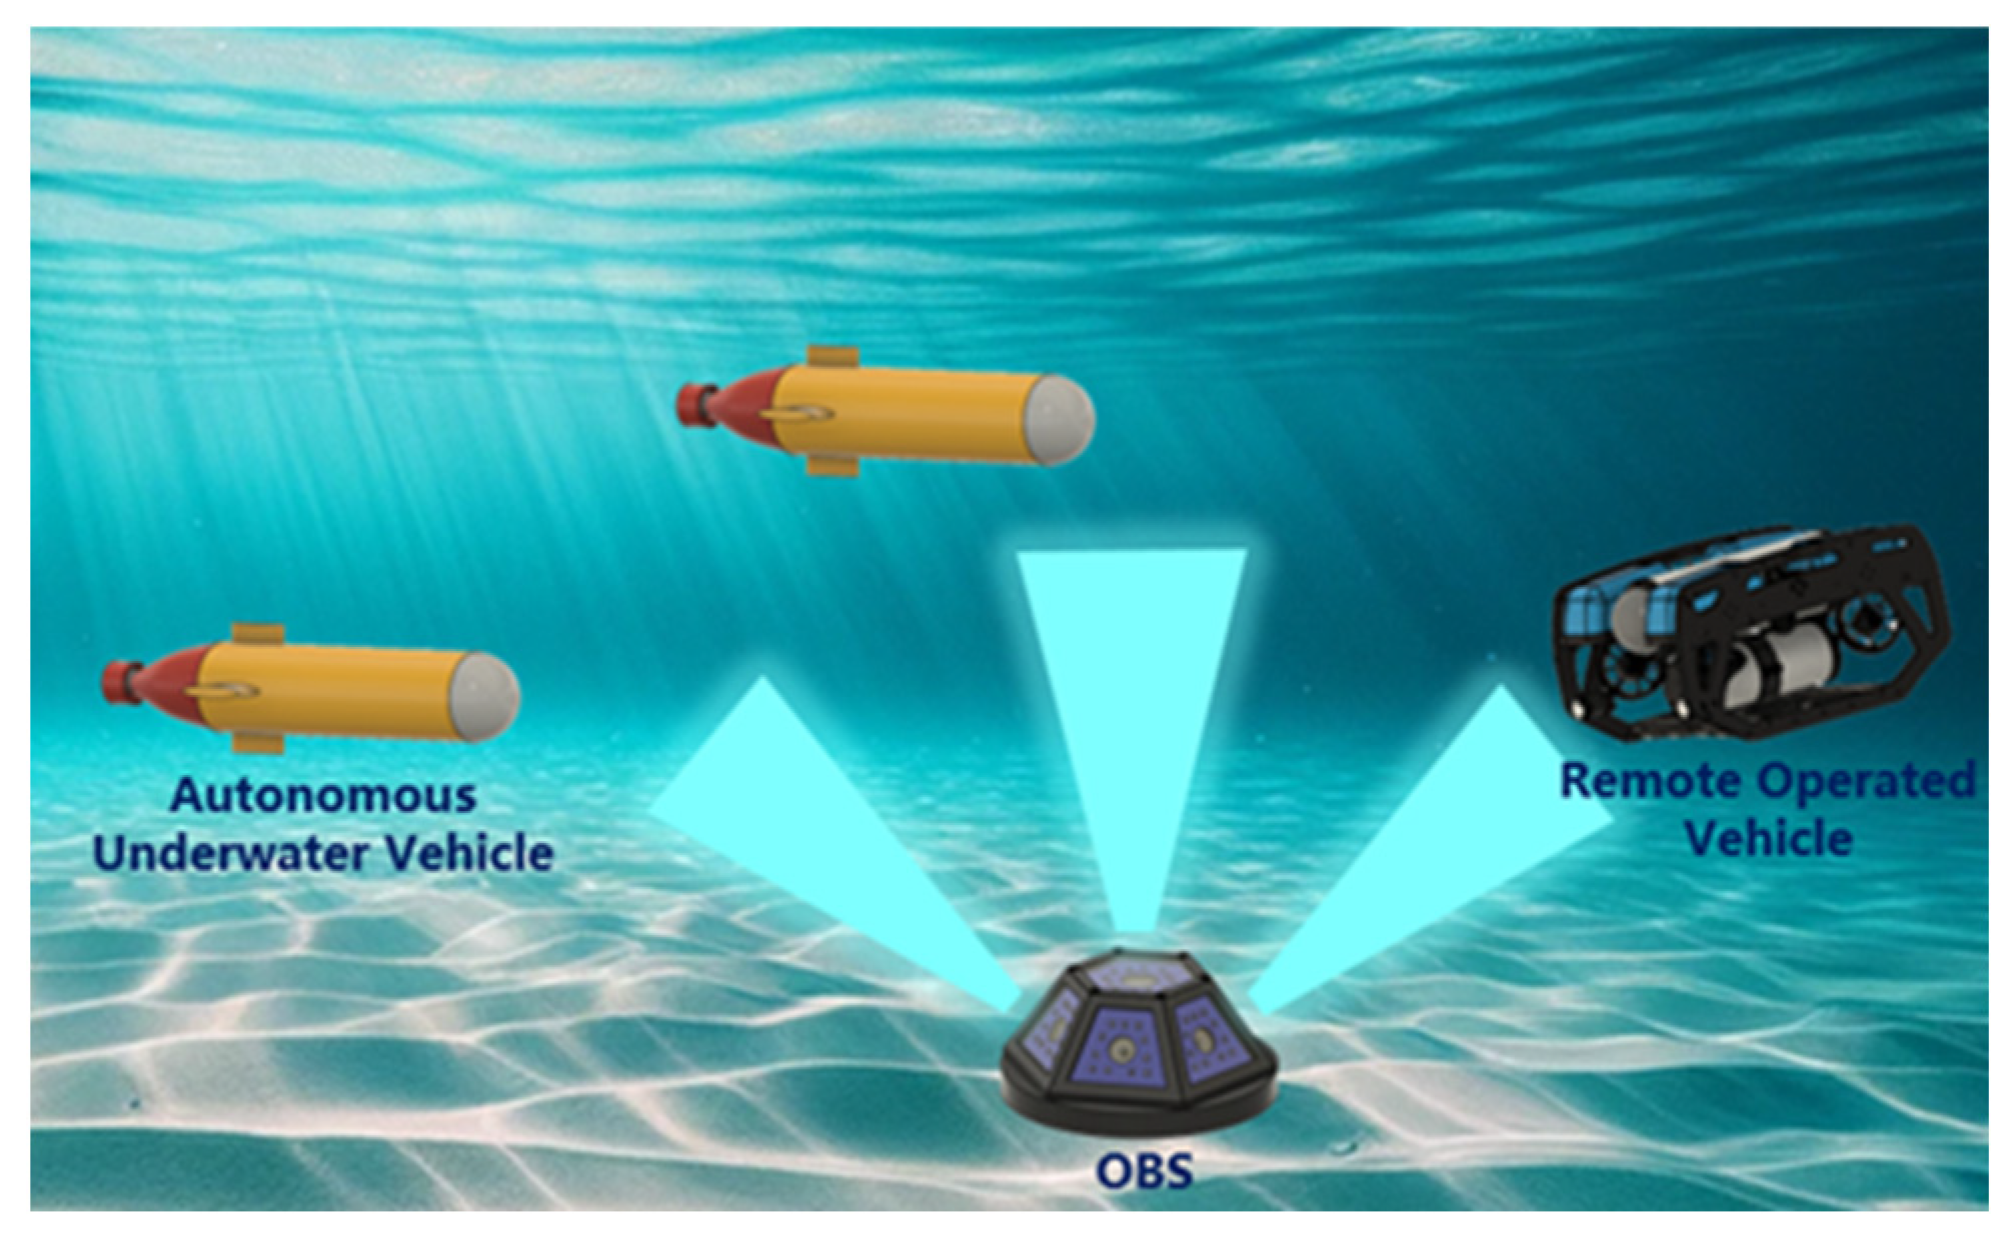
2. The Underwater OBS Beam Emission Model

A multi-faceted LED array OBS structure, as shown in Figure 1, utilizing a multi-faceted LED array to emit beams extends the beam spatial coverage of the UWOC transceivers.

2.1. Angular Power Density of Source

The relationship defining the peak radiant intensity of the light source within the LED is as follows [11]:
I p e a k = P total 2 π 0 π / 2 f ( θ ) sin ( θ ) d θ
where P total represents the radiant power of the light source and I p e a k is the peak radiant intensity. f ( θ ) [ 0 , 1 ] is a relative intensity function, typically conforming to Lambert’s Law f ( θ ) = cos m θ , and θ [ 0 , π / 2 ] is the angular displacement relative to the optical axis. The parameter m is determined by the emission half-angle θ 1 / 2 of the light source.
m = ln 2 ln ( cos θ 1 / 2 )
The optical irradiance is given by the following:
P ( θ , r ) = I p e a k cos m ( θ ) exp ( c r ) r 2
where c is defined as the attenuation coefficient of seawater with respect to light and r is the transmission distance.

2.2. OBS Beam Emission Model

Light propagation involving refraction, reflection, and transmission at media boundaries is governed by Snell’s Law and the Fresnel equations [23]. These principles delineate the behavior of light at media interfaces. The transition of light between media alters the solid angle as well as the incidence and transmission angles, affecting the radiant intensity of the boundary. This relationship can be mathematically represented as follows:
d Ω 1 = n 2 2 cos θ t n 1 2 cos θ i d Ω 2
where θ i represents the angle of incidence, θ t is the angle of emergence, n 1 is the refractive index of the medium in which the signal leaves, n 2 is the refractive index of the medium in which the signal enters, Ω 1 is the incident solid angle, and Ω 2 is the departing solid angle.
The OBS optical transmission structure consists of N t -faceted LED arrays, including a top LED array and N t 1 -inclined side LED arrays, as shown in Figure 2a. The side LED arrays are deflected at a specific angle, and the deflection angle β denotes the angle between the normal light emission from the side LED arrays and that from the top LED array. Since the transmission distance is larger than the LED interval, the LED array can be regarded as a point light source [24]. The optical emission array architecture is modeled as shown in Figure 2b. Given a coordinate system O - XYZ , it undergoes consecutive counterclockwise rotations around its X , Y , and Z axes at angles β 1 , β 2 , and β 3 , respectively, to align with the new coordinate system O - X Y Z . The mathematical relationship describing the position of point ( x , y , z ) in both the coordinate systems is as follows:
x y z = 1 0 0 0 cos β 1 sin β 1 0 sin β 1 cos β 1 cos β 2 0 sin β 2 0 1 0 sin β 2 0 cos β 2 cos β 3 sin β 3 0 sin β 3 cos β 3 0 0 0 1 x y z

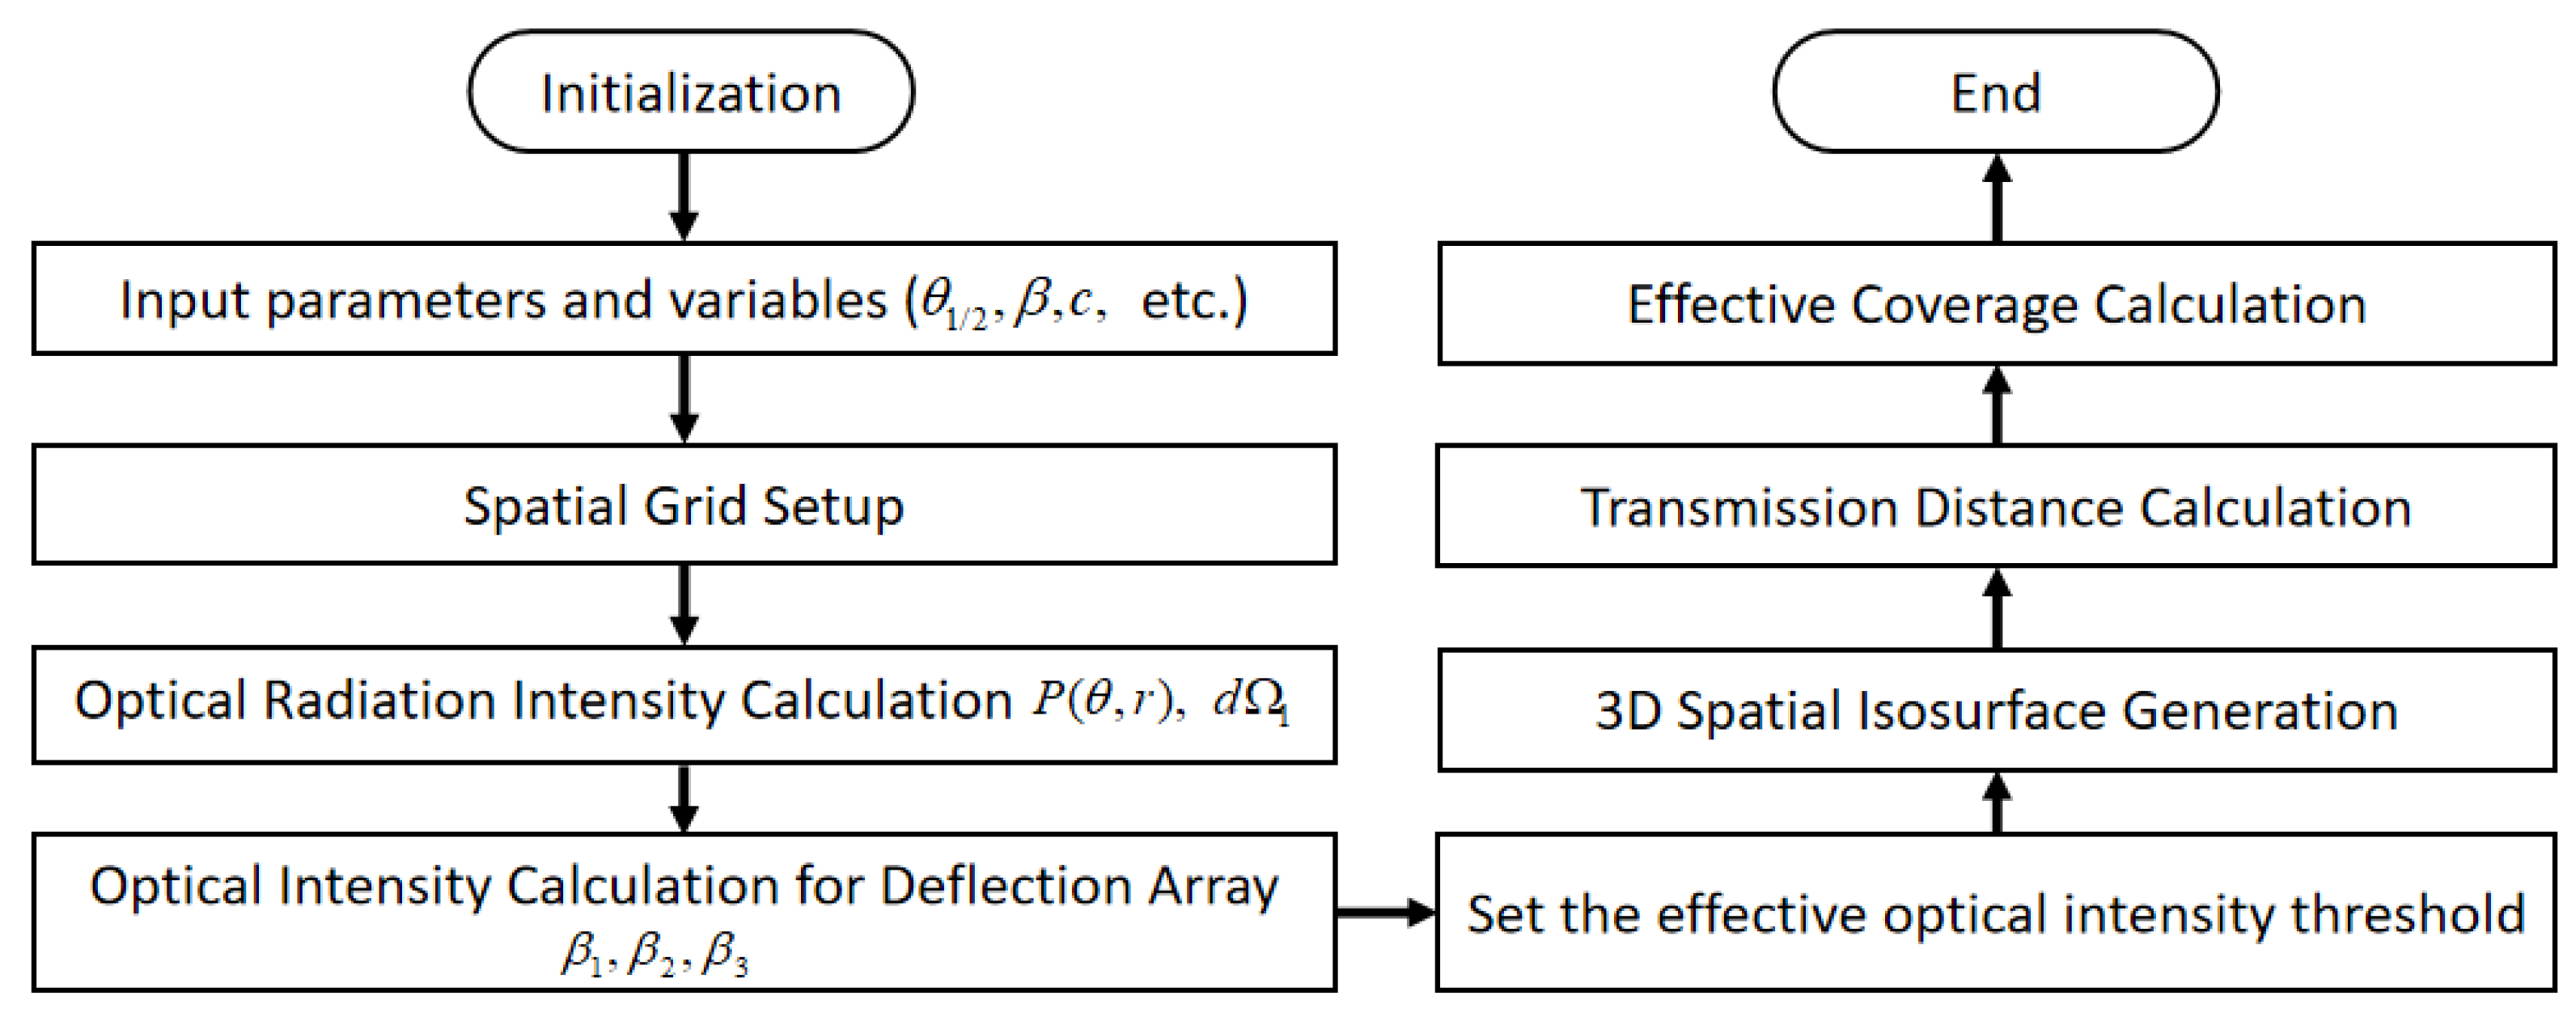
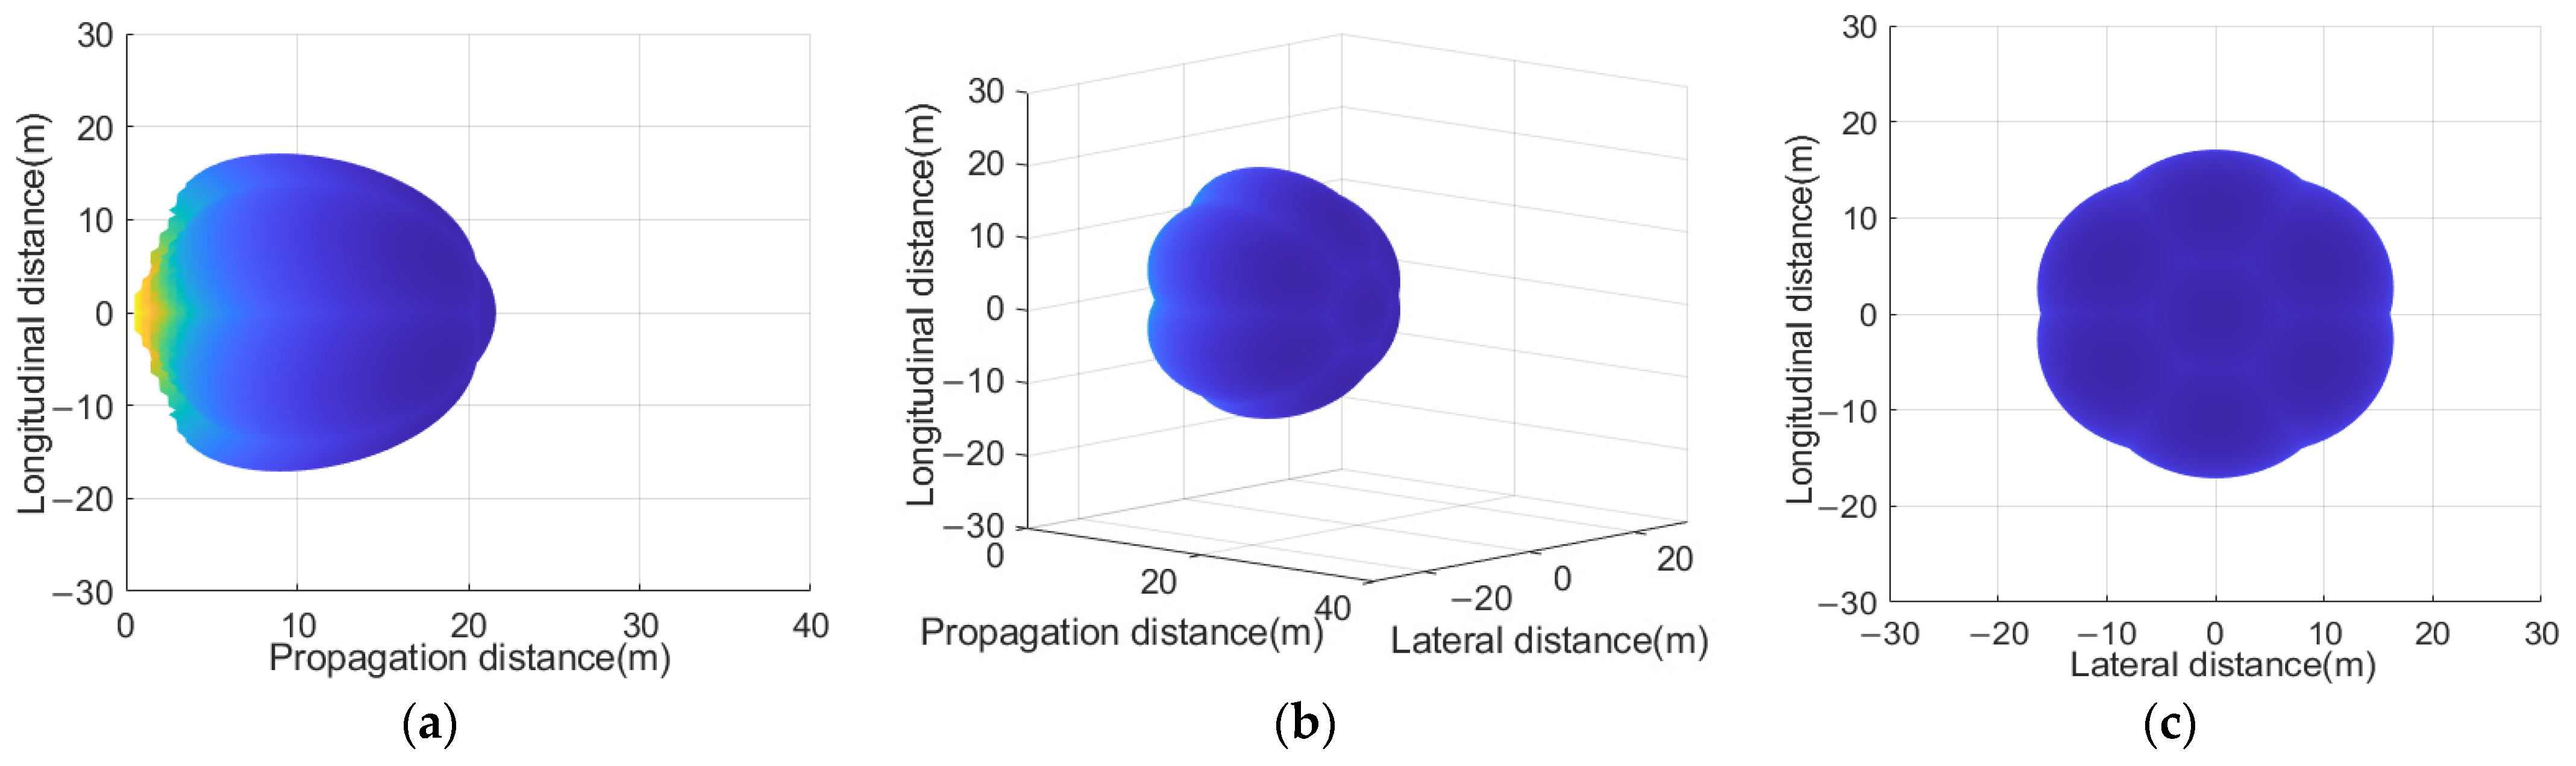
2.3. Method for Modeling the Three-Dimensional Spatial Coverage of OBS Beams

Figure 3 illustrates the flowchart for modeling the three-dimensional spatial coverage of OBS beams. The process begins by initializing input parameters, including the emission half-angle, array deflection angle, attenuation coefficient, etc. Following the setup of a three-dimensional spatial coordinate grid, the space-transmitted optical radiation intensity is calculated using Equation (3). Then, calculate the optical intensity of the deflection array by adjusting the angles of the multi-faceted LED array. Next, an effective optical intensity threshold is set to visualize the beam’s spatial coverage through a three-dimensional isosurface. The transmission distance is calculated to derive the transmission distribution standard deviation, and finally, the effective coverage volume is obtained.

3. MOPSO Optimization

The MOPSO algorithm addresses the complex optimization challenges involving multiple objective functions through meticulous optimization of the emission half-angle of LED sources and their array layout for the OBS [25]. This strategy primarily focuses on enhancing two performance indicators: first, expanding the spatial coverage of the OBS to comprehensively evaluate its service area; and second, minimizing the transmission distance distribution standard deviation to achieve uniformity in the beam intensity distribution. The expressions are defined as follows:
f 1 ( β , θ 1 / 2 ) = Cov ( β , θ 1 / 2 )
f 2 ( β , θ 1 / 2 ) = σ d i s t ( β , θ 1 / 2 )
where Cov ( β , θ 1 / 2 ) denotes the size of the effective coverage volume by the OBS as determined by β , θ 1 / 2 . The standard deviation of the effective transmission distance distribution is given by the following:
σ d i s t = 1 n i = 1 N ( d i s t i μ d i s t ) 2
d i s t i represents the i -th element of the effective transmission distance vector within the spatial grid, n is the number of elements in the d i s t vector, μ d i s t and is the mean of the d i s t vector. The spatial coverage Cov ( β , θ 1 / 2 ) is calculated using the following formula:
Cov ( β , θ 1 / 2 ) = Δ V × i j k C i j k > E
Δ V refers to the volume of each voxel in the spatial grid, C i j k represents the distribution of optical power values in three-dimensional space, and E is the predefined light intensity reception threshold. i , j , k indices correspond to the position of each voxel in the three-dimensional grid.
The velocity update formula is
V [ i ] = W × V [ i ] + R 1 × ( P B E S T [ i ] P O P [ i ] ) + R 2 × ( R E P [ h ] P O P [ i ] )
The position update formula is
P O P [ i ] = P O P [ i ] + V E L [ i ]
where W is the inertia weight coefficient that controls the degree to which particles maintain their previous velocity. P B E S T [ i ] represents the particle’s own historical best position and R 1 × ( P B E S T [ i ] P O P [ i ] ) is the self-cognition component affecting the degree to which the particle approaches its own historical best position. R E P [ h ] represents the global leader and R 2 × ( R E P [ h ] P O P [ i ] ) is the social cognition component affecting the degree to which the particle approaches the global best position. R 1 and R 2 are random numbers within the range [0, 1].
The pseudo-code of the MOPSO algorithm is presented in Algorithm 1.
Algorithm 1. The MOPSO algorithm pseudo-code.
Initialize
Randomly generate each particle’s velocity and position
Evaluate the fitness value of each particle
Fill the P B E S T [ i ] of each particle with its current position
for i t = 1: MaxIt
 for i = 1: N
  Update particle velocity V [ i ]
  Update particle position P O P [ i ]
  Update P B E S T
 end for
 Add non-dominated particles to repository
 Keep non-dominated members in the repository
 if non-dominated particles number > archive size
  Updating the elite solution set, delete the extra repository members
 end if
end for

4. Results and Discussion

The OBS architecture considers the independent beam emission of a polyhedral array, enabling it to serve multiple users while conserving energy [26]. In this context, the light intensity at convergence points is not regarded as additive [20,21]. For performance analysis, a heptahedral structure was simulated, consisting of one top surface and six side surfaces. The commonly used array configurations were compared with the optimized parameters. The typical array configurations include emission half-angles of 30°, 60°, or 80° and lateral deflection angles of 30° or 45°. These configurations are adopted as typical values in relevant experimental and theoretical studies [22,27]. The LED radiant power value used in the modeling selected commercial LED (LXMLPB01-0023) has a power of 1.126 W [11]. Table 1 lists the parameter settings of the underwater OBS model and the MOPSO algorithm.
Figure 4 illustrates the effect of different combinations of θ 1 / 2 and β on the spatial coverage volume (f1) and transmission uniformity (f2, standard deviation of transmission distance) in the multi-faceted OBS system under different seawater conditions. Different colors and symbols denote specific parameter combinations and their corresponding performance outcomes. The horizontal axis represents f2, where lower values indicate better signal distribution uniformity, while the vertical axis represents f1, where higher absolute values reflect a larger spatial coverage.
The Pareto solution set depicted in Figure 4 represents the trade-offs between spatial coverage and transmission uniformity achieved through our optimization process. Each point within this set signifies a combination of θ 1 / 2 and β , where no single objective (either f1 or f2) can be improved without degrading the other. The results indicate that the configuration parameters optimized by PSO outperform typical configurations in terms of both the standard deviation of transmission distance and spatial coverage volume under different seawater conditions, providing multiple parameter combinations and greater flexibility for system design. As shown in Table 2 and Table 3, the deflection angle values in the PSO-optimized solutions in different seawater are mostly concentrated between 57° and 65°, with a narrow fluctuation range. This indicates that regardless of whether the heptahedral framework prioritizes transmission uniformity or spatial coverage volume, the optimal deflection angle is around 60°. Therefore, during the design optimization process, the emission power half-angle can be prioritized for adjustment, while the deflection angle can be maintained at a fixed value to simplify the design.
As shown in Table 2, a larger emission half-angle (e.g., 80°) corresponds to a lower degree of transmission distance dispersion (with a standard deviation of 0.2657), reflecting higher signal distribution uniformity. However, this is accompanied by a smaller spatial coverage volume (15,487 m3). This shows that a larger transmission angle is suitable for applications with higher requirements for uniformity. Conversely, as the emission half-angle decreases (e.g., 21°), the spatial coverage volume increases significantly (37,041 m3), but the uniformity of transmission decreases markedly (with the standard deviation rising to 5.3526). Therefore, smaller beam divergence angles are better suited for applications requiring larger coverage areas.
Figure 5 and Figure 6 illustrate the heptagonal architecture base station three-dimensional beam distributions of the typical configuration ( θ 1 / 2 = 60°, ϕ = 30°) and the PSO elite set configuration ( θ 1 / 2 = 52°, ϕ = 59°) in pure seawater, respectively. Under the same transmission power condition, the PSO-optimized beam demonstrates superior radial and longitudinal propagation distances compared to the conventional configuration. After optimization, the transmission distribution standard deviation decreases from 1.7229 to 0.9746, representing a reduction of approximately 43.5%. Simultaneously, the spatial coverage volume increases from 13,650 m3 to 22,543 m3, reflecting an enhancement of approximately 65%. These findings indicate that the optimized configuration offers significant advantages in achieving broader spatial coverage and more uniform beam distribution.
The solution set generated by particle swarm optimization provides flexibility for system design. By configuring the emission half-angle and deflection angle, transmission uniformity and coverage can be balanced in different application scenarios to meet the comprehensive demand for signal distribution and spatial coverage. In addition, the tendency of the deflection angle to a fixed value indicates that the optimum deflection angle can be determined according to the optimization results in the design of a multi-faceted OBS, thus simplifying the design process. This paper provides guidance for the emission and deflection parameters of a multi-faceted OBS, which not only meets the requirements of large coverage but also takes into account the performance requirements of high uniformity scenarios.

5. Conclusions

This paper proposes a three-dimensional spatial beam coverage optimization scheme based on a multi-faceted LED array to enhance the uniformity and coverage of spatial distribution in a UWOC OBS. By adjusting the deflection angle of the LED array and optimizing the emission angle parameters, the proposed scheme achieves a uniform distribution of signal intensity while expanding the coverage. Three-dimensional spatial coverage visualization modeling of the OBS beam is performed to intuitively demonstrate the coverage performance. This paper employs a MOPSO algorithm to achieve a balance between maximizing the coverage and minimizing the transmission distribution standard deviation. The impact of LED array parameters, such as deflection angle and emission angle, on the spatial coverage performance of OBSs in seawater is analyzed. The coverage characteristics of the LED array were optimized through the Pareto solution set, providing configuration support for diverse requirements.
Throughout the paper, we focused on a homogeneous medium environment, which allows for a clear understanding of the fundamental relationships between parameters such as deflection angles, emission angles, and coverage performance. In future work, this study will be extended to non-uniform and dynamic environments to address the challenges of complex underwater conditions.

Author Contributions

Conceptualization, J.S. and J.A.; methodology, J.S.; software, J.S.; validation, C.M. and X.T.; formal analysis, J.S.; investigation, H.G.; resources, J.A.; data curation, C.M.; writing—original draft preparation, J.S.; writing—review and editing, H.G. and X.T.; visualization, J.S.; supervision, J.A.; project administration, J.A.; funding acquisition, J.A. All authors have read and agreed to the published version of the manuscript.

Funding

This research was funded by the Innovation Project of GUET Graduate Education, grant number 2022YCXB04.

Institutional Review Board Statement

Not applicable.

Informed Consent Statement

Not applicable.

Data Availability Statement

The original contributions presented in this study are included in the article; further inquiries can be directed to the corresponding author.

Conflicts of Interest

The authors declare no conflicts of interest.

References

  1. Schill, F.; Bahr, A.; Martinoli, A. Vertex: A new distributed underwater robotic platform for environmental monitoring. In Distributed Autonomous Robotic Systems: The 13th International Symposium; Springer: Cham, Switzerland, 2018; pp. 679–693. [Google Scholar] [CrossRef]
  2. González-García, J.; Gómez-Espinosa, A.; Cuan-Urquizo, E.; García-Valdovinos, L.G.; Salgado-Jiménez, T.; Escobedo Cabello, J.A. Autonomous underwater vehicles: Localization, navigation, and communication for collaborative missions. Appl. Sci. 2020, 10, 1256. [Google Scholar] [CrossRef]
  3. Hoeher, P.A.; Sticklus, J.; Harlakin, A. Underwater optical wireless communications in swarm robotics: A tutorial. IEEE Commun. Surv. Tutor. 2021, 23, 2630–2659. [Google Scholar] [CrossRef]
  4. Connor, J.; Champion, B.; Joordens, M.A. Current algorithms, communication methods and designs for underwater swarm robotics: A review. IEEE Sens. J. 2020, 21, 153–169. [Google Scholar] [CrossRef]
  5. Kaushal, H.; Kaddoum, G. Underwater optical wireless communication. IEEE Access 2016, 4, 1518–1547. [Google Scholar] [CrossRef]
  6. Saeed, N.; Celik, A.; Al-Naffouri, T.Y.; Alouini, M.-S. Underwater optical wireless communications, networking, and localization: A survey. Ad Hoc Netw. 2019, 94, 101935. [Google Scholar] [CrossRef]
  7. Pontbriand, C.; Farr, N.; Hansen, J.; Kinsey, J.C.; Pelletier, L.-P.; Ware, J.; Fourie, D. Wireless data harvesting using the AUV Sentry and WHOI optical modem. In Proceedings of the OCEANS 2015-MTS/IEEE Washington, Washington, DC, USA, 19–22 October 2015; pp. 1–6. [Google Scholar] [CrossRef]
  8. Sabril, S.; Jasman, F.; Hassan, W.H.W.; Mutalip, Z.A.; Mohd-Mokhtar, R.; Hassan, Z. The Effect of Medium Inhomogeneity in Modeling Underwater Optical Wireless Communication. J. Commun. 2021, 16, 386–393. [Google Scholar] [CrossRef]
  9. Lv, Z.; He, G.; Qiu, C.; Liu, Z. Investigation of underwater wireless optical communications links with surface currents and tides for oceanic signal transmission. IEEE Photonics J. 2021, 13, 1–8. [Google Scholar] [CrossRef]
  10. Nasser, A.G.; Ali, M.A.A. Performance of LED for line-of-sight (LoS) underwater wireless optical communication system. J. Opt. Commun. 2024, 44, s1355–s1363. [Google Scholar] [CrossRef]
  11. Yang, X.; Tong, Z.; Zhang, H.; Zhang, Y.; Dai, Y.; Zhang, C.; Chen, X.; Xu, J. 7-M/130-Mbps LED-to-LED underwater wireless optical communication based on arrays of series-connected LEDs and a coaxial lens group. J. Light. Technol. 2022, 40, 5901–5909. [Google Scholar] [CrossRef]
  12. Zhou, H.; Zhang, M.; Wang, X.; Ren, X. Design and implementation of more than 50m real-time underwater wireless optical communication system. J. Light. Technol. 2022, 40, 3654–3668. [Google Scholar] [CrossRef]
  13. Wang, L.; Qi, Z.; Liu, P.; Hu, F.; Li, J.; Wang, Y. Underwater wireless video communication using blue light. J. Light. Technol. 2023, 41, 5951–5957. [Google Scholar] [CrossRef]
  14. Wang, P.; Li, C.; Xu, Z. A cost-efficient real-time 25 Mb/s system for LED-UOWC: Design, channel coding, FPGA implementation, and characterization. J. Light. Technol. 2018, 36, 2627–2637. [Google Scholar] [CrossRef]
  15. Li, J.; Yang, B.; Ye, D.; Wang, L.; Fu, K.; Piao, J.; Wang, Y. A real-time, full-duplex system for underwater wireless optical communication: Hardware structure and optical link model. IEEE Access 2020, 8, 109372–109387. [Google Scholar] [CrossRef]
  16. Han, B.; Zhao, W.; Zheng, Y.; Meng, J.; Wang, T.; Han, Y.; Wang, W.; Su, Y.; Duan, T.; Xie, X. Experimental demonstration of quasi-omni-directional transmitter for underwater wireless optical communication based on blue LED array and freeform lens. Opt. Commun. 2019, 434, 184–190. [Google Scholar] [CrossRef]
  17. Williams, A.J.; Laycock, L.L.; Griffith, M.S.; McCarthy, A.G.; Rowe, D.P. Acquisition and tracking for underwater optical communications. In Proceedings of the Advanced Free-Space Optical Communication Techniques and Applications III, Warsaw, Poland, 11–14 September 2017; pp. 44–54. [Google Scholar] [CrossRef]
  18. McRaven, C.; Pelletier, L.-P.; Ware, J.; Gardner, A.; Farr, N.; Collins, J.; Purcell, M. Wireless retrieval of high-rate ocean bottom seismograph data and time synchronization using the WHOI optical modem and REMUS AUV. In Proceedings of the OCEANS 2019-Marseille, Marseille, France, 17–20 June 2019; pp. 1–5. [Google Scholar] [CrossRef]
  19. Barroso, A.R.F.; Baiden, G.; Johnson, J. Teleoperation of mining equipment using optical wireless communications. In Proceedings of the 2015 Seventh International Conference on Ubiquitous and Future Networks, Sapporo, Japan, 7–10 July 2015; pp. 727–733. [Google Scholar] [CrossRef]
  20. Tong, Z.; Yang, X.; Chen, X.; Zhang, H.; Zhang, Y.; Zou, H.; Zhao, L.; Xu, J. Quasi-omnidirectional transmitter for underwater wireless optical communication systems using a prismatic array of three high-power blue LED modules. Opt. Express 2021, 29, 20262–20274. [Google Scholar] [CrossRef]
  21. Zhang, H.; Gao, Y.; Tong, Z.; Yang, X.; Zhang, Y.; Zhang, C.; Xu, J. Omnidirectional optical communication system designed for underwater swarm robotics. Opt. Express 2023, 31, 18630–18644. [Google Scholar] [CrossRef]
  22. Chen, Y.; Zhang, L.; Ling, Y. New approach for designing an underwater free-space optical communication system. Front. Mar. Sci. 2022, 9, 971559. [Google Scholar] [CrossRef]
  23. Doniec, M.; Angermann, M.; Rus, D. An end-to-end signal strength model for underwater optical communications. IEEE J. Ocean. Eng. 2013, 38, 743–757. [Google Scholar] [CrossRef]
  24. Moreno, I.; Sun, C.-C.; Ivanov, R. Far-field condition for light-emitting diode arrays. Appl. Opt. 2009, 48, 1190–1197. [Google Scholar] [CrossRef]
  25. Coello, C.A.C.; Pulido, G.T.; Lechuga, M.S. Handling multiple objectives with particle swarm optimization. IEEE Trans. Evol. Comput. 2004, 8, 256–279. [Google Scholar] [CrossRef]
  26. Yuksel, M.; Akella, J.; Kalyanaraman, S.; Dutta, P. Free-space-optical mobile ad hoc networks: Auto-configurable building blocks. Wirel. Netw. 2009, 15, 295–312. [Google Scholar] [CrossRef]
  27. Huang, Q.; Wen, W.; Liu, M.; Du, P.; Chen, C. Energy-Efficient Unmanned Aerial Vehicle-Aided Visible Light Communication with an Angle Diversity Transmitter for Joint Emergency Illumination and Communication. Sensors 2023, 23, 7886. [Google Scholar] [CrossRef]
Figure 1. Schematic diagram of an underwater OBS communication scene.
Photonics 12 00004 g001
Figure 2. (a) Multi-faceted structure of the OBS concept; (b) optical emission distribution schematic diagram of the OBS.
Photonics 12 00004 g002
Figure 3. Flowchart for the three-dimensional spatial coverage modeling.
Photonics 12 00004 g003
Figure 4. Performance analysis of the PSO optimized configuration and typical configuration parameters. (a) Pure seawater environment; (b) clear seawater environment. Note: The Y-axis denotes the spatial coverage volume of the OBS beam, which is positive by definition. These values are inverted to reflect the minimization goal in the optimization process and are displayed as negative values.
Photonics 12 00004 g004
Figure 5. Spatial coverage of the heptahedral OBS emission with a typical configuration ( θ 1 / 2 = 60° and ϕ = 30°) in a pure seawater environment. The transmission distribution standard deviation is 1.7229 and the spatial coverage volume of the beam is 13,650 m3. (a) Front view; (b) side view; (c) top view.
Photonics 12 00004 g005
Figure 6. Spatial coverage of the heptahedral OBS emission with a Pareto solution set configuration ( θ 1 / 2 = 52° and ϕ = 59°) in a pure seawater environment. The transmission distribution standard deviation is 0.9746 and the spatial coverage volume of the beam is 22,543 m3. (a) Front view; (b) side view; (c) top view.
Photonics 12 00004 g006
Table 1. Underwater OBS model parameter setting and parameter settings in the MOPSO algorithm.
ParametersSymbolValue
Number of LEDs in an LED array N l 10
Refractive index of air n air 1
Refractive index of glass n glass 1.5
Refractive index of water n water 1.33
Diameter of the receiving apertured50 mm
Minimum light intensity reception thresholdE−41 dBm
Attenuation coefficient of pure seawater c pure 0.056 m−1
Attenuation coefficient of clear seawater c clear 0.151 m−1
Maximum number of iterations MaxIt 50
Population size of particles N 20
Archive size A 8
Inertia weight coefficient W 0.9
Table 2. PSO solution set parameters and performance in pure seawater.
Emission   Power   Half - Angle   θ 1 / 2 (°) Array   Deflection   Angle   β (°)Transmission Distribution Standard DeviationSpatial Coverage Volume of the Beam (m3)
80570.265715,487
66600.499518,393
59610.688120,427
52590.974622,543
47581.232924,495
41591.690027,597
32602.734532,850
21595.352637,041
Table 3. PSO solution set parameters and performance in clear seawater.
Emission   Power   Half - Angle   θ 1 / 2 (°) Array   Deflection   Angle   β (°)Transmission Distribution Standard DeviationSpatial Coverage Volume of the Beam (m3)
80570.15694321
71630.25464742
61610.35365280
53610.46645780
46600.61816298
42620.81436751
31651.47207767
22612.54668269
Disclaimer/Publisher’s Note: The statements, opinions and data contained in all publications are solely those of the individual author(s) and contributor(s) and not of MDPI and/or the editor(s). MDPI and/or the editor(s) disclaim responsibility for any injury to people or property resulting from any ideas, methods, instructions or products referred to in the content.

