Abstract
A novel chitosan (CS) functionalized optical fiber sensor with a bullet-shaped hollow cavity was proposed in this work for the trace concentration of Pb2+ ion detection in the water environment. The sensor is an optical fiber Mach–Zehnder interferometer (MZI), which consists of a sequentially spliced bullet-shaped hollow-core fiber (HCF), thin-core fiber, and another piece of spliced bullet-shaped HCF. The hollow-core fiber is caused to collapse by adjusting the amount of discharge to form a tapered hollow cavity with asymmetric end faces. The bullet-like hollow cavities act as beam expanders and couplers for optical fiber sensors, which were symmetrically spliced at both ends of a section of thin core fiber. The simulation and experiments show that the bullet-like hollow-core tapered cavity excites more cladding modes and is more sensitive to variation in the external environment than the planar and spherical cavities. The ion-imprinted chitosan (IIP-CS) film was fabricated with Pb2+ ion as a template and uniformly coated on the surface for specific recognition of Pb2+. Experimental verification confirms that the developed sensor can achieve high-sensitivity Pb2+ ion detection, with a sensitivity of up to −12.68 pm/ppm and a minimum Pb2+ ion detection concentration of 5.44 ppb Meanwhile, the sensor shows excellent selectivity, repeatability, and stability in the ion detection process, which has huge potential in the direction of heavy metal ion detection in the future.
1. Introduction
The problem of heavy metal pollution has become increasingly prominent in the water environment, which seriously threatens human health. Mining, chemical wastewater, pesticides, and factory waste are the main causes of heavy metal pollution, which poses a huge threat to the safety of the water environment [1,2,3]. Considered one of the most toxic metals, lead (Pb) is not on the list of metallic elements necessary for humans but is an essential raw material in many industrialized productions [4]. Pb2+ ions can easily enter the human body through a variety of pathways, substantially affecting human health, damaging numerous systems like the immune system, reproductive system, and central nervous system, and even killing one [5,6]. However, the accurate detection of the Pb2+ ion concentration in the phrase still remains a problem to be solved [7].
There are several traditional methods for the detection of heavy metal ions, including atomic absorption spectroscopy (AAS) [8,9,10,11], spectrophotometry [12,13,14], inductively coupled plasma mass spectrometry (ICP-MS) [15,16,17], electrochemical techniques [18], and so on. It takes expensive detection instruments, complicated sample pretreatment, and a long detection time for the AAS and ICP-MS methods. It is difficult to distinguish heavy metal ions with similar structures and radii for the spectrophotometry method, which results in low detection selectivity. Electrochemical methods may lead to secondary contamination during the detection process. Compared with traditional detection technologies, optical fiber sensors have the advantages of miniaturization, easy integration, and resistance to electromagnetic interference [19,20,21].
Optical fiber sensors have significant superiority in heavy metal ion detection. Firstly, since the optical fiber itself is made of quartz, it has strong anti-interference and anti-corrosion properties in complex water environments compared to other traditional electronic sensors [22]. Secondly, optical fiber sensors are mainly wavelength sensors with high sensitivity, whose demodulation process is based on the wavelength variation of the optical signal [23]. Finally, the combination of optical fiber sensors and materials enriches the physical quantities that can be detected by the sensors and significantly expands the application areas of optical fiber sensors [24]. Functionalization of the material realizes the specific detection of heavy metal ions by the sensor, mainly based on the fact that the material can realize the specific adsorption of heavy metal ions after being functionalized. Studying the sensing performance of sensors contributes to enhancing the adsorption of heavy metal ions by the sensors.
In recent years, there have been increasing methods to detect heavy metal ions by materials in combination with optical fiber sensors. Cai et al. prepared optical fiber probes with carbon quantum dots on the end surfaces of multimode fibers for Fe3+ detection [25], and effective identification of Fe3+ ion was achieved in the concentration ranges from 0 μM to 250 μM. Souvik Ghosh et al. put forward a Pb2+ sensor based on long-period grating (LPG) with cross-linked CS [26], nitrogen-doped graphene oxide, and polyacrylic acid coated on the surface. Other than coatings of heavy metal ion-sensitive materials directly on the surface of the fiber sensor, Cai et al. used the surface plasmon resonance (SPR) to enhance the sensing performance of the optical fiber sensor by coating a gold film on the surface of the tilted fiber Bragg grating (TFBG) [27]. And the Cd2+ ion sensing was realized by coating with the bacterial biofilm of Acinetobacter sp on the surface of the Au film. Though the detection of heavy metal ions was achieved by combining optical fiber with selective materials, the fiber grating, SPR, and bacterial biofilm also suffer from high cost, complex processes, and or secondary pollution.
To solve the above problems, an optical fiber sensor with a novel bullet-like tapered hollow cavity was proposed for selective recognition of trace concentration Pb2+ ion based on functionalized CS. The bullet-like tapered hollow cavity optical fiber sensors fantastically utilize the air hole characteristics of hollow-core fibers that are easily collapsed. By changing the shape and size of the hollow cavity, the higher-order cladding modes can be maximally stimulated, which enhances the interaction between the light and the external environment. And due to the asymmetry of the end face of the bullet-like tapered hollow cavity, the reflection of light is reduced, greatly increasing the utilization of the light source. The experimental results showed that the sensitivity of the sensor for Pb2+ ion detection was −12.68 pm/ppm, and the detection limit was 5.44 ppb. In addition to high sensitivity, the sensor also exhibits excellent repeatability, stability, and specificity. The simple manufacturing process, compact structure, and high sensitivity make the sensor suitable for trace Pb2+ detection in complex water environments.
2. Sensor Principle and Preparation
2.1. Sensing Principle
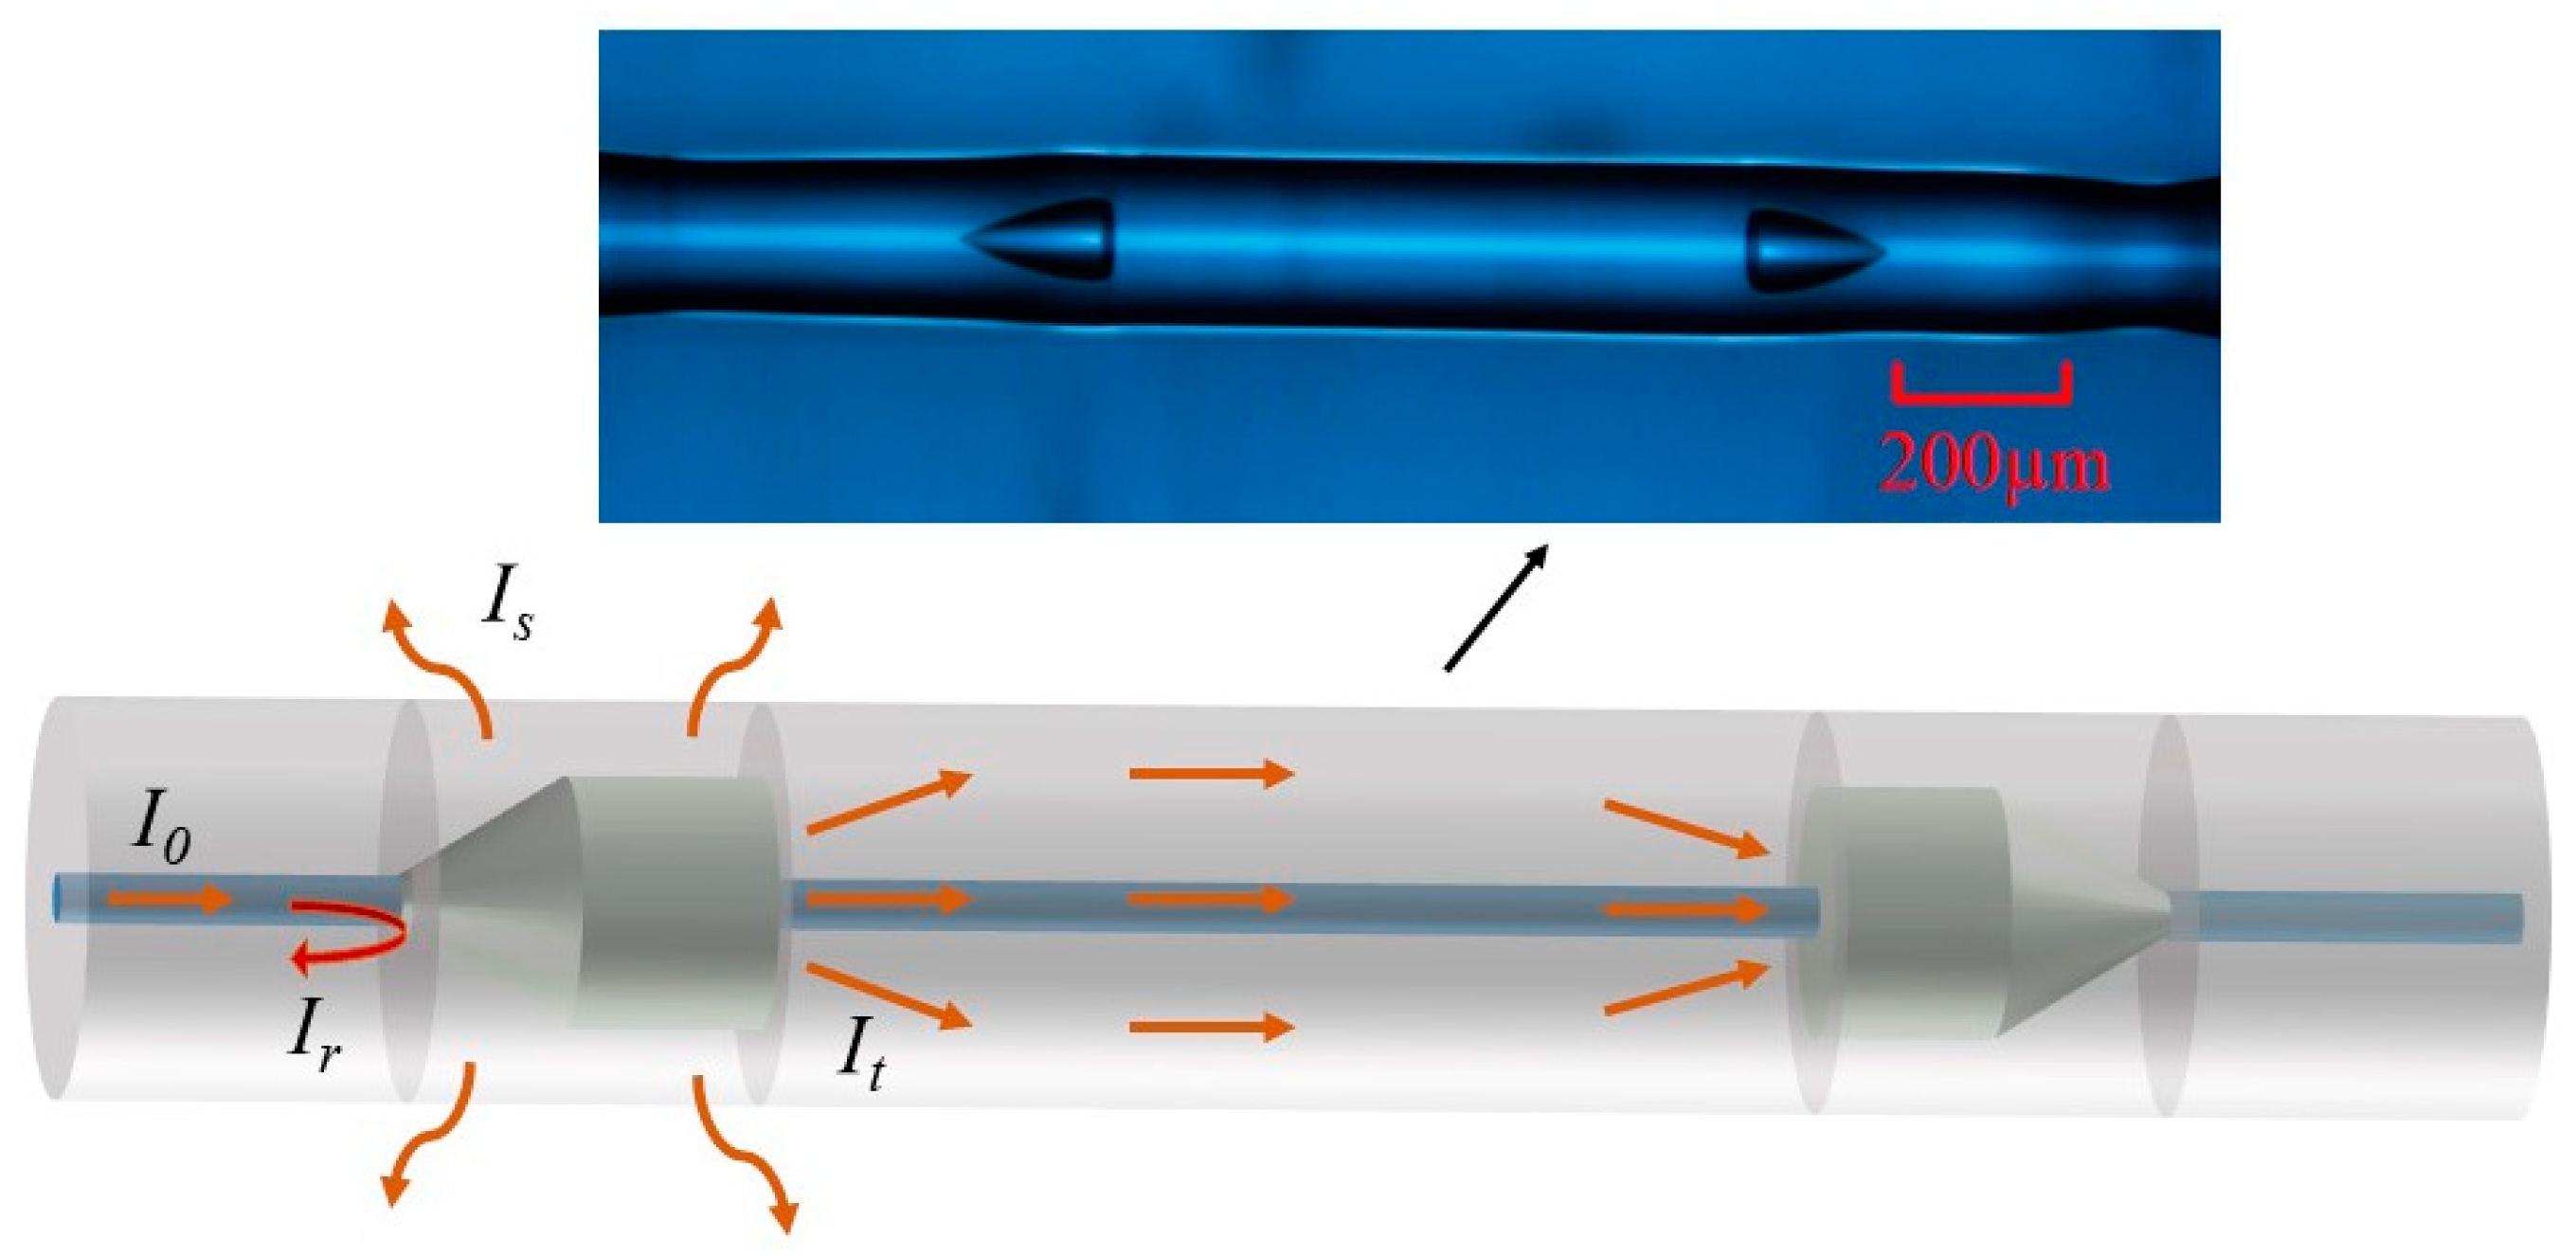
The conventional optical fibers are optical waveguides with a small difference in RI between the core and cladding, and the RI of the cladding is smaller than that of the core. A novel structure was proposed, as shown in Figure 1. The reflection, scattering, and mode diffusion occur when the introduced light meets the discontinuity of the waveguide medium.
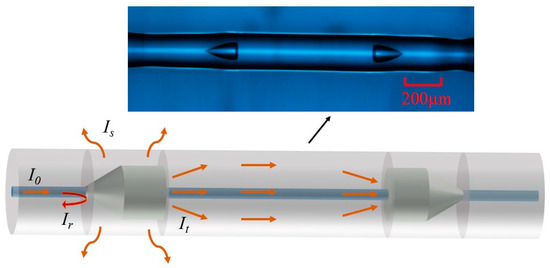
Figure 1.
The schematic diagram of fiber axial coupling.
The intensity of light conforms to the law of conservation of energy,
where is the total intensity of the input light, , , and are the intensities after reflection, scattering, and transmission caused by the discontinuity, respectively.
The energy transmitted through the discontinuity produces a cladding mode and the intensity of is divided into two parts: the core part and the cladding part .
The energy distribution of the interfering field can be expressed as
where is the phase difference between the core mode and the cladding mode of the light, and the phase difference can be defined as
where is the wavelength of the propagating beam, is the interference length, and is the difference between the effective RI of the core and the m-th order cladding mode.
where is the effective RI of the core and is the effective RI of the m-th order cladding mode.
According to the interference condition, when the phase transmission condition was satisfied, the corresponding interference wavelength can be expressed as
where is an interfering wavelength of m-th order. The interferometric length and effective RI difference of the interferometer will change with the temperature, RI, and pressure of the external environment. The interferometric wavelength will also vary with those parameters. This is the main reason MZI is able to perceive the variation of the external world. In addition to the interference wavelength, the free spectral range of the spectrum is also related to the interferometric length and the effective RI difference of the interferometer.
The expression for the free spectral range (FSR) can be written as
The majority of MZI optical fiber sensors have a large free spectral range. Therefore, the interferometric wavelength usually be used as the demodulation signal in the sensing system.
2.2. Preparation of the Materials and Sensor
The optical fibers used in this work are standard single-mode fiber (SMF) (8.2/125 µm), HCF (50/125 µm), and TCF (5/125 µm), and all optical fibers were purchased from Wuhan Changfei Optical Cable Co. All reagents, such as CS, lead nitrate (Pb(NO3)2), epichlorohydrin (ECH), EDTA, copper chloride (CuCl2), chromium chloride (CrCl3), mercuric chloride (HgCl2), and cadmium chloride (CdCl2), were purchased from Macklin, and all reagents were analytically pure.
2.3. Preparation of IIP-CS
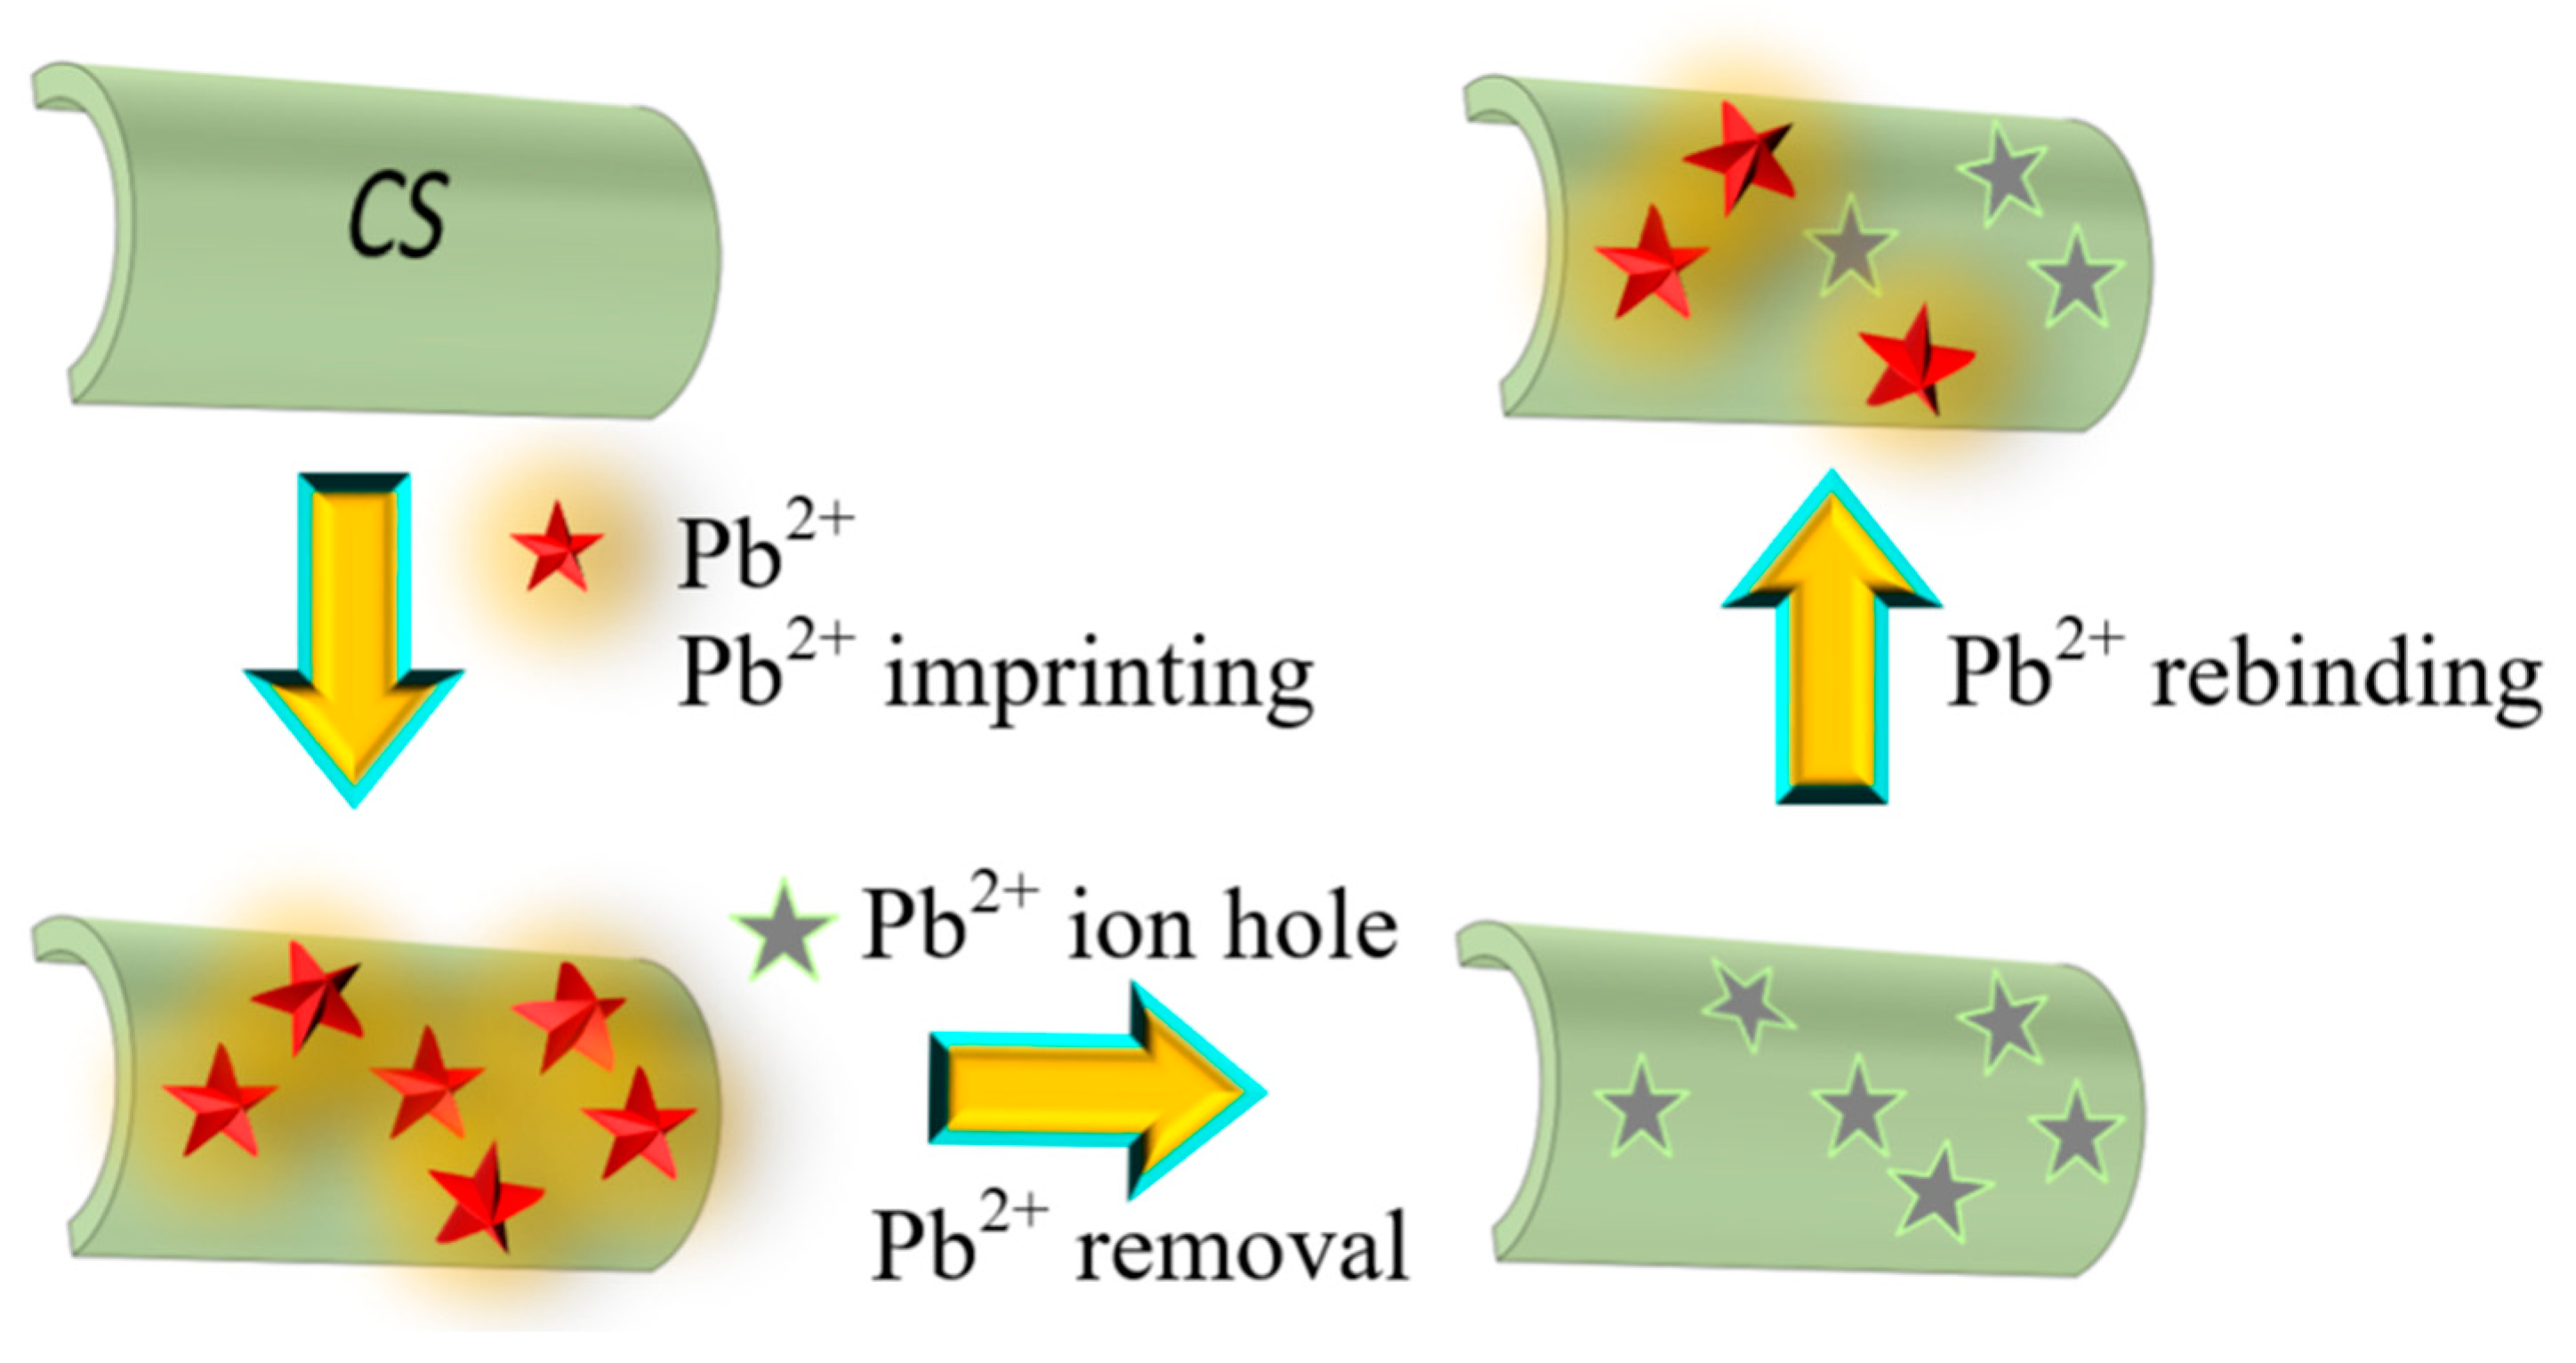
CS is an amino polysaccharide and is widely found in shrimp and crab shells. The main composition of the IIP-CS can be classified into three parts: CS (substrate), ECH (modifier), and Pb2+ (imprint template ions). The main principle of ion imprinting is shown in Figure 2. Firstly, 3 g CS was dissolved in a weak acid solution (5% glacial acetic acid solution, 100 mL), and then the template ions were added to the solution. The hydroxyl and amino groups of CS will form complexes with metal cations, and the chelation of such metal complexes is specific to specific targets. Moreover, in an acidic environment, CS is negatively charged and can bind to metal cations through electrostatic interactions. Subsequently, the addition of ECH produces a cross-linking reaction that transforms the linear polymer into a native (three-dimensional network structure) polymer, which increases the mechanical and thermal stability of CS. The ions were then washed off to form cavities using the eluent EDTA, and when cavities encounter the metal ions again, they will specifically adsorb the imprinted ions, which also realizes the specific recognition function of the sensor for heavy metal ions.
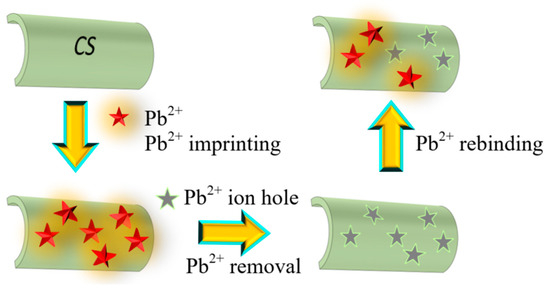
Figure 2.
Schematic diagram of ion imprinting and specific adsorption principle.
2.4. Fabrication of the MZI Optical Fiber Sensor
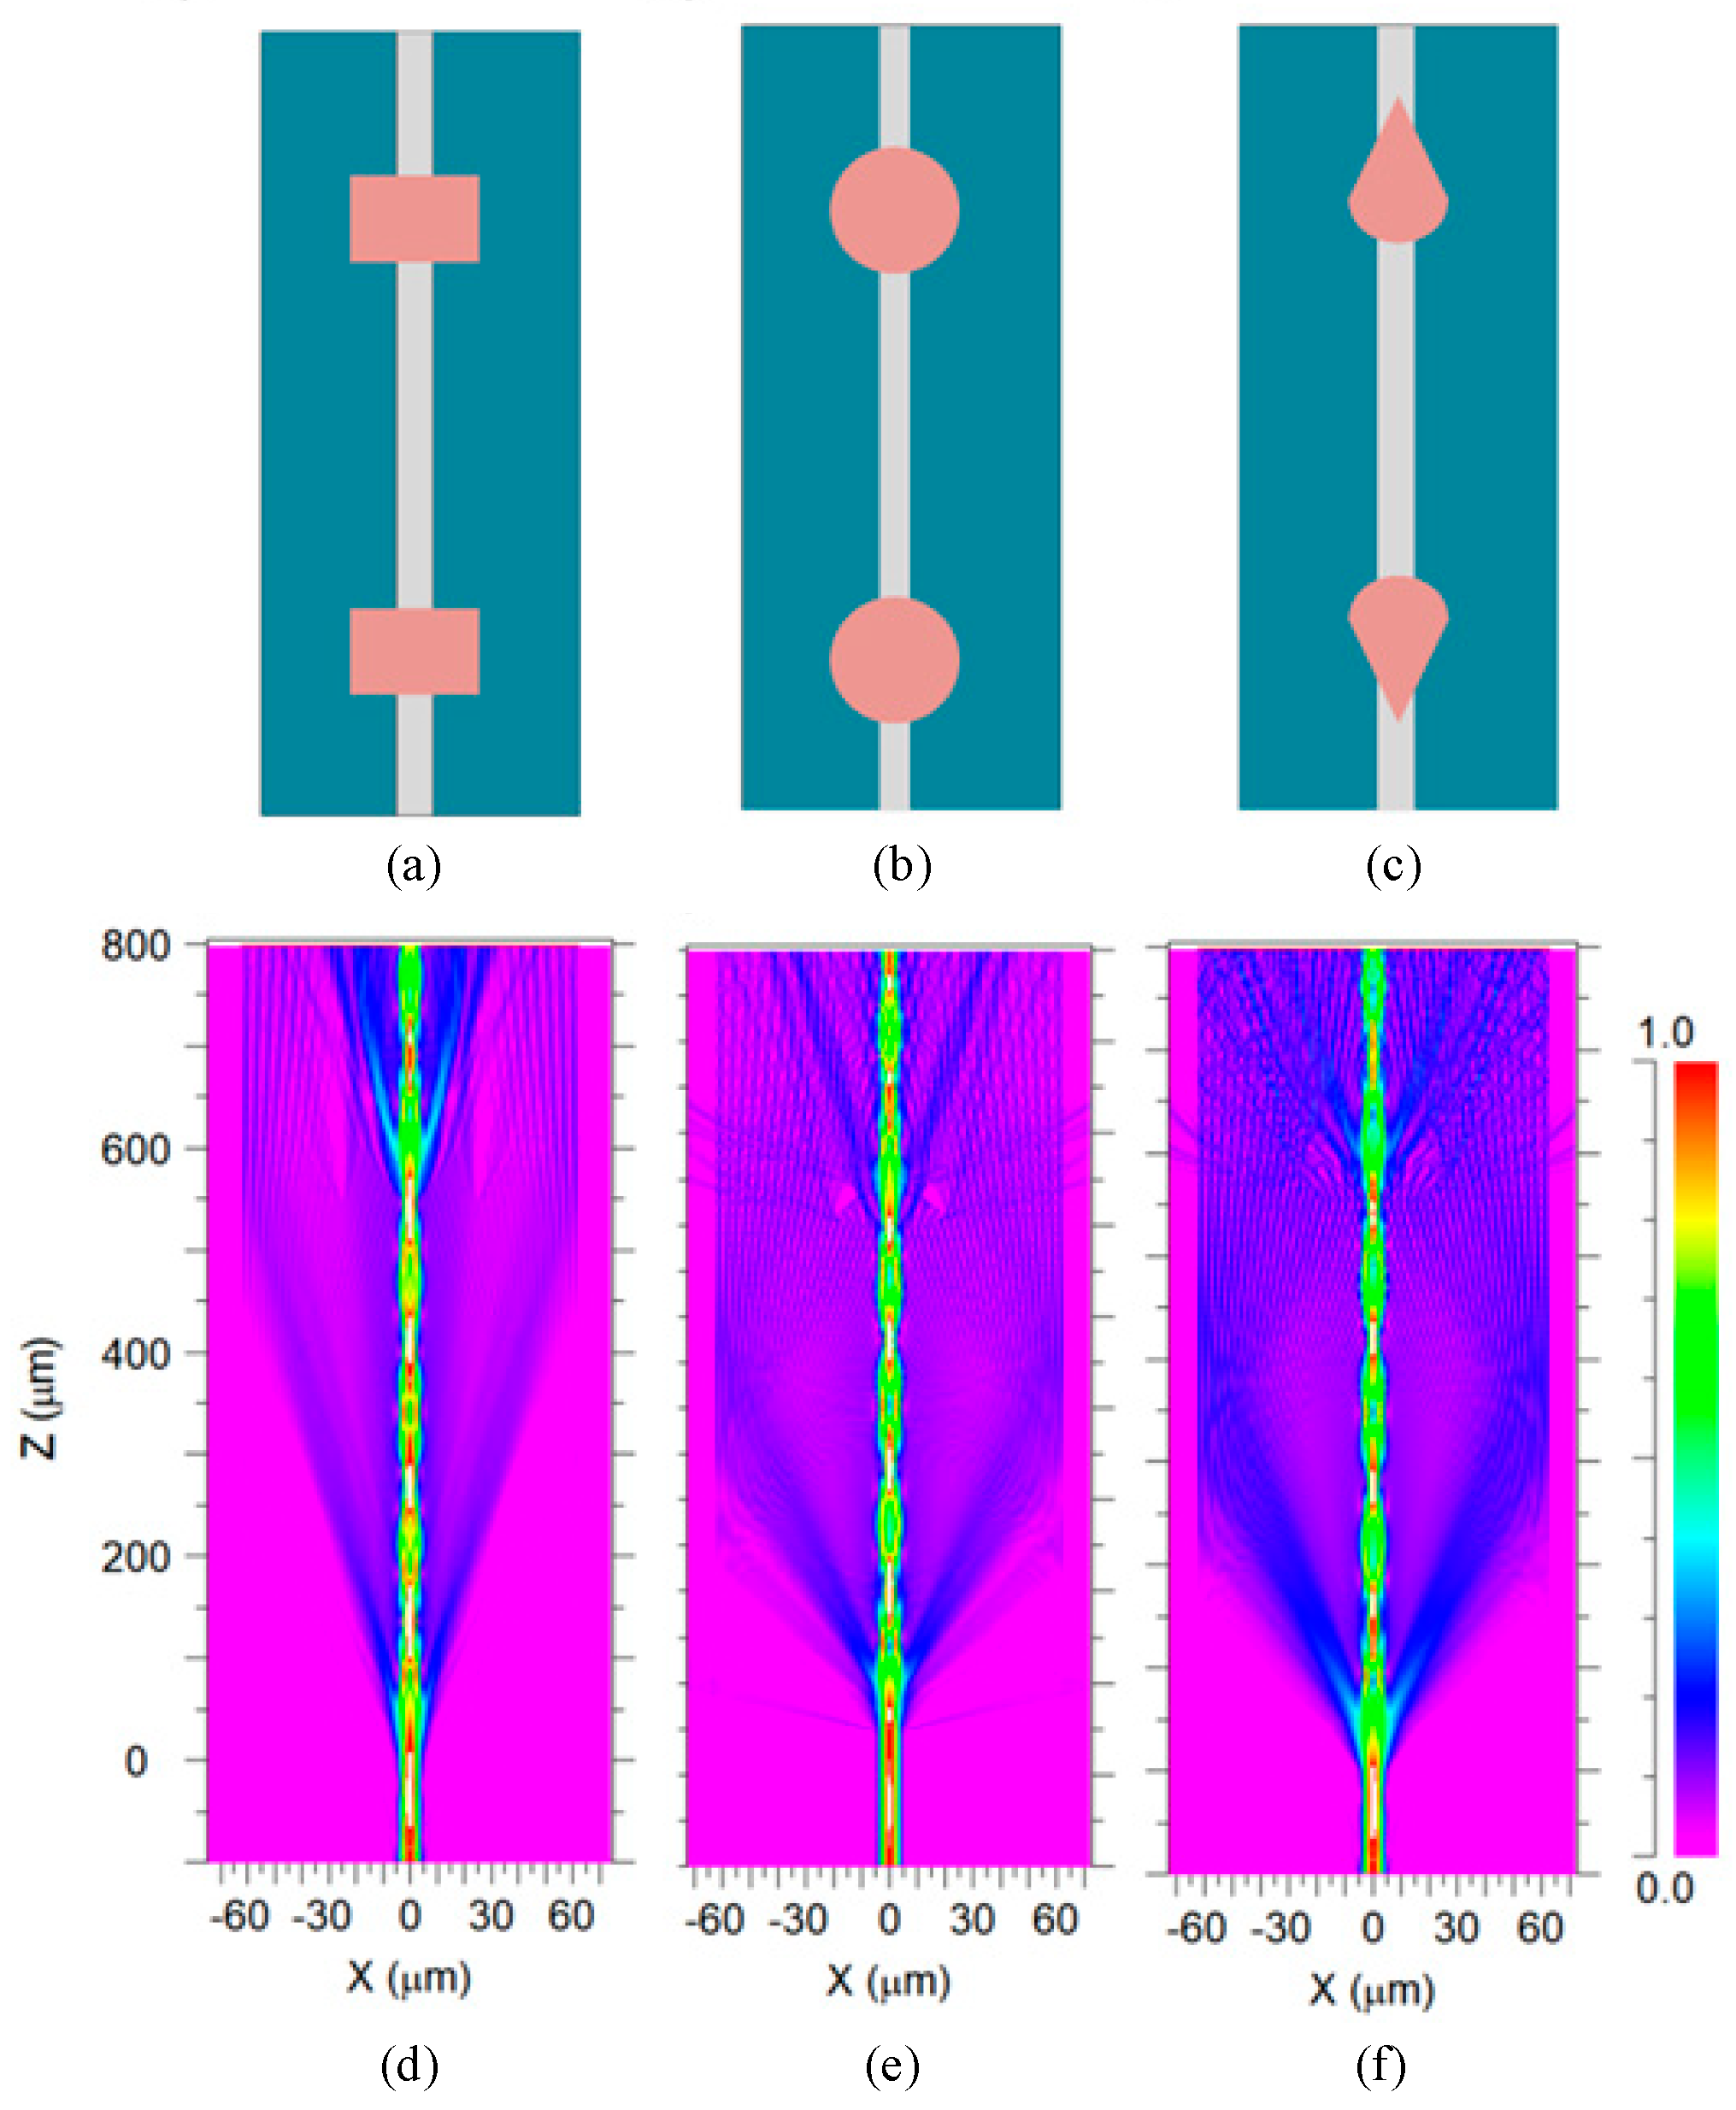
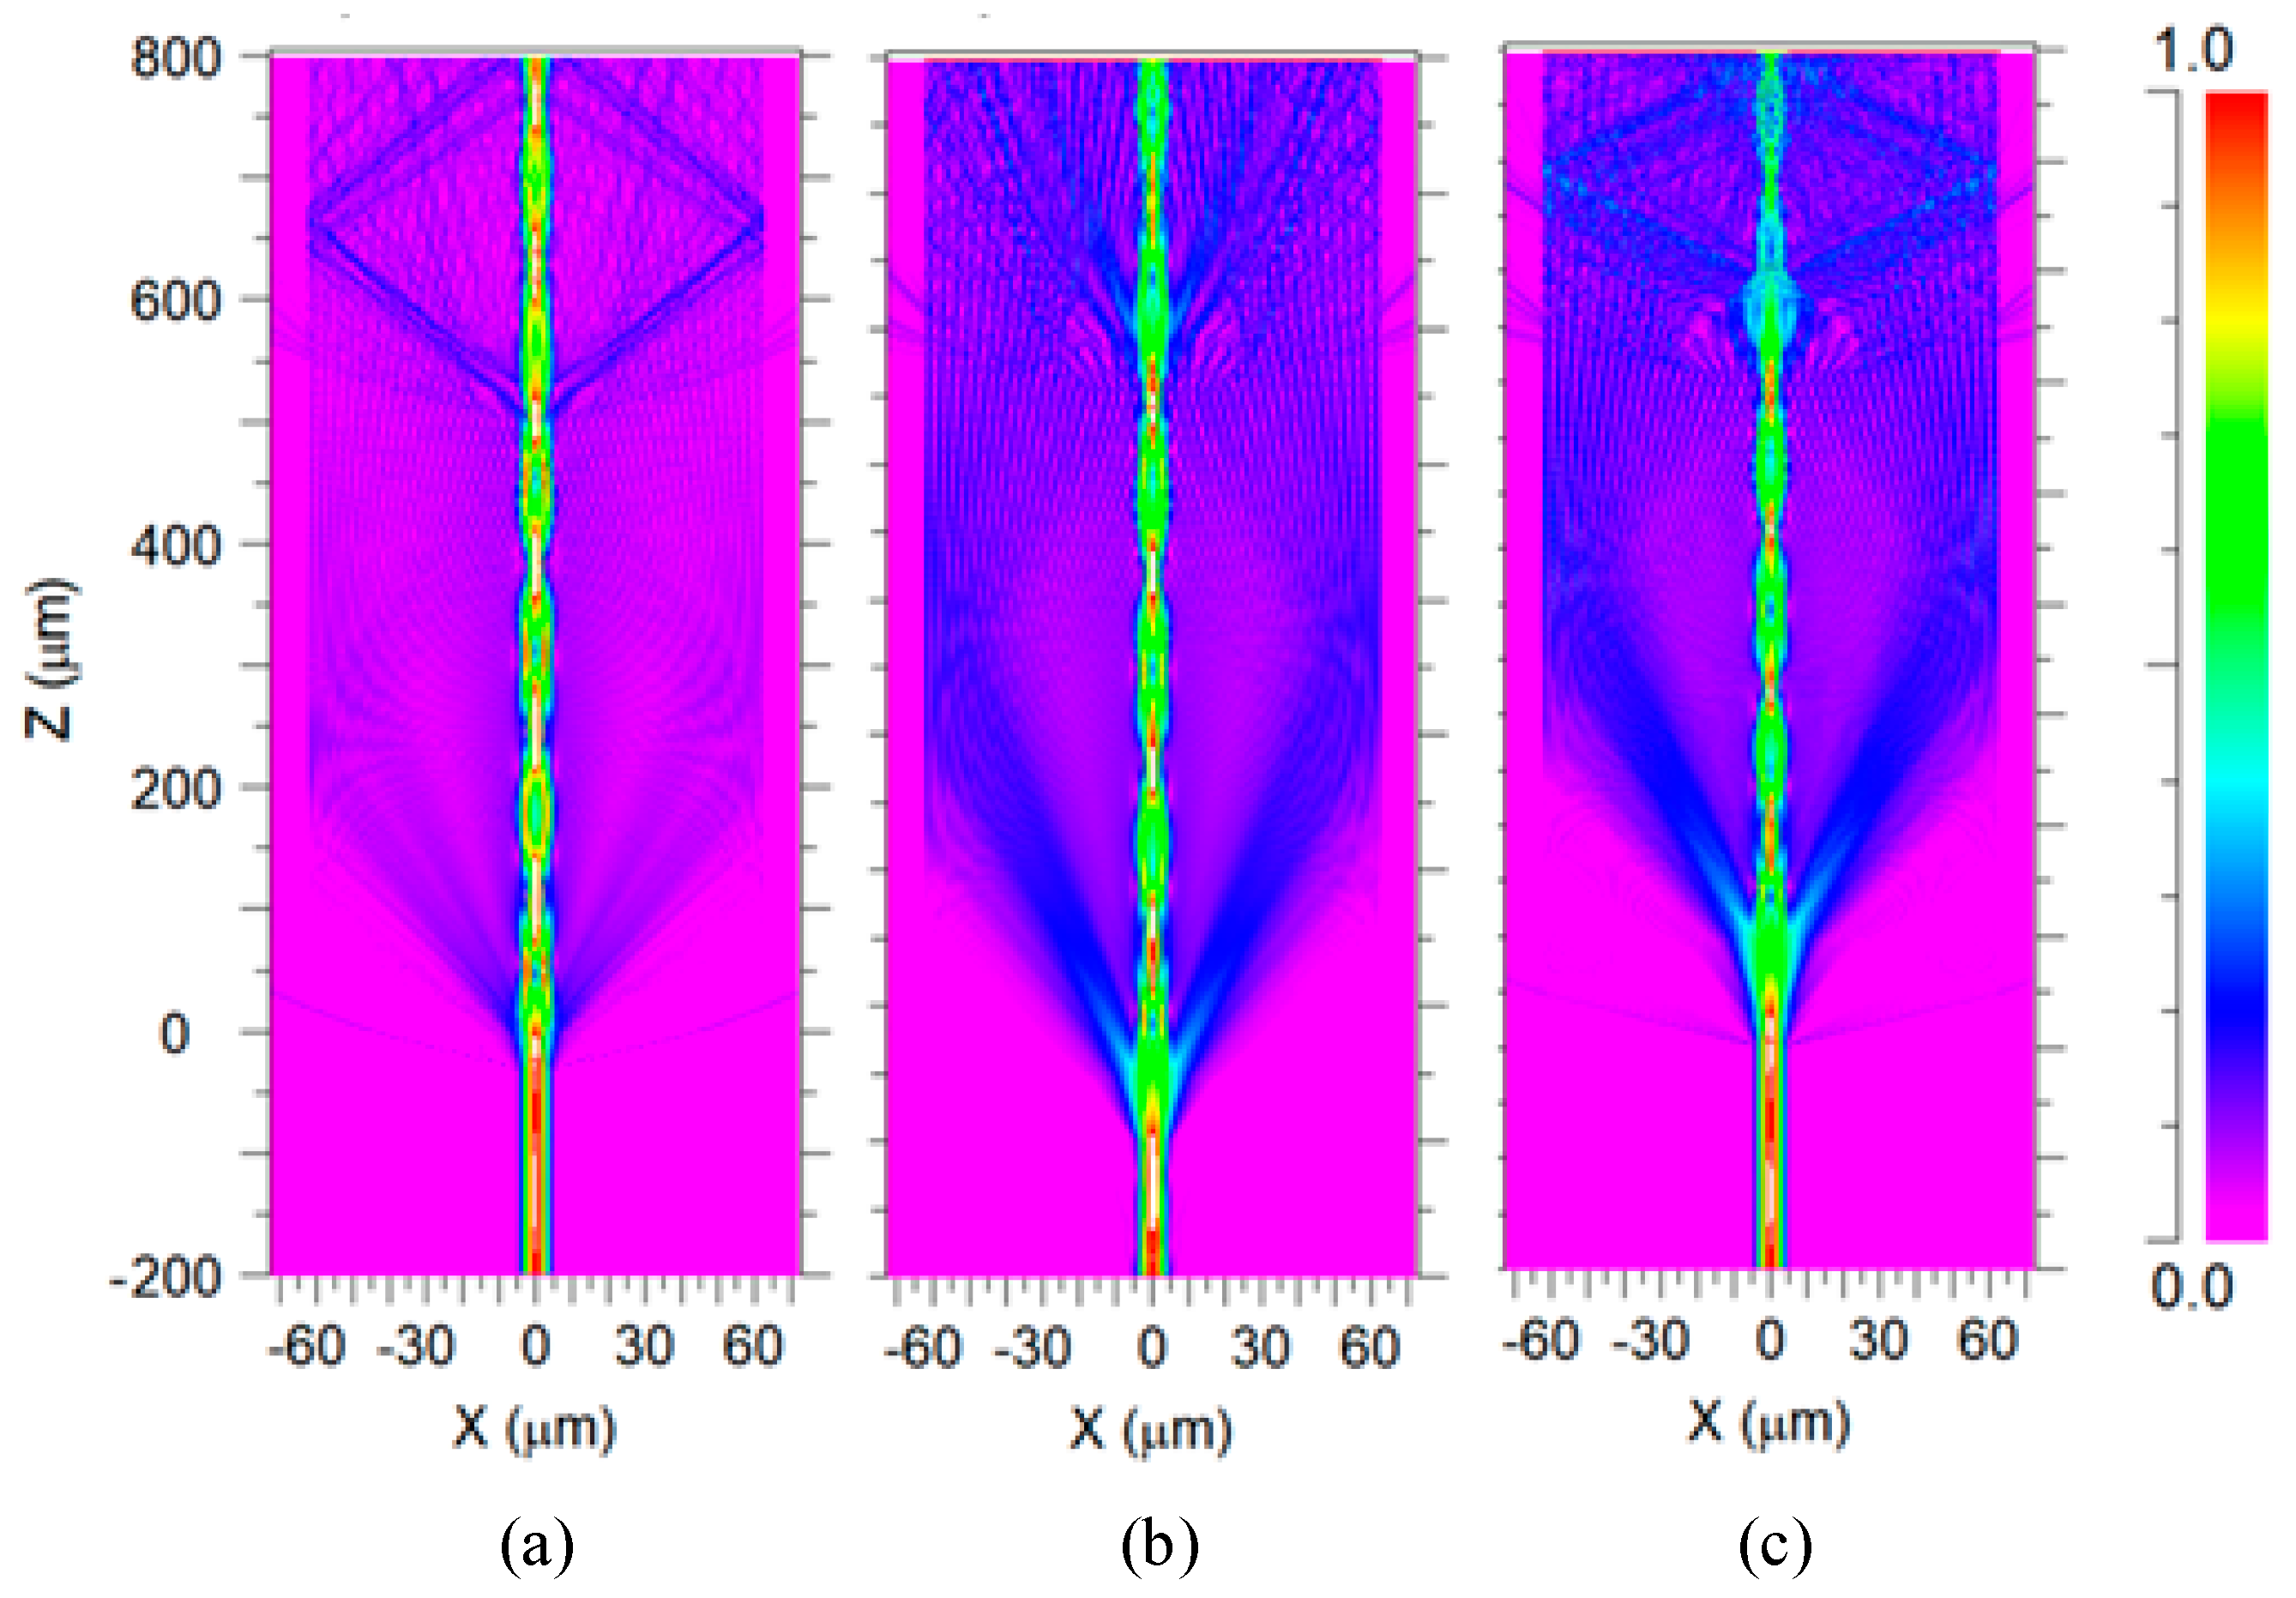
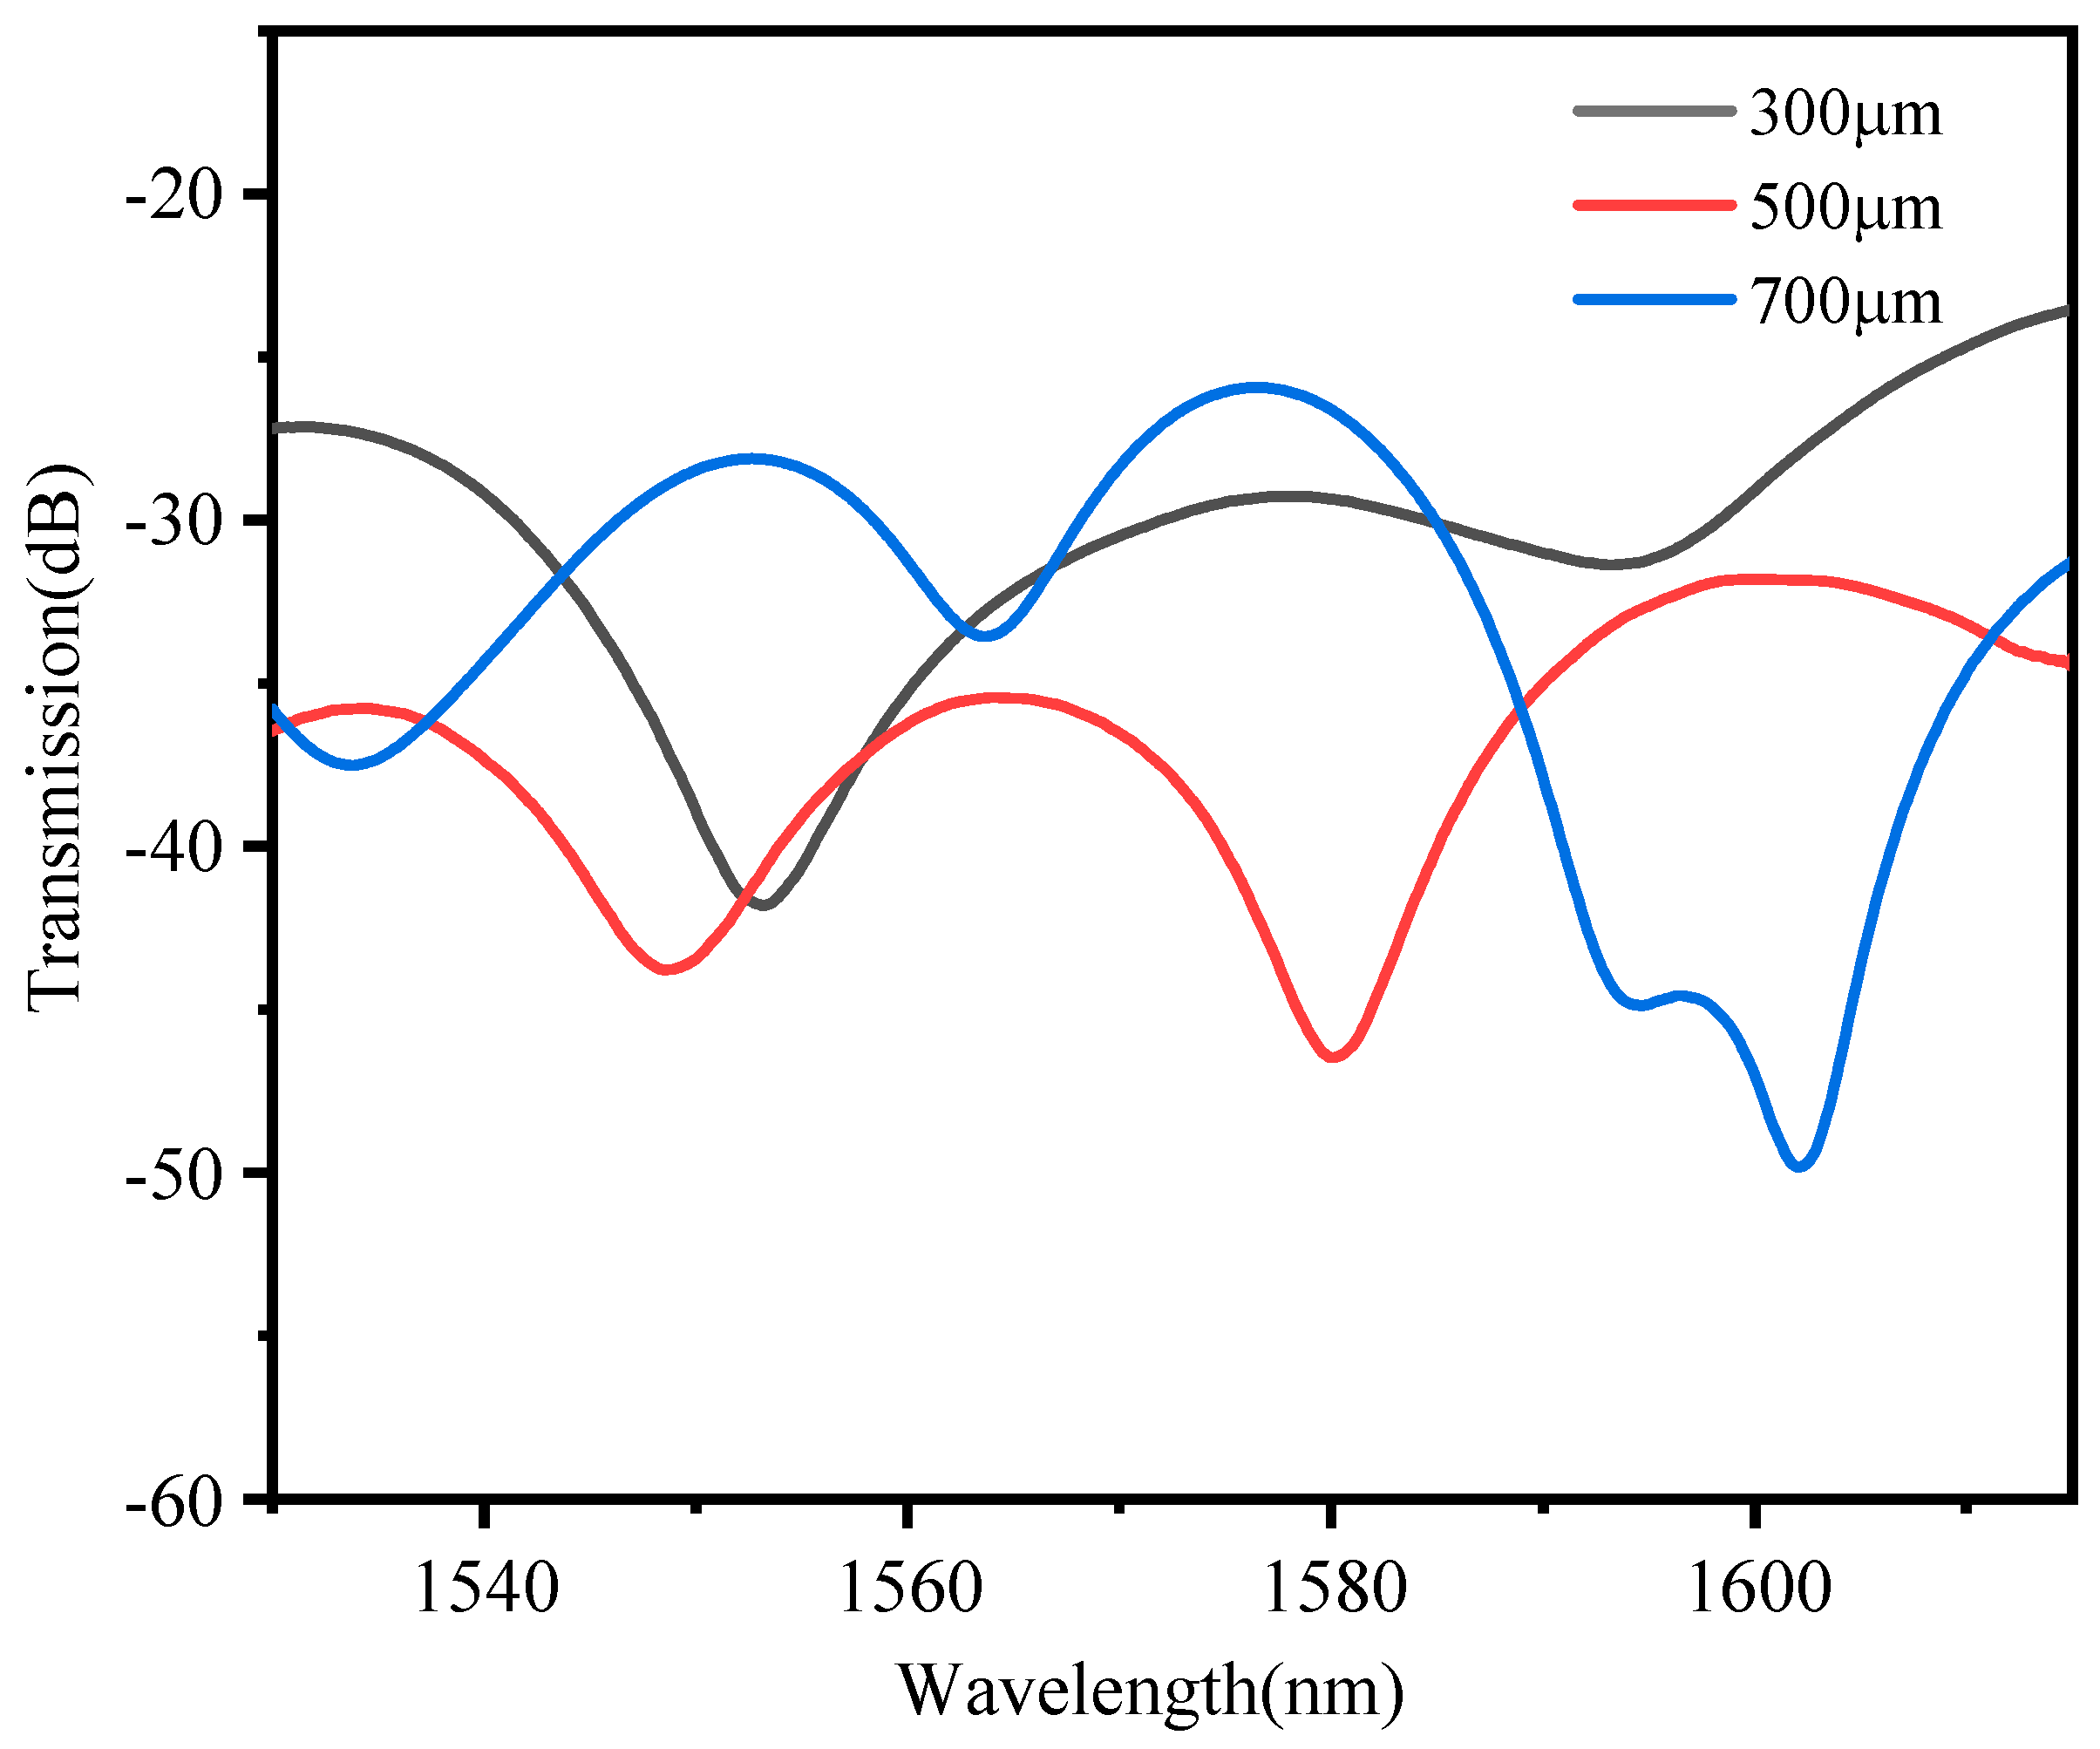
As shown in Figure 3, the optical fields of the flat-flat coupling cavity, the concave-concave coupling cavity, and the bullet-like coupling cavity were simulated to compare the characters of the various coupling cavities. Figure 3a–c shows the two-dimensional models of three different coupling cavities, respectively, and the part outside the coupling area is an SMF. The optical field distributions of the three coupling cavities were depicted in turn in Figure 3d–f. It is obvious that the bullet-like tapered cavity has substantially more energy entering the cladding than the previous two coupling cavities. This enhanced energy distribution in the cladding also means that the sensor will be more sensitive to changes in the external environment. For comparison, tapered linked cavities with longitudinal dimensions of 30 µm, 50 µm, and 100 µm were chosen. The difference in optical field distribution between the 30 µm and 50 µm sizes is obvious, with the latter having significantly more cladding energy distribution in the sensing area than the former, which is due to the longer flat coupling cavity behind the tapered cavity, which facilitates the beam expansion of the light. Therefore, the length of the tapered cavity will affect the beam diffusion effect of the light because most of the light energy will be coupled into the core and cannot effectively excite the cladding mode if the HCF behind the conical cavity is too short. On the other hand, a longer tapered cavity (e.g., 100 µm) does not contribute considerably to more cladding mode excitation. In this work, the longitudinal dimension of the bullet-like tapered cavity was determined to be 50 µm when combined with the simulated results, as shown in Figure 4. The influence of TCF lengths (300 µm, 500 µm, and 700 µm) on the sensor’s transmission spectra was explored, as shown in Figure 5. The bullet-like hollow cavity with a length of about 50 µm was chosen as the sensing area of the sensor due to its strong extinction ratio and narrow half-height width in the interference spectra.
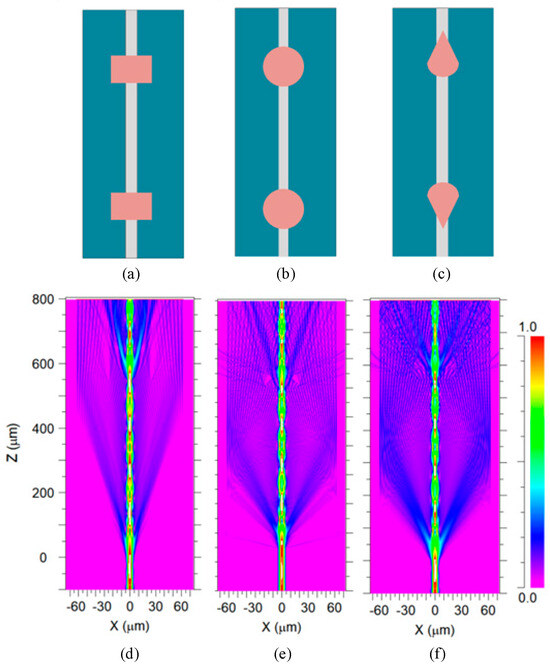
Figure 3.
Two−dimensional model structures (a–c) and light field distribution (d–f) of the plane−plane coupling cavities, concave–concave coupling cavities, and bullet-shaped coupling cavities of optical fiber sensors.
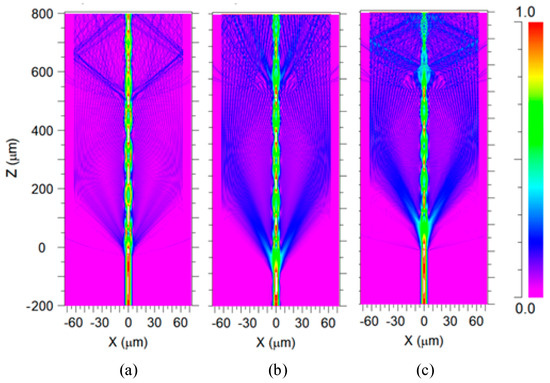
Figure 4.
Light field distribution in the coupling cavities with different lengths (a) 30 µm, (b) 50 µm, and (c) 100 µm.
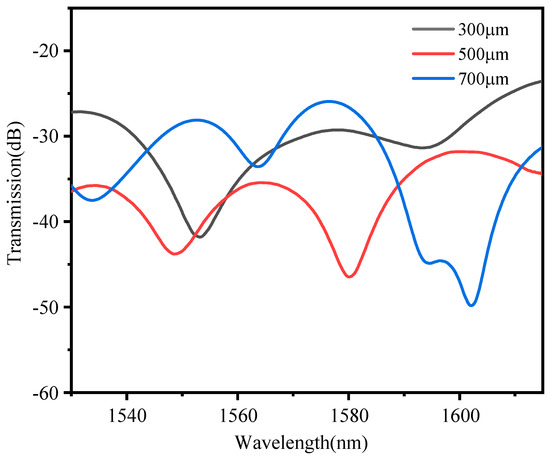
Figure 5.
Transmission spectra of sensors with different lengths of TCF.
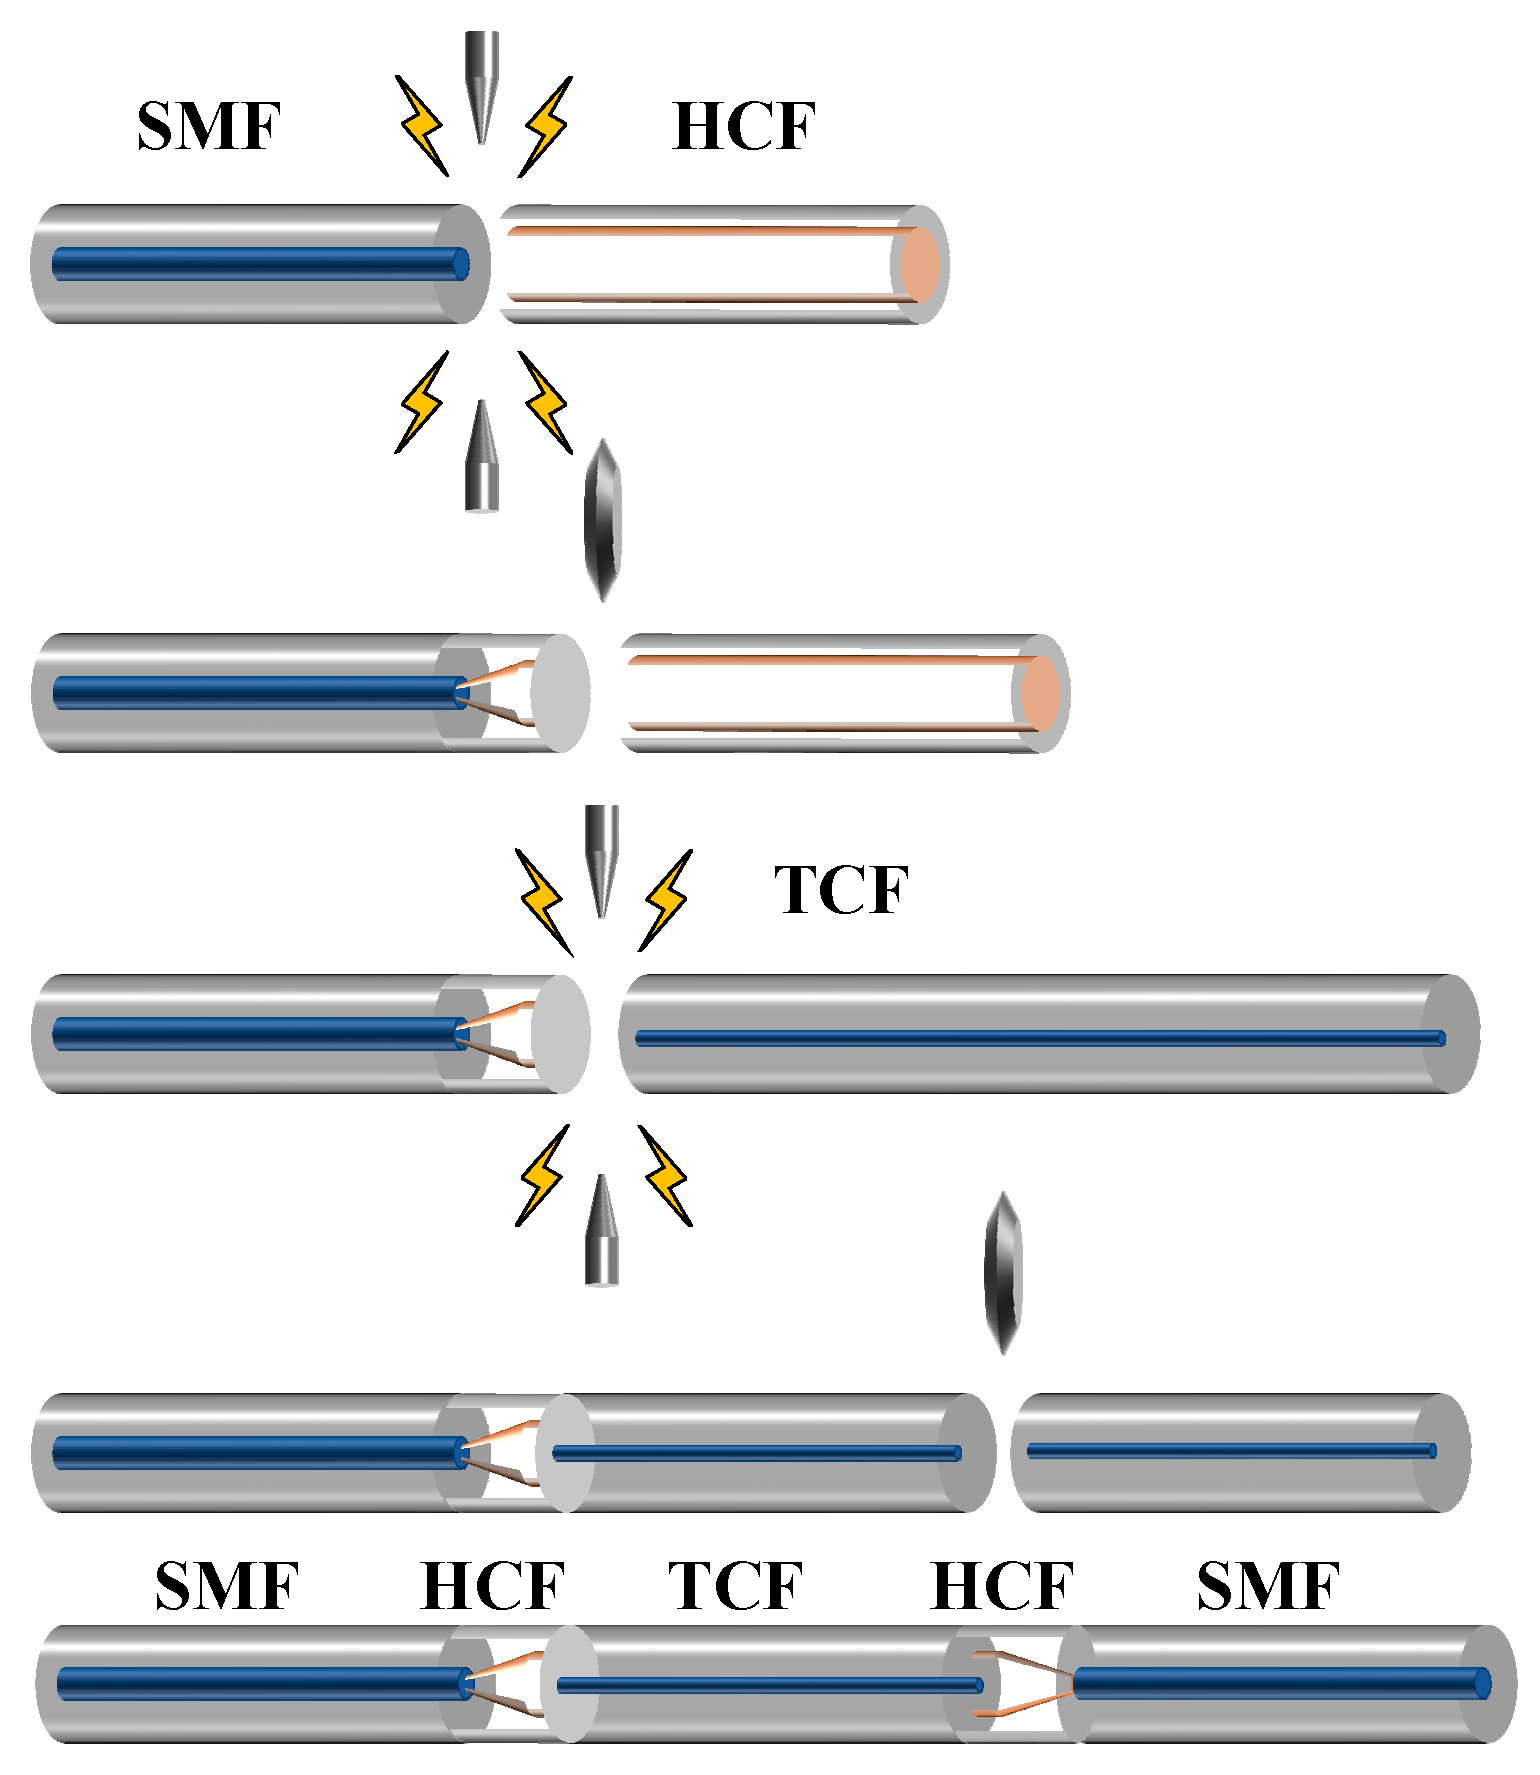
The sensor adopts a bullet-shaped hollow cavity as the coupling structure, which improves the coupling efficiency of the optical fiber and reduces temperature crosstalk. The SMF and HCF were fused by using an optical fiber fusion splicer (AV6481, Ceyear Technologies Co., Ltd., Qingdao, China). Since HCF holes need to be collapsed at the fusion interface between HCF and SMF, we chose stronger current fusion parameters (fusion energy 900 bits, fusion time 300 ms, and perfusion time 180 ms) for welding. The air holes at the fusion of HCF and SMF were tapered, and HCF remains about 50µm in the non-collapsing zone to be cut before fusing with TCF. The discharge heating area of the fusion splicer is probably going to encompass the entire cavity because of the limited taper area. The front and back of the taper will deform an ellipsoidal symmetric cavity when the fusion splicer discharge parameters are too large. It should be pointed out that the fusion parameters (fusion energy of 600 bits, fusion time of 200 ms, and pre-melt time of 160 ms) need to be reduced appropriately to preserve the bullet-like cavity when it fused to TCF. The overall structure was prepared according to the same method, the fabrication process of the sensor is shown in Figure 6.
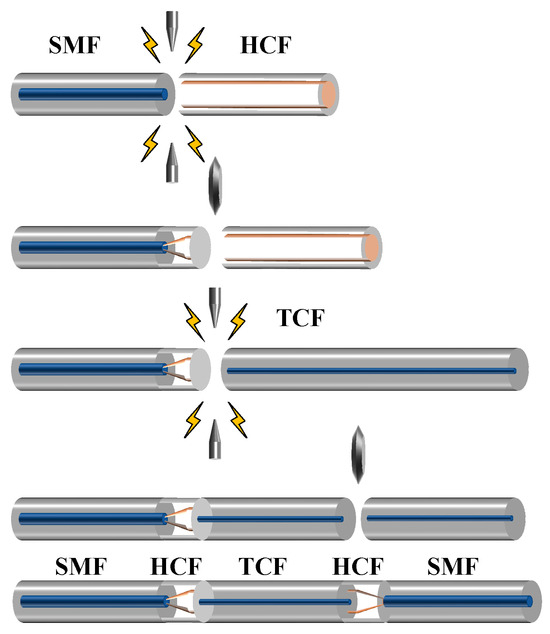
Figure 6.
The preparation processes of the bullet-like tapered fiber sensor.
3. Sensing Performance of the Sensor for Lead Ion
3.1. Functionalization of the Sensor
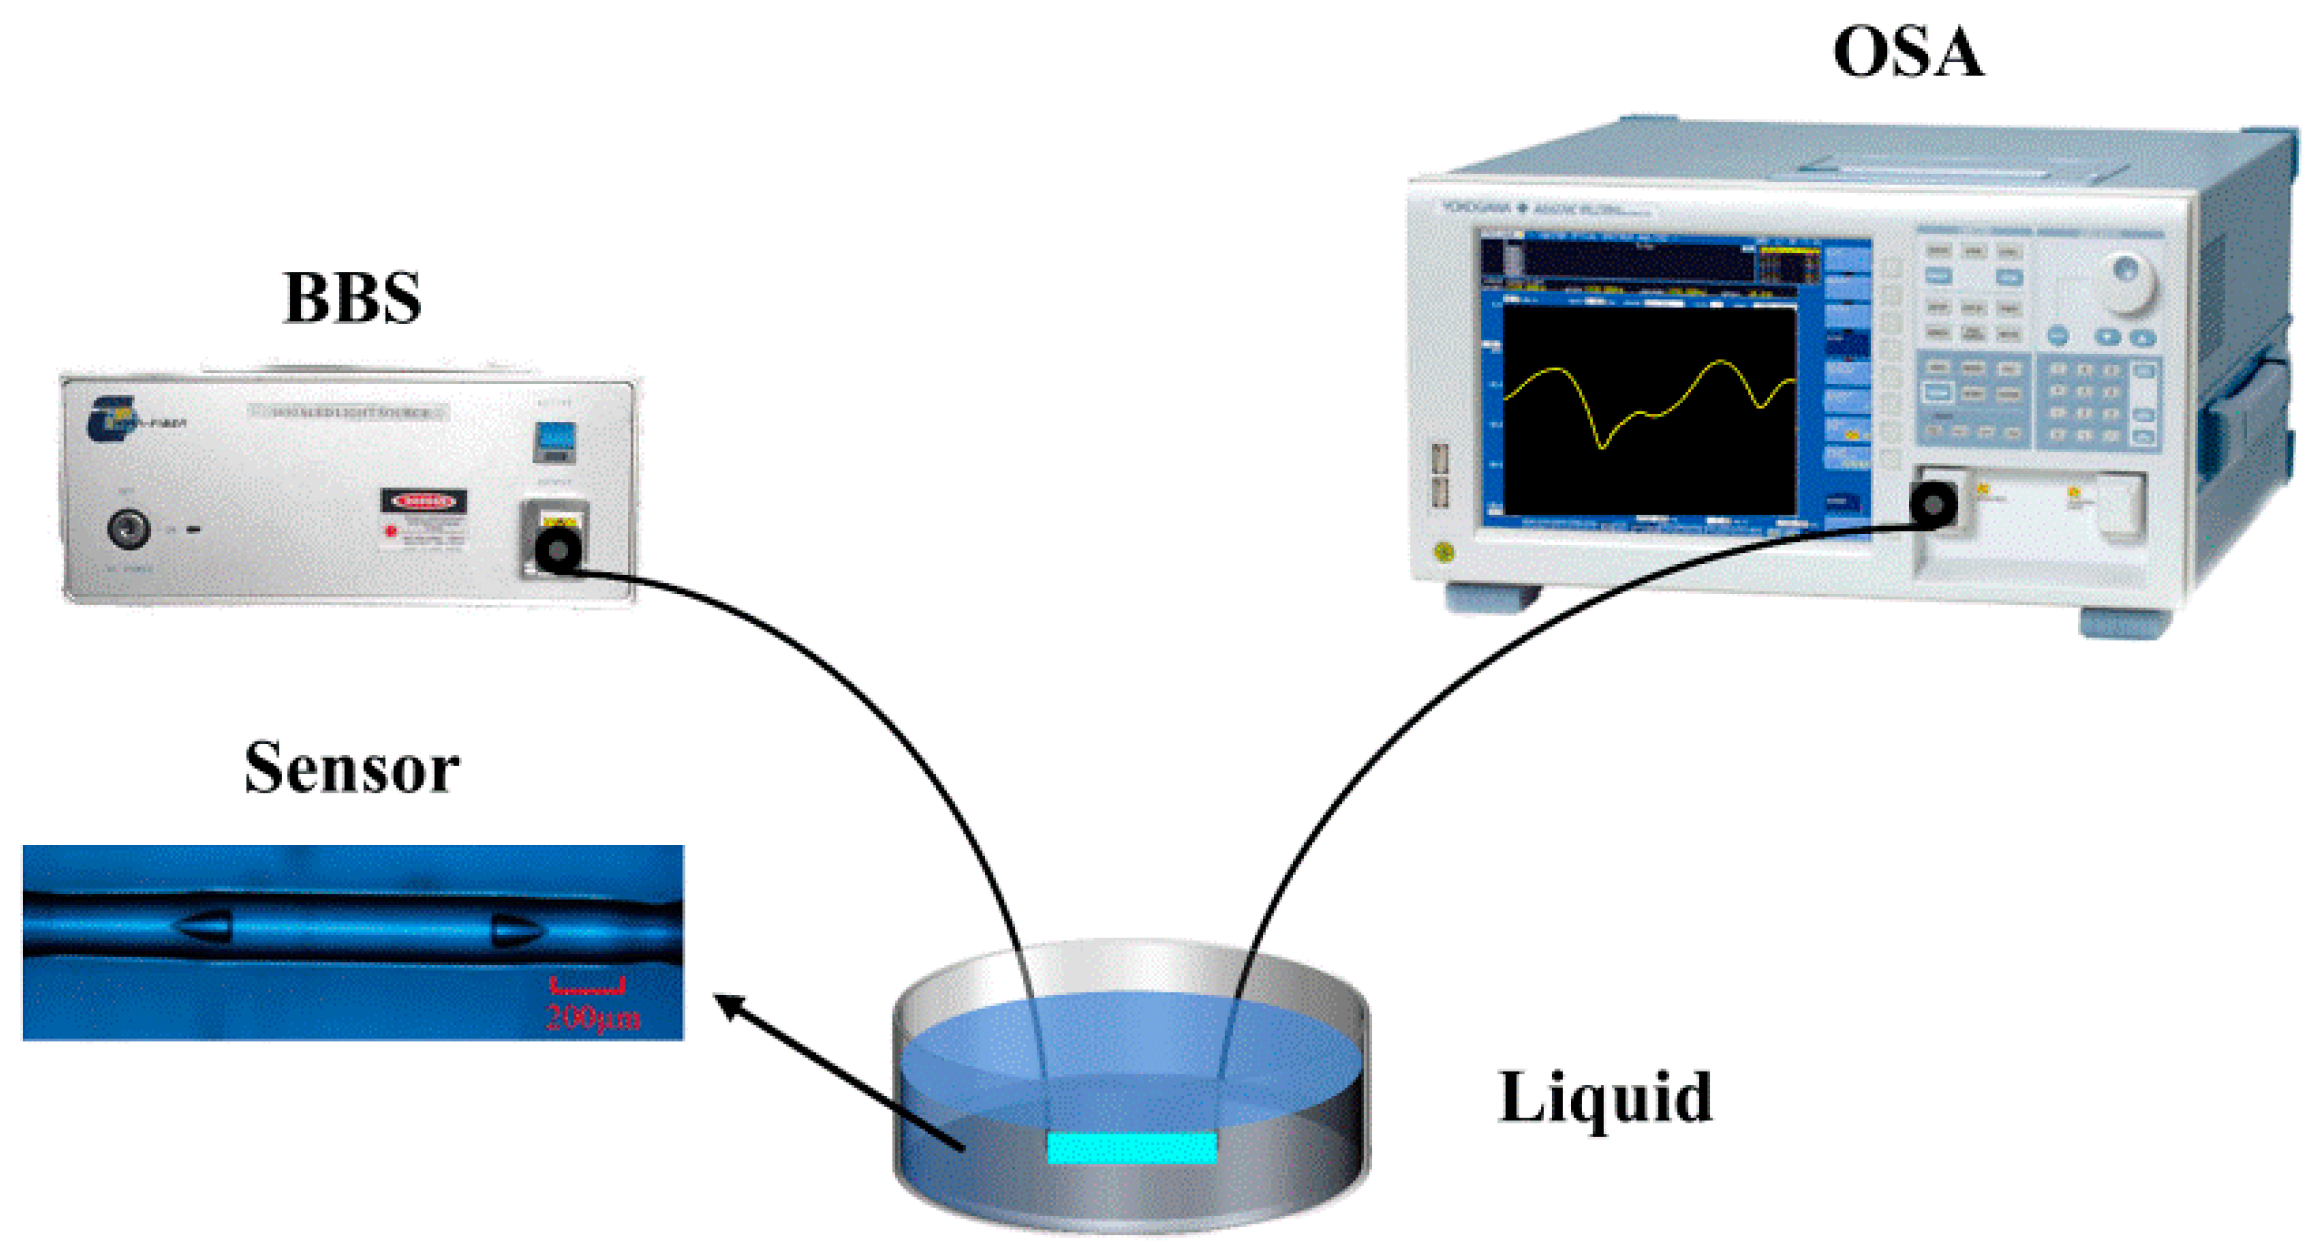
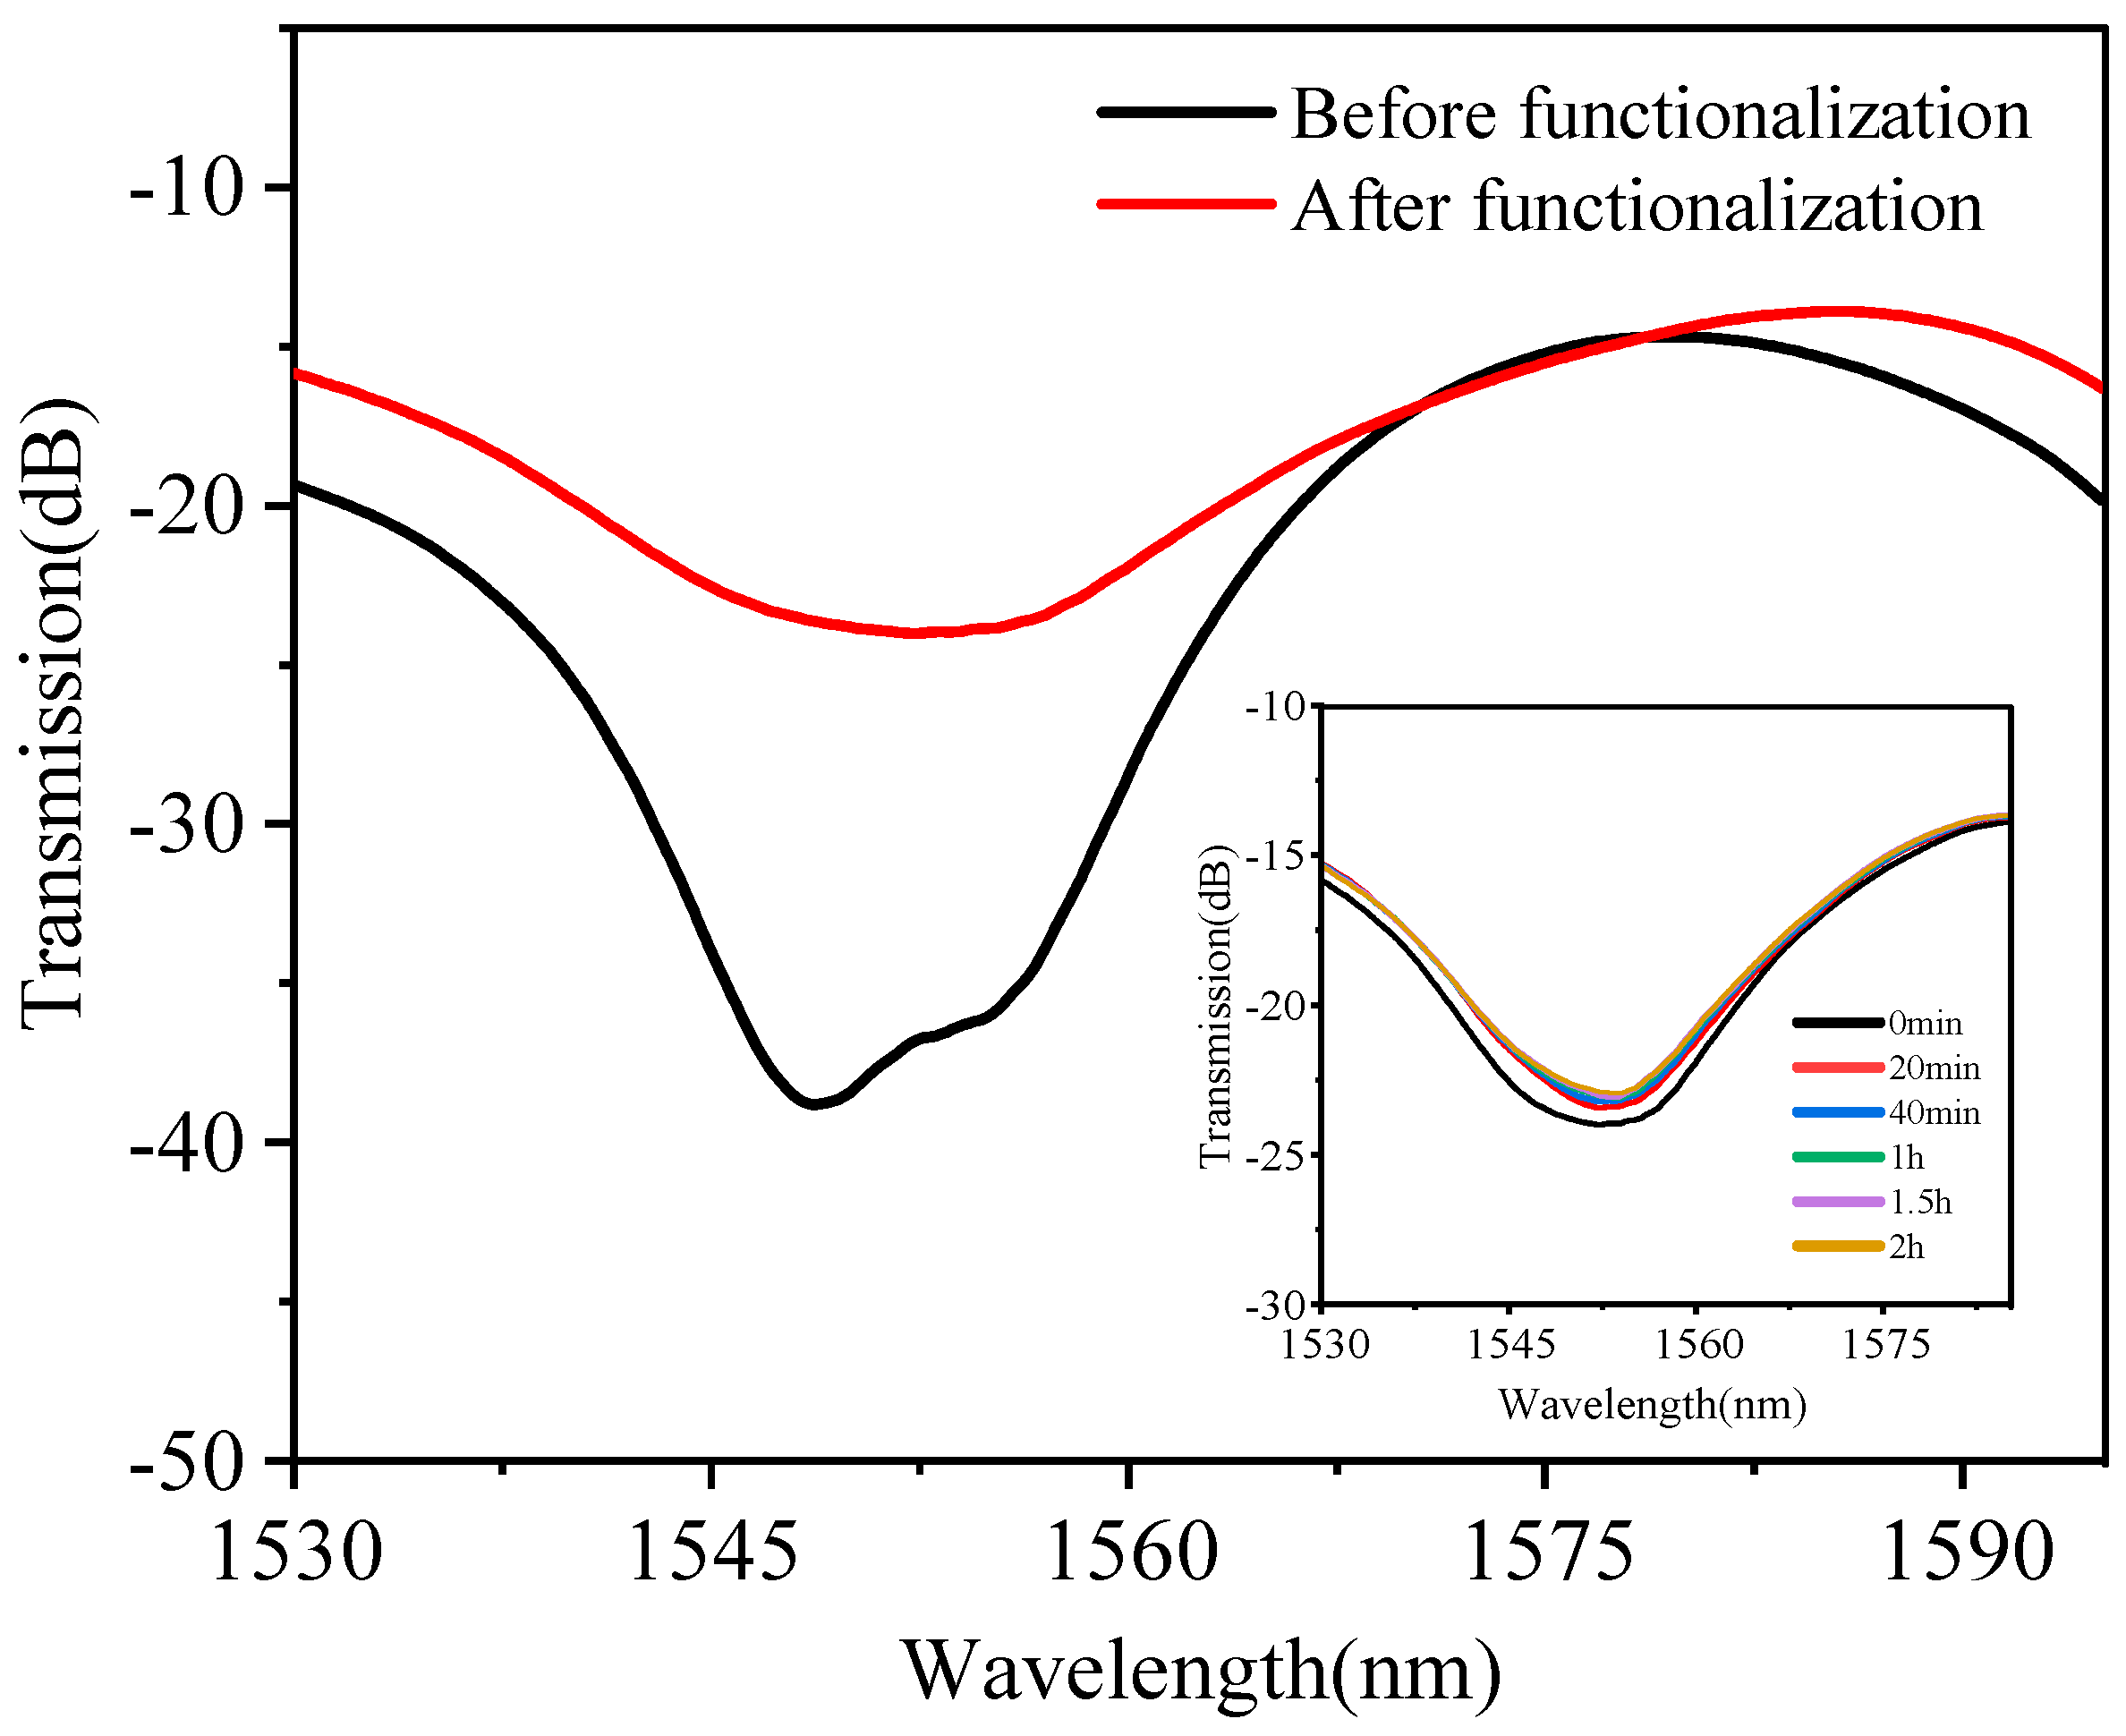
As the sensitive layer, the IIP-CS colloid needs to be coated on the surface of the fiber sensor. When chitosan combines with metal cations, metal complexes are produced, which leads to changes in the RI of the sensitive layer. It can be seen from Equations (4) and (5) that the effective RI difference will change. Therefore, the concentration of the metal ions in the solution could be determined by observing the variations in the transmission spectra of the sensor due to their corresponding relationship. It must be pointed out that the surface of the fiber sensor must be cleaned with alcohol before coating the sensitive film. There are several steps for preparing the surface functional film of the sensor. The first step is to clean the sensor surface to eliminate pollutant interference, and the second is to have electrostatic force on the outside surface of the optical fiber to facilitate coating. The dip coating method was used for the sensor. The fiber is rotated slowly while immersed in the solution to ensure a homogeneous coating. After being coated with the sensitive film, the optical fiber sensor was dried at 80 °C for 2 h. After the curing process was finished, the template ions were separated from the CS 3D cavities using EDTA. The coating of the sensitive film changes the external RI of the sensor, which results in the variation of the transmission spectra. The schematic diagram of the experimental system is shown in Figure 7,and the spectra of the sensor before and after functionalization are shown as Figure 8. The broadband light source (abbreviated as BBS, ASE-C+L-D-G-13, CONOURE Technologies Co., Ltd., Beijing, China) and optical spectrum analyzer (abbreviated as OSA, AQ6370B, YOKOGAWA Co., Ltd., Tokyo, Japan) were employed in the experiments.
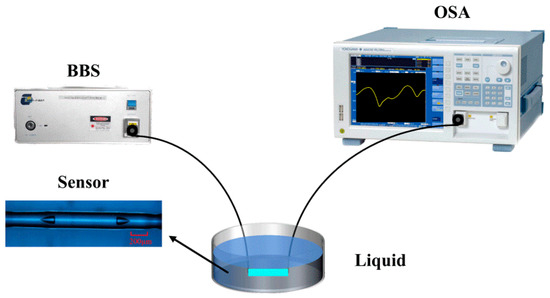
Figure 7.
Schematic diagram of the experimental system.
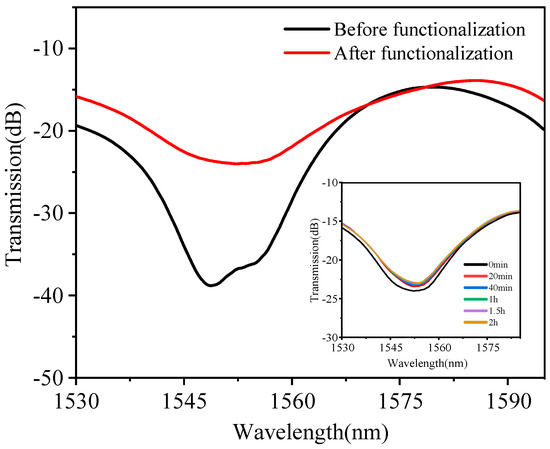
Figure 8.
Transmission spectra of sensors before and after the application of a sensitive film. The inset is the stability of the sensor spectra in water over time.
3.2. Lead Ion Detection of the Sensor
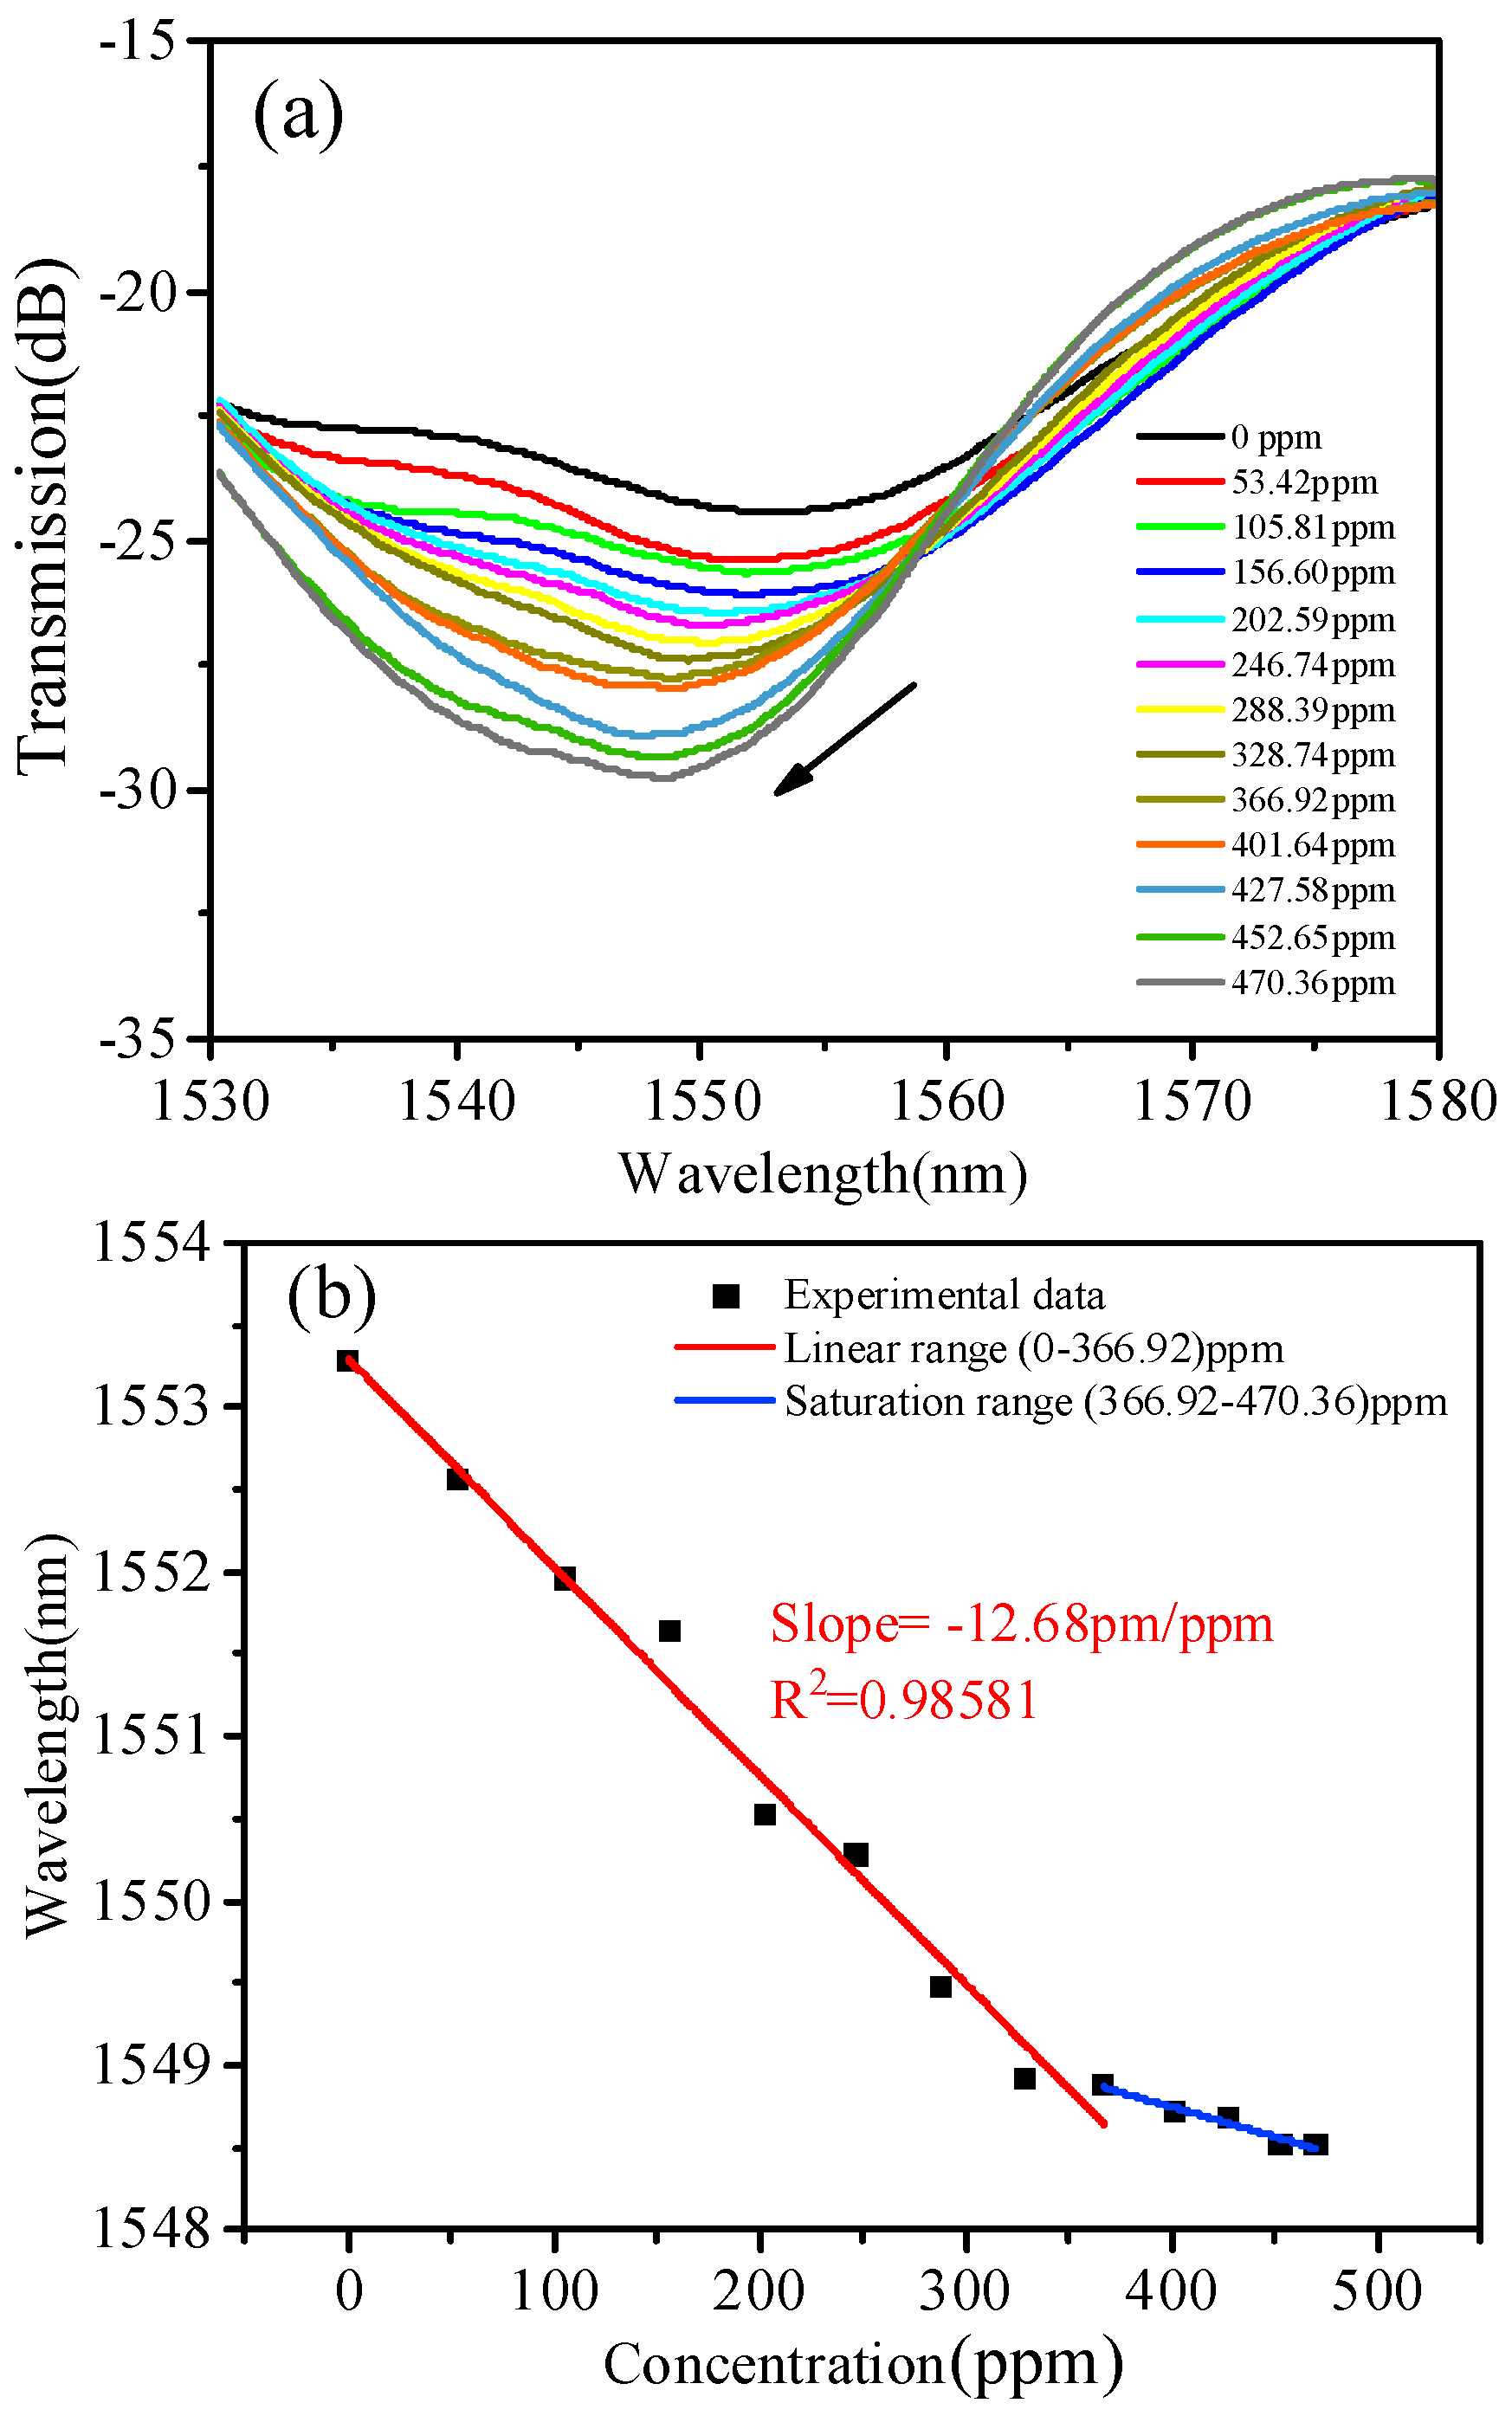
The detection experiments of sensors for Pb2+ ions were carried out after being fully immersed in pure water. The temperature and solution pH were tightly controlled throughout the experiments to lessen the impact of extraneous variables on the experimental results. The shifts diagram of the optical fiber sensor with bullet-like hollow cavities for lead ion detection is shown in Figure 9a, from which it can be found that the spectra are gradually blue-shifted with the increasing concentration of Pb2+ ion, and the intensity of the interference peaks is gradually decreasing. Figure 9b shows the linear fit for the shift of the spectra. The sensitivity of the Pb2+ ion concentration is −12.68 pm/ppm (R2 = 0.98581), ranging from 0 ppm to 365 ppm, and the linear wavelength shift smoothed out after the Pb2+ ion concentration is greater than 365 ppm. The main reason could be attributed to the saturation of the ion adsorption. The Pb2+ ions bind to the IIP-CS eluted three-dimensional cavities of the sensor when the concentration is low. The RI of the CS film changes with the increase of Pb2+ ion concentration, resulting in a blue shift of the spectral interference wavelength. In the case of ion-imprinted chitosan cavities, there is a limit to the number of chitosan cavities, and as the concentration of Pb2+ ion increases, the binding of ions to cavities saturates, causing the spectral drift to gradually plateau as well. The sensor possesses excellent performance for Pb2+ ion detection compared with that in the existing literature, as shown in Table 1. The sensor in this work has a relatively high sensitivity, lower LOD, and a wider detection range. The black phosphorus (BP) functionalized optical fiber sensor based on a microfiber coil resonator (MCR) for Pb2+ ion detection possesses an ultra-low LOD of about 0.0285 ppb. However, the detection ranges from 0 to 50 ppm, and the specificity of the sensor is modest [28]. Therefore, the sensor proposed in this work has great potential application for Pb2+ ion detection.
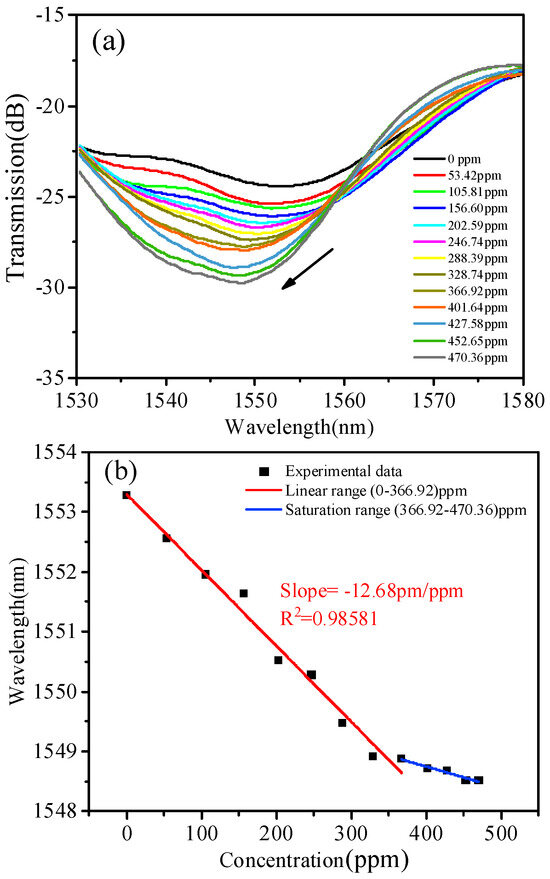
Figure 9.
Optical fiber sensor for Pb2+ ion detection. (a) Spectral shifts of the sensor with Pb2+ ion concentration. (b) The linear fitting curves for different Pb2+ ion concentrations.

Table 1.
Performance comparison of the sensors for Pb2+ ion detection.
3.3. Specificity of the Sensor
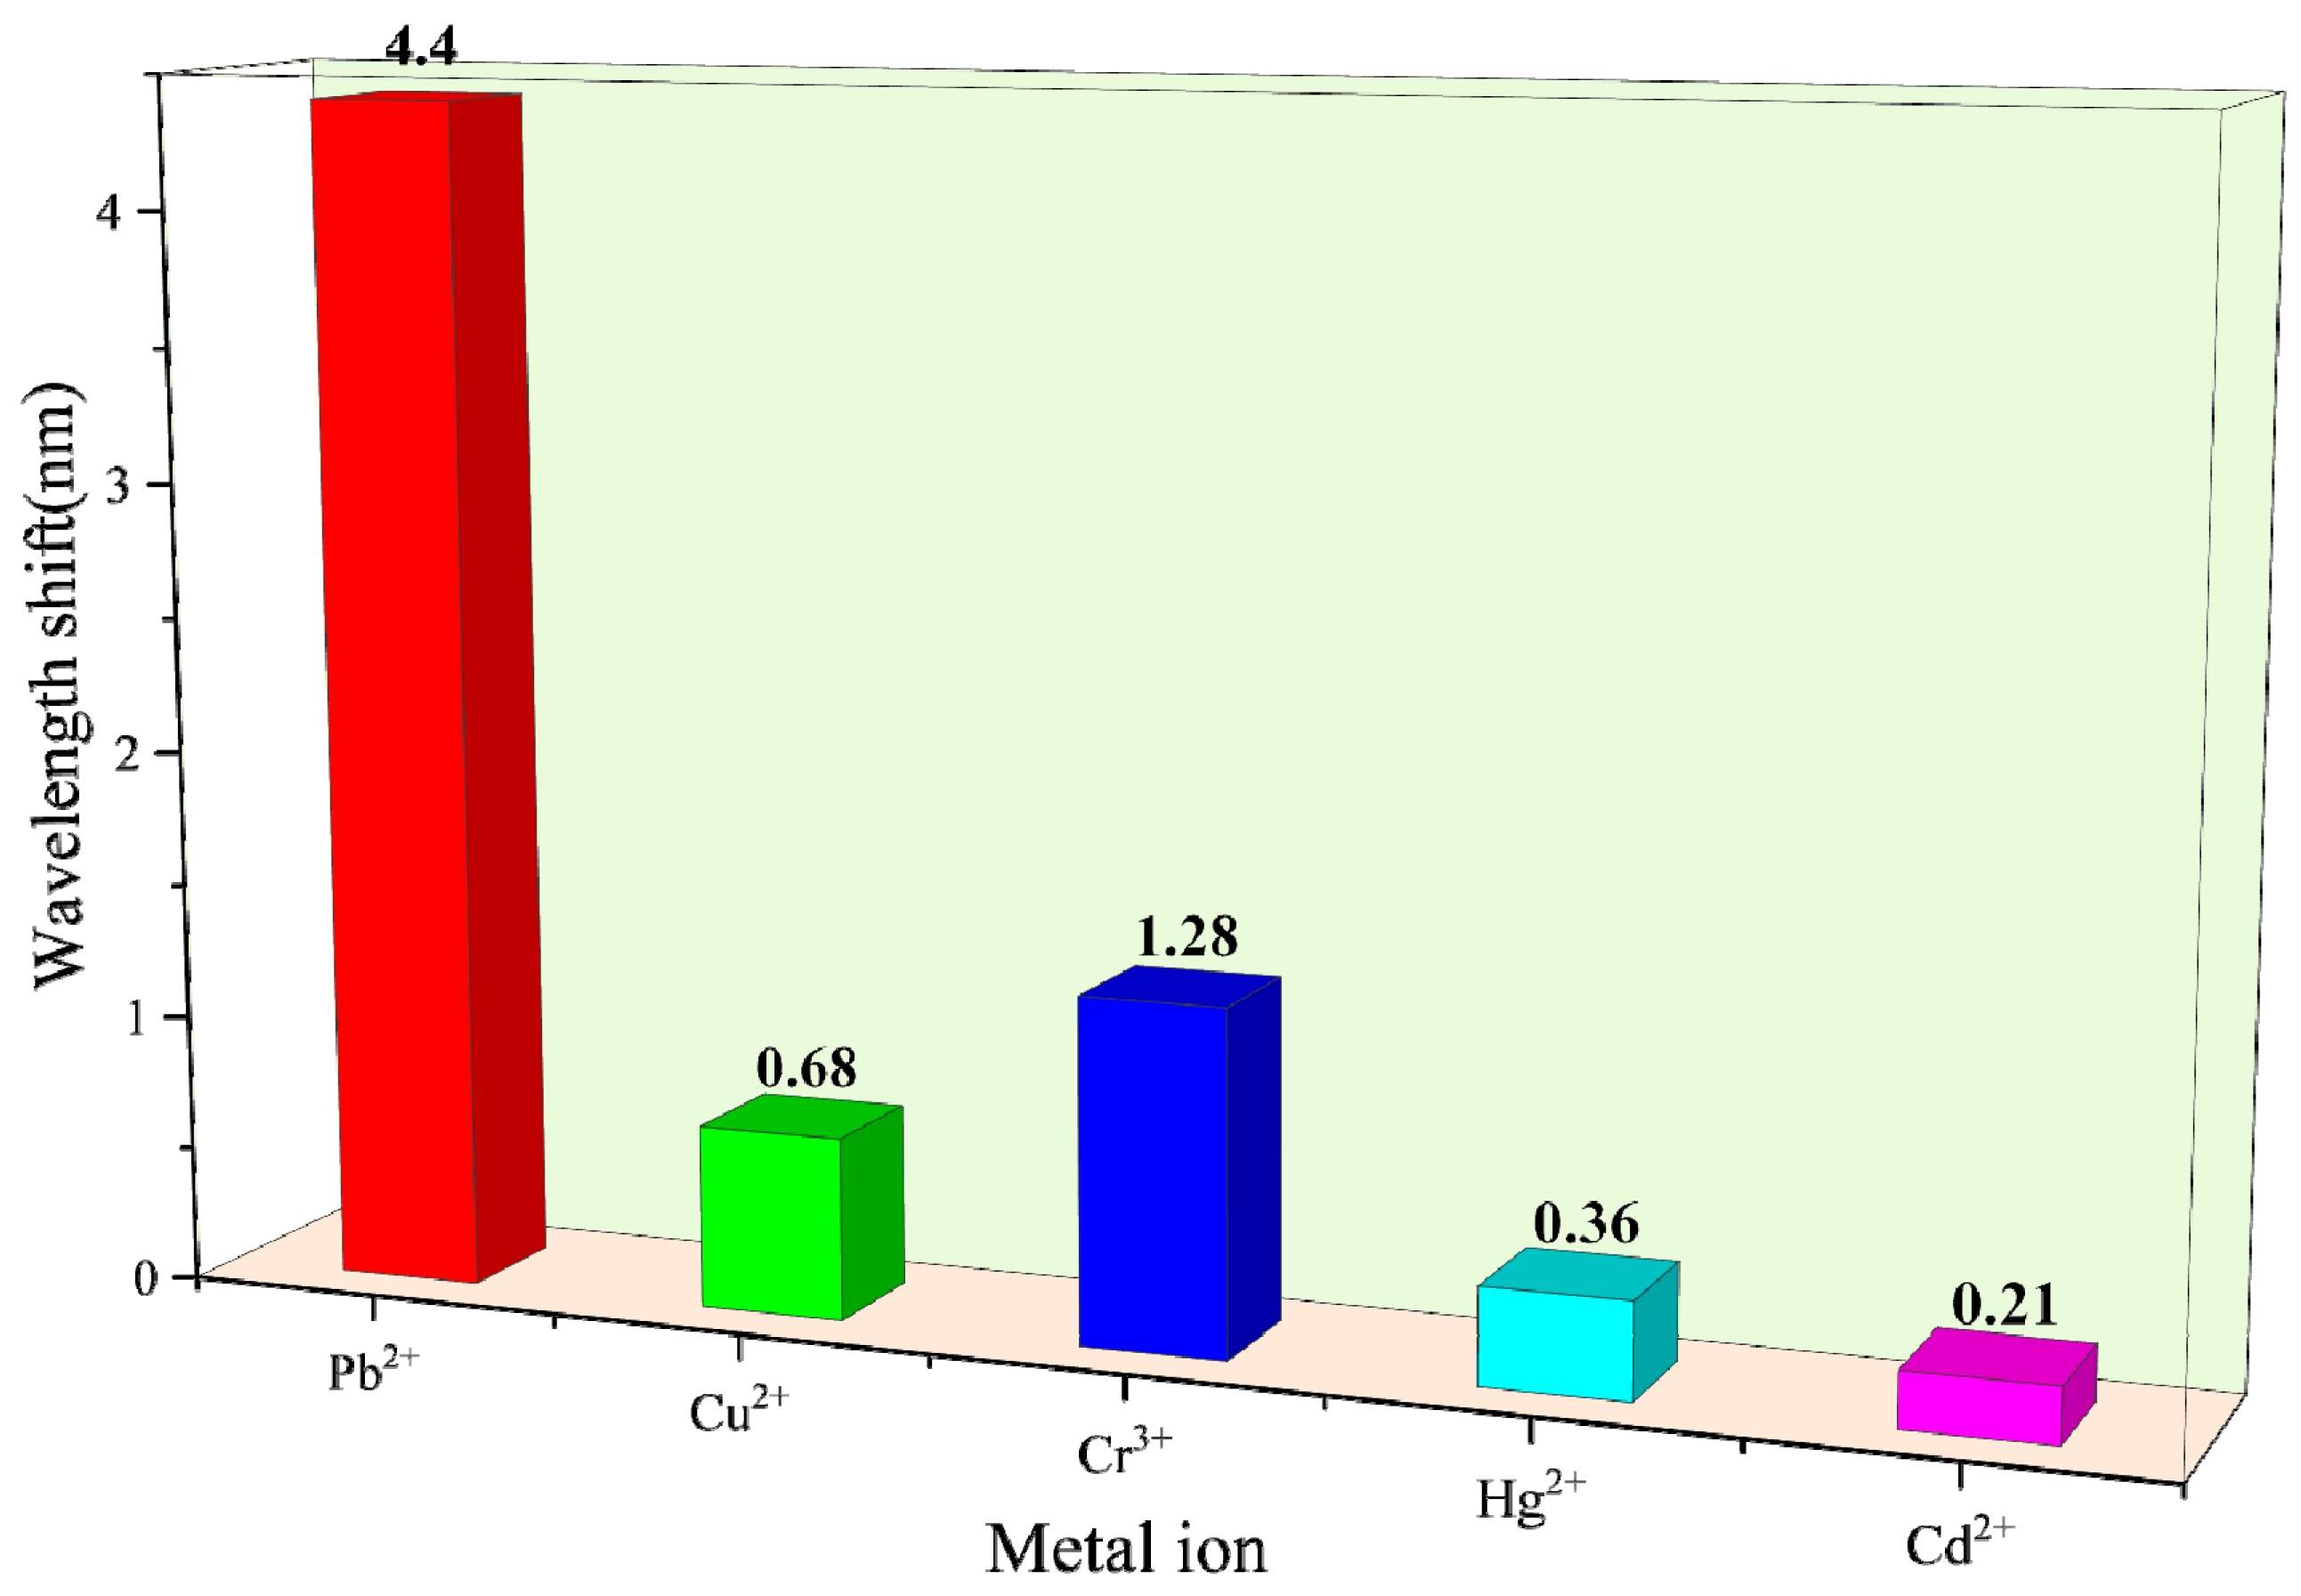
In order to study the specificity of the sensor, we have investigated its response to other typical heavy metal ions, such as Cu2+, Cr3+, Hg2+, and Cd2+, in concentration ranges from 0 ppm to 350 ppm. The wavelength shifts of the sensor were compared for the sensing characters of the sensor ions with the maximum concentrations of 350 ppm, as shown in Figure 10. It is clear that the sensor has a significant change in wavelength shift for Pb2+ ions compared with that of other ions. The wavelength variation is 4.4 nm for Pb2+ ion within 350 ppm, whereas the wavelength position changes are not obvious for other heavy metal ions, with changes of 0.68 nm, 1.28 nm, 0.36 nm, and 0.21 nm for Cu2+, Cr3+, Hg2+, and Cd2+, respectively.
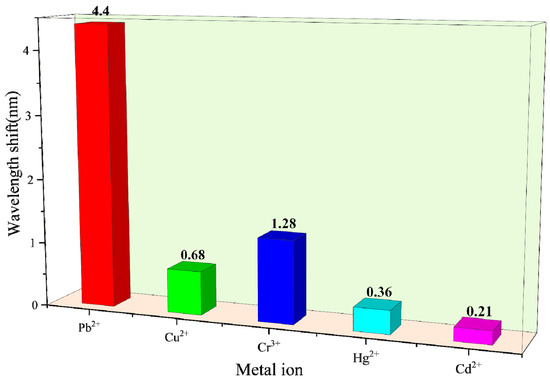
Figure 10.
The maximum wavelength shifts of the sensor for different metal ions.
The sensitivity of the sensor to Hg2+ ions is almost an order of magnitude higher than that of other ions, which indicates that the sensor has excellent anti-interference characteristics for other ions. In other words, the sensor has good lead ion selectivity. The excellent Specificity will enable the sensor for effective Pb2+ detection in water environments contaminated by multiple heavy metal ions, such as industrial sewage, underground water, and drinking water.
3.4. Repeatability and Stability of the Sensor
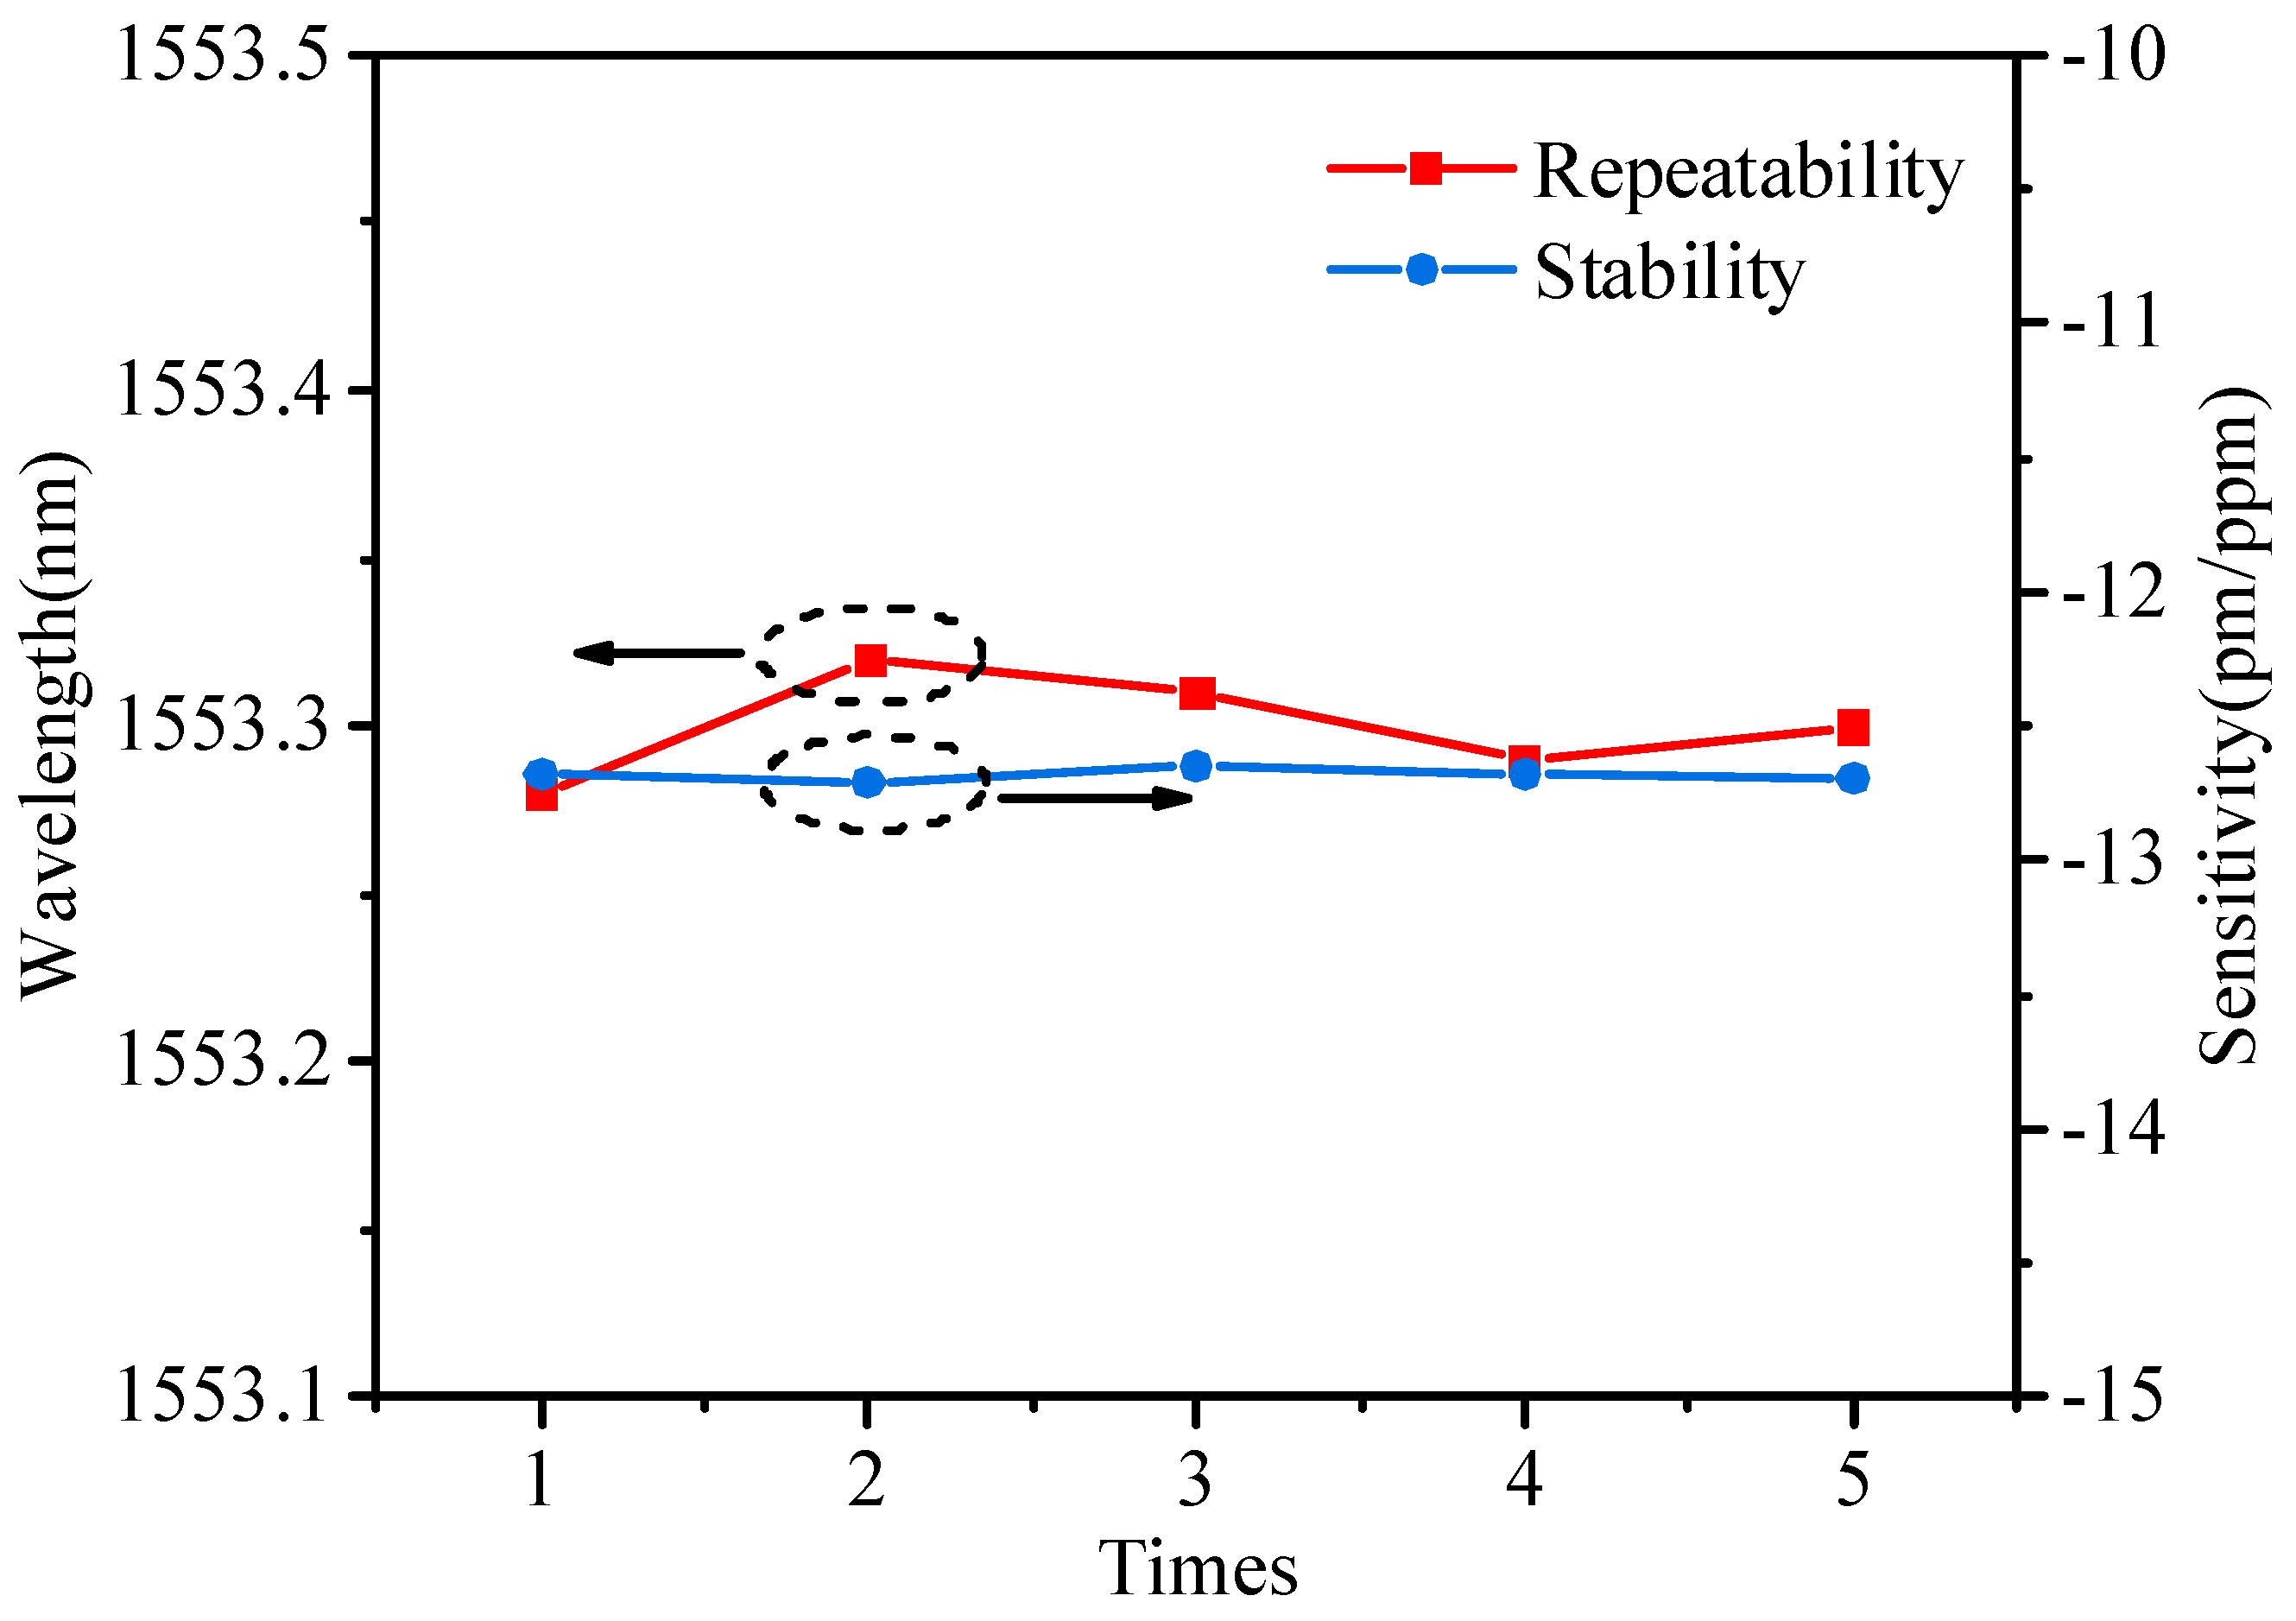
To verify the reproducibility, the repeatability and stability of the sensor were studied, and multiple elution experiments were performed on the sensor. The ions attached to the modified CS must be removed using the eluent EDTA before carrying out each Pb2+ ion concentration detection. Every time the sensor is eluted, the transmission spectra of the sensor must be constantly monitored to ensure that they return to the wavelength position before the detection of Pb2+ ion concentration. In addition, the temperature and refractive index of the solution must be strictly controlled for each experiment. Figure 11 shows the wavelength positions of the original transmission spectra after several elution experiments compared to the first Pb2+ ion concentration detection experiment, with the original wavelength positions of the sensor being 1553.28 nm, 1553.32 nm, 1553.31 nm, 1553.29 nm, and 1553.30 nm in order. The eluting results show that the sensitive film has good elution characteristics and can be utilized repeatedly.
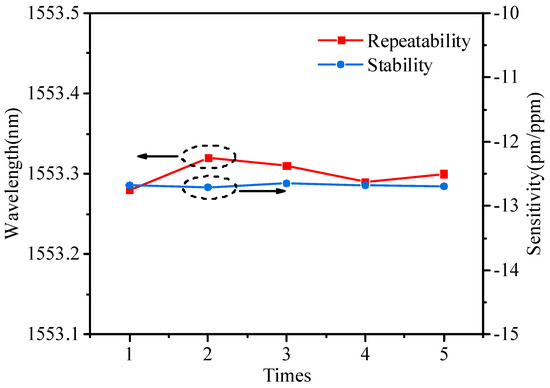
Figure 11.
Repeatability and stability of the sensor.
Multiple sensitivity experiments were carried out on the sensor to assess its stability, and each ion detection was carried out while the sensor was mounted on the optical experimental platform to eliminate the effect of vibration on the experiments. The experimental results are shown in Figure 11, from which it can be seen that the sensitivities of the sensors are −12.71 pm/ppm, −12.65 pm/ppm, −12.68 pm/ppm, and −12.70 pm/ppm in order. The standard deviation of the sensor is 0.023, and the detection limit is 5.44 ppb. The results show that the sensor has excellent stability in the detection of Pb2+ ion concentration.
3.5. Effect of pH and Temperature on the Sensor
CS is easily soluble in a weakly acidic environment, and the presence of Pb2+ in solutions of different pH values varies. It exists mostly in the form of Pb2+ at pH < 6, while Pb (OH)2 is formed at pH > 6, and PbCO3 is produced in weak alkaline conditions. Therefore, the degree of response of the sensor to ions might be affected in solutions with different pH [33].
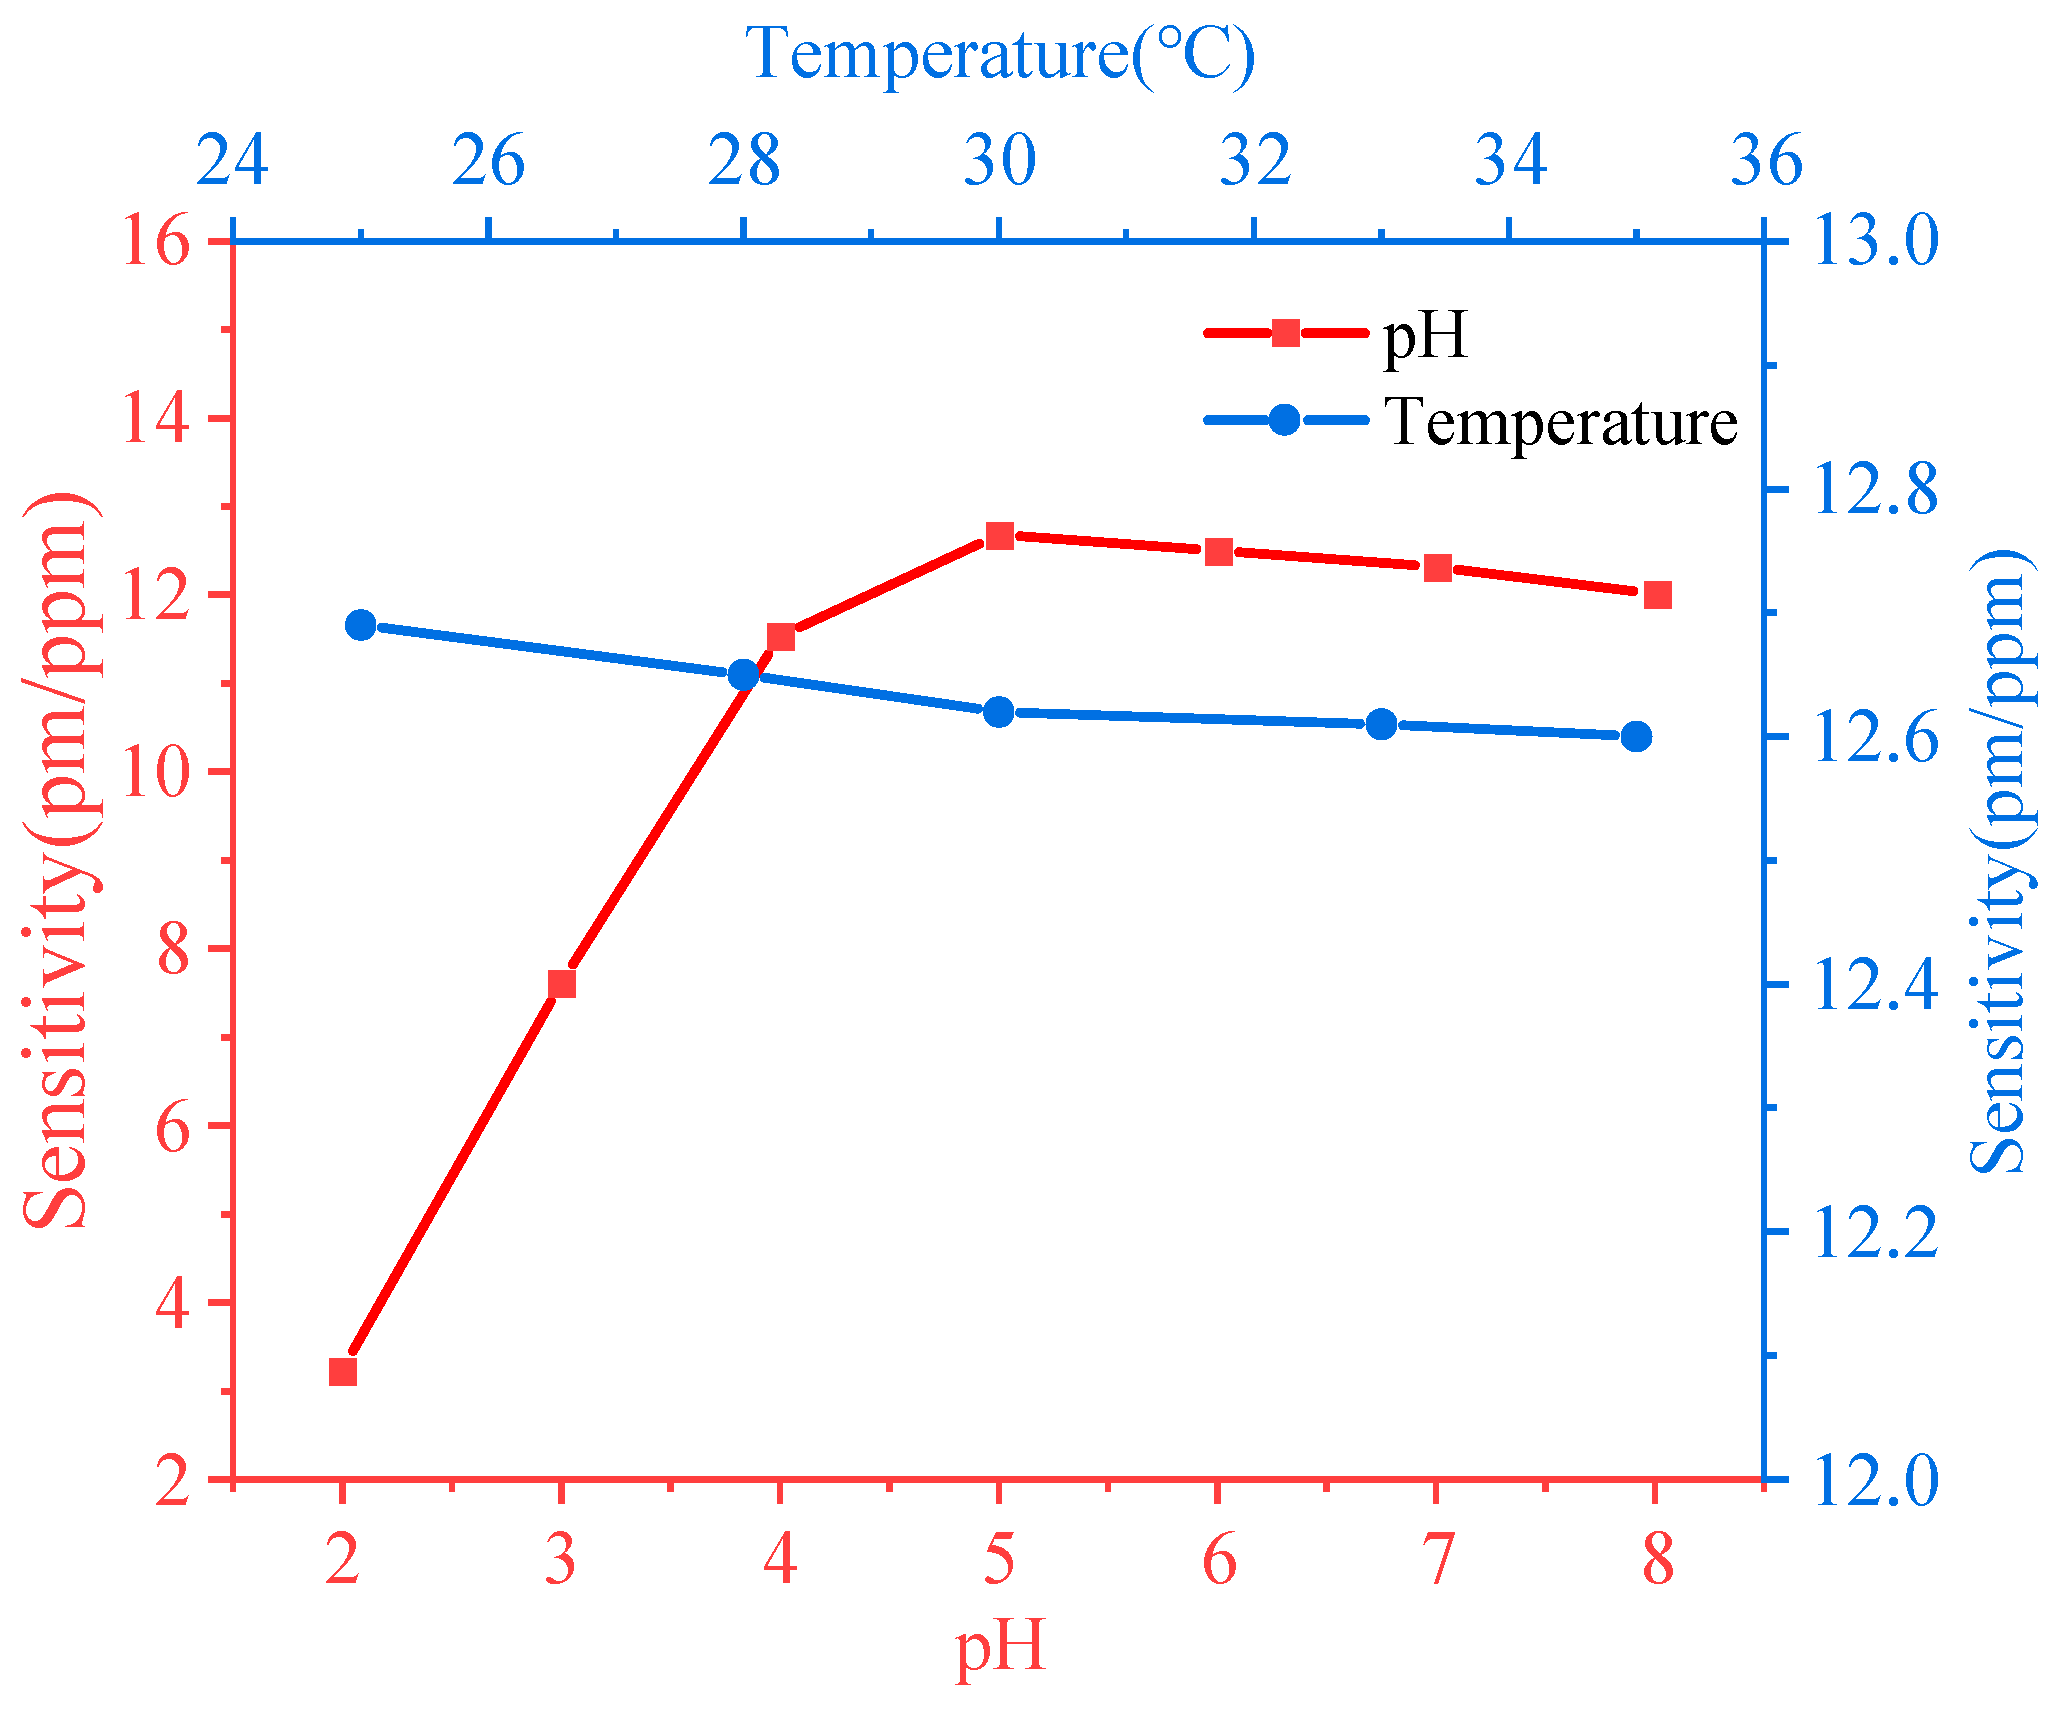
The sensitivity of the sensor to Pb2+ ion was investigated when the pH ranges from 2 to 8 and the results are shown in Figure 12. At pH < 5, the sensitivity of the sensor decreases due to the competition with Pb2+ by the excess of H+ in the water. The sensor is more sensitive to Pb2+ with a PH of about 5 due to the fact that CS is negatively charged in acidic environments and can electrostatically bind to metal cations. The sensitivity of the sensor drops because of competition between the anions in the negatively charged solution and the Pb2+ at the CS binding site at a pH of about 8.
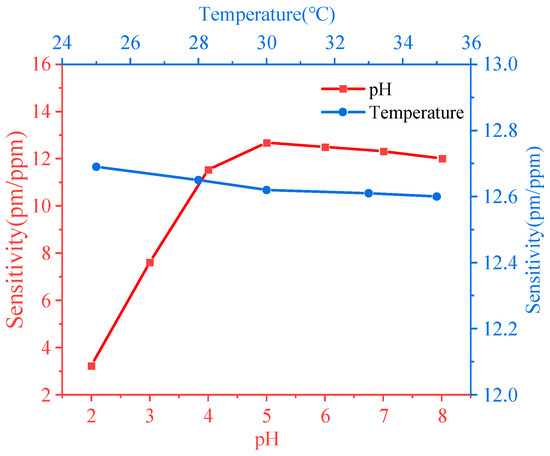
Figure 12.
Effect of different pH and temperature on sensor sensitivity.
In addition to the pH of the solution affecting the Pb2+ ion detection of the sensor, temperature is also an important factor affecting the performance of the sensor. The process of CS adsorption is exothermic, and the increasing temperature of the solution decreases the amount of CS adsorption for Pb2+ ions. The sensing performance of the sensor for Pb2+ ions at different temperatures was investigated, as shown in Figure 12. The sensitivity of the sensor for Pb2+ ions decreases gradually with increasing temperature in the range of 25–35 °C. This can be attributed to the fact that the increase in temperature causes a redshift in the interference wavelength, which reduces the sensitivity of the sensor. In addition, the adsorption performance of IIP-CS for Pb2+ ions decreased with increasing temperature. It is worth pointing out that the sensitivity of the sensor varies less than 1.6% within 10 °C variation, which effect on the sensor could be negligible when the experiments are carried out at temperature ranges from 25 to 35 °C.
4. Conclusions
In conclusion, this work proposes a novel optical fiber sensor with a bullet-like hollow cavity based on IIP-CS for trace detection in solution. The bullet-shaped hollow cavity can be obtained by welding discharge of one end of the hollow-core fiber, which cavity can effectively excite the higher-order cladding modes and improve the sensitivity of the sensor. The sensor coated with IIP-CS film has high sensitivity and specificity for Pb2+ ions, whose sensitivity is −12.68 pm/ppm and ranges from 0 ppm to 350 ppm with a detection limit of 5.44 ppb. In addition, the sensor has the advantages of excellent selectivity, repeatability, and stability, which makes its potential application valuable for environmental monitoring and biomedical applications.
Author Contributions
L.Z.: Methodology, Formal Analysis, Investigation, Data Curation, Writing—Original Draft, Funding Acquisition. H.H.: Investigation, Writing—Review and Editing, Supervision. S.Z.: Data Curation, Writing—Review and Editing, Supervision, Project Administration. Y.X.: Methodology, Visualization, Formal analysis. R.P.: Visualization, Formal Analysis. W.Y.: Writing—Review and Editing, Resources, Supervision, Funding acquisition. All authors have read and agreed to the published version of the manuscript.
Funding
This work was supported in part by the National Key R&D Program of China (No. 2019YFC1804802) and the Natural Science Foundation for Post-doctoral Scientists of Heilongjiang Province (Grant No. LBH-Z22193).
Institutional Review Board Statement
Not applicable.
Informed Consent Statement
Not applicable.
Data Availability Statement
Data are contained within the article.
Conflicts of Interest
The authors declare no conflicts of interest.
References
- Zhang, L.J.; Yang, W.L.; Zhang, C.; Pan, R.; Chen, Q.L.; Zhang, L.Y. Cu2+-imprinted optical fiber SPR sensor for intelligent recognition. Opt. Express 2022, 30, 45525–45537. [Google Scholar] [CrossRef] [PubMed]
- Mosai, A.K.; Chimuka, L.; Cukrowska, E.M.; Kotzé, I.A.; Tutu, H. The recovery of Platinum (IV) from aqueous solutions by hydrazine-functionalised zeolite. Miner. Eng. 2019, 131, 304–312. [Google Scholar] [CrossRef]
- Ahmed, Z.; Asghar, M.M.; Malik, M.N.; Nawaz, K. Moving towards a sustainable environment: The dynamic linkage between natural resources, human capital, urbanization, economic growth, and ecological footprint in China. Resour. Policy 2020, 67, 101677. [Google Scholar] [CrossRef]
- Boruah, B.S.; Biswas, R. An optical fiber based surface plasmon resonance technique for sensing of lead ions: A toxic water pollutant. Opt. Fiber Technol. 2018, 46, 152–156. [Google Scholar] [CrossRef]
- Fang, Y.; Ren, G.; Ma, Y.; Wang, C.; Li, M.; Pang, X.; Pan, Q.; Li, J. Adsorption and reutilization of Pb (II) based on acid-resistant metal-organic gel. Sep. Purif. Technol. 2022, 295, 121253. [Google Scholar] [CrossRef]
- Witkowska, D.; Słowik, J.; Chilicka, K. Heavy Metals and Human Health: Possible Exposure Pathways and the Competition for Protein Binding Sites. Molecules 2021, 26, 6060. [Google Scholar] [CrossRef] [PubMed]
- Ruan, S.; Ebendorff-Heidepriem, H.; Ruan, Y. Optical fiber turn-on sensor for the detection of mercury based on immobilized fluorophore. Measurement 2018, 121, 122–126. [Google Scholar] [CrossRef]
- Tytła, M. Identification of the Chemical Forms of Heavy Metals in Municipal Sewage Sludge as a Critical Element of Ecological Risk Assessment in Terms of Its Agricultural or Natural Use. Int. J. Environ. Res. Public Health 2020, 17, 4640. [Google Scholar] [CrossRef] [PubMed]
- Valasques, G.S.; Dos, S.A.M.P.; De Souza, V.S.; Teiera, L.S.G.; Alves, J.P.S.; Santos, M.D.J.; Santos, W.P.C.; Bezerra, M.A. Multivariate optimization for the determination of cadmium and lead in crude palm oil by graphite furnace atomic absorption spectrometry after extraction induced by emulsion breaking. Microchem. J. 2020, 153, 104401. [Google Scholar] [CrossRef]
- Acar, O. The use of chemical modifiers in electrothermal atomic absorption spectrometry. Appl. Spectrosc. Rev. 2024, 59, 340–354. [Google Scholar] [CrossRef]
- Ferreira, S.L.C.; Bezerra, M.A.; Santos, A.S.; dos Santos, W.N.L.; Novaes, C.G.; de Oliveira, O.M.C.; Oliveira, M.L.; Garcia, R.L. Atomic absorption spectrometry—A: Multi element technique. Trac-Trends Anal. Chem. 2018, 100, 1–6. [Google Scholar] [CrossRef]
- Yu, S.; Guo, H.R.; Yang, W.L.; Zhao, Y.Q.; Wu, H.B.; Sun, X.M.; Yu, X.Y. Depth measurement error analysis and structural parameter correction of structured light depth imager. Photonics 2024, 11, 396. [Google Scholar] [CrossRef]
- Vuković, J.; Matsuoka, S.; Yoshimura, K.; Grdinić, V.; Grubešić, R.J.; Županić, O. Simultaneous determination of traces of heavy metals by solid-phase spectrophotometry. Talanta 2007, 71, 2085–2091. [Google Scholar] [CrossRef]
- Mende, M.; Schwarz, D.; Steinbach, C.; Boldt, R.; Schwarz, S. Simultaneous adsorption of heavy metal ions and anions from aqueous solutions on chitosan Investigated by spectrophotometry and SEM-EDX analysis. Colloid Surf. A-Physicochem. Eng. Asp. 2016, 510, 275–282. [Google Scholar] [CrossRef]
- Stepka, P.; Kratochvilova, M.; Kuchynka, M.; Raudenska, M.; Polanska, H.H.; Vicar, T.; Vaculovic, T.; Vaculovicova, M.; Masarik, M. Determination of Renal Distribution of Zinc, Copper, Iron, and Platinum in Mouse Kidney Using LA-ICP-MS. Biomed Res. Int. 2021, 2021, 1–8. [Google Scholar] [CrossRef] [PubMed]
- Medvedev, N.S.; Shaverina, A.V.; Tsygankova, A.R.; Saprykin, A.I. Comparison of analytical performances of inductively coupled plasma mass spectrometry and inductively coupled plasma atomic emission spectrometry for trace analysis of bismuth and bismuth oxide. Spectroc. Acta Pt. B-Atom. Spectr. 2018, 142, 23–28. [Google Scholar] [CrossRef]
- Winter, M.; Lessmann, F.; Harth, V. A method for reliable quantification of mercury in occupational and environmental medical urine samples by inductively coupled plasma mass spectrometry. Anal. Methods 2023, 15, 2030–2038. [Google Scholar] [CrossRef] [PubMed]
- Hrastnik, N.I.; Jovanovski, V.; Hočevar, S.B. In-situ prepared copper film electrode for adsorptive stripping voltammetric detection of trace Ni(II). Sens. Actuator B-Chem. 2020, 307, 127637. [Google Scholar] [CrossRef]
- Satarug, S.; Baker, J.R.; Urbenjapol, S.; Haswell-Elkins, M.; Reilly, P.E.B.; Williams, D.J.; Moore, M.R. A global perspective on cadmium pollution and toxicity in non-occupationally exposed population. Toxicol. Lett. 2003, 137, 65–83. [Google Scholar] [CrossRef]
- Lin, Z.-T.; Lv, R.-Q.; Zhao, Y.; Zheng, H.-K. High-sensitivity salinity measurement sensor based on no-core fiber. Sens. Actuator A-Phys. 2020, 305, 111947. [Google Scholar] [CrossRef]
- Zhao, Y.; Tong, R.-J.; Chen, M.-Q.; Xia, F. Relative humidity sensor based on hollow core fiber filled with GQDs-PVA. Sens. Actuator B-Chem. 2019, 284, 96–102. [Google Scholar] [CrossRef]
- Rusyakina, O.; Baghdasaryan, T.; Chah, K.; Mergo, P.; Thienpont, H.; Caucheteur, C.; Berghmans, F.; Geernaert, T. Plasmon-Enhanced Refractometry Through Cladding Mode Excitation by a Fiber Bragg Grating in Photonic Crystal Fiber. J. Lightwave Technol. 2022, 40, 1121–1129. [Google Scholar] [CrossRef]
- Yi, D.; Liu, F.; Geng, Y.; Li, X.J.; Hong, X.M. High-sensitivity and large-range fiber optic temperature sensor based on PDMS-coated Mach-Zehnder interferometer combined with FBG. Opt. Express 2021, 29, 18624. [Google Scholar] [CrossRef]
- Huang, X.Y.; Li, X.M.; Yang, J.C.; Tao, C.Y.; Guo, X.G.; Bao, H.B.; Yin, Y.J.; Chen, H.F.; Zhu, Y.H. An in-line Mach-Zehnder Interferometer Using Thin-core Fiber for Ammonia Gas Sensing With High Sensitivity. Sci. Rep. 2017, 7, 44994. [Google Scholar] [CrossRef] [PubMed]
- Cai, Y.; Zhang, J.; Zhang, M.; Wang, M.H.; Zhao, Y. The optical fiber sensing platform for ferric ions detection: A practical application for carbon quantum dots. Sens. Actuator B-Chem. 2022, 364, 131857. [Google Scholar] [CrossRef]
- Ghosh, S.; Dissanayake, K.; Asokan, S.; Sun, T.; Rahman, B.M.A.; Grattan, K.T.V. Lead (Pb2+) ion sensor development using optical fiber gratings and nanocomposite materials. Sens. Actuator B-Chem. 2022, 364, 131818. [Google Scholar] [CrossRef]
- Cai, S.S.; Pan, H.X.; González-Vila, A.; Guo, T.; Gillan, D.C.; Wattiez, R.; Caucheteur, C. Selective detection of cadmium ions using plasmonic optical fiber gratings functionalized with bacteria. Opt. Express 2020, 28, 19740. [Google Scholar] [CrossRef] [PubMed]
- Yin, Y.; Wang, S.; Jia, S.; Ren, J.; Farrell, G.; Lewis, E.; Wang, P. Ultra-high-resolution detection of Pb2+ ions using a black phosphorus functionalized microfiber coil resonator. Photonics Res. 2019, 6, 622–629. [Google Scholar] [CrossRef]
- Yap, S.H.K.; Chien, Y.; Tan, R.; Alauddin, A.R.S.; Ji, W.B.; Tjin, S.C.; Yong, K. An Advanced Hand-Held Microfiber-Based Sensor for Ultrasensitive Lead Ion Detection. ACS Sens. 2018, 3, 2506–2512. [Google Scholar] [CrossRef]
- Yi, Z.; Zhou, Y.; Ren, Y.; Hu, W.; Long, F.; Zhu, A. A novel sensitive DNAzyme-based optical fiber evanescent wave biosensor for rapid detection of Pb2+ in human serum. Analyst 2022, 147, 1467. [Google Scholar] [CrossRef]
- Li, G.S.; Liu, Z.; Feng, J.X.; Zhou, G.Y.; Huang, X.G. Pb2+ fiber optic sensor based on smart hydrogel coated Mach-Zehnder interferometer. Opt. Laser Technol. 2022, 145, 107453. [Google Scholar] [CrossRef]
- Nazari, M.; Amin, A.; Eden, N.T.; Duke, M.C.; Cheng, C.; Hill, M.R. Highly-efficient sulfonated UiO-66(Zr) optical fiber for rapid detection of trace levels of Pb2+. Int. J. Mol. Sci. 2021, 11, 6053. [Google Scholar] [CrossRef] [PubMed]
- Suc, N.V.; Ly, H.T.Y. Lead (II) removal from aqueous solution by chitosan flake modified with citric acid via crosslinking with glutaraldehyde. J. Chem. Technol. Biotechnol. 2013, 88, 1641–1649. [Google Scholar] [CrossRef]
Disclaimer/Publisher’s Note: The statements, opinions and data contained in all publications are solely those of the individual author(s) and contributor(s) and not of MDPI and/or the editor(s). MDPI and/or the editor(s) disclaim responsibility for any injury to people or property resulting from any ideas, methods, instructions or products referred to in the content. |
© 2024 by the authors. Licensee MDPI, Basel, Switzerland. This article is an open access article distributed under the terms and conditions of the Creative Commons Attribution (CC BY) license (https://creativecommons.org/licenses/by/4.0/).

