1. Introduction
The use of optical fiber for distributed sensing of environmental processes has rapidly expanded in the last two decades. Advances in Raman, Brillouin and Rayleigh backscatter measurements allow for the nearly continuous measurement of fiber temperature, strain and strain rate over kilometers of fiber and are now widely applied in earth and space sciences [
1,
2,
3]. In this work, we focus on Raman backscatter approaches, as temperature is of fundamental importance in ocean sciences and glaciology, and Raman DTS is now widely used by the earth and ocean scientific communities. Whether fiber is installed specifically for sensing or existing telecommunication fibers are used for sensing, fibers are typically heavily protected against stress and large strains, as either can significantly change the attenuation of the backscattered light, as early work documented attenuation issues along with potential solutions associated with hydrostatic pressure [
4,
5,
6]. Changes in attenuation of the optical path, either in time or space, will lead to uncertainties in the resolved temperature or strain. Increased attenuation due to strain such as micro bends will also greatly reduce the range of measurement.
To avoid or reduce these issues, sensing fiber in earth sciences is generally armored in some manner to avoid stress reaching the fiber and designed such that large strains (typically > 0.1%) are not seen by the fiber. A common solution is to jacket the fiber(s) in a small metal tube (fiber in metal tube or FIMT) to eliminate the direct application of stresses to the fiber. Such designs are commonly used in electrical power lines and oil, gas and geothermal wells for monitoring. Additional attenuation impacts can also be addressed, at least for Raman temperature sensing, by using a duplexed fiber arrangement [
7,
8]. However, this also adds complexity to the fiber cable. In all cases, armoring comes with significant penalties of weight, ease of deployment and loss of direct connection with the environment to be sensed.
Typical remotely operated vehicles (ROVs) used in the offshore industry and oceanography use large-diameter umbilicals and cables comprised of copper conductors for power and one or more armored fiber optic elements for communication. Hybrid designs that carry their own batteries eliminate the need for power, enabling the use of tethers with dramatically reduced diameters; however, armoring, strength members, and jacketing (typically to achieve neutral buoyancy) limit the practical minimum diameter of such tethers to a few mm. Nevertheless, tether lengths up to 25 km have been fabricated [
9]. At extreme lengths or depths, even such communications-only tethers become impractical, either because of the size of the winches involved if payed out from the vehicle, or the influence on vehicle dynamics if towed. In these cases, bare fiber tethers provide unparalleled compactness with negligible impact on vehicle performance, at the expense of being unrecoverable and therefore single-use only. The Nereus Hybrid Remotely Operated Vehicle (HROV) dived to the bottom of the Mariana Trench (11,000 m) in 2009 using a bare fiber system for communication composed of two dispensers, one at a depressor suspended from the ship and another in a tow-body pulled behind the vehicle [
10,
11].
The Nereid Under Ice (NUI) vehicle uses a derivative of the Nereus system to permit multi-km excursions under ice [
12]. A 2015 shallow-water engineering trial with the NUI vehicle in Cape Cod Bay showed the potential for also using DTS with a bare fiber tether (
Figure 1). Communications to the vehicle were periodically interrupted to permit interrogation of the fiber with a DTS (1/min). The depth of the tether along its length could be approximately determined by comparing the temperature along the tether against a background temperature profile collected using conventional oceanographic profilers. Challenges associated with the approach included tradeoffs between temperature, spatial and temporal resolution (rendered extreme relative to a static installation because of the vehicle’s motion and the tether’s descent through the water column), and point losses from contact between the fiber and lobster pot buoy lines and objects on the seafloor. The data were of sufficient resolution to definitively determine what portions of the tether were above or below the thermocline. The 45 m summertime stratified water column consisted of relatively well-mixed top and bottom layers separated by a ~10 °C thermocline between 10 and 25 m depth. The trace in
Figure 1 shows that significant spans of tether were suspended between buoy lines, consistent with optical time domain reflectometer (OTDR) data that show point losses typical of tight bends at either end of these spans.
A second recent development is that of “Philberth”-type melt probes [
13,
14] for vertical deployment of optical fiber in ice sheets to depths of kilometers, with the aim of using Raman distributed temperature sensing (DTS) [
15] to measure englacial temperature profiles. Because logistical costs of melt probe deployment are relatively low, temperature profiles could be acquired at more numerous locations to investigate subglacial basal conditions and geothermal fluxes (which are presently poorly known but are key to ice flow modeling [
16]. However, FIMT cannot be spooled in melt probes of practical size, while “bare” fiber can be. We are therefore also motivated to investigate the feasibility of DTS on “bare” fiber at or near the bases of ice sheets.
Currently the subject of laboratory-based investigation, the use of lightly armored optical tethers is also being explored for future space missions to the ice-covered moons of Jupiter and Saturn. In this eventual application, the optical fiber would be used as a telecommunications link between a melt probe descending through the moon’s ice crust and a surface communications station for telemetry return to earth [
17]. Differing from currently fielded tethers in an oceanographic setting, these tethers must withstand the forces of freezing as well as strain resulting from tidally induced deformation of the surrounding ice crust [
18] and the damaging effects of cosmic radiation during transit and on the moon’s surface. In this work, we focus only on quantifying the response of fibers under pressure only, both for their suitability as telecommunications links and as a means of distributed sensing, to further inform their use in novel settings.
In addition to bare fiber tethers, recent work developed and documented that pressures up to 127 MPa (1270 bars) can be tolerated by optical fibers and still maintain sufficient light transmissive behavior so as to serve as telecommunications links [
19]. Up to this time, however, there has been little if any quantitative testing reported to determine how such stresses will impact their use for distributed sensing, particularly with respect to changes in the differential attenuation as a function of pressure. Recent work [
20] at ocean depths of over 2000 m showed that multimode fiber without metal tube jacketing could successfully observe ocean bottom heat fluxes variations with no apparent degradation of the Raman backscatter signal. However, in this case, the fiber was uniformly at the same fluid pressure, while most tether applications would subject the fiber to a spatial distribution of pressures.
The use of bare fiber tethers is also not without some environmental costs, as they may be unrecoverable. However, the portion between the deploying vessel in the ocean and the break can be retrieved, and fibers frozen into glaciers and deep ice will likely be entombed for thousands of years.
Table 1 summarizes the recent applications of unarmored fibers under high-pressure environments in oceanography and glaciology.
In many ocean and glacier applications, the radial stress field on the optical fiber tether will range from atmospheric at the surface to hundreds of bars of fluid pressure at the distal end of the tether, which may impact the quality of Raman backscatter through changes in the differential attenuation. Attenuation of light in an optical fiber refers to the loss of optical power (photons) along the path length of fiber. A portion of fiber attenuation is caused by scattering of the sourced photons within the fiber. For telecommunications in fiber, the magnitude of attenuation along with the optical input and detection capacity of the receiver determines the distance over which information can be transmitted. For distributed sensing along optical fibers, scattering, and specifically back-scattered photons, is critical for the estimation of strain, strain rate and temperature. As a result, distributed sensing requires some minimum level of scattering in order to produce a backscattered signal, but the magnitude of attenuation sets the limits (along with the input optical power and receiver sensitivity) on the range of measurement.
Attenuation can be defined from Beers law as:
where
I(
z) represents the observed intensity at distance,
z, down the fiber,
I0 is the input power, and α represents the (generally wavelength-dependent) attenuation coefficient (L
−1). Attenuation can also be expressed as dB/km, where α
dB/L = 10/ln(10) × α. While attenuation is important for all optical fiber applications, it is particularly important for Raman DTS, in which fiber temperature controls the ratio of the probability of Stokes and anti-Stokes photon generation during scattering. As these photons return at different wavelengths (inelastic scattering), attenuation at wavelengths other than the light source wavelength is also important. The differential attenuation, Δ
α(
z), defined as the difference between Stokes and anti-Stokes frequency attenuation, appears in integral form in the commonly used formulation for inversion of temperature, Δ
α(
z)
= αS(
z) −
αaS(
z)
, from optical returns [
15] as follows:
where γ represents the energy shift in photons between incident and scattered Raman photons,
Is and
IaS represent the intensity of the Stokes and anti-Stokes backscatter, respectively, and
C is a dimensionless parameter including properties of both the source laser and the DTS instrument. Because the two Raman signals are returning to the DTS detector at slightly different wavelengths, they will be attenuated differently. Furthermore, strain or defects in the fiber can also influence attenuation and may impact the two frequencies differently. As a result, it is critical to DTS measurements that the spatial distribution of attenuation for both Stokes and anti-Stokes frequencies be known or estimable. While it is common practice to assume that the differential attenuation be uniform with fiber distance, this may not always be the case, in particular when stress or strain varies along the fiber. Such cases would include fiber used in deep-ocean ROV or ice probe tethers, which traverse pressures from atmospheric to hundreds of bars of pressure. To overcome spatially dependent differential attenuation, either the functional form of the differential attenuation as a function of distance (depth) must be known and integrable, or a duplexed fiber arrangement can be designed, in which incident light is sent in both directions through the fiber, in what is known as “double-ended” measurement. This approach can more easily accommodate gradual and localized changes in fiber attenuation and is generally considered an optimal design for temperature-sensing [
4]. However, it does require a second fiber and connectivity of the fibers at the distal end of the sensing cable. For deep-sea and deep-ice installations, where fiber volume may need to be minimized and/or we must have the ability to also use the fiber for data transmission, it is generally impossible to use duplexed fibers.
For other distributed measurements, such as Brillouin- and Rayleigh-based strain rate, spatial distribution of attenuation should not significantly impact the frequency shifts or phase shift used in these techniques, respectively. However, changes in attenuation with stress are still important to these measurements as increases in attenuation will ultimately limit the range of detection of these methods.
In this work, we focus on testing the impacts of fluid pressure on differential attenuation of the Raman frequencies used to derive temperatures along a single strand of optical fiber (sometimes referred to as “simplex geometry”). Should differential attenuation change over pressures typically found by ROVs in oceans and ice, then a functional form for the changes in attenuation in Equation (2) must be known a priori in order to calculate fiber temperatures arrayed vertically through a pressure field, particularly if the fiber is used in simplex geometry.
2. Methods and Materials
Two lightweight optical fibers were tested in this study, ~1200 m of Corning “ClearCurve” OM4 multimode fiber and ~3400 m of Corning SMF-28 single-mode fiber. Both fibers consist of only glass fiber and a thin acrylate coating (total fiber diameter ~250 μm). In the parlance of telecommunications, these are considered “bare fibers”. The fibers were spooled on standard telecom bare fiber spools. Fibers were terminated in ST fiber connectors at one end and left unconnected on the downstream end.
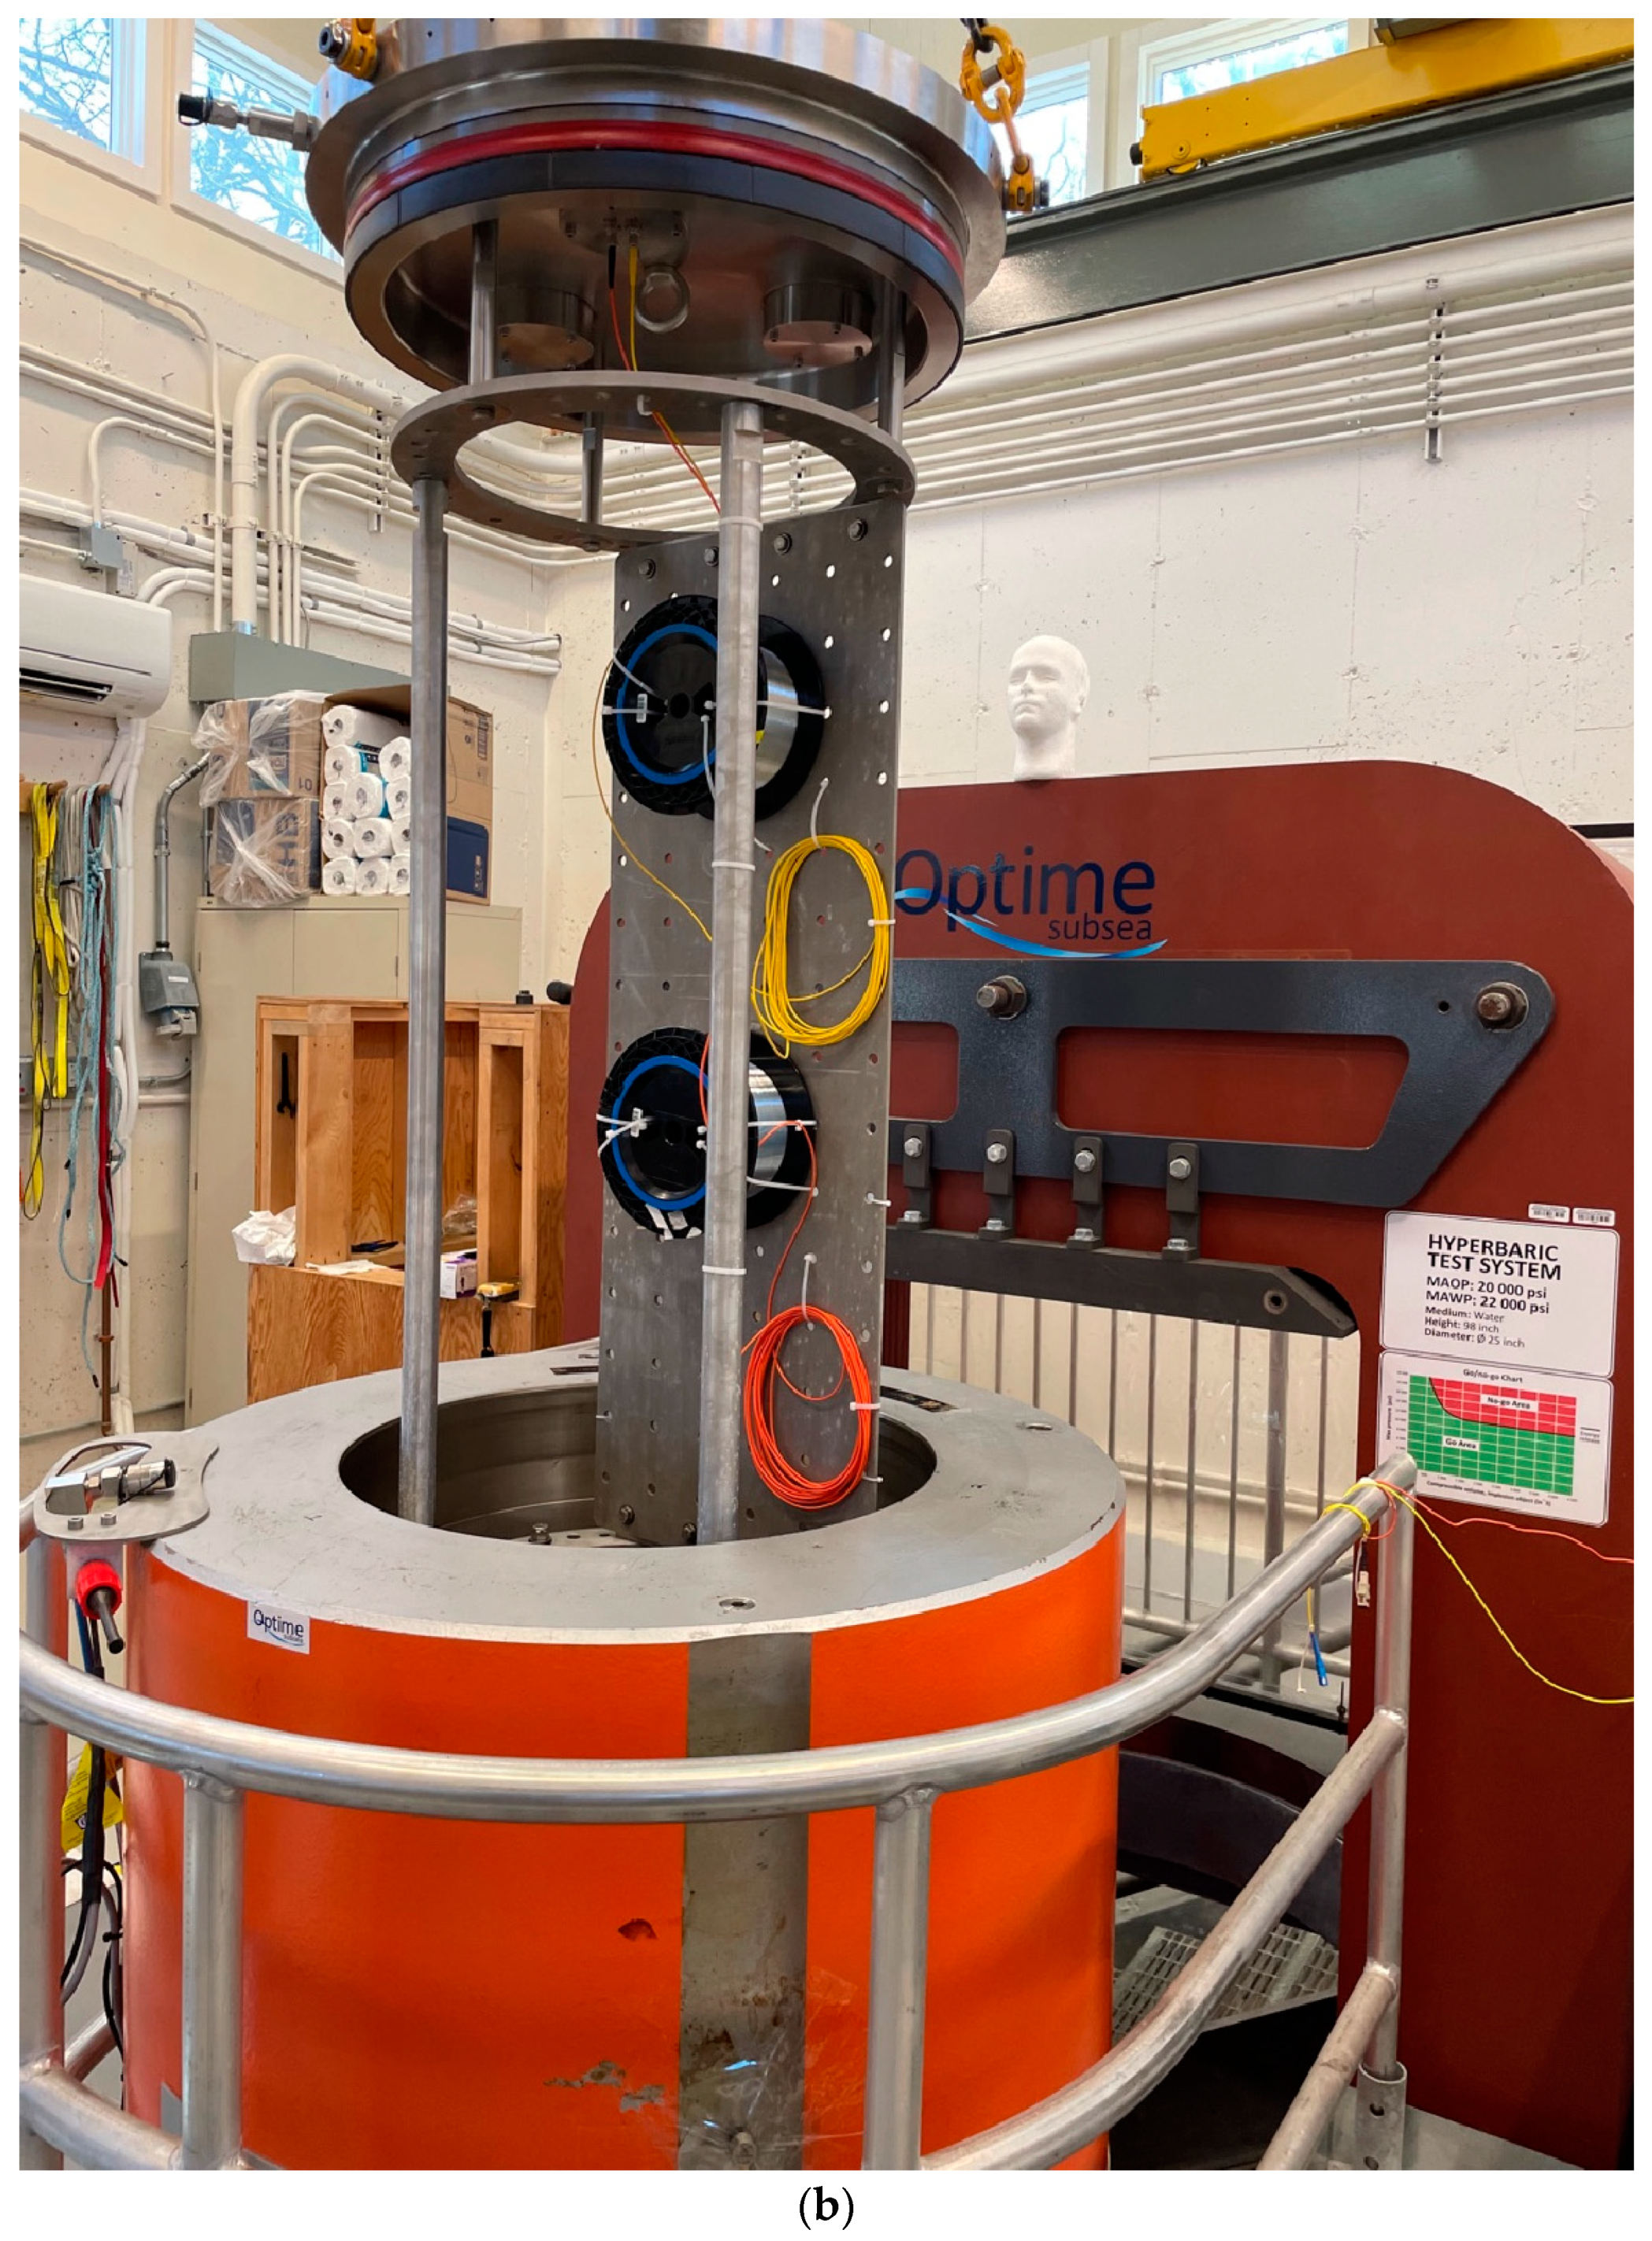
The pressure testing took place at the Woods Hole Oceanographic Institution (WHOI) Hydrostatic Test Facility. The vessel used was an Optime Subsea 375-20-127 pressure vessel capable of pressures from 75 psi (5.17 bar) to 20,000 psi (1378.951 bar). The vessel was filled with fresh water. The vessel had a 25” (63.5 m) internal diameter and was 8 ft (2.44 m) in depth and was an automated system. Pressure was built up in the vessel by using a Hydratron PU-DHDA118/4-N 23.7ksi air actuated hydraulic pump. Air pressure supplied to the Hydratron pump was 116 psi (8 bar) and was generated by a Quincy QGVD-30 air compressor. Water supplied to the Hydratron pump was supplied using the town water source at between 70 psi (4.83 bar) and 85 psi (5.86 bar). Pressure in the vessel was measured and reported using a Paroscientific Digiquartz Model 9000-20K-101 pressure transducer with an accuracy of +/−0.01%. That pressure was graphed using the Optime Subsea platform and an in-house acoustic emission sensing program developed using Labview platform. Temperature in the pressure vessel was transmitted in real time using a Hyptech S001MKL341A20P2000U Transmitter. The controlled release of pressure was done using a combination of Butech air actuated needle valves and SMC and autoclave pressure regulators, which are part of the Optime Subsea system.
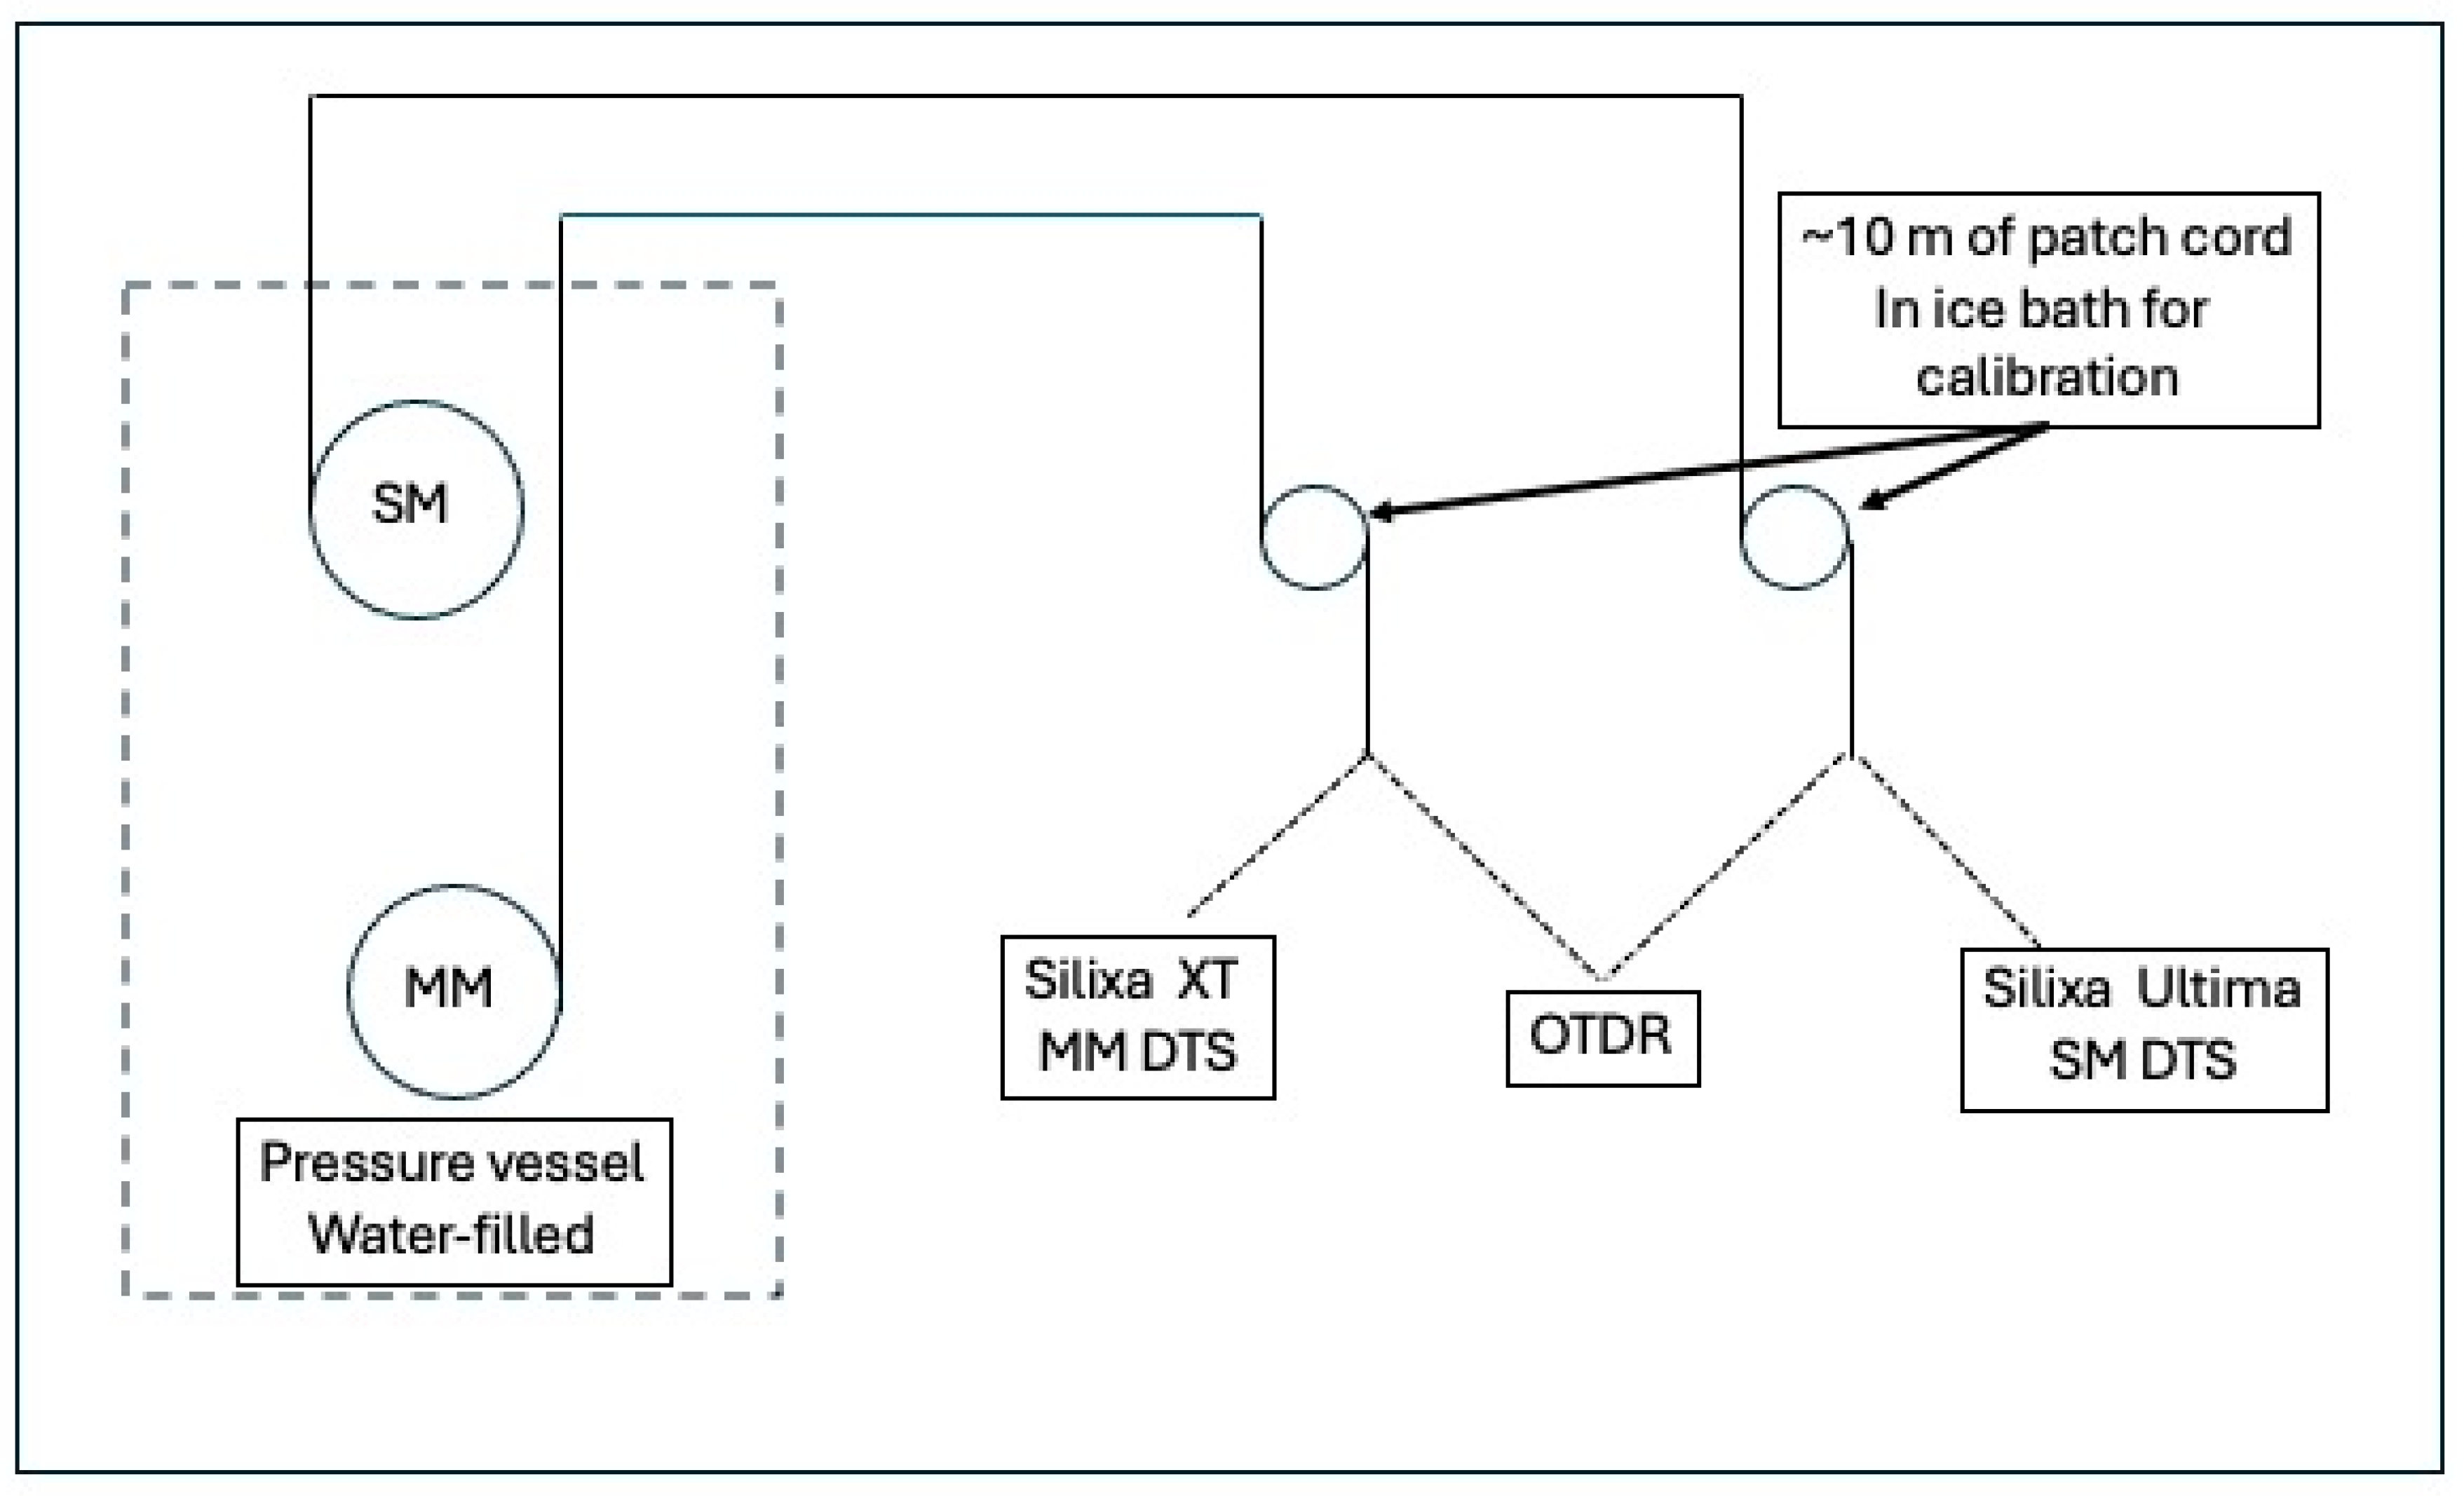
Both fiber spools were suspended (in fresh water) in the pressure vessel with a pressure bulkhead ST-ST fitting connecting them through the topside of the vessel. Launch cables of 100 m fiber length were connected to the topside of the bulkhead via patch cables and connected to (a) Silixa Ultima Single Mode Distributed Temperature system (source wavelength = 1550 nm) and (b) Silixa XT Multimode (source wavelength 1064 nm) DTS (Silixa Ltd., Hertfordshire, UK). Portions of each of the patch cables were maintained in a 0 °C ice bath to monitor instrument drift. Each fiber could be detached from its dedicated DTS and connected to an optical time domain reflectometer (OTDR) to independently measure the optical attenuation at 1310, 1550 and 1625 nm (single-mode fiber) and 850 and 1300 nm (multimode) wavelengths. Attenuation was measured throughout each fiber and reported here for representative sections of each fiber. All OTDR attenuations are reported as dB/km.
Figure 2a shows a schematic of the major components of the fiber testing experiment, while
Figure 2b is a photograph of the rack-mounted fiber spools being lowered into the hyperbaric test chamber.
Two sets of pressure experiments were conducted to observe the relationship between differential attenuation and fluid pressure (equivalent of distance, z, in Equation (2)) that a sensing fiber would be subject to in a vertical deployment from the ocean or ice surface to depth. In the first, denoted as Run 1, six (6) pressure steps including one test in air, followed by submergence in ~0.75 m of water followed by steps at 51.7, 154.4, 308.2 and 517.1 bar were conducted. Following each increase in pressure, the pressure was held for 10 min, during which time OTDR measurements were taking through each fiber (Noyes M200, AFL Global, Duncan, SC, USA, sample spacing = 0.25 m). In the second round of experiments, Run 2, seven pressure steps, representing the range of typical deep-ocean and deep-ice ROV environments, were tested (1.38, 25.8, 51.7, 103.4, 206.8, 308.5, and 517.1 bar). Once a test pressure was reached, the pressure was held for a minimum of 10 min, during which time each fiber was interrogated by a DTS with 1 min integration time. In Run 2, the single-mode fiber was also interrogated via OTDR (Moog 928-OMS-4 OTDR, spatial resolution = 1.3 m), Moog Industries, Elma, NY, USA)
Following each test run, the fiber spools were removed from the test facility and examined for physical changes.
3. Analysis of Attenuation
Run 1, while primarily designed to develop preliminary data and to test all fittings and connections, demonstrated that overall attenuation was largely unaffected by pressure for either single-mode or multimode fibers.
Table 2 shows the attenuation as measured across ~1000 m in a representative central section of the spooled single-mode fiber (between 1008 and 1999.9 m) as a function of pressure at both 1310 and 1550 nm wavelengths; common wavelengths for telecommunication. Across all pressures, attenuation remained very low at both wavelengths and within the nominal range expected for single-mode fiber at atmospheric pressure. No trend in attenuation is observed and, over the range of pressures, the attenuation shows a mean of 0.26 +/− 0.05 dB/km and 0.16 +/− 0.06 dB/km for 1310 and 1550 nm, respectively. This is consistent with previous observations of the ability of bare fiber to carry communications signals from deep ocean vehicles.
Table 3 shows the corresponding attenuation as measured across a representative central portion (from 203 to 851 m) of the spooled multimode fiber as a function of pressure at both 850 and 1300 nm wavelengths, the common wavelengths for telecommunication in multimode fiber. As with the single-mode fiber, the attenuation remained very low at both wavelengths and within the nominal range expected for multimode fiber at atmospheric pressure. No trend in attenuation is observed and, over the range of pressures, the attenuation shows a mean of 1.44 +/− 0.03 and 0.27 +/− 0.07 dB/km for 850 and 1300 nm wavelengths, respectively.
Upon removal from the test chamber, no physical damage was observed in either fiber spool. However, the patch cord jackets used for the ST bulkhead fitting were displaced towards the bulkhead, suggesting some plastic deformation. Additionally, the layer of closed cell foam on the bed of the bare fiber spool was permanently compressed, resulting in the fiber windings on the spool becoming loose. However, this appeared to have no impact on light transmission, and no attempt was made to repair or replace either of these items prior to the next round of testing.
In the second set of tests, attention was focused on assessing the impacts of pressure on Raman-based DTS, specifically the impacts of pressure on the attenuation of both the Stokes and anti-Stokes frequencies used in DTS calculations of temperature. Rayleigh attenuation was only assessed in the single-mode fiber via OTDR measurements, but at a wavelength slightly longer (1625 nm) than that used by the single-mode DTS (1550 nm).
Table 4 documents the change in attenuation as measured by the OTDR as a function of pressure in Run 2 for the single-mode fiber across the same central 1000 m section (1008–1999.9 m) as in Run 1. As can be seen, attenuation at 1625 nm showed no discernable changes in attenuation over the pressure range tested.
Next, attenuation of both the Stokes and anti-Stokes frequencies was calculated over representative lengths of each fiber.
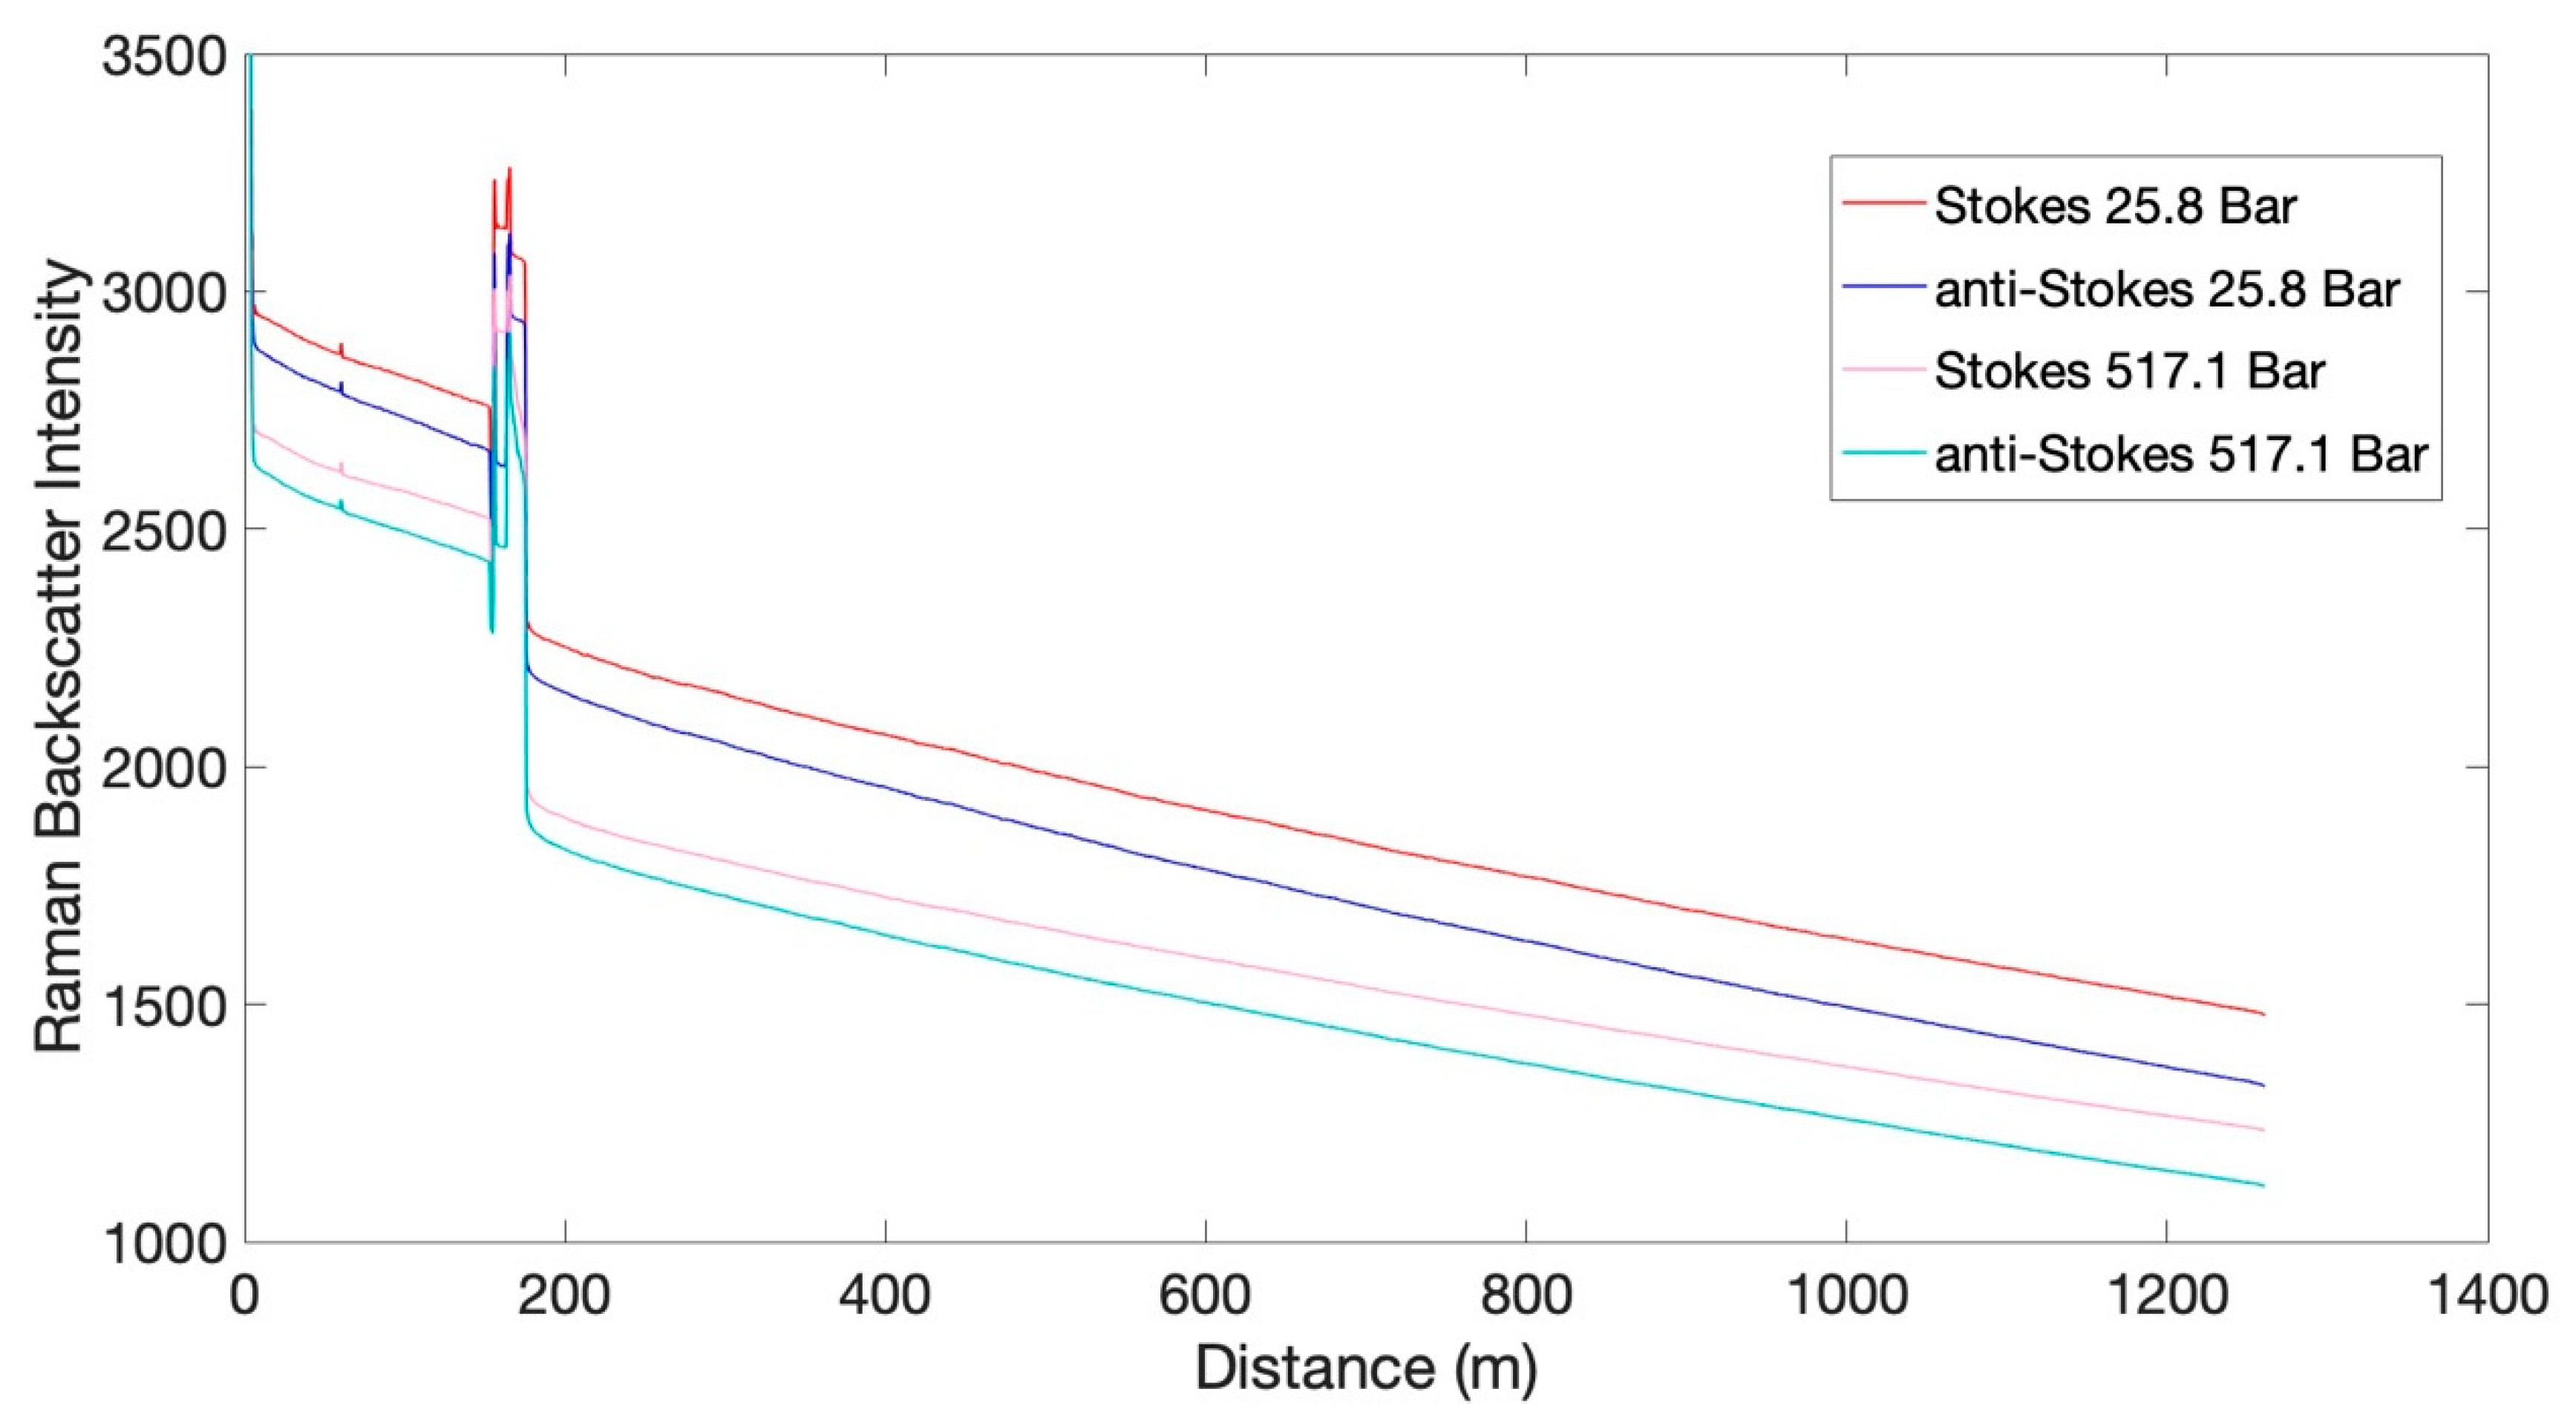
Figure 3 shows an example of the Stokes and anti-Stokes backscatter as a function of distance for two pressure steps (25.8 and 517.1 bar) for the multimode fiber. The backscatter response is typical for fiber at a uniform temperature and also shows step losses at the locations of connectors and splices. However, once beyond the connectors, the slopes of each signal are consistent and follow a weakly exponential decline as predicted by Equation (1). The difference in absolute magnitude is due primarily to differences in optical connector losses between pressure steps when connections at the DTS were changed.
For each pressure step during Run 2, the attenuation coefficients α
S and α
aS were calculated by fitting Equation (1) to the respective return intensity over the fibers. For the Raman attenuation coefficients, the fitting was conducted from beyond the range of the connector losses to the end of fiber and are presented in
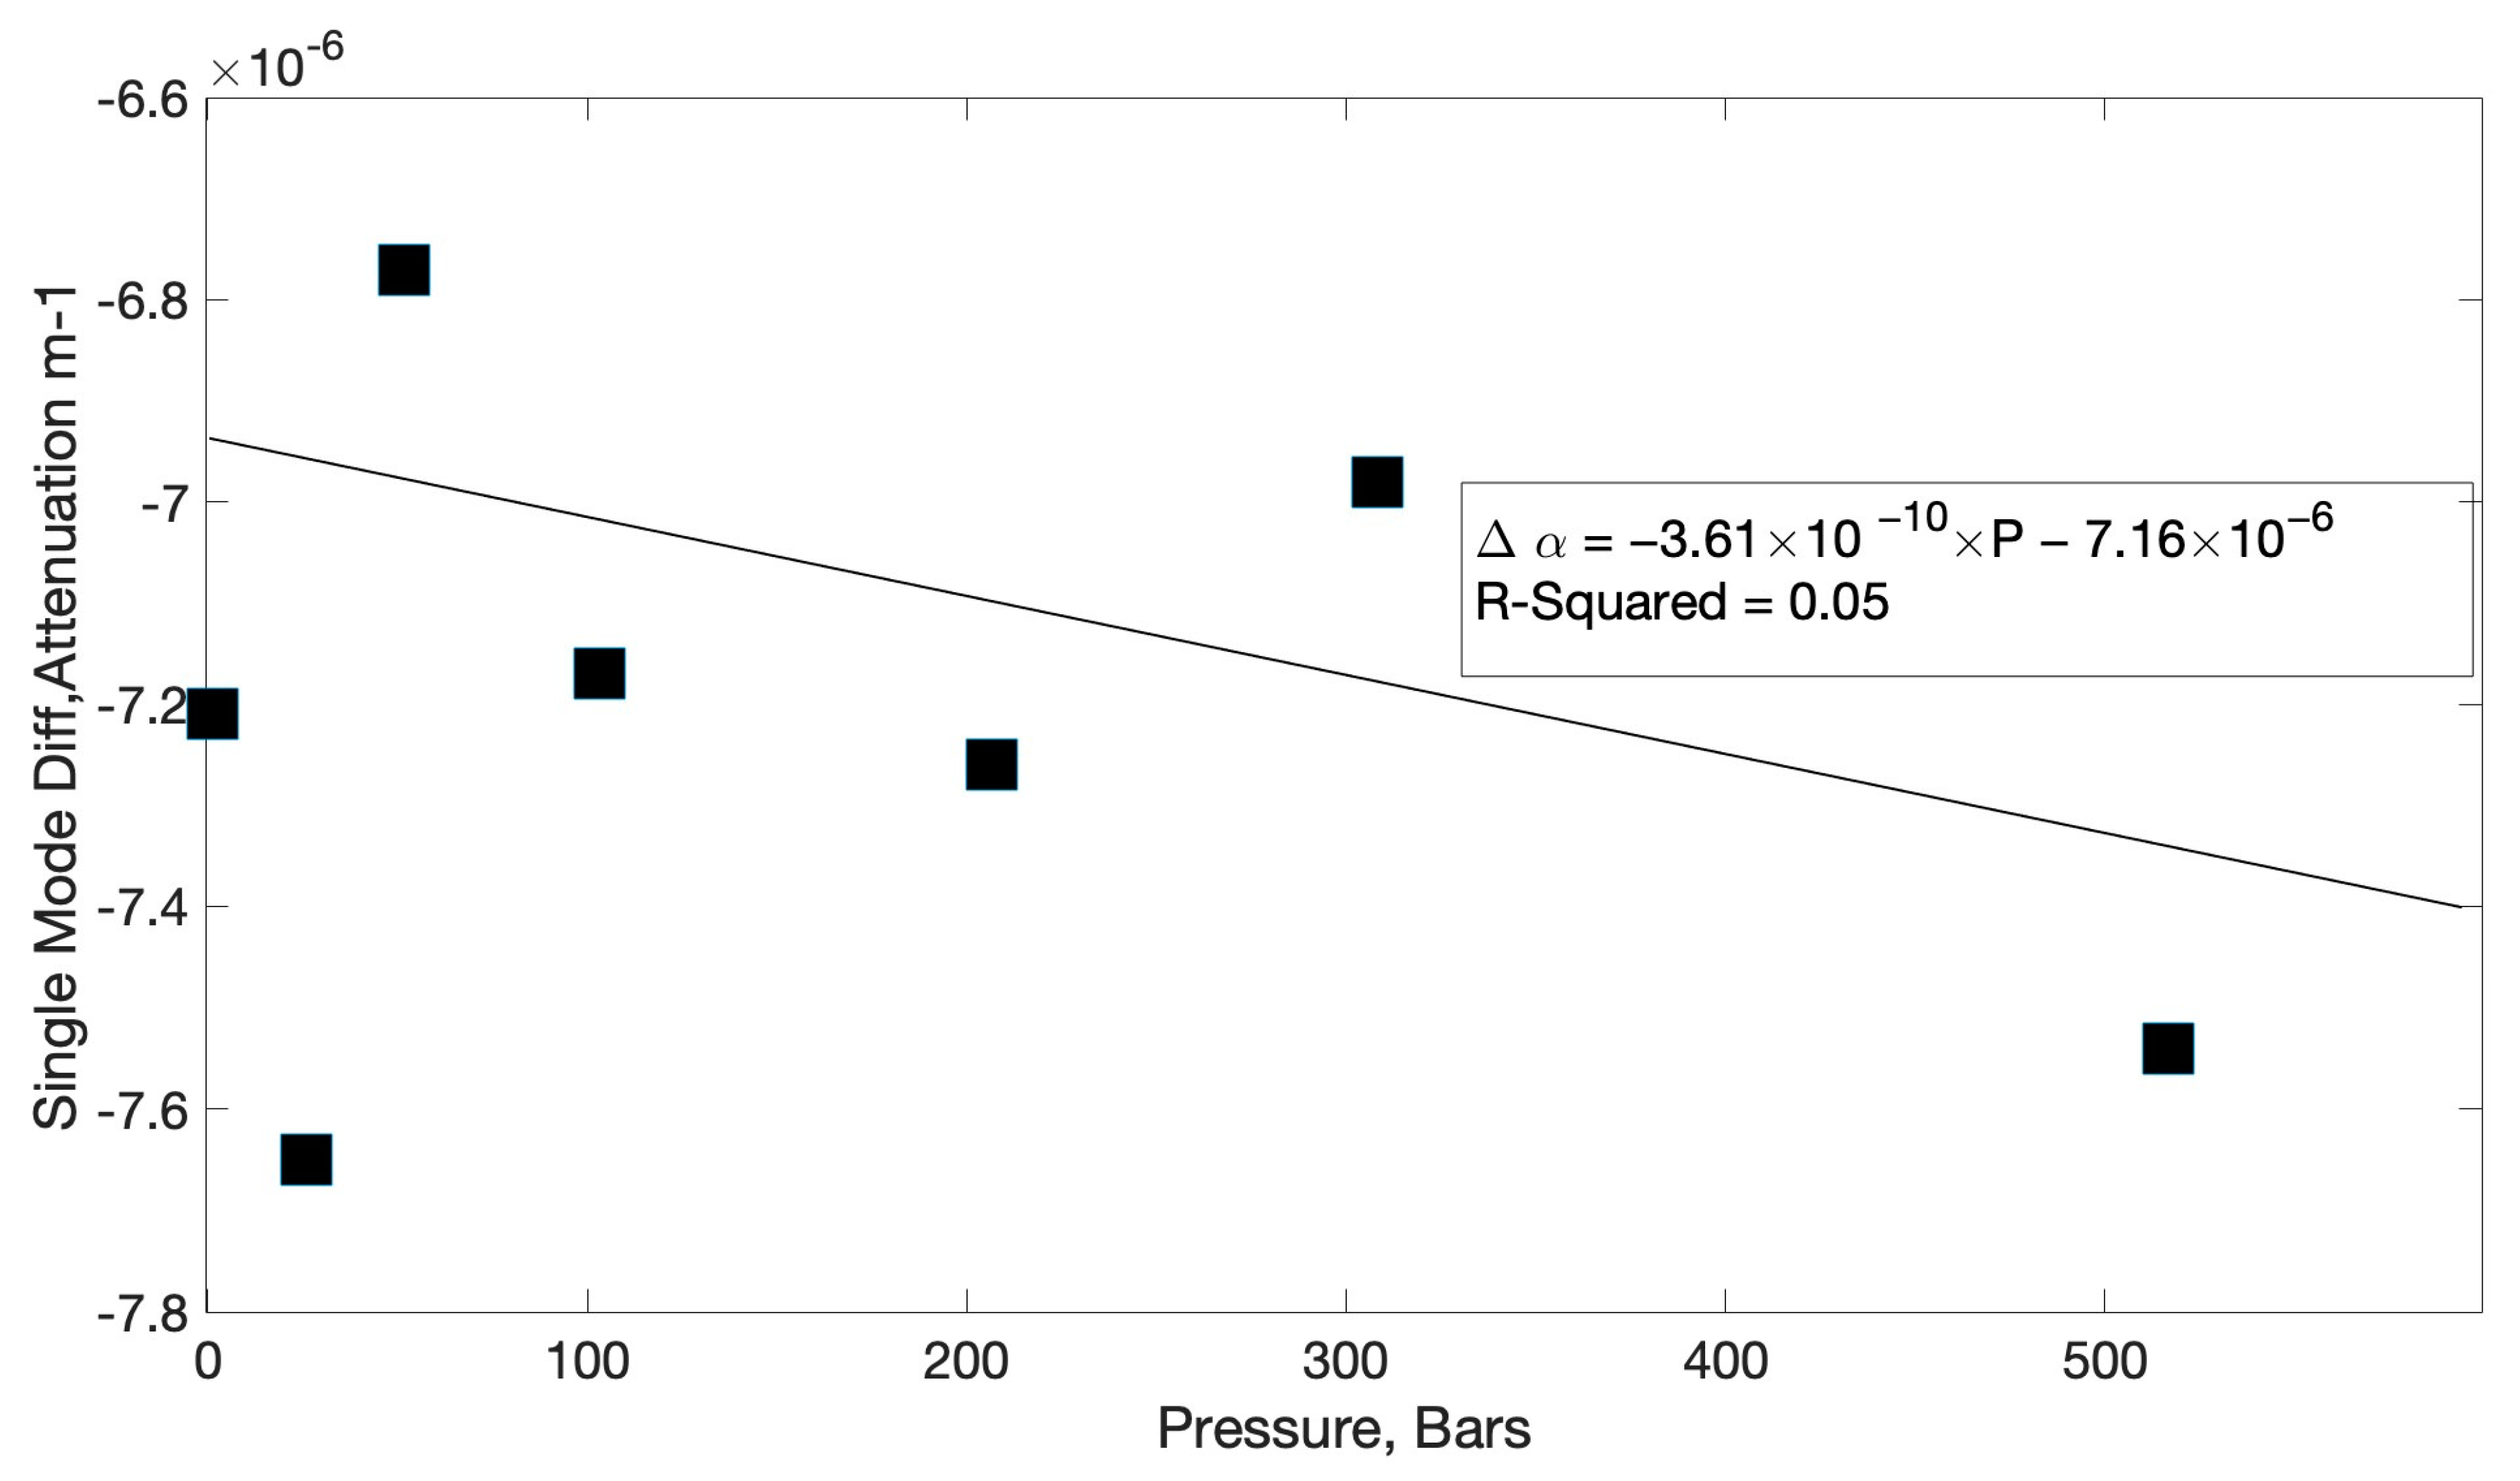
Table 5. As expected, the attenuation coefficients for single-mode fiber are smaller than the multimode fiber, which does extend the range of the single-mode fiber DTS, but also reduces its temperature-resolving capacity, as fewer Stokes and anti-Stokes photons are produced per unit length of single-mode fiber. From these data, the differential attenuation Δα as a function of pressure is presented in
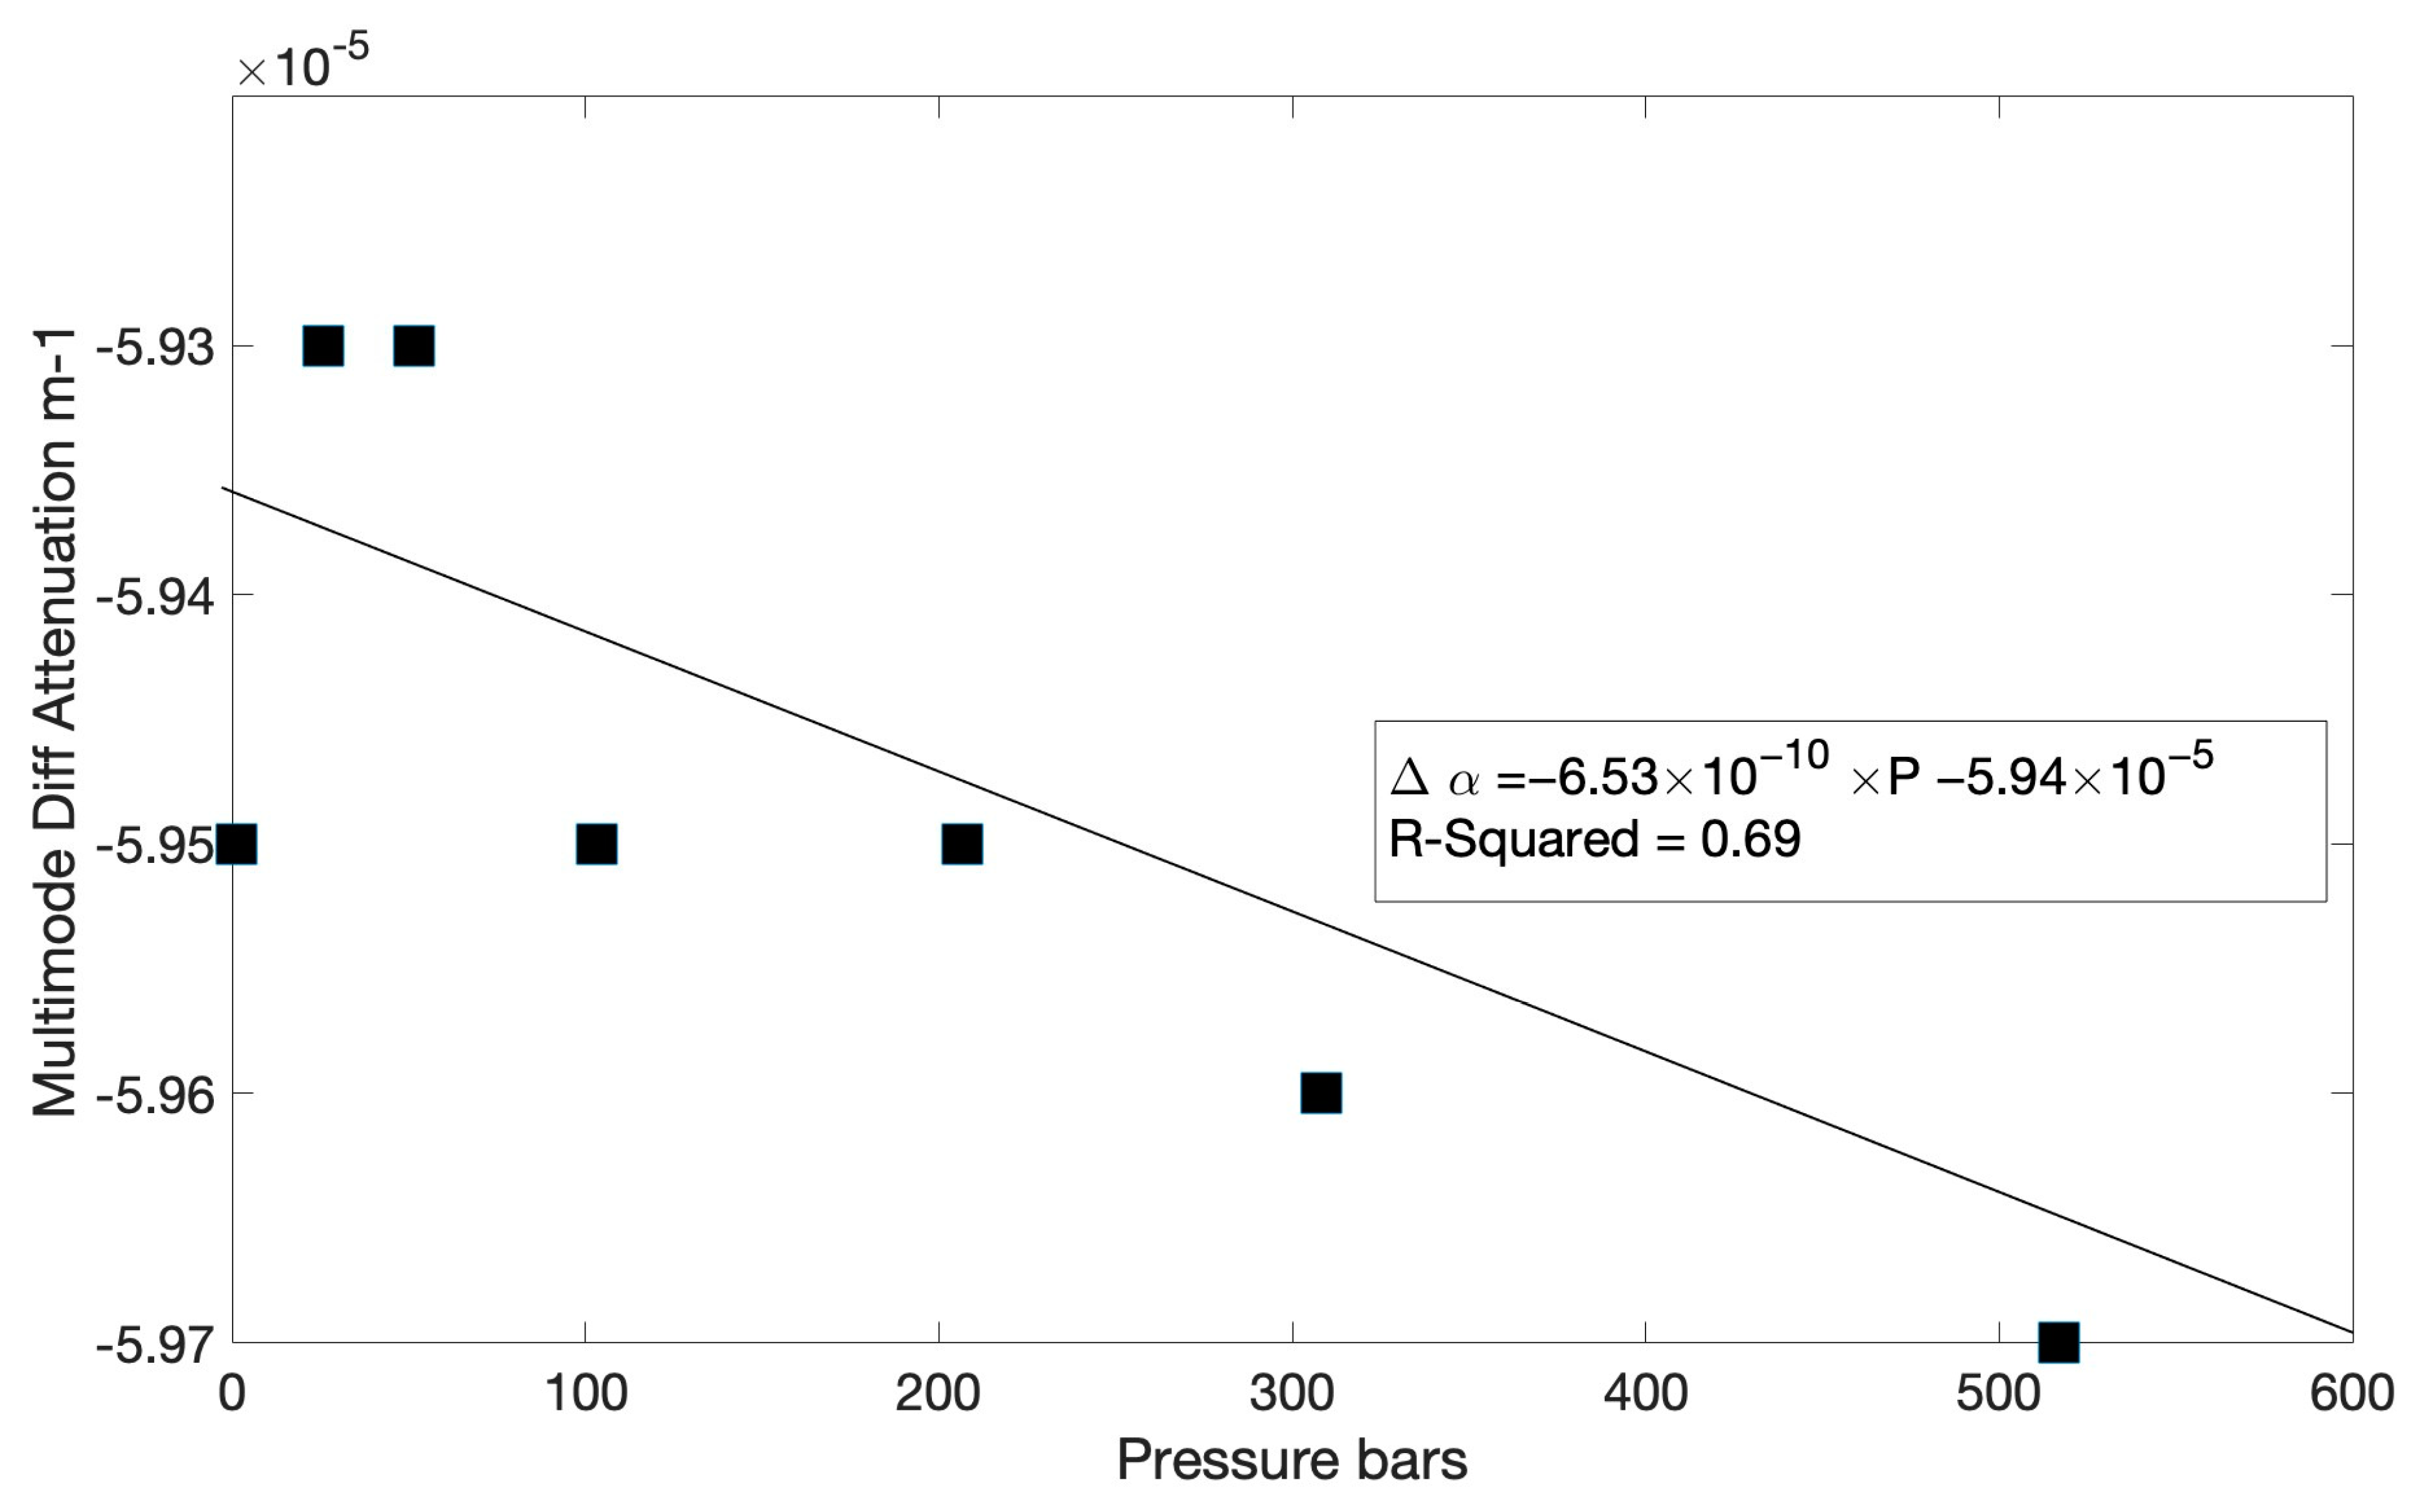
Figure 4 for single-mode and
Figure 5 for multimode fiber.
4. Discussion
The two sets of pressure tests indicated only modest impacts of pressure on fiber properties. While the OTDR showed insignificant changes in attenuation over the pressures tested, the more critical behavior for temperature sensing is any changes in attenuation between the Raman wavelengths. Based upon
Figure 4, there is no statistical contribution (R
2 = 0.05) of fluid pressure, up to 570 bars, to the difference in optical attenuation at the Stokes and anti-Stokes frequencies of the single-mode fiber. Also important to note is that the magnitude of the single-mode differential attenuation is approximately an order of magnitude smaller than that typically found in multimode applications. As result, at maximum depths typical of ocean and glacial studies (10,000 m), the contribution and importance of differential attenuation in the denominator of Equation (2) is much less for single-mode fiber than for multimode fiber. Both of these results indicate that the use of single-mode fiber for temperature-sensing is both practical and without significant complications of pressure and pressure variation on differential attenuation.
In contrast to the tested single-mode fiber, the multimode fiber does display a statistically significant (R2 = 0.69) decrease in differential attenuation across the range of pressures tested. Fortunately, the absolute magnitude of the change is small, and in the example below, we compute the impact for a typical ocean deployment.
Equation (2) can be used to calculate the temperature error if pressure-related impacts on differential attenuation on DTS ocean or ice temperatures are ignored, i.e., the differential attenuation is assumed to be constant with depth (fiber distance). For simplicity, we first assume a uniform ocean temperature of 4 °C (277.15 °K) over a depth of ~6000 m (600 bar). For a multimode fiber deployed from the ocean surface to this depth, the functional form of the depth (fiber distance)-dependent differential attenuation is represented by the best fit regression line in
Figure 5; (Δα(P)= −6.53 × 10
−10 × P − 5.94 × 10
−5). Using this measured linear distribution of differential attenuation with pressure, Equation (2) can be inverted and the integration performed to calculate the expected Stokes/anti-Stokes ratio that would be obtained under conditions of uniform ocean temperature, but with the correct form of the differential attenuation. For simplicity, we assume 1 bar to be equivalent to 10 m of fiber deployment depth and assume coefficients C and γ to be pressure-independent (for this example, we chose representative values of C = 1.66 and γ = 470 °K).
To estimate the error, as a function of ocean pressure, the expected Stokes/anti-Stokes ratios are replaced back into Equation (2), but now using a pressure-independent, or constant differential attenuation. Assuming the differential attenuation to be uniform with depth and equivalent to the value at zero pressure (−5.94 × 10⁻⁵ m−1), the resulting temperature calculated at 300 bar (~3000 m ocean depth) would be 277.20 K, while at a depth of ~6000 m (600 bar), the estimated temperature would 277.34 °K, representing an error in temperature of 0.05 °K and 0.19 °K, respectively. While potentially significant in terms of precision ocean monitoring, the error is at or near the resolution of typical multimode DTS systems at this range for measurement integration times common in oceanography. Note that this error is only applicable for multimode measurements; single-mode fiber does not show any significant impact of pressure on differential attenuation, and the differential attenuation can be assumed to be constant over the range of depths used here.
The results of this work indicate that unarmored (bare) fiber, either single- or multimode, can serve for both communication and Raman-based distributed temperature-sensing in the deep ocean and in ice environments where weight and handling are more critical than durability. These results, for the first time, document the potential for using lightweight fibers for thermal sensing in extreme environments. Such applications include deep-ocean ROVs and deep-glacial installations using Philberth-type drilling systems. The stability of the differential attenuation of the Raman Stokes and anti-Stokes return signals as a function of pressure implies that a single fiber can be subjected to a depth-varying pressure environment without the need to know a priori the nature of the attenuation as a function of fiber distance. As such, a single fiber unspooled for an ocean or ice ROV can record the spatial distribution of water or ice temperature in near real time. While this work focused on the impacts under the short time scales anticipated for most ocean and ice installations, previous work on acrylate-coated fibers, although at atmospheric pressure, showed little degradation in strength or attenuation over months of exposure to seawater [
21]. Further testing of fibers installed in deep-ice environments is planned to test the longer-term degradation behavior of such fibers.

