Abstract
Analyzing and breaking down nonstationary signals into their primary components is significant in various optical applications. In this work, we design a direct, localized, and mathematically rigorous method for nonstationary signals by employing a modulated short-time Fourier transform (MSTFT) that can be implemented efficiently using fast Fourier transform, subsequently isolating energy-concentrated sets through an approximate threshold process, allowing us to directly retrieve instantaneous frequencies and signal components by determining the maximum frequency within each set. MSTFT provides a new insight into the time-frequency analysis in multicomponent signal separation and can be extended to other time-frequency transforms. Beyond the analysis of the synthetic, we also perform real dual-comb ranging signals under turbid water, and the results show an approximate 1.5 dB improvement in peak signal-to-noise ratio, further demonstrating the effectiveness of our method in challenging conditions.
1. Introduction
Various signals occurring in optical fields, such as biomedical signals, sensor arrays, and laser ranging, are comprised of nonlinear and nonstationary components [1,2,3,4]. Breaking down these signals and effectively extracting information from their individual components, such as frequencies, amplitudes, and waveforms, will be invaluable in identifying and quantifying the underlying multicomponent signals. This technique has demonstrated success in applications within the field of optics, including optical fiber communication [5], fringe pattern enhancement [6], and wind light detection and ranging (LiDAR) signal denoising [7].
The empirical mode decomposition (EMD) proposed by Huang et al. is an iterative algorithm that breaks down a nonstationary signal into a sum of intrinsic mode functions (IMFs) [8], leaving a minimally oscillatory function (referred to as the trend) as the residual component. The algorithm also calculates the instantaneous frequency of each IMF through the application of the Hilbert transform. Due to the time-frequency analysis ability, EMD was always applied to restore optical LiDAR signals, but it failed when handling some special signal, for example, the laser ranging interferograms owing to the mode aliasing and the boundary effect of EMD [9]. Inspired by EMD and compressed sensing theory, Hou et al. introduced a nonlinear matching pursuit method to seek the sparsest representation of a signal within a potentially vast dictionary comprising intrinsic mode functions [10]. Similarly, Gilles proposed the empirical wavelet transform by decomposing a given signal into various modes by creating an adaptive wavelet basis [11].
Benefiting from computational efficiency, the reassignment method and the synchrosqueezing transform (SST, which is indeed a special reassignment technique) are other well-known time-frequency analysis tools [12]. The main idea of SST is to concentrate the time-frequency representation into the frequency reassignment reference. In this way, it will sharpen the time-frequency representation and decrease smearing while still reconstructing different signal components. As powerful tools for mode retrieval, SST can be extended to other time-frequency representations, such as wavelet packet transform [13], curvelet transform [14], S-transform [15], and short-time Fourier transform (STFT) [16]. Furthermore, for obtaining a more accurate estimate of instantaneous frequencies than the original SST, two-order or high-order adaptive SST has been proposed to achieve the mode retrieval results with a high accuracy [17]. SST-based methods have also been applied in optical signal processing. Recently, Cui et al. proposed an effective signal separation operator (SSO), which first removes the polynomial trend from the blind source signal, and then applies the signal separation operator to some discrete samples in the fixed time and extracts different modes and instantaneous frequencies via finding the maximum over frequency domain [18].
In this work, we present a straightforward, localized, and mathematically rigorous method for analyzing and decomposing nonstationary data, utilizing the modulated (STFT) coupled with a strategy of local maximum-frequency approximation. This method enables the direct extraction of all instantaneous frequencies and the reconstruction of all modes by forming energy-concentrated clusters through approximate thresholding. Its main advantage lies in its simplicity and directness, offering a method that simultaneously reconstructs all instantaneous frequencies and modes with a theoretical guarantee. We conduct numerical experiments with both simulated data and actual underwater dual-comb ranging signals, which demonstrates our method’s applicability in reconstructing signals when navigating through diffuse scattering media.
2. Main Result
Considering the following nonstationary model, which is related to various optical signals:
where denotes intrinsic mode function (IMF), the phase function is differential, is the instantaneous frequency, and the amplitude function is non-negative and continuous. With , the function , called the trend of , is (at most) minimally oscillatory. Given some discrete samples of the composite signal , the objective is to recover and , .
We first introduce modulated short-time Fourier transform (MSTFT), defined as follows:
where g is an admissible window function and controls the width of the window function.
For each t, by applying a small thresholding parameter to , we can obtain precisely nonempty frequency sets , where is the number of the signal component as described in (1). For each set , we find local maximum-frequency by solving the following problem:
Then the instantaneous frequencies, amplitudes, and signal components can be computed as follows:
More details about the rigorous mathematical proof of the above error bounds can be found in the Supplemental Document.
The pseudocode of our method can be found in Algorithm 1, and the setting parameter is a simple example. The goal is to extract energy-concentration bands of ; therefore we can choose the parameter according to the magnitude of time-frequency energy of . In addition, we can also apply an appropriate curve-fitting scheme to extract local maximum frequency curves directly from energy-concentration bands instead of thresholding and clustering.
| Algorithm 1. MSTFT-based nonstationary signal decomposition. |
| 1. Input: signal , (a small thresholding parameter); |
| 2. Calculate MSTFT of to obtain ; |
| 3. For each t, cluster to obtain precisely clusters , . |
| 4. Extrema estimation . |
| 5. Output: Recovered frequencies , |
| recovered amplitudes , |
| recovered modes . |
3. Experimentation and Examples
Firstly, we explain the implementation of the proposed method by a numerical example. To illustrate the process, we consider the following multicomponent signal:
where the three subcomponents are defined by
and the related waveform is shown in Figure 1a. It can be seen that due to the original signal comprising multiple spectral components, it appears “chaotic” in the time domain (i.e., the amplitude as a function of the time), characterized by many spikes.
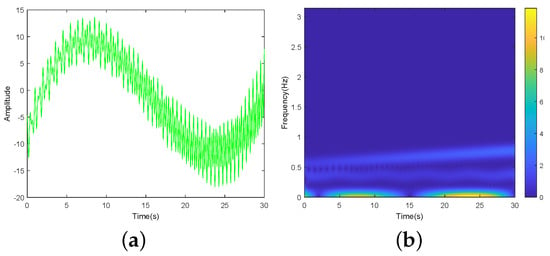
Figure 1.
(a) Waveform of blind-source signal . (b) Time-frequency spectrogram .
With discrete grids of frequencies , the first step of the proposed method is to calculate MSTFT of to obtain by applying discrete MSTFT to selected (uniform or nonuniform) samples , where denote uniform or nonuniform sampling points. As shown in the color bar of Figure 1b, by applying an appropriate thresholding parameter (e.g., ) to , we can obtain precisely 3 clusters that correspond to , , and . This process is associated with step 3 in Algorithm 1. We then find three extrema curves () in the three clusters, which is equivalent to obtain extrema estimation for each fixed t, as shown in the step 4 of Algorithm 1. Since real-valued discrete data are considered in this example, the recovered instantaneous frequencies and signal components can be obtained from the output formulas in Algorithm 1 simply by computing
where , and is the sampling interval.
Figure 2 shows reconstructed results of instantaneous frequencies and signal components. It can be seen that the reconstructed submodes after decomposition are essentially consistent with the original subsignals , , set for the simulated signal, as shown in Figure 2b–d. It verifies the effectiveness and accuracy of the proposed algorithm.
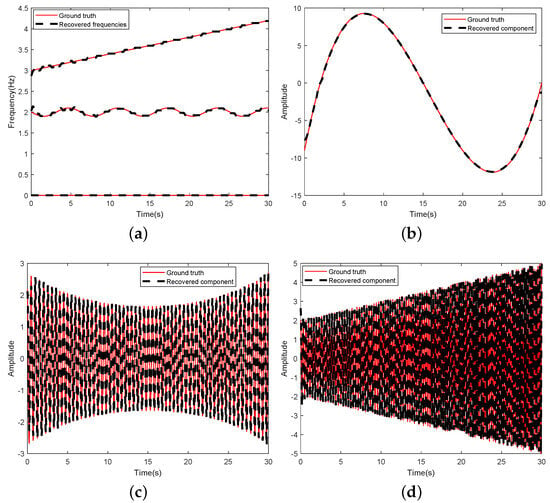
Figure 2.
Recovered results: (a) instantaneous frequencies; (b) ; (c) ; (d) .
4. Experiments Results for Dual-Comb-Based Underwater LiDAR
To further demonstrate the effectiveness of our method on real signals, the subsequent section details the application of this method to a practical dual-comb LiDAR signal from underwater. Figure 3 shows the schematic of the underwater dual-comb LiDAR system [19]. The signal source (SS) and the local oscillator (LO), both having a central wavelength of 515 nm, with the SS boasting an output power of 300 mW and the LO of 20 mW, share a repetition frequency of approximately 36.5 MHz, which is adjustable within a certain range. The difference in repetition frequency is maintained at 2 kHz, indicative of the data refresh rate for the range finding. A rubidium clock (Rb, Microsemi 8040, Aliso Viejo, CA, USA) ensures systemwide time synchronization, thus stabilizing the entire setup. Notably, the SS signal is bifurcated into reference and measurement beams, reflected, respectively, by the reference mirror () and the underwater target. A large lens captures backscattered signals containing distance information, which are then combined and made to interfere with both the reference and LO signals. Importantly, to maintain precision in the laser’s path, all spatial beams are aligned at an identical height and with strict adherence to alignment protocols. To reduce common-mode noise, a balanced photodetector (BPD, Thorlabs PDB230A, Newton, NJ, USA) is employed for capturing the interference signals. Consequently, by analyzing the reference and measurement interferograms, we are able to determine distances based on the time-of-flight (ToF) principle [20,21].
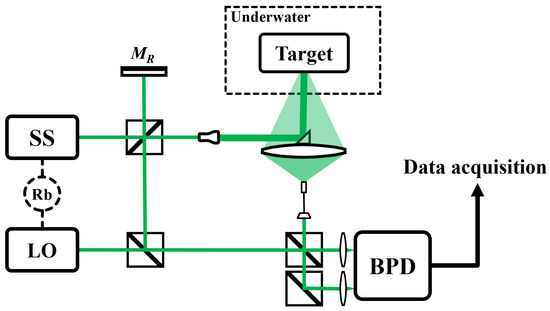
Figure 3.
Experimental setup for underwater dual-comb LiDAR. SS, signal source; LO, local oscillator; Rb, rubidium clock; , reference mirror; BPD, balanced photodetector.
In the experiment, the measurement target (a retroreflector) is securely positioned approximately 1 m within a water container, dimensions being . This container is filled to a depth of 0.2 m with tap water, maintaining a turbidity level below 0.5 NTU (nephelometric turbidity units), as verified by a turbidity meter (REMOND, RMD-Z6, Shanghai, China). Furthermore, environmental conditions, including a temperature of 21.5 °C and water density of 977.887 kg/m3, are meticulously monitored and regulated during signal acquisition. The group refractive index of water can be calculated, based on the Harvey formula [22], as 1.3587851. To simulate the challenges of turbid water, controlled quantities of pure milk are mixed into the water, using a calibrated measuring cylinder for precise volume addition [23]. Subsequent stirring ensures uniform milk distribution, thereby maintaining consistent water concentration. The turbidity meter is utilized to quantitatively assess water quality, indicating turbidity levels of 2.1 NTU and 9.3 NTU for milk additions of 5 mL and 25 mL, respectively. Through this process, genuine experimental signals are captured by an oscilloscope (LeCroy, WaveRunner 9404, Chestnut Ridge, NY, USA) at a 500 MHz sampling rate, facilitating the analysis of the proposed method’s effectiveness under varying turbidity conditions. Figure 4 showcases both the original and the reconstructed signals obtained by the proposed method.
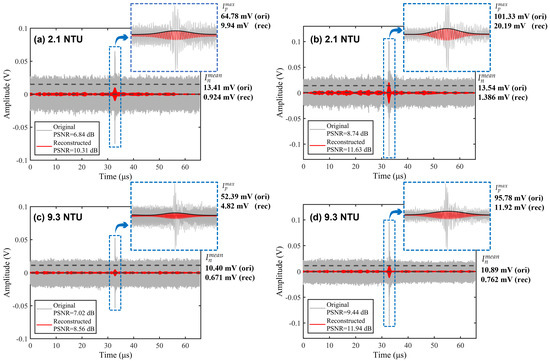
Figure 4.
Original and reconstructed signals at turbid water with 2.1 NTU and 9.3 NTU. (a,c) Measurement interferograms. (b,d) Reference interferograms.
To harness the effective information within the signal, we selectively analyze data proximal to both the reference and measurement interferograms for decomposition. This approach aligns with our decomposition principle, whereby each interferogram is composed of 32,768 sampling points, providing a detailed basis for signal reconstruction and analysis. This methodology underscores our commitment to efficiency in extracting and interpreting signal data, as evidenced by the comparative visualization presented in the figure. From Figure 4a,c, it can be observed that both the signal intensity and the signal quality decrease with the addition of the milk. Specifically, the measurement interferograms undergo distortion due to the turbid water environment, resulting in elevated noise levels and irregular contours. This is reasonable, as the scattering particles in turbid water (i.e., large molecules in milk) simultaneously exert both scattering and absorption effects on the dual-comb signal. After implementing decomposition, i.e., the results in Figure 4b,d, there is a notable reduction in background noise, albeit with the preservation of the interferogram’s intrinsic characteristics.
To quantitatively assess the efficacy of the decomposition, we employ the peak signal-to-noise ratio (PSNR) as a metric:
where denotes the maximum intensity of the signal and denotes the mean value of the background noise.
The and values of each signal are calculated and shown in Figure 4 with date cursors. After calculation, we find that the proposed method improves the PSNR by at least 1.5 dB after decomposition and reconstruction. In addition, as indicated by the enlarged view in Figure 4, the reconstructed signal has a Gaussian-like shape with symmetry. This configuration enables the precise extraction of the peak position, crucial for accurate distance measurement. The results prove that the proposed decomposition method effectively enhances the dual-comb LiDAR performance in turbid water. Leveraging the algorithm decomposes the signal and realizes the denoising efficiently.
To demonstrate the superiority of our method, we compare the reconstructed result with several classic time-frequency decomposition algorithms, including wavelets transform (WT), EMD, and complete ensemble empirical mode decomposition (CEEMDAN) [24]. Figure 5 illustrates the compared result of different methods applied for the measurement interferogram, and the related PSNR values are also presented in the upper right corner of the figure. From Figure 5, we can find that the PSNR value of our proposed method (i.e., 10.31 dB) performs better than that of WT, EMD, and CEEMDAN. In particular, the shape of our reconstructed signal, especially the measurement interferogram, is close to the Gaussian shape. As shown in Figure 6, we calculate the and of signals processed by WT and our method. Even though the PSNR value of WT is close to our method, the shape of WT’s result is distorted. In comparison, the other three methods demonstrate a degree of effectiveness in denoising but are inadequate in extracting Gaussian-modulated signals. Therefore, the proposed method has great potential in denoising and extracting dual-comb LiDAR signals of complex and turbid water.
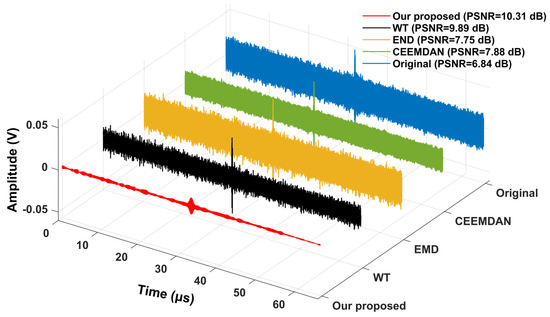
Figure 5.
Comparison of different algorithms for the measurement interferogram of dual-comb LiDAR.
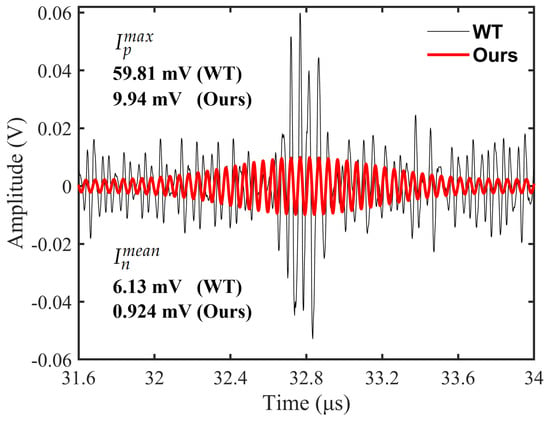
Figure 6.
Enlarged comparison between WT and our results around the peak.
5. Conclusions
In conclusion, we have introduced a straightforward and efficient approach for analyzing and decomposing nonstationary signals in optical applications, employing an MSTFT alongside an approximate thresholding technique for isolating energy-concentrated clusters. This method not only demonstrates superior performance in direct extraction of instantaneous frequencies and signal components but also significantly enhances dual-comb LiDAR performance in turbid waters, as evidenced by an approximate 1.5 dB improvement in PSNR and the precision in peak position extraction for accurate distance measurements. In addition, we establish a mathematical framework, as seen in the Supplemental Document, which enables us to mathematically analyze its guarantees of recovery accuracy. Comparative analysis with established time-frequency decomposition algorithms further underscores our method’s effectiveness in denoising and accurately reconstructing signals. The demonstrated simplicity and effectiveness of this method promise wider applications in signal processing, particularly for environments with diffuse scattering media, indicating potential for significant advancements in optical and environmental monitoring. Future works could focus on enhancing algorithmic efficiency, extending its applicability to more complex signal types, and implementing the selection and optimization of algorithm parameters using heuristic algorithms.
Supplementary Materials
The following supporting information can be downloaded at: https://www.mdpi.com/article/10.3390/photonics11060560/s1.
Author Contributions
Conceptualization, N.H. and X.L.; methodology, N.H.; software, H.S.; validation, H.S. and X.Z.; formal analysis, N.H. and Y.P.; investigation, N.H.; resources, C.W., Z.W., and X.L.; data curation, H.S.; writing—original draft preparation, N.H., C.W., Z.W., and H.S.; writing—review and editing, X.Z. and X.L.; visualization, H.S. and Y.P.; supervision, X.L.; project administration, N.H. and X.L.; funding acquisition, N.H. and X.L. All authors have read and agreed to the published version of the manuscript.
Funding
This research was funded by National Natural Science Foundation of China (12201456, 62205243 and 12371499) and GuangDong Basic and Applied Basic Research Foundation (2021A1515110530).
Institutional Review Board Statement
Not applicable.
Informed Consent Statement
Not applicable.
Data Availability Statement
A matlab implementation of the proposed algorithm is available at https://github.com/Dismoon/MSTFT-DC.
Acknowledgments
The authors would like to thank all the anonymous reviewers for their helpful comments and suggestions.
Conflicts of Interest
Author Zhiyang Wu was employed by the company Tianhe Mechanical Equipment Manufacturing Co., Ltd. The remaining authors declare that the research was conducted in the absence of any commercial or financial relationships that could be construed as a potential conflict of interest.
References
- Liu, X.; Zhang, L.; Zhai, X.; Li, L.; Zhou, Q.; Chen, X.; Li, X. Polarization Lidar: Principles and Applications. Photonics 2023, 10, 1118. [Google Scholar] [CrossRef]
- Chang, J.; Zhu, L.; Li, H.; Xu, F.; Liu, B.; Yang, Z. Noise reduction in Lidar signal using correlation-based EMD combined with soft thresholding and roughness penalty. Opt. Commun. 2018, 407, 290–295. [Google Scholar] [CrossRef]
- Rocadenbosch, F.; Soriano, C.; Comeron, A.; Baldasano, J.M. Lidar inversion of atmospheric backscatter and extinction-to-backscatter ratios by use of a Kalman filter. Appl. Opt. 1999, 38, 3175–3189. [Google Scholar] [CrossRef] [PubMed]
- Li, X.; Goudail, F. Vortex retarder-based Stokes polarimeters: Optimal data processing and autocalibration capability. Opt. Lett. 2024, 49, 1696–1699. [Google Scholar] [CrossRef]
- Pankratova, M.; Vasylchenkova, A.; Derevyanko, S.A.; Chichkov, N.B.; Prilepsky, J.E. Signal-noise interaction in optical-fiber communication systems employing nonlinear frequency-division multiplexing. Phys. Rev. Appl. 2020, 13, 054021. [Google Scholar] [CrossRef]
- Lin, Y.; Tan, Y.K.; Tian, B. A novel approach for decomposition of biomedical signals in different applications based on data-adaptive Gaussian average filtering. Biomed. Signal Process. Control 2022, 71, 103104. [Google Scholar] [CrossRef]
- Zhou, Y.; Li, L.; Wang, K.; Zhang, X.; Gao, C. Coherent Doppler wind lidar signal denoising adopting variational mode decomposition based on honey badger algorithm. Opt. Express 2022, 30, 25774–25787. [Google Scholar] [CrossRef]
- Huang, N.E.; Shen, Z.; Long, S.R.; Wu, M.C.; Shih, H.H.; Zheng, Q.; Yen, N.C.; Tung, C.C.; Liu, H.H. The empirical mode decomposition and the Hilbert spectrum for nonlinear and non-stationary time series analysis. Proc. R. Soc. Lond. Ser. Math. Phys. Eng. Sci. 1998, 454, 903–995. [Google Scholar] [CrossRef]
- Zhou, Z.; Hua, D.; Wang, Y.; Yan, Q.; Li, S.; Li, Y.; Wang, H. Improvement of the signal to noise ratio of Lidar echo signal based on wavelet de-noising technique. Opt. Lasers Eng. 2013, 51, 961–966. [Google Scholar] [CrossRef]
- Hou, T.Y.; Shi, Z. Data-driven time–frequency analysis. Appl. Comput. Harmon. Anal. 2013, 35, 284–308. [Google Scholar] [CrossRef]
- Gilles, J. Empirical wavelet transform. IEEE Trans. Signal Process. 2013, 61, 3999–4010. [Google Scholar] [CrossRef]
- Daubechies, I.; Lu, J.; Wu, H. Synchrosqueezed wavelet transforms: An empirical mode decomposition-like tool. Appl. Comput. Harmon. Anal. 2011, 30, 243–261. [Google Scholar] [CrossRef]
- Yang, H. Synchrosqueezed wave packet transforms and diffeomorphism based spectral analysis for 1D general mode decompositions. Appl. Comput. Harmon. Anal. 2015, 39, 33–66. [Google Scholar] [CrossRef]
- Yang, H.; Ying, L. Synchrosqueezed curvelet transform for two-dimensional mode decomposition. SIAM J. Math. Anal. 2014, 46, 2052–2083. [Google Scholar] [CrossRef]
- Huang, Z.; Zhang, J.; Zhao, T.h.; Sun, Y. Synchrosqueezing S-transform and its application in seismic spectral decomposition. IEEE Trans. Geosci. Remote Sens. 2015, 54, 817–825. [Google Scholar] [CrossRef]
- Thakur, G.; Wu, H.T. Synchrosqueezing-based recovery of instantaneous frequency from nonuniform samples. SIAM J. Math. Anal. 2011, 43, 2078–2095. [Google Scholar] [CrossRef]
- Li, L.; Cai, H.; Han, H.; Jiang, Q.; Ji, H. Adaptive short-time Fourier transform and synchrosqueezing transform for non-stationary signal separation. Signal Process. 2020, 166, 107231. [Google Scholar] [CrossRef]
- Chui, C.K.; Mhaskar, H. Signal decomposition and analysis via extraction of frequencies. Appl. Comput. Harmon. Anal. 2016, 40, 97–136. [Google Scholar] [CrossRef]
- Zhao, H.; Shi, H.; Xu, P.; Qian, Z.; Xu, X.; Li, Z.; Zhai, J.; Li, X.; Xue, B. Direct measurement of underwater sound velocity via dual-comb system and matched filtering algorithm. IEEE Trans. Instrum. Meas. 2023, 72, 1007210. [Google Scholar] [CrossRef]
- Zhao, H.; Shi, H.; Zhu, Z.; Qian, Z.; Xu, X.; Zhai, J.; Chen, X.; Li, X. Enhanced underwater LiDAR via dual-comb interferometer and pulse coding. IEEE Trans. Geosci. Remote Sens. 2024, 62, 4206211. [Google Scholar] [CrossRef]
- Shi, H.; Zhao, H.; Zhu, Z.; Wang, C.; Hu, H.; Zhai, J.; Li, X. Enhanced Dual-Comb Underwater Ranging via an Improved VMD Algorithm. IEEE J. Ocean. Eng. 2024. [Google Scholar] [CrossRef]
- Harvey, A.H.; Kaplan, S.G.; Burnett, J.H. Effect of dissolved air on the density and refractive index of water. Int. J. Thermophys. 2005, 26, 1495–1514. [Google Scholar] [CrossRef]
- Li, X.; Hu, H.; Zhao, L.; Wang, H.; Yu, Y.; Wu, L.; Liu, T. Polarimetric image recovery method combining histogram stretching for underwater imaging. Sci. Rep. 2018, 8, 12430. [Google Scholar] [CrossRef] [PubMed]
- Zhang, S.; Liu, H.; Hu, M.; Jiang, A.; Zhang, L.; Xu, F.; Hao, G. An adaptive CEEMDAN thresholding denoising method optimized by nonlocal means algorithm. IEEE Trans. Instrum. Meas. 2020, 69, 6891–6903. [Google Scholar] [CrossRef]
Disclaimer/Publisher’s Note: The statements, opinions and data contained in all publications are solely those of the individual author(s) and contributor(s) and not of MDPI and/or the editor(s). MDPI and/or the editor(s) disclaim responsibility for any injury to people or property resulting from any ideas, methods, instructions or products referred to in the content. |
© 2024 by the authors. Licensee MDPI, Basel, Switzerland. This article is an open access article distributed under the terms and conditions of the Creative Commons Attribution (CC BY) license (https://creativecommons.org/licenses/by/4.0/).