Article

High-Dynamic-Range Absorption Spectroscopy by Generating a Wide Path-Length Distribution with Scatterers

Department of Physics, Faculty of Science, Tokyo University of Science, 1-3 Kagurazaka, Shinjuku-ku, Tokyo 162-8601, Japan
*
Author to whom correspondence should be addressed.
Photonics 2024, 11(6), 556; https://doi.org/10.3390/photonics11060556
Submission received: 28 May 2024 / Revised: 8 June 2024 / Accepted: 11 June 2024 / Published: 13 June 2024
(This article belongs to the Special Issue Photonics: 10th Anniversary)

Abstract

:
In absorption spectroscopy, it is challenging to detect absorption peaks with significant differences in their intensity in a single measurement. We enable high-dynamic-range measurements by dispersing scatterers within a sample to create a broad distribution of path lengths (PLs). The sample is placed within an integrating sphere (IS) to capture all scattered light of various PLs. To address the complexities of PLs inside the IS and the sample, we performed a ray-tracing simulation using the Monte Carlo (MC) method, which estimates the measured absorbance A and PL distribution from the sample’s absorption coefficient µa and scattering properties at each wavelength λ. This method was validated using dye solutions with two absorption peaks whose intensity ratio is 95:1, employing polystyrene microspheres (PSs) as scatterers. The results confirmed that both peak shapes were delineated in a single measurement without flattening the high absorption peak. Although the measured peak shapes A(λ) did not align with the actual peak shapes µa(λ), MC enabled the reproduction of µa(λ) from A(λ). Furthermore, the analysis of the PL distribution by MC shows that adding scatterers broadens the distribution and shifts it toward shorter PLs as absorption increases, effectively adjusting it to µa.

1. Introduction

Absorption spectroscopy is a relatively simple and safe method that allows for the non-destructive evaluation of the composition and properties of samples. It is widely used in various fields, including for the assessment of the properties of biological samples, food, and functional materials [1,2,3,4]. Additionally, as it does not require reagents or sample pre-treatment and enables continuous measurement and rapid detection, it has become a popular choice for online monitoring and process control [5,6,7].
In absorption spectroscopy, the transmittance at each wavelength λ is typically measured, T(λ), from which the absorbance, A(λ) = −log T(λ), is calculated. Measuring high or low absorption peaks in absorbance spectra can be challenging. In cases of high absorption, the transmitted light becomes too faint, making it difficult to accurately measure its intensity, requiring a detector or method capable of high sensitivity to sufficiently evaluate the absorption with precision [8,9,10]. Conversely, in cases of low absorption, the transmittance approaches unity. Under this condition, the loss of light due to reflection at the surface of the sample container and at the interface between the sample solution and the container has a greater impact than the absorption by the sample.
In typical absorption spectroscopy, accurately measuring high or low absorption peaks requires adjusting the path length (PL) based on the sample’s thickness. For excessively high absorption peaks, the PL needs to be reduced, while for very low absorption peaks, the PL should be increased. Therefore, for samples with multiple absorption peaks of varying intensities, setting the PL to accommodate all peak intensities is challenging. In such cases, setting the PL for small absorption peaks can cause the high absorption peaks to be lost, or conversely, adjusting for large peaks might lead to small ones being missed. Consequently, accurately measuring both high and low absorption peaks simultaneously is difficult.
To address this issue, we developed a technique that involves mixing non-absorbing scatterers into samples containing both high and low absorbance peaks and placing them inside an integrating sphere.
When light is shone into an optical cell with a PL of l0 containing a liquid sample homogeneously dispersed with non-absorbing scatterers at an appropriate concentration, the light emitted from the sample includes paths where light is scattered on the incident side and exits the sample immediately (l < l0), as well as paths that involve multiple scattering, resulting in longer PLs (l > l0). This wide distribution of PLs created by the integration of scatterers enables light to take various paths through the medium, leading to both short and long travel paths within the same sample. Such a varied PL distribution ensures that high absorption peaks do not result in undetectably low intensities at the detector due to the presence of shorter paths, and the longer paths are sufficient for detecting low absorption peaks, ensuring adequate absorption even in low absorbance regions. Consequently, if all scattered light can be detected, it becomes possible to simultaneously measure both high and low absorption peaks.
The device commonly used for measuring the absorption characteristics of scattering samples and for measuring diffuse reflectance is the integrating sphere (IS). The inner wall of the IS is coated with a highly reflective material, forming a spherical shell that can trap scattered light at all angles [11]. Typically, absorbance measurements using an IS are performed by placing the sample at the opening of the sphere [12,13,14]. However, this configuration does not allow for the collection of backscattered light [15], necessitating alternative arrangements for a more comprehensive measurement of all scattered light.
To address the limitations of traditional setups and to ensure the detection of all scattered light emitted from the sample, we placed the sample inside the integrating sphere to perform our absorbance measurements. This approach enables high-dynamic-range absorbance measurements that account for the full spectrum of scattered light, overcoming the challenges associated with backscattering often missed in conventional external setups [15,16,17,18,19,20,21]. Thus, placing the sample inside the integrating sphere is not only effective for capturing scattered light from all angles but also frequently used for measuring the quantum yield of fluorescence [22,23].
When placing the sample inside the integrating sphere (IS), especially when the sample’s scattering is significant, the light takes various paths before reaching the detector due to diffuse reflection off the IS’s inner walls and multiple scattering within the sample, resulting in PLs that do not match the sample’s thickness [18,19]. Therefore, to obtain the accurate absorption coefficient µa from the measured absorbance A, it is necessary to correct for these effects.
Techniques used to derive µa (as well as the scattering coefficient µs and the anisotropy coefficient g) from A, considering the effects of multiple scattering within the sample, diffusion inside the IS, or both, primarily involve numerical calculations based on methods such as Kubelka–Munk (KM) [24,25], Inverse Adding-Doubling (IAD) [24,26,27], and Inverse Monte Carlo (IMC) simulations [17,18,20,24,25,27,28,29,30,31,32] or combinations of these approaches [11]. A method has also been proposed that uses simulation results from MC as training data to estimate optical coefficients from measurement results using neural network learning [33]. In this approach, the relationship between the measured absorbance A and the sample’s absorption coefficient µa is estimated in advance using MC-based ray-tracing simulations [18], thus allowing µa to be derived from A [29,30].
Our method is based on the approach that allows for the derivation of the absorption coefficient µa from the measured absorbance A by pre-estimating the relationship between A and µa [29,30] using Monte Carlo (MC) ray-tracing simulations [18]. In this paper, absorbance measurements were conducted on an absorbing sample that has two absorption peaks with a true peak intensity ratio of approximately 95 times. By dispersing white scatterers within the measurement wavelength range and placing the sample inside an integrating sphere (IS), the measured peak intensity ratio was reduced to about 13 times. Furthermore, it was verified that the absorption spectrum of the absorbing sample could be reconstructed from the absorbance measurement results using Monte Carlo (MC) simulations.
This study features absorbance measurements utilizing scatterers. As demonstrated in previous studies, many of these approaches aim to alleviate the problems of light scattering and replicate the effects observed in an integrating sphere [34,35,36], as well as to enhance the sensitivity of absorption spectroscopy. In particular, the latter is achieved through a method known as multiscattering-enhanced absorption spectroscopy (MEAS), which involves dispersing gold nanoparticles in the sample solution [37] or surrounding the sample with a scattering cavity [38] to increase the PL and thereby enhance detection sensitivity.
In contrast, our study aims to expand the distribution of PLs in the sample by using scatterers, thereby enabling the precise simultaneous measurement of absorption peaks with a high dynamic range (both high and low absorbance). This allows for the concurrent analysis of peaks with varying absorption characteristics, which is challenging with conventional absorption measurement methods.
This method introduces a novel spectroscopic technique using scatterers, which has promising applications for multiple fields. Specifically, in environmental monitoring, it could lead to more efficient and accurate measurements of pollutants in air and water, enabling the detection of trace levels of toxic chemicals alongside higher concentrations of benign substances without the need for multiple instruments or sample preparations. In the pharmaceutical industry, this method could significantly improve the reliability of drug formulations by accurately measuring concentrations of active ingredients and impurities, regardless of their levels. Similarly, in the food and beverage industry, the ability to detect both the main ingredients at high levels and trace amounts of preservatives or additives in a single analysis could streamline production processes and enhance quality assurance. Additionally, clinical diagnostics would benefit from this improved measurement technique, as it allows for the simultaneous detection of various biomarkers in biological fluids, which often vary greatly in concentration. From the above, the method shows a wide range of possibilities in research and industry.

2. Materials and Methods

2.1. Sample Preparation

In this study, we prepared a dye solution with two absorption peaks with a peak intensity ratio of approximately 100:1 by dissolving commercially available food dyes in water and investigated their absorption properties. Additionally, samples in which scatterers were dispersed in these dye solutions were also prepared to evaluate the ability of the proposed method to simultaneously detect high and low absorption peaks.
The food colorants used were ‘Food Color Yellow’ and ‘Food Color Blue’ (both from Kyoritsu-foods Co., Ltd., Tokyo, Japan), with their main components being Tartrazine (E102, CAS 1934-21-0) [39,40] and Brilliant Blue FCF (E133, CAS 3844-45-9) [41,42], respectively. These food colorants also contain dextrin as an excipient. Dextrin is soluble in water and does not possess any distinctive absorption features within the measurement wavelength range of 350 to 700 nm [42]; thus, it does not affect the measurement results [43].
A dye solution was prepared by dissolving FCY and FCB at a weight ratio of 160:1 in water, resulting in a solution with an absorbance peak intensity ratio of approximately 100:1. The high absorbance peak at 426 nm is attributed to FCY and the low absorbance peak at 630 nm to FCB. The concentration of this dye solution was standardized with FCY at 0.16% w/v and FCB at 0.001% w/v, denoted by Cdye = 100. Solutions were then prepared at increased concentrations of cdye = 2, 5, 8, 10, 20, 30, 100, 200, and 300.
For the samples containing scattering agents, solutions of Cdye = 0, 2, 5, 10, 20, 30, 40, 50, 60, 80, and 100 were prepared with the inclusion of polystyrene microspheres (PSs) (Polysciences Inc., Warrington, PA, USA) at a concentration of 0.0364 spheres/µm3, dispersed uniformly throughout the solution.

2.2. Setup

The absorbance spectra A(λ) were measured using an integrating sphere (IS) built into a SolidSpec-3700DUV spectrophotometer over a wavelength range of 350 to 850 nm. A(λ) is the absorbance with the empty IS as the baseline. The setup for the measurements is shown in Figure 1.
The absorption coefficients µa(λ) of the dye solutions were obtained from the absorbance spectra, A(λ), measured using the conventional setup shown in Figure 1a. In this configuration, each dye solution was placed in a rectangular optical cell made of quartz glass with a PL of 10 mm and positioned at the entrance of the IS. In the traditional setup, the absorption is generally overestimated due to the loss of backward-scattered light; however, since the scattering in the dye solutions is negligible within the measured wavelength range, the absorption spectra obtained in this configuration were considered to reflect the true values.
For the measurement of A(λ) of scatterer-added samples, it was essential to collect all scattered light to detect light for various PLs. Consequently, the measurements were conducted in the setup shown in Figure 1b. In this setup, the scatterer-added samples were placed in a cylindrical optical cell made of quartz glass, as shown in Figure 1c, and inserted through the diffuse reflection measurement window of the IS. After the insertion of the cell, the diffuse reflection window was sealed with a white board made of the same material as the IS’s inner wall to ensure the complete collection of scattered light.

2.3. Monte Carlo Simulation

When samples are placed within an integrating sphere (IS) or scattering samples are involved, the light within the IS and the sample can follow various paths, resulting in a broad distribution of PLs. This complexity makes it challenging to derive the absorption coefficient μa from the measured absorbance A. Therefore, to estimate the relation between A and μa and to derive μa from A, ray tracing using Monte Carlo (MC) simulations was implemented [44].
The specific parameters and algorithmic details used for the Monte Carlo (MC) simulations in this paper are detailed in reference [18]; hence, only an overview of the MC simulation is provided here. In this simulation, the absorption coefficient μa, scattering coefficient μs, and anisotropy factor g of the sample are used as input parameters, and the absorbance A is estimated when the sample is placed within the IS. This simulation tracks the behavior of photons in three dimensions based on the actual measurement setup. It takes into account the size of the IS, the positions of apertures and detectors, and the shape and placement of the sample and meticulously simulates the absorption, scattering, and reflection of light within the IS and the sample.

2.3.1. Estimation of µa for Scatterer-Added Samples by MC

Using this simulation, µa was determined from A through the following steps:
  • Estimation of A for each λ and µa by MC: MC simulations were performed under a total of 4680 conditions, corresponding to 36 different wavelengths λ and 130 different absorption coefficients µa, as shown in Table 1. For each combination of λ and µa, AMC was calculated as the estimation of the absorbance A that would be measured in the setup shown in Figure 1b. The remaining input parameters, the scattering coefficient µs and anisotropy factor g, were calculated for each λ based on Mie scattering theory for PSs 500 nm in diameter [Appendix A]. Calculations based on Mie scattering theory were performed using a Fortran code downloaded from reference [45]. The refractive index of PSs and the refractive index of the medium, as input parameters for these calculations, were determined using the first-term Sellmeier equation cited in reference [46] for PSs [Figure A1a] and set at 1.33 for the medium, corresponding to the refractive index of water. The Monte Carlo (MC) ray-tracing simulations were conducted 50,000 times for each condition, and the average detected intensity from these simulations was used as the measured intensity. In processing the MC results, the baseline AMC(λ, 0), which represents the results for samples containing only PSs (corresponding to cdye = 0, µa = 0), was subtracted from AMC(λ, µa). This approach follows the processing of measured data.
2.
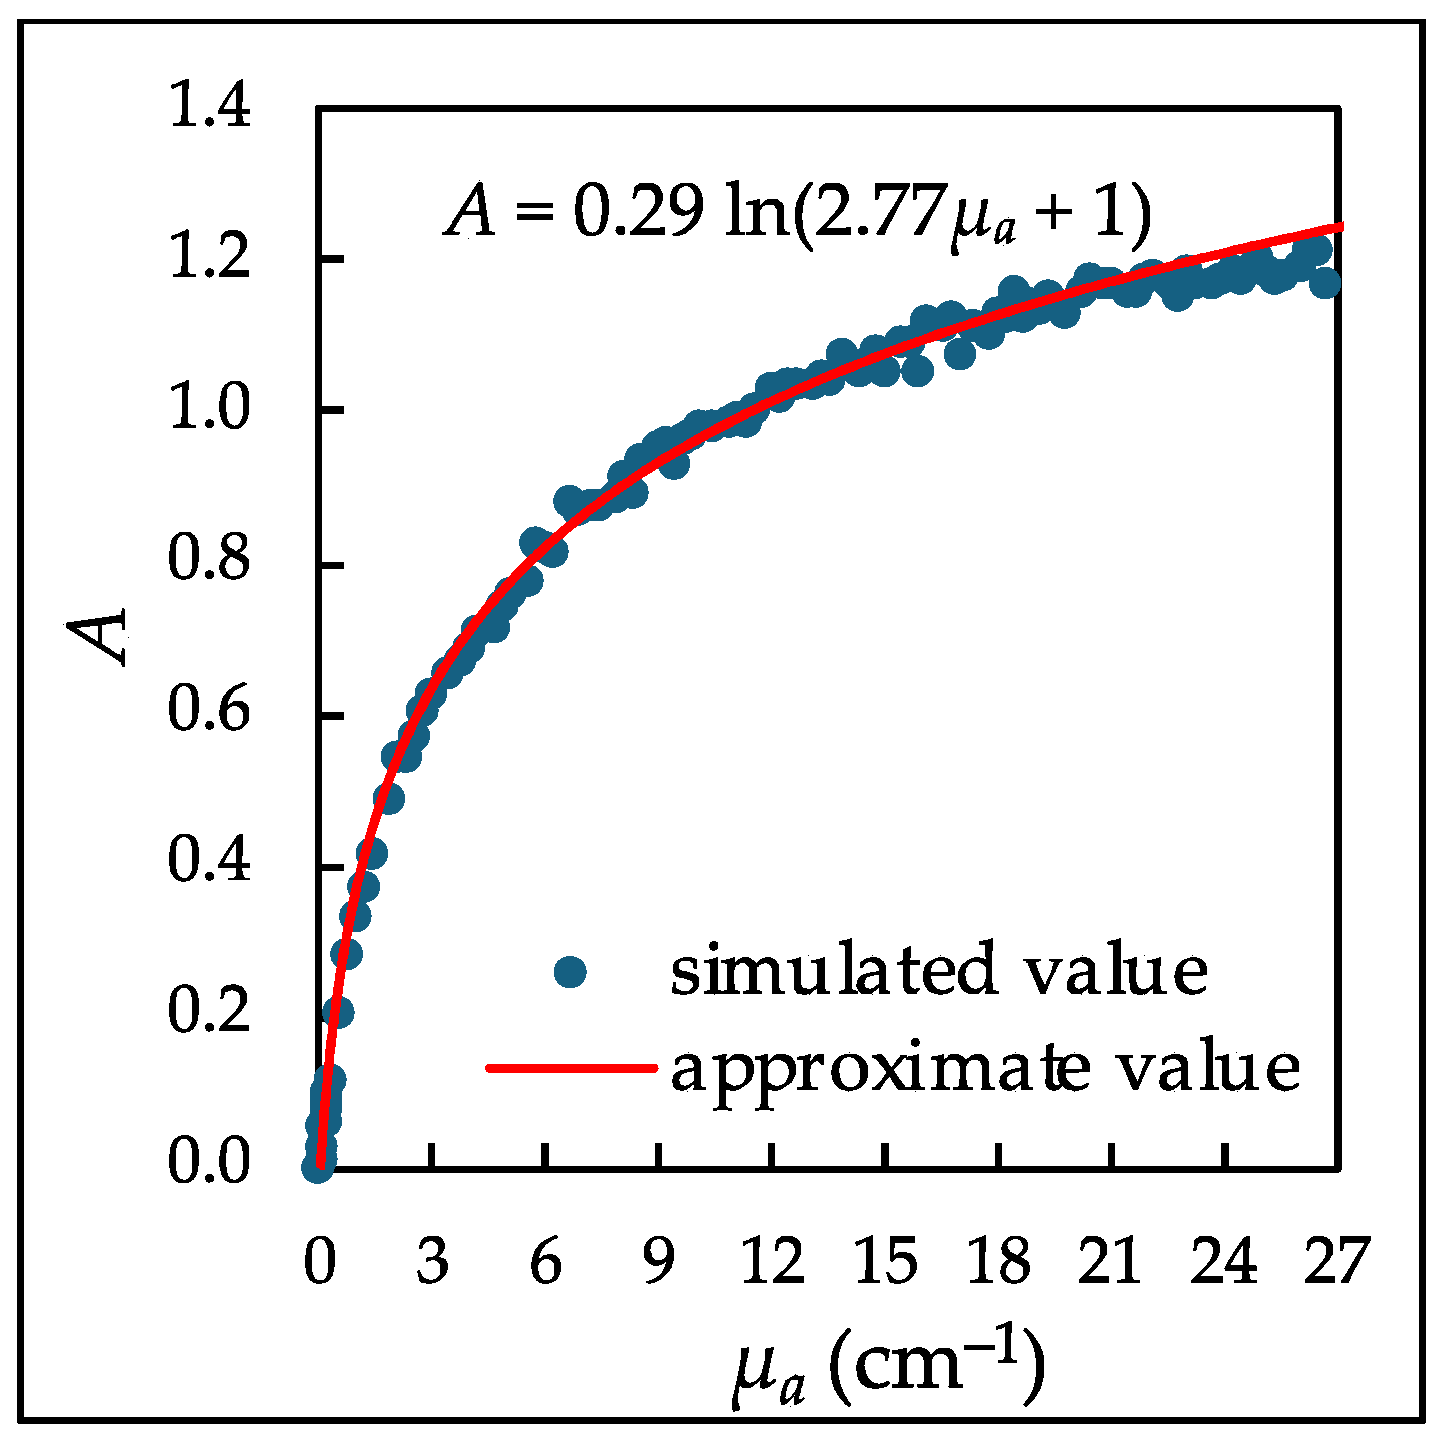
Defining the relation between A and µa: The relation between A and µa was defined by fitting the simulation results to a correction function. As an example, the MC results at an incident-light wavelength of 426 nm are shown in Figure 2. The MC results, indicated by blue dots, were fitted with the following logarithmic function, shown as the red line:
A(λ, μa) = pλ ln(qλ μa + 1),
where pλ and qλ are fitting parameters. Equation (1) serves as an empirical function to smooth the simulation results and to analytically derive the absorption coefficient µa from the measured absorbance A. This procedure was applied to all wavelengths listed in Table 1, and the parameters pλ and qλ for each λ were determined. Estimates of µa can be obtained by substituting the measured values of A into the inverse function of Equation (1):
μa(λ, A) = (1/qλ) [exp(A(λ)/pλ) − 1].

2.3.2. Estimation of PL Distribution

In the Monte Carlo ray-tracing simulations, the distribution of PLs for detected light was assessed for 500 PLs, {d1, …, d500}, ranging from 0 to 500 mm in 1 mm increments. The following procedure was used to assess the PL distribution:
  • Initialize the count for each PL in {d1, …, d500} to zero.
  • During each simulation run, if a photon reaches the detector, determine which of the PLs {d1, …, d500} the total distance traveled by the photon within the sample falls into and increment that PL’s count by one.
  • After all ray-tracing simulations are complete, calculate the percentage that the count of each PL represents out of the total counts for all PLs.

3. Results and Discussion

3.1. Determination of μa of Dye Solutions

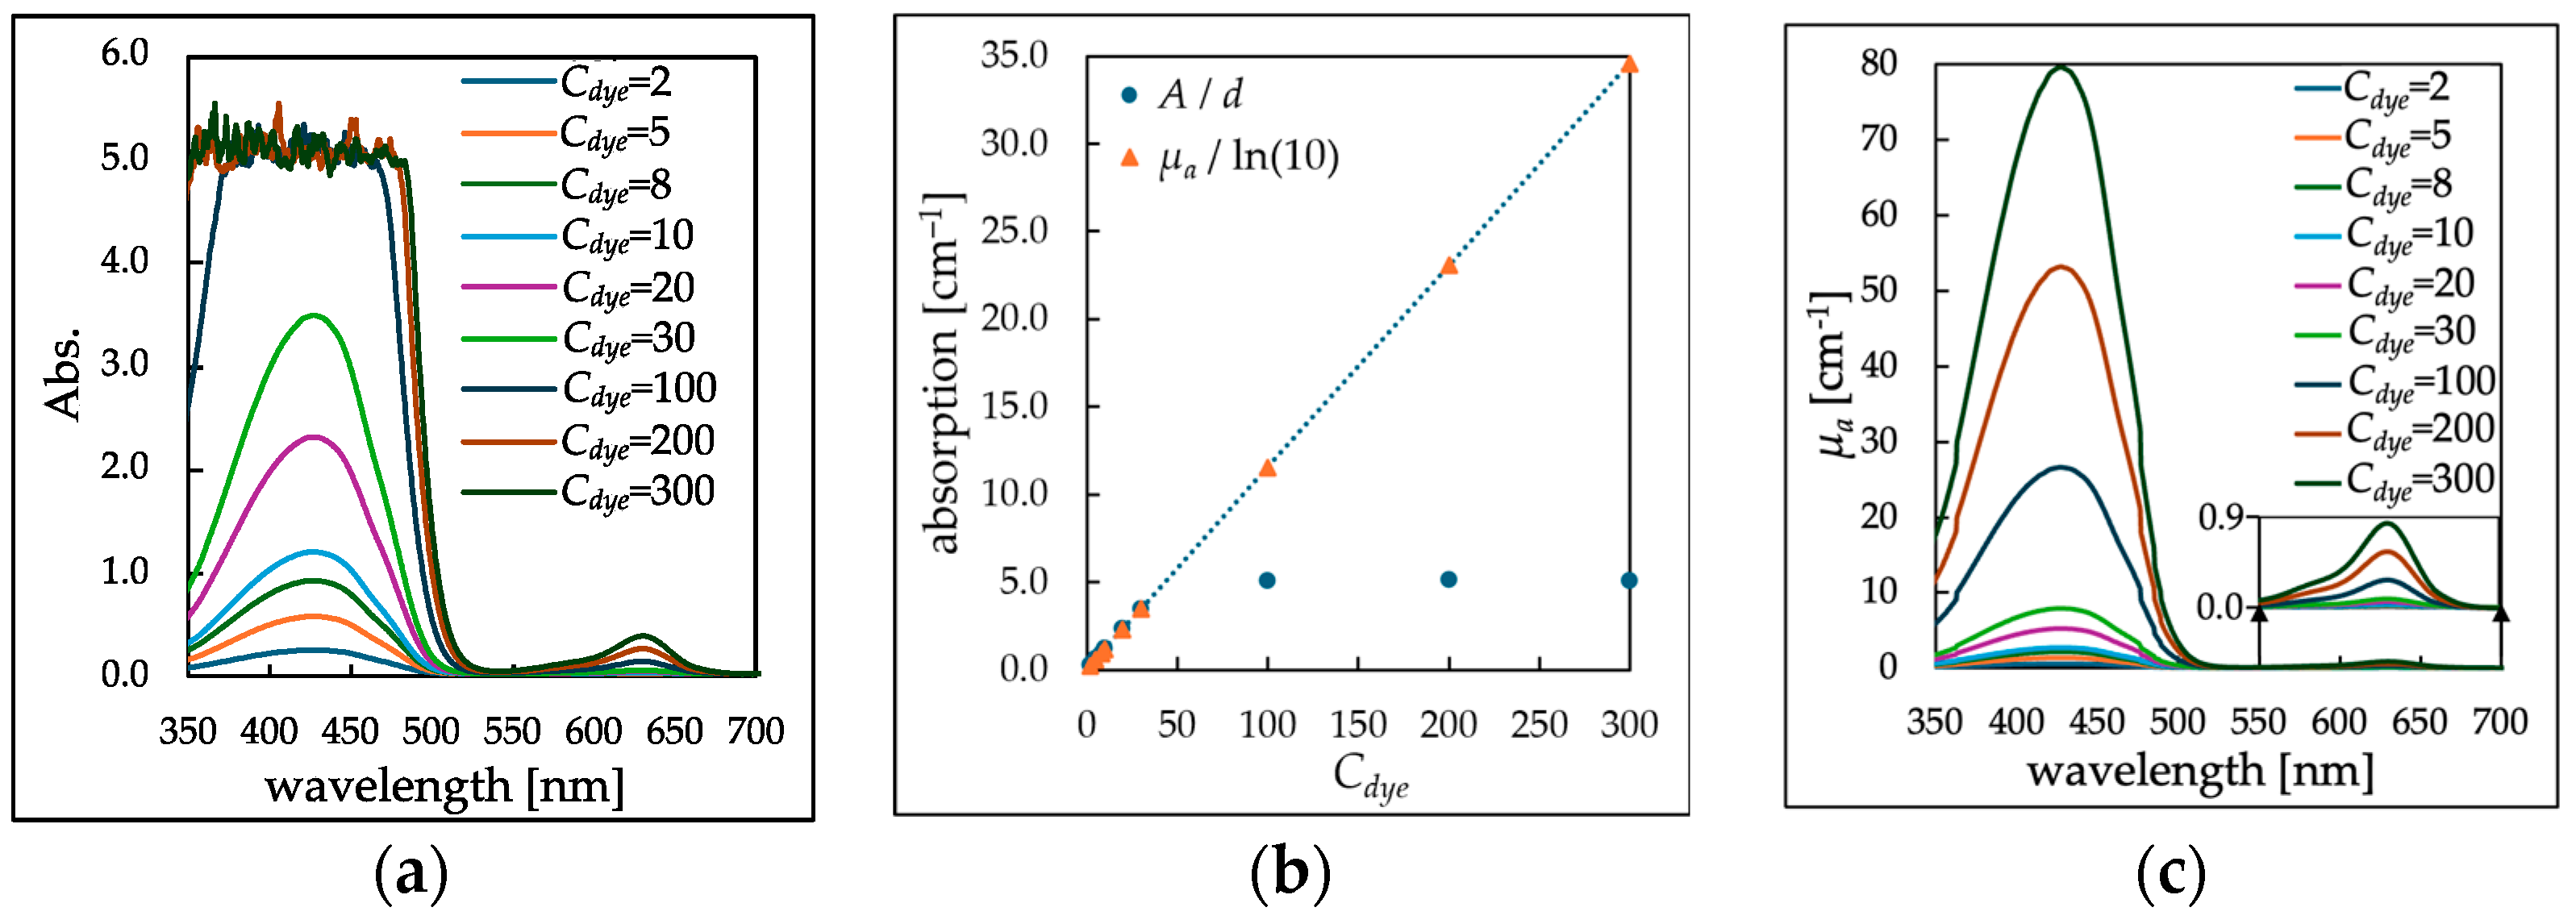
To determine the absorption coefficient µa of the dye solutions, absorbance spectra A(λ, Cdye) were measured for various concentrations of the dye solutions. The measurements were conducted using the setup shown in Figure 1a. As shown in Figure 3a, A(λ, Cdye) features a high absorption peak at 426 nm originating from FCY and a low absorption peak at 630 nm from FCB.
Due to the limitations of the measuring equipment, absorbance values up to 4 were considered reliable in the high-absorption region. For unmeasurable high-absorption regions, A(λ, Cdye) was estimated from the relation between Cdye and A(λ, Cdye) in lower-absorption regions. For instance, Figure 3b illustrates the relation at 426 nm, where data below an absorbance of 4 were used to derive the linear approximation:
A(λ, Cdye)/d = a Cdye + b,
where a and b are constants, and d is the path length of the optical cell (1 cm). Using Equation (3), the absorption coefficient was calculated as follows:
μa(λ, Cdye) = ln(10) {A(λ, Cdye) − A(λ, 0)}/d = a ln(10) Cdye.
The calculated μa values were considered the true values.
Figure 3c shows the calculated absorption spectra for each wavelength. The intensity ratio of the high absorption peak at 426 nm to the low absorption peak at 630 nm was 95:1.

3.2. Simultaneous Detection of High and Low Absorption Peaks by Adding Scatterers to Samples

3.2.1. Absorbance Spectrum of Scatterer-Added Samples

Figure 4 shows the results of absorbance measurements for dye solutions of various Cdyes with a constant concentration of polystyrene spheres (PSs) dispersed, using the setup shown in Figure 1b. Figure 4a shows the absorbance spectra of scatterer-added samples, A(λ, Cdye) − A(λ, Cdye = 0), where A(λ, Cdye = 0) serves as the baseline absorbance, representing conditions with only PSs and no dye present. In these scatterer-added samples, even at sufficiently high Cdye for the low absorption peak to be detected with significant intensity, the high absorption peak at 426 nm did not flatten, allowing for the detection of both the high absorption peak (426 nm) and the low absorption peak (630 nm).
Figure 4b,c illustrate the relation between Cdye and A at the high and low absorption peaks, respectively. In the low-absorption region, the peaks increased linearly with concentration, similar to the results in Figure 3 without scatterers [Figure 4c], while changes in A became more gradual at higher absorptions [Figure 4b]. This behavior enables the inclusion of high-concentration absorption peaks within the measurable range of absorbance. Although the rate of increase in absorbance A becomes more gradual as the absorption intensifies, A does not reach a constant value, indicating that the peaks do not flatten out.
Figure 4d shows the intensity ratios of the high absorption peak to the low absorption peak at various Cdyes. For all Cdyes, the ratios were smaller than the actual ratio of 95, and they decreased further at higher Cdye. At the highest Cdye (=100), the ratio dropped to 13, equivalent to 0.14 times the actual ratio, indicating that adding scatterers compresses the high absorption peak, thus enabling the detection of larger absorption peaks beyond the measurement limits.

3.2.2. Comparison of Peak Shapes

We evaluated whether the absorbance peak shapes of the scatterer-added dye solutions, as measured using the setup in Figure 4a, matched the actual absorption spectrum peak shapes depicted in Figure 3a. The peak shapes were compared by normalizing both the high and low absorption peaks to a maximum intensity of unity.
Figure 5 shows a comparison of the absorption peak shapes between the measured absorbance spectrum A(λ) and the actual absorption spectrum µa(λ) for scatterer-added samples (Cdye = 100). Figure 5a,b show the shapes of the high absorption peak (around 426 nm) and the low absorption peak (around 630 nm), respectively. At the low absorption peak, the shapes of A(λ) and µa(λ) closely matched [Figure 5b], whereas a noticeable discrepancy was observed at the high absorption peak [Figure 5a]. This difference is believed to arise because A changes linearly with Cdye (µa) at low absorption, as shown in Figure 4c, while it changes nonlinearly at high absorption, as shown in Figure 4b.
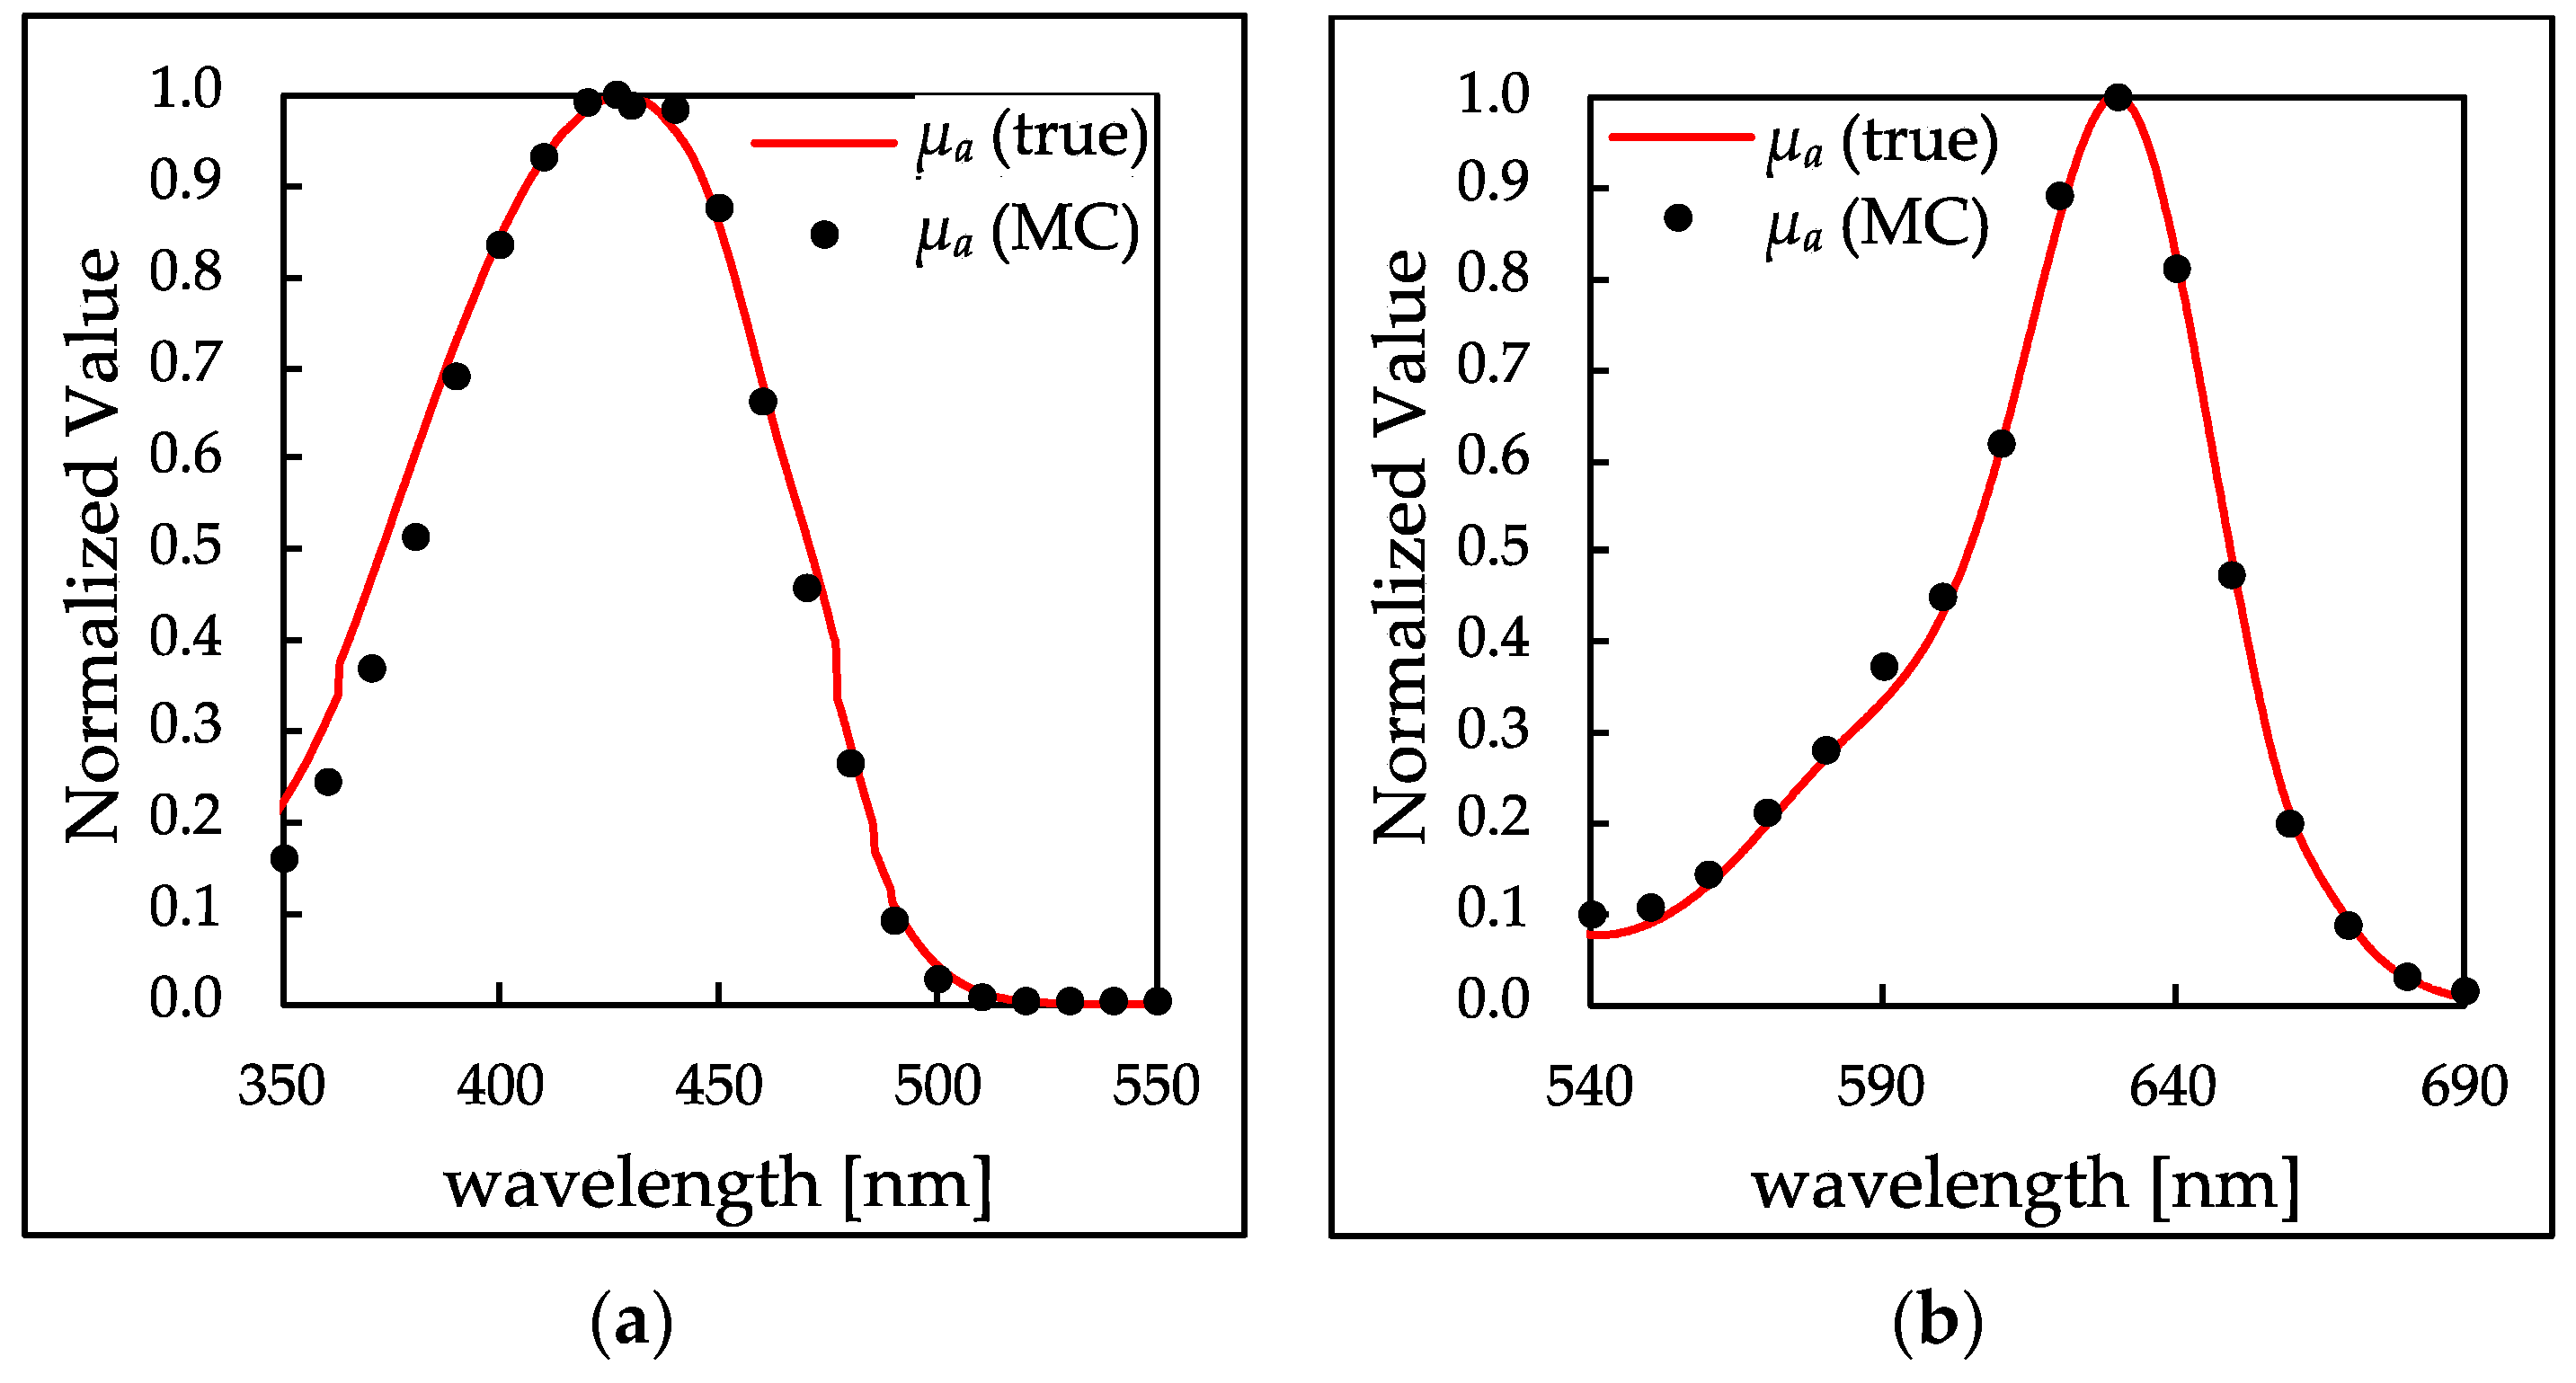
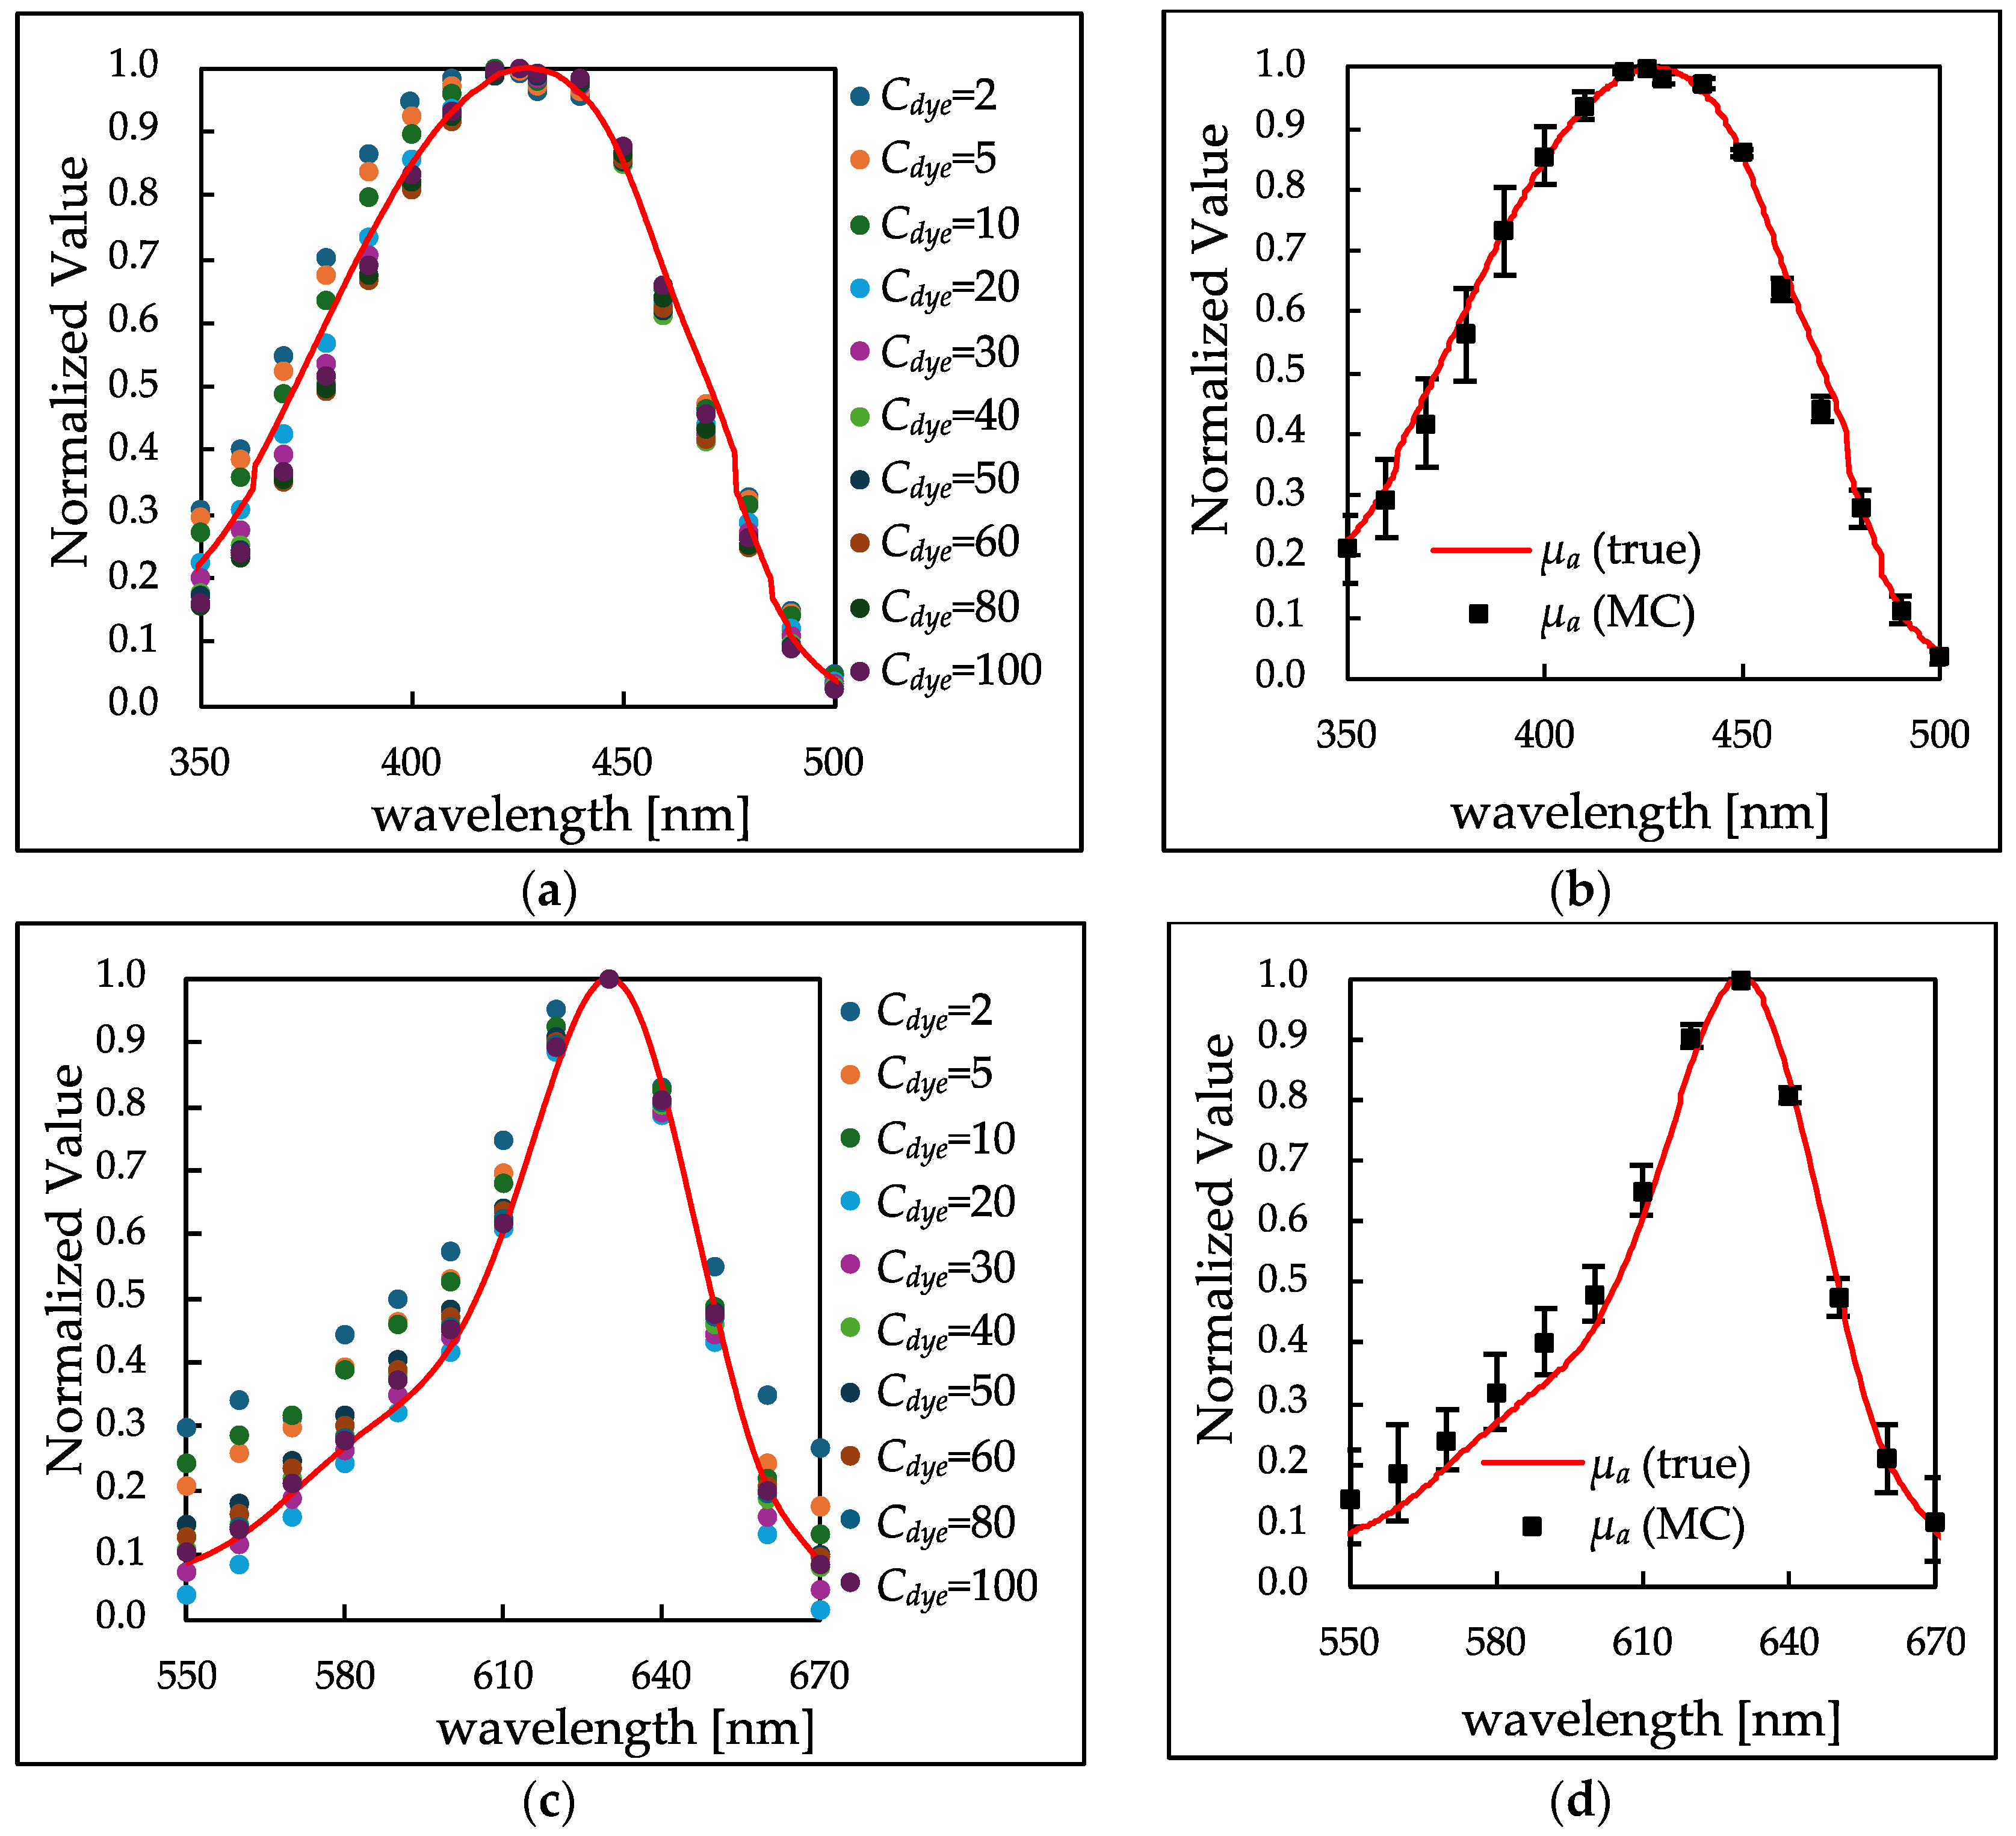
To accurately estimate the actual µa(λ) from the absorbance spectra A(λ), MC simulations were conducted, as outlined in Section 2.3. Figure 6 presents comparisons between µa(λ) calculated from A(λ) of the scatterer-added sample (Cdye = 100) in Figure 4a using MC and the true µa(λ), as calculated by Equation (2). Figure 6a,b show that the shapes of the absorption peaks calculated by MC replicate the shapes of the true peaks.
Furthermore, Figure 7 shows the estimated absorption peak shapes and their variances from Monte Carlo (MC) simulations based on the measured absorbance spectra A(λ, Cdye) of scatterer-added samples at various Cdyes, as shown in Figure 4a. Although the peak shapes were generally well reproduced for all concentrations at the high absorption peak [Figure 7a], increased variance was observed in the shorter-wavelength region [Figure 7b]. This increase in variance is likely due to the higher scattering efficiency of PSs at shorter wavelengths [Figure A1b], which leads to a greater number of scattering events during MC simulations, consequently resulting in larger estimation errors in the simulated photon propagation paths within the sample.
For the low absorption peak, as shown in Figure 7b, the estimated absorption peak shapes from Monte Carlo simulations replicate the true absorption peak shapes. However, the peaks estimated from measurement data at low concentrations (Cdye = 2, 5, 10) exhibit errors. This inaccuracy is due to the insufficient peak intensities at these concentrations, where the peak intensities at 630 nm (the wavelength of the low absorption peak) are A = 0.003, 0.005, and 0.011 [Figure 4c], which are not large enough to ensure precision. As adding scatterers allows the high absorption peaks to be kept within the measurable limits of the equipment, it is recommended to set concentrations where the low absorption peak intensities (A > 0.1) are sufficiently large to ensure accuracy.

3.3. PL Distribution of Scatterer-Added Samples

To investigate the PL distribution in scatterer-added samples, MC simulations were conducted according to the methodology outlined in Section 2.3.2. Furthermore, to assess the extent of the PL distribution caused by the addition of scatterers, simulations were also performed under similar conditions (the setup in Figure 1b) but without the scatterer addition, allowing for a comparative analysis between scatterer-added and non-scatterer samples. (The results of absorbance measurements of a sample without scatterers measured in the setup shown in Figure 1b are discussed in Appendix B).
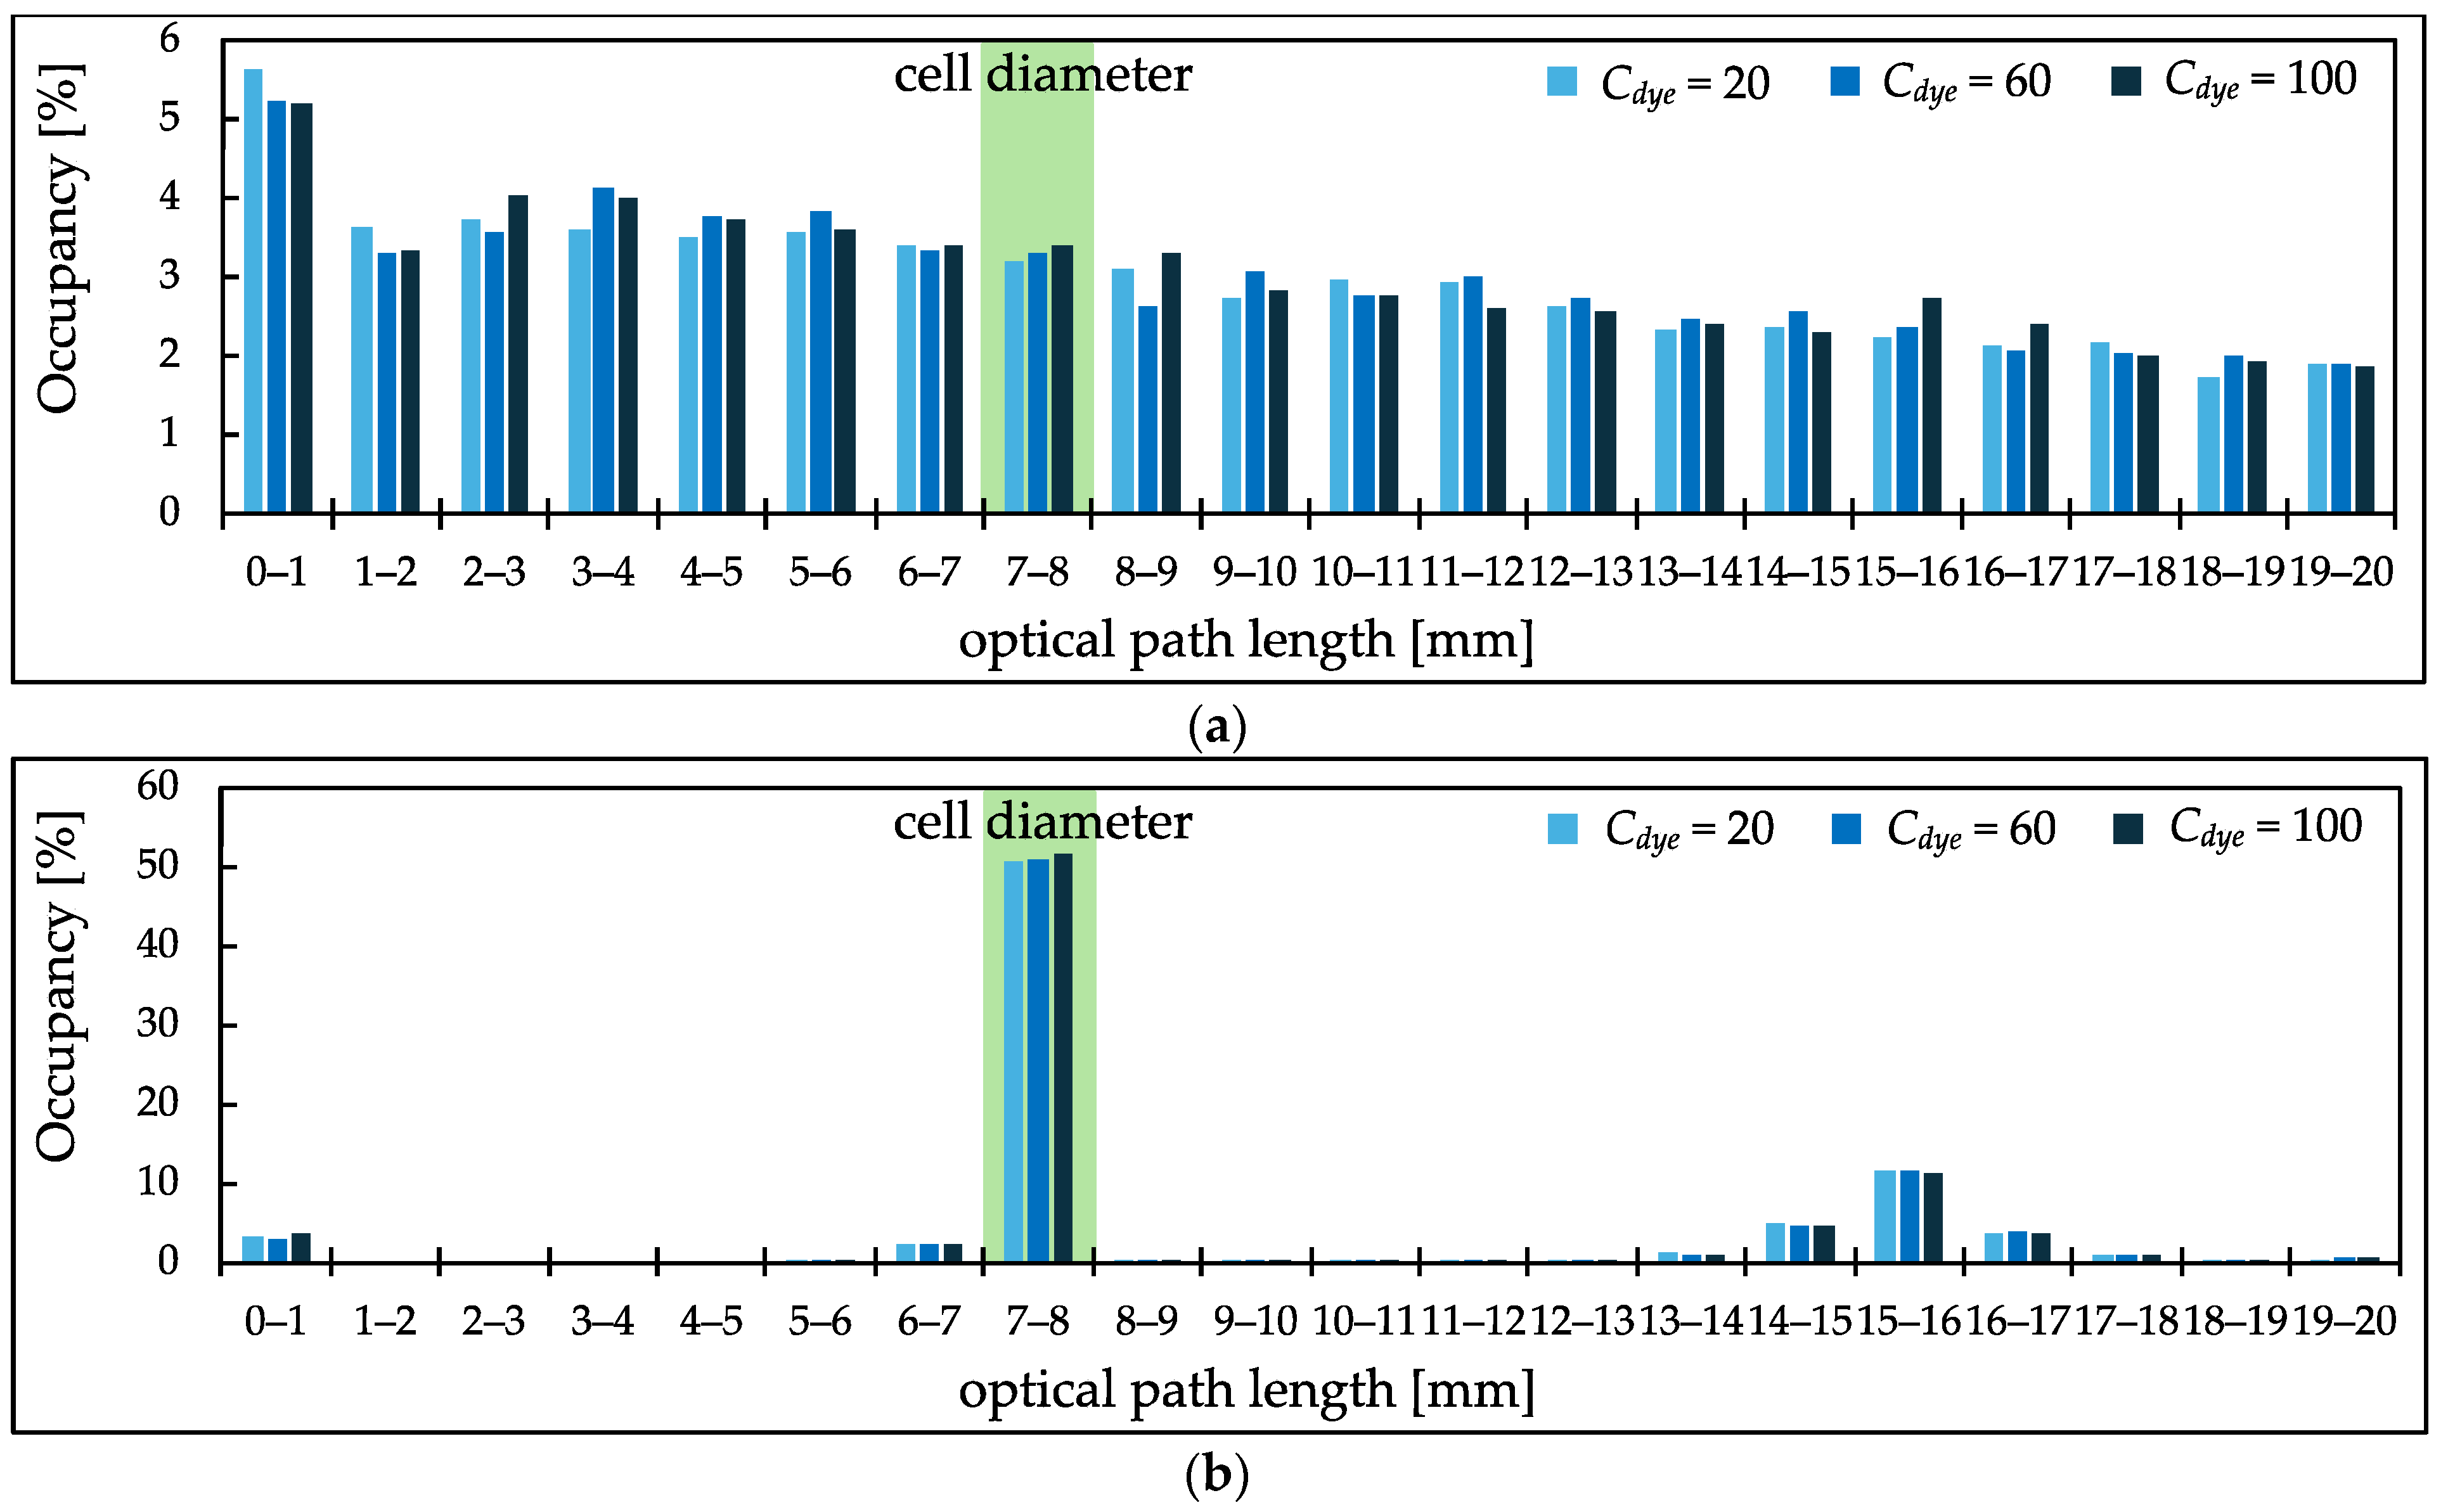
Figure 8 shows the PL distribution at 426 nm (high absorption peak) ranging from 0 to 20 mm, divided into 1 mm intervals. Without scatterers, the distribution predominantly concentrates around the cell’s diameter [Figure 8b], whereas the addition of scatterers results in a significantly broader PL distribution [Figure 8a]. Moreover, in samples with added scatterers, as Cdye and consequently µa increase, it is observed that the PL distribution shifts toward shorter distances. This shift is thought to occur because, in cases of high µa, the transmitted light becomes too weak unless the PLs are sufficiently short. This result indicates that the addition of scatterers ensures the presence of sufficiently short light paths, allowing for the accurate measurement of absorbance spectra without a flattening of peaks, even in high-absorption areas. In contrast, in samples without scatterers, the distribution is observed to be within the 0 to 1 mm range, but this predominantly includes light that has reflected off the surface of the cell, essentially resulting in zero PL. Light with zero PL does not contribute useful information about the sample’s absorption and behaves as stray light.
Figure 9 shows the PL distribution at 630 nm (low absorption peak) ranging from 0 to 20 mm, divided into 1 mm intervals. It demonstrates that, similar to the high absorption peaks, the addition of scatterers enables a broader distribution of PLs even at the low absorption peak.
Furthermore, a comparison between the PL distributions at the high absorption peak [Figure 8a] and the low absorption peak [Figure 9a] for scatterer-added samples with Cdye = 100 shows that the distribution at the high absorption peak is skewed toward shorter PLs compared to that at the low absorption peak. This indicates that the addition of scatterers tailors the PL distribution according to the level of absorption. As a result, peaks do not flatten in high-absorption areas, and sufficient absorption is achieved in low-absorption areas, enabling the accurate simultaneous measurement of both high and low absorption peaks.
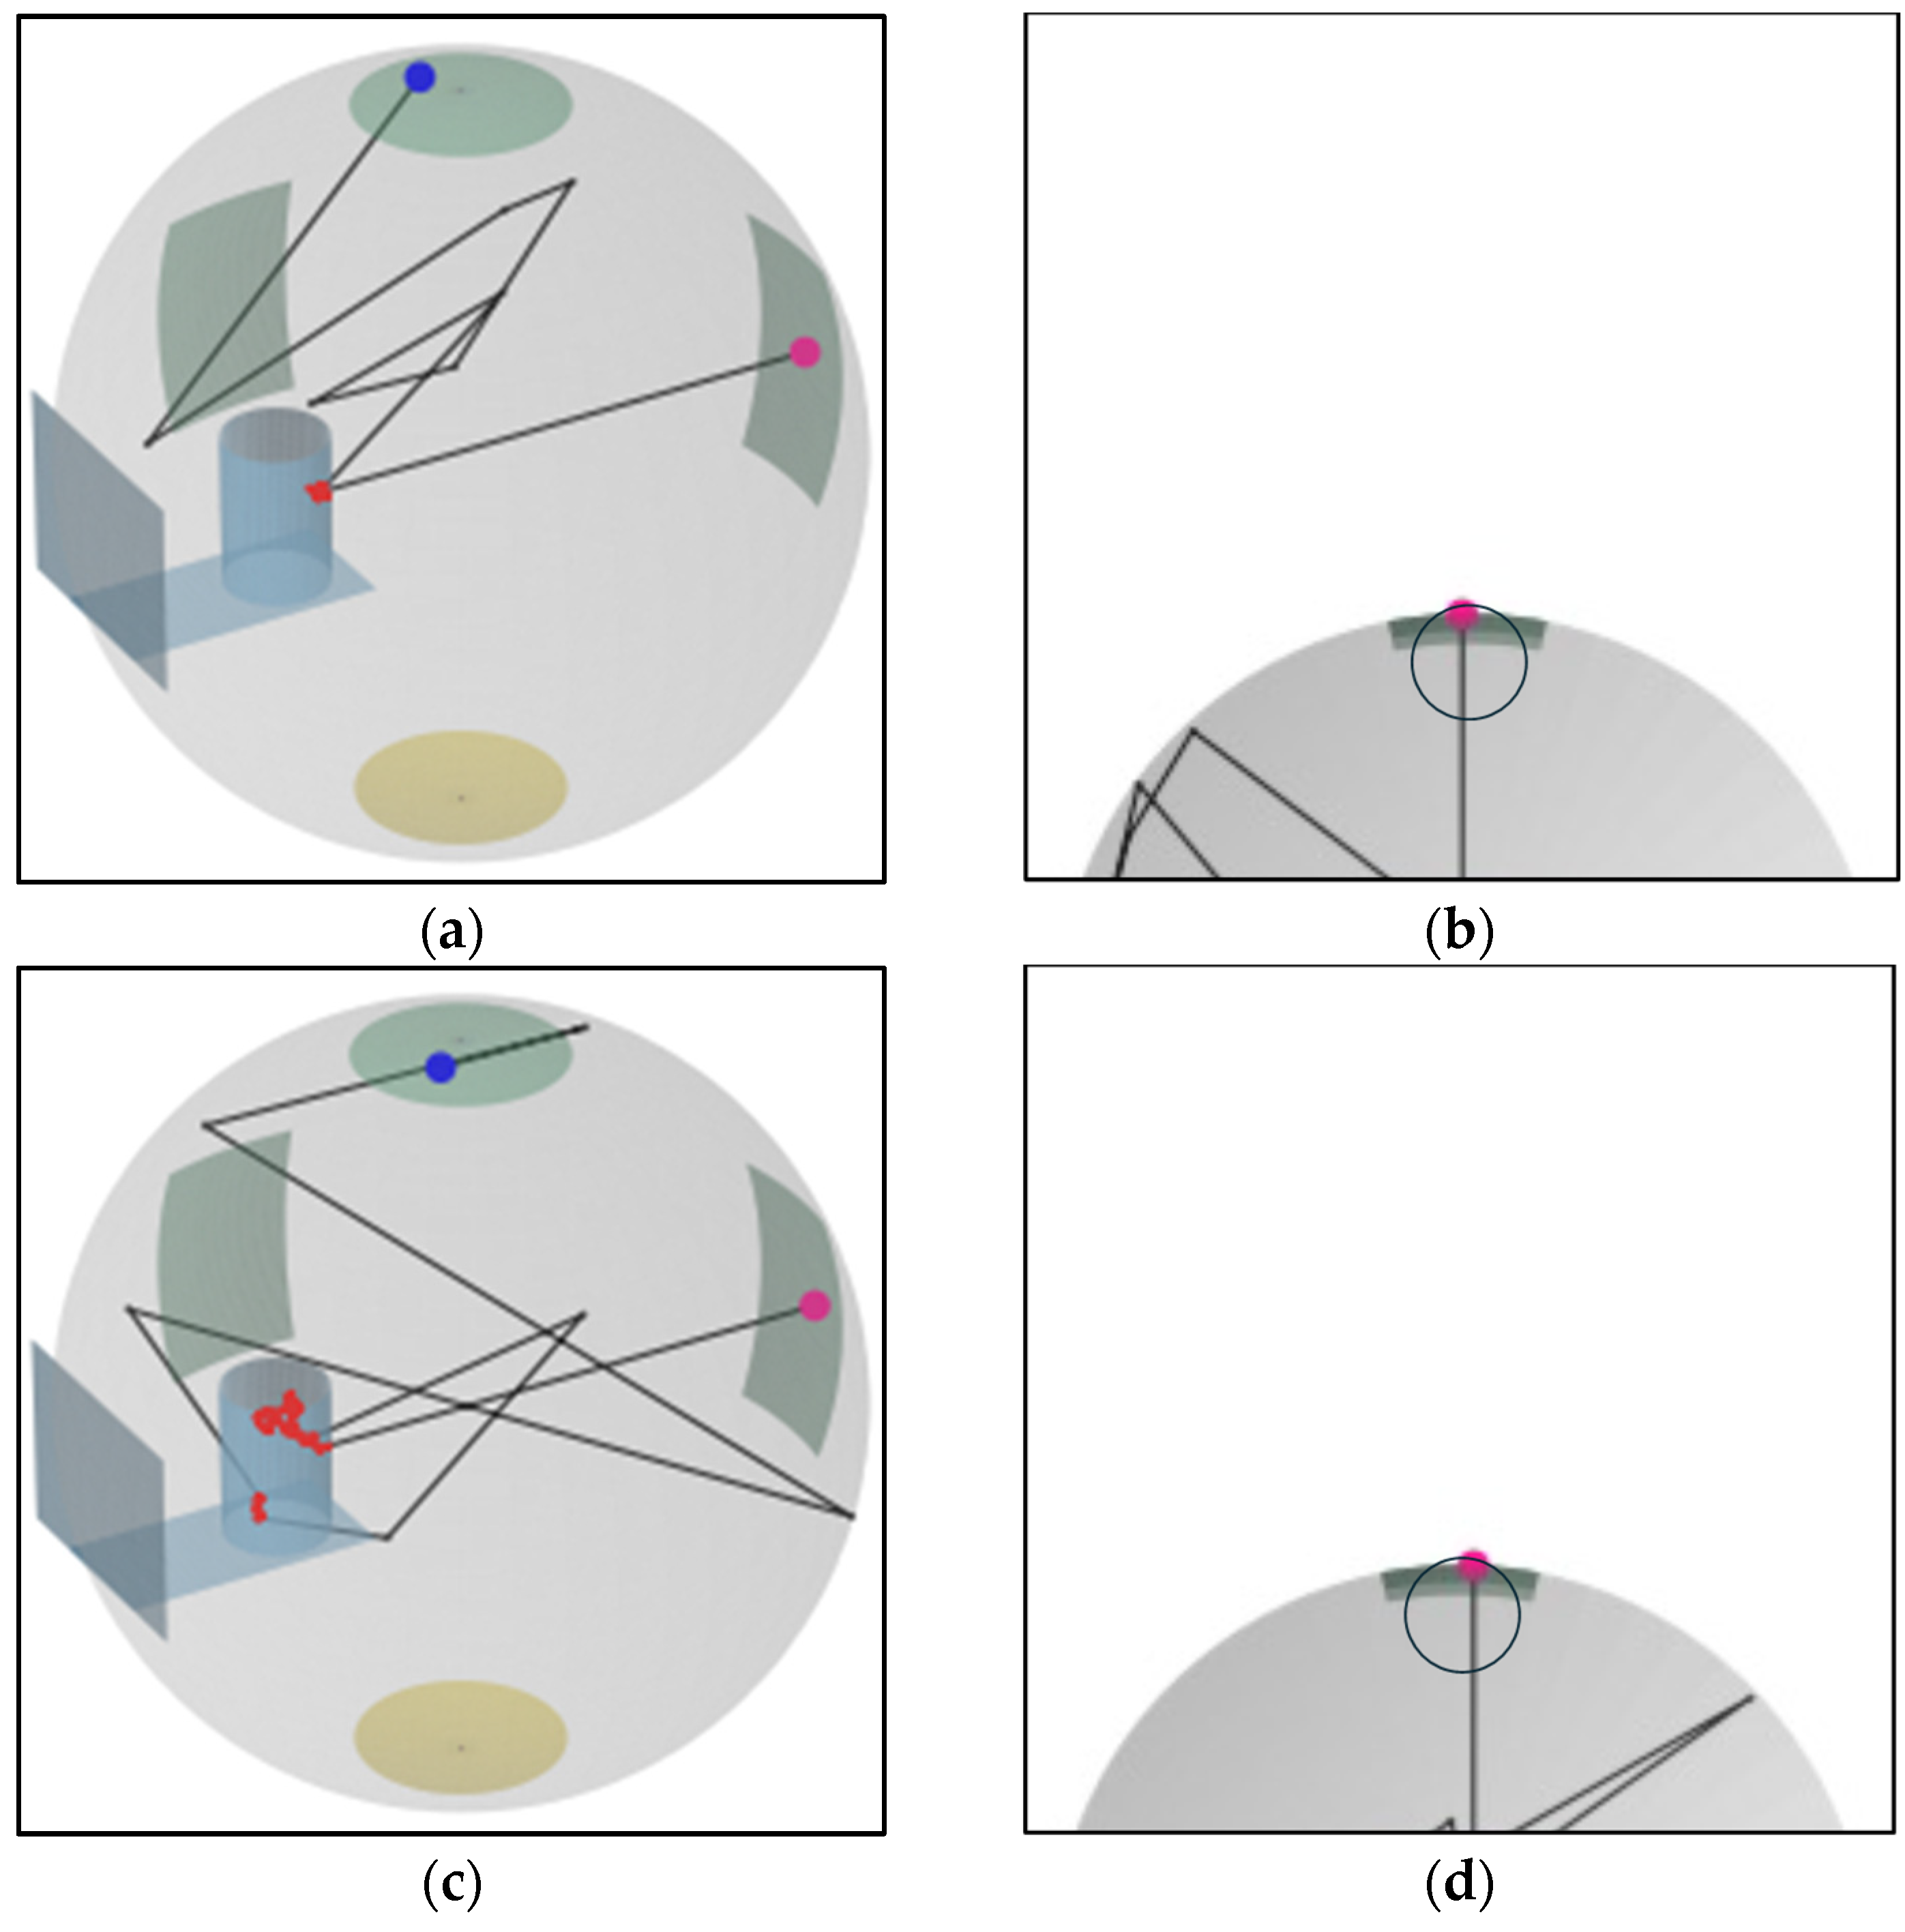
A detailed visual representation of the path-length distribution in scatterer-added samples can be found in Appendix C, Figure A3, which complements the discussion here.

4. Conclusions

In absorption spectroscopy, accurate measurements typically necessitate adjusting the PL to suit the sample’s absorption level, a challenging task when samples display multiple absorption peaks with significant intensity differences. In conventional methods, it is difficult to detect all peaks in a single measurement due to these intensity differences.
To address this issue, we propose a method that disperses non-absorbing scatterers within the sample to create a broad distribution of PLs, enabling high-dynamic-range absorption spectroscopy. Scattered light may propagate through the sample over long distances by multiple scattering or may scatter out of the sample in short trajectories. This approach captures scattered light, including light with any PL, by deploying the sample within an integrating sphere (IS).
In this method, the placement of the sample inside the IS and the multiple scattering within the sample complicate the paths of light, making it difficult to determine the relation between the sample’s absorption coefficient µa and the measured absorbance A. To address this complexity, a ray-tracing simulation using the Monte Carlo (MC) method was implemented. This simulation estimates the absorbance A and the PL distribution based on the sample’s absorption coefficient µa, scattering coefficient µs, and anisotropy factor g.
To validate the effectiveness of this method, Food Color Yellow and Food Color Blue were dissolved in water to create dye solutions with a peak intensity ratio of 95:1 between the high absorption peak (426 nm) and the low absorption peak (630 nm). Polystyrene spheres (PSs) were dispersed as scatterers in these solutions to determine whether both the high and low absorption peaks could be detected in a single measurement.
The results of the measurements demonstrated that the method effectively detected both high and low absorption peaks simultaneously without flattening the high absorption peak, even at high concentrations, where the low absorption peak was sufficiently detectable. The intensity ratio of the high absorption peak to the low absorption peak, as measured by this method, decreased with increasing dye concentration, from an actual ratio of 95 to as low as 13 in the tested samples. This reduction enables the accommodation of peaks with large intensity differences within the measurable range of the detector.
The measured absorption peak shapes, although not flattened in the high-absorption region, differed from the actual peak shapes. This discrepancy is due to the complexity introduced by the scatterers in the sample’s propagation path, which causes the measured absorbance A to increase nonlinearly with respect to the absorption coefficient µa. To address this, we conducted MC for various µa values to derive the relation between µa and A, allowing us to accurately reproduce the actual absorption peak shapes from the measured absorbance spectra.
Additionally, to investigate the impact of scatterer dispersion on the PL distribution, MC simulations were performed to estimate the PL distributions for dye solutions with and without scatterers. The simulation results revealed that dispersing scatterers significantly increases the variance of the PL distribution. Moreover, with scatterers, as µa increases, the PL distribution shifts toward shorter paths. This suggests that adding scatterers allows for a PL distribution that is appropriate for the magnitude of absorption, enabling the simultaneous detection of both high and low absorption peaks.
In this paper, simulations were conducted at every 10 nm wavelength interval, and from these Monte Carlo results, equations correlating A and µa were defined for each wavelength λ. Moving forward, it is crucial to develop a formula that includes λ as a parameter, allowing for the determination of µa directly from A and λ.
Additionally, when placing samples inside the IS, stray light caused by reflections from the optical cell surface and other non-transmitted light reduce the dynamic range of absorption measurements. Future work will explore arrangements and designs of the optical cell to achieve a higher dynamic range in absorbance spectroscopy.

Author Contributions

Conceptualization, E.T. and A.M.; methodology, A.M., K.Y. and E.T.; software, A.M.; validation, A.M.; formal analysis, A.M.; investigation, A.M. and K.Y.; resources, K.Y. and E.T.; data curation, A.M.; writing—original draft preparation, A.M. and K.Y.; writing—review and editing, E.T. and K.Y.; visualization, A.M.; supervision, K.Y. and E.T.; project administration, K.Y. and E.T. All authors have read and agreed to the published version of the manuscript.

Funding

This work was supported by JST SPRING, Grant Number JPMJSP2151.

Institutional Review Board Statement

Not applicable.

Informed Consent Statement

Not applicable.

Data Availability Statement

The data presented in this study are available on request from the corresponding author.

Conflicts of Interest

The authors declare no conflicts of interest.

Appendix A

This section details the calculation results for the scattering characteristics of PSs with a diameter of 500 nm based on Mie scattering theory. As input parameters for MC, the scattering efficiency and the anisotropy coefficient were required. These parameters were calculated for each wavelength from the refractive index of PSs using Mie scattering theory. Figure A1 presents the wavelength dependence of the input parameter, the refractive index of PSs, and the output parameters, PSs’ scattering efficiency and anisotropy factor g. The wavelength dependence of the PS refractive index was calculated using the first term of the Sellmeier equation, as shown in reference [46].
In this study, since the imaginary part of the dye solution’s refractive index, κ, is sufficiently small (for the high absorption peak at λ = 426 nm, where µa < 12 cm−1, resulting in κ = µa λ/4π < 4.068 × 10⁻⁵), the scattering coefficient µs and the anisotropy factor g were calculated using conventional Mie theory. However, in cases where κ is large, calculations should be conducted using a modified Mie theory that accounts for the absorption properties of the medium [47,48].
Figure A1. (a) The wavelength dependence of the refractive index of PSs. (b) The wavelength dependence of the scattering efficiency of PSs, calculated using Mie scattering theory. (c) The wavelength dependence of the anisotropy coefficient g of PSs, calculated using Mie scattering theory.
Photonics 11 00556 g0a1

Appendix B

Figure A2 displays the absorbance spectra of dye solutions without scatterers, measured using the setup described in Figure 1b. Without scatterers, at a concentration (Cdye = 100) where the low absorption peak is detected with sufficient intensity, the high absorption peak is found to be flattened. In contrast, the absorbance spectra of scatterer-added samples measured under the same conditions [Figure 4a] do not show a flattened high absorption peak, and the peak shape is retained. These results indicate that the ability to capture the shape of the high absorption peak in scatterer-added samples, when measured within an integrating sphere (IS), is due to the effect of adding scatterers, rather than the presence of the IS.
Figure A2. The absorbance spectra of dye solutions of various concentrations without added scatterers, measured in the arrangement shown in Figure 1b.
Photonics 11 00556 g0a2

Appendix C

Figure A3 illustrates the trajectories of light rays within an IS simulated using MC. The figure depicts the IS, its opening and detection components, and the optical cell, reflecting the actual experimental arrangement. Figure A3a,b, as well as Figure A3c,d, show the same light ray trajectory from different viewpoints, demonstrating the presence of both short and long PLs of light exiting the sample due to the addition of scatterers.
Figure A3. The trajectories of light rays simulated using MC ray tracing for absorbance measurements of scatterer-added samples, as configured in Figure 1b. The simulation was conducted under conditions of a light wavelength of 426 nm and a dye concentration of Cdye = 20. The sphere represents the IS, with the green surface on the sphere indicating the aperture and the yellow surface representing the detection section. The cylindrical and planar objects depicted in aqua illustrate the optical cell shown in Figure 1c. Light rays enter the IS at the starting point (large pink circle), travel along the paths in black lines, and end at the points satisfying the simulation conditions (large blue circles). Red circles indicate points where light rays hit scatterers within the sample, causing scattering events. Panels (ad) display the same light paths from different perspectives.
Photonics 11 00556 g0a3

References

  1. Adimule, V.; Suryavanshi, A.; Bc, Y.; Nandi, S.S. A Facile Synthesis of Poly(3-Octyl Thiophene):Ni0.4Sr0.6TiO3 Hybrid Nanocomposites for Solar Cell Applications. Macromol. Symp. 2020, 392, 2000001. [Google Scholar] [CrossRef]
  2. Drieschner, T.; Ostertag, E.; Boldrini, B.; Lorenz, A.; Brecht, M.; Rebner, K. Direct Optical Detection of Cell Density and Viability of Mammalian Cells by Means of UV/VIS Spectroscopy. Anal. Bioanal. Chem. 2020, 412, 3359–3371. [Google Scholar] [CrossRef] [PubMed]
  3. Aleixandre-Tudo, J.L.; Buica, A.; Nieuwoudt, H.; Aleixandre, J.L.; du Toit, W. Spectrophotometric Analysis of Phenolic Compounds in Grapes and Wines. J. Agric. Food Chem. 2017, 65, 4009–4026. [Google Scholar] [CrossRef] [PubMed]
  4. McKechnie, W.S.; Tugcu, N.; Kandula, S. Accurate and Rapid Protein Concentration Measurement of In-Process, High Concentration Protein Pools. Biotechnol. Prog. 2018, 34, 1234–1241. [Google Scholar] [CrossRef]
  5. Shi, Z.; Chow, C.W.K.; Fabris, R.; Liu, J.; Jin, B. Applications of Online UV-Vis Spectrophotometer for Drinking Water Quality Monitoring and Process Control: A Review. Sensors 2022, 22, 2987. [Google Scholar] [CrossRef] [PubMed]
  6. Guo, Y.; Liu, C.; Ye, R.; Duan, Q. Advances on Water Quality Detection by UV-Vis Spectroscopy. Appl. Sci. 2020, 10, 6874. [Google Scholar] [CrossRef]
  7. Hossain, S.; Chow, C.W.K.; Hewa, G.A.; Cook, D.; Harris, M. Spectrophotometric Online Detection of Drinking Water Disinfectant: A Machine Learning Approach. Sensors 2020, 20, 6671. [Google Scholar] [CrossRef]
  8. Du, Y.; Peng, Z.; Ding, Y. Wavelength Modulation Spectroscopy for Recovering Absolute Absorbance. Opt. Express 2018, 26, 9263–9272. [Google Scholar] [CrossRef] [PubMed]
  9. Probst, J.; Howes, P.; Arosio, P.; Stavrakis, S.; deMello, A. Broad-Band Spectrum, High-Sensitivity Absorbance Spectroscopy in Picoliter Volumes. Anal. Chem. 2021, 93, 7673–7681. [Google Scholar] [CrossRef]
  10. Li, Y.; Nesterenko, P.N.; Stanley, R.; Paull, B.; Macka, M. High Sensitivity Deep-UV LED-Based z-Cell Photometric Detector for Capillary Liquid Chromatography. Anal. Chim. Acta 2018, 1032, 197–202. [Google Scholar] [CrossRef]
  11. ul Rehman, A.; Ahmad, I.; Qureshi, S.A. Biomedical Applications of Integrating Sphere: A Review. Photodiagn. Photodyn. Ther. 2020, 31, 101712. [Google Scholar] [CrossRef] [PubMed]
  12. Dazzi, A.; Deniset-Besseau, A.; Lasch, P. Minimising Contributions from Scattering in Infrared Spectra by Means of an Integrating Sphere. Analyst 2013, 138, 4191–4201. [Google Scholar] [CrossRef]
  13. Gaigalas, A.K.; He, H.-J.; Wang, L. Measurement of Absorption and Scattering with an Integrating Sphere Detector: Application to Microalgae. J. Res. Natl. Inst. Stand. Technol. 2009, 114, 69–81. [Google Scholar] [CrossRef]
  14. Merzlyak, M.N.; Razi Naqvi, K. On Recording the True Absorption Spectrum and the Scattering Spectrum of a Turbid Sample: Application to Cell Suspensions of the Cyanobacterium Anabaena Variabilis. J. Photochem. Photobiol. B Biol. 2000, 58, 123–129. [Google Scholar] [CrossRef]
  15. Röttgers, R.; Gehnke, S. Measurement of Light Absorption by Aquatic Particles: Improvement of the Quantitative Filter Technique by Use of an Integrating Sphere Approach. Appl. Opt. 2012, 51, 1336–1351. [Google Scholar] [CrossRef] [PubMed]
  16. Chess, D.J.; Billings, E.; Covian, R.; Glancy, B.; French, S.; Taylor, J.; de Bari, H.; Murphy, E.; Balaban, R.S. Optical Spectroscopy in Turbid Media Using an Integrating Sphere: Mitochondrial Chromophore Analysis during Metabolic Transitions. Anal. Biochem. 2013, 439, 161–172. [Google Scholar] [CrossRef]
  17. Villanueva, Y.; Veenstra, C.; Steenbergen, W. Measuring Absorption Coefficient of Scattering Liquids Using a Tube inside an Integrating Sphere. Appl. Opt. 2016, 55, 3030–3038. [Google Scholar] [CrossRef] [PubMed]
  18. Mori, A.; Yamashita, K.; Tokunaga, E. Reproduction of Visible Absorbance Spectra of Highly Scattering Suspensions within an Integrating Sphere by Monte Carlo Simulation. Photonics 2023, 10, 754. [Google Scholar] [CrossRef]
  19. Mori, A.; Yamashita, K.; Tabata, Y.; Seto, K.; Tokunaga, E. Absorbance Spectroscopy of Light Scattering Samples Placed inside an Integrating Sphere for Wide Dynamic Range Absorbance Measurement. Rev. Sci. Instrum. 2021, 92, 123103. [Google Scholar] [CrossRef]
  20. Nelson, N.B.; Prézelin, B.B. Calibration of an Integrating Sphere for Determining the Absorption Coefficient of Scattering Suspensions. Appl. Opt. 1993, 32, 6710–6717. [Google Scholar] [CrossRef]
  21. Numata, Y.; Nair, S.V.; Nakagawa, K.; Ishino, H.; Kobayashi, T.; Tokunaga, E. Optical Size Effect of Organic Nanocrystals Studied by Absorption Spectroscopy within an Integrating Sphere. Chem. Phys. Lett. 2014, 601, 128–133. [Google Scholar] [CrossRef]
  22. Leyre, S.; Coutino-Gonzalez, E.; Joos, J.J.; Ryckaert, J.; Meuret, Y.; Poelman, D.; Smet, P.F.; Durinck, G.; Hofkens, J.; Deconinck, G.; et al. Absolute Determination of Photoluminescence Quantum Efficiency Using an Integrating Sphere Setup. Rev. Sci. Instrum. 2014, 85, 123115. [Google Scholar] [CrossRef] [PubMed]
  23. Würth, C.; Pauli, J.; Lochmann, C.; Spieles, M.; Resch-Genger, U. Integrating Sphere Setup for the Traceable Measurement of Absolute Photoluminescence Quantum Yields in the Near Infrared. Anal. Chem. 2012, 84, 1345–1352. [Google Scholar] [CrossRef] [PubMed]
  24. Yust, B.G.; Mimun, L.C.; Sardar, D.K. Optical Absorption and Scattering of Bovine Cornea, Lens, and Retina in the near-Infrared Region. Lasers Med. Sci. 2012, 27, 413–422. [Google Scholar] [CrossRef] [PubMed]
  25. Hamdy, O.; Mohammed, H.S. Investigating the Transmission Profiles of 808 Nm Laser through Different Regions of the Rat’s Head. Lasers Med. Sci. 2021, 36, 803–810. [Google Scholar] [CrossRef] [PubMed]
  26. Liu, X.; Wu, Y. Monte-Carlo Optical Model Coupled with Inverse Adding-Doubling for Building Integrated Photovoltaic Smart Window Design and Characterisation. Sol. Energy Mater. Sol. Cells 2021, 223, 110972. [Google Scholar] [CrossRef]
  27. Vincely, V.D.; Vishwanath, K. Accuracy of Retrieving Optical Properties from Liquid Tissue Phantoms Using a Single Integrating Sphere. Appl. Opt. 2022, 61, 375–385. [Google Scholar] [CrossRef] [PubMed]
  28. Friebel, M.; Helfmann, J.; Netz, U.J.; Meinke, M.C. Influence of Oxygen Saturation on the Optical Scattering Properties of Human Red Blood Cells in the Spectral Range 250 to 2000 Nm. J. Biomed. Opt. 2009, 14, 034001. [Google Scholar] [CrossRef] [PubMed]
  29. Bergmann, F.; Foschum, F.; Zuber, R.; Kienle, A. Precise Determination of the Optical Properties of Turbid Media Using an Optimized Integrating Sphere and Advanced Monte Carlo Simulations. Part 2: Experiments. Appl. Opt. 2020, 59, 3216–3226. [Google Scholar] [CrossRef]
  30. Foschum, F.; Bergmann, F.; Kienle, A. Precise Determination of the Optical Properties of Turbid Media Using an Optimized Integrating Sphere and Advanced Monte Carlo Simulations. Part 1: Theory. Appl. Opt. 2020, 59, 3203–3215. [Google Scholar] [CrossRef]
  31. Salomatina, E.V.; Jiang, B.; Novak, J.; Yaroslavsky, A.N. Optical Properties of Normal and Cancerous Human Skin in the Visible and Near-Infrared Spectral Range. J. Biomed. Opt. 2006, 11, 064026. [Google Scholar] [CrossRef] [PubMed]
  32. Simpson, C.R.; Kohl, M.; Essenpreis, M.; Cope, M. Near-Infrared Optical Properties Ofex Vivohuman Skin and Subcutaneous Tissues Measured Using the Monte Carlo Inversion Technique. Phys. Med. Biol. 1998, 43, 2465–2478. [Google Scholar] [CrossRef]
  33. Nishimura, T.; Takai, Y.; Shimojo, Y.; Hazama, H.; Awazu, K. Determination of Optical Properties in Double Integrating Sphere Measurement by Artificial Neural Network Based Method. Opt. Rev. 2021, 28, 42–47. [Google Scholar] [CrossRef]
  34. Smith, J.H.C.; Shibata, K.; Hart, R.W. A Spectrophotometer Accessory for Measuring Absorption Spectra of Light-Scattering Samples: Spectra of Dark-Grown Albino Leaves and of Adsorbed Chlorophylls. Arch. Biochem. Biophys. 1957, 72, 457–464. [Google Scholar] [CrossRef] [PubMed]
  35. Shibata, K.; Benson, A.A.; Calvin, M. The Absorption Spectra of Suspensions of Living Micro-Organisms. Biochim. Biophys. Acta 1954, 15, 461–470. [Google Scholar] [CrossRef] [PubMed]
  36. Hervey, J.R.D.; Bombelli, P.; Lea-Smith, D.J.; Hulme, A.K.; Hulme, N.R.; Rullay, A.K.; Keighley, R.; Howe, C.J. A Dual Compartment Cuvette System for Correcting Scattering in Whole-Cell Absorbance Spectroscopy of Photosynthetic Microorganisms. Photosynth. Res. 2022, 151, 61–69. [Google Scholar] [CrossRef]
  37. Koman, V.B.; Santschi, C.; Martin, O.J.F. Multiscattering-Enhanced Absorption Spectroscopy. Anal. Chem. 2015, 87, 1536–1543. [Google Scholar] [CrossRef]
  38. Oh, J.; Lee, K.; Park, Y. Enhancing Sensitivity in Absorption Spectroscopy Using a Scattering Cavity. Sci. Rep. 2021, 11, 14916. [Google Scholar] [CrossRef]
  39. Leulescu, M.; Rotaru, A.; Pălărie, I.; Moanţă, A.; Cioateră, N.; Popescu, M.; Morîntale, E.; Bubulică, M.V.; Florian, G.; Hărăbor, A.; et al. Tartrazine: Physical, Thermal and Biophysical Properties of the Most Widely Employed Synthetic Yellow Food-Colouring Azo Dye. J. Therm. Anal. Calorim. 2018, 134, 209–231. [Google Scholar] [CrossRef]
  40. Rovina, K.; Siddiquee, S.; Shaarani, S.M. A Review of Extraction and Analytical Methods for the Determination of Tartrazine (E 102) in Foodstuffs. Crit. Rev. Anal. Chem. 2017, 47, 309–324. [Google Scholar] [CrossRef]
  41. Avazpour, M.; Shiri, S.; Delpisheh, A.; Abbasi, A. mohamad Simultaneous Determination of Brilliant Blue FCF and Carmoisine in Food Samples by Aqueous Two-Phase System and Spectrophometric Detection. J. Basic Res. Med. Sci. 2014, 1, 56–65. [Google Scholar]
  42. Chebotarev, A.N.; Bevziuk, K.V.; Snigur, D.V.; Bazel, Y.R. The Brilliant Blue FCF Ion-Molecular Forms in Solutions According to the Spectrophotometry Data. Russ. J. Phys. Chem. A 2017, 91, 1907–1912. [Google Scholar] [CrossRef]
  43. Bhat, V.T.; James, N.R.; Jayakrishnan, A. A Photochemical Method for Immobilization of Azidated Dextran onto Aminated Poly(Ethylene Terephthalate) Surfaces. Polym. Int. 2008, 57, 124–132. [Google Scholar] [CrossRef]
  44. Welch, A.J.; Gemert, M.J.C. Optical-Thermal Response of Laser-Irradiated Tissue; Plenum Press: New York, NY, USA, 1995. [Google Scholar]
  45. Mie Scattering. Available online: https://omlc.org/software/mie/ (accessed on 16 April 2023).
  46. Gienger, J.; Bär, M.; Neukammer, J. Extinction Spectra of Suspensions of Microspheres: Determination of the Spectral Refractive Index and Particle Size Distribution with Nanometer Accuracy. Appl. Opt. 2018, 57, 344–355. [Google Scholar] [CrossRef] [PubMed]
  47. Mishchenko, M.I.; Yang, P. Far-Field Lorenz–Mie Scattering in an Absorbing Host Medium: Theoretical Formalism and FORTRAN Program. J. Quant. Spectrosc. Radiat. Transf. 2018, 205, 241–252. [Google Scholar] [CrossRef]
  48. Yurkin, M.A.; Moskalensky, A.E. Open-Source Implementation of the Discrete-Dipole Approximation for a Scatterer in an Absorbing Host Medium. J. Phys. Conf. Ser. 2021, 2015, 012167. [Google Scholar] [CrossRef]
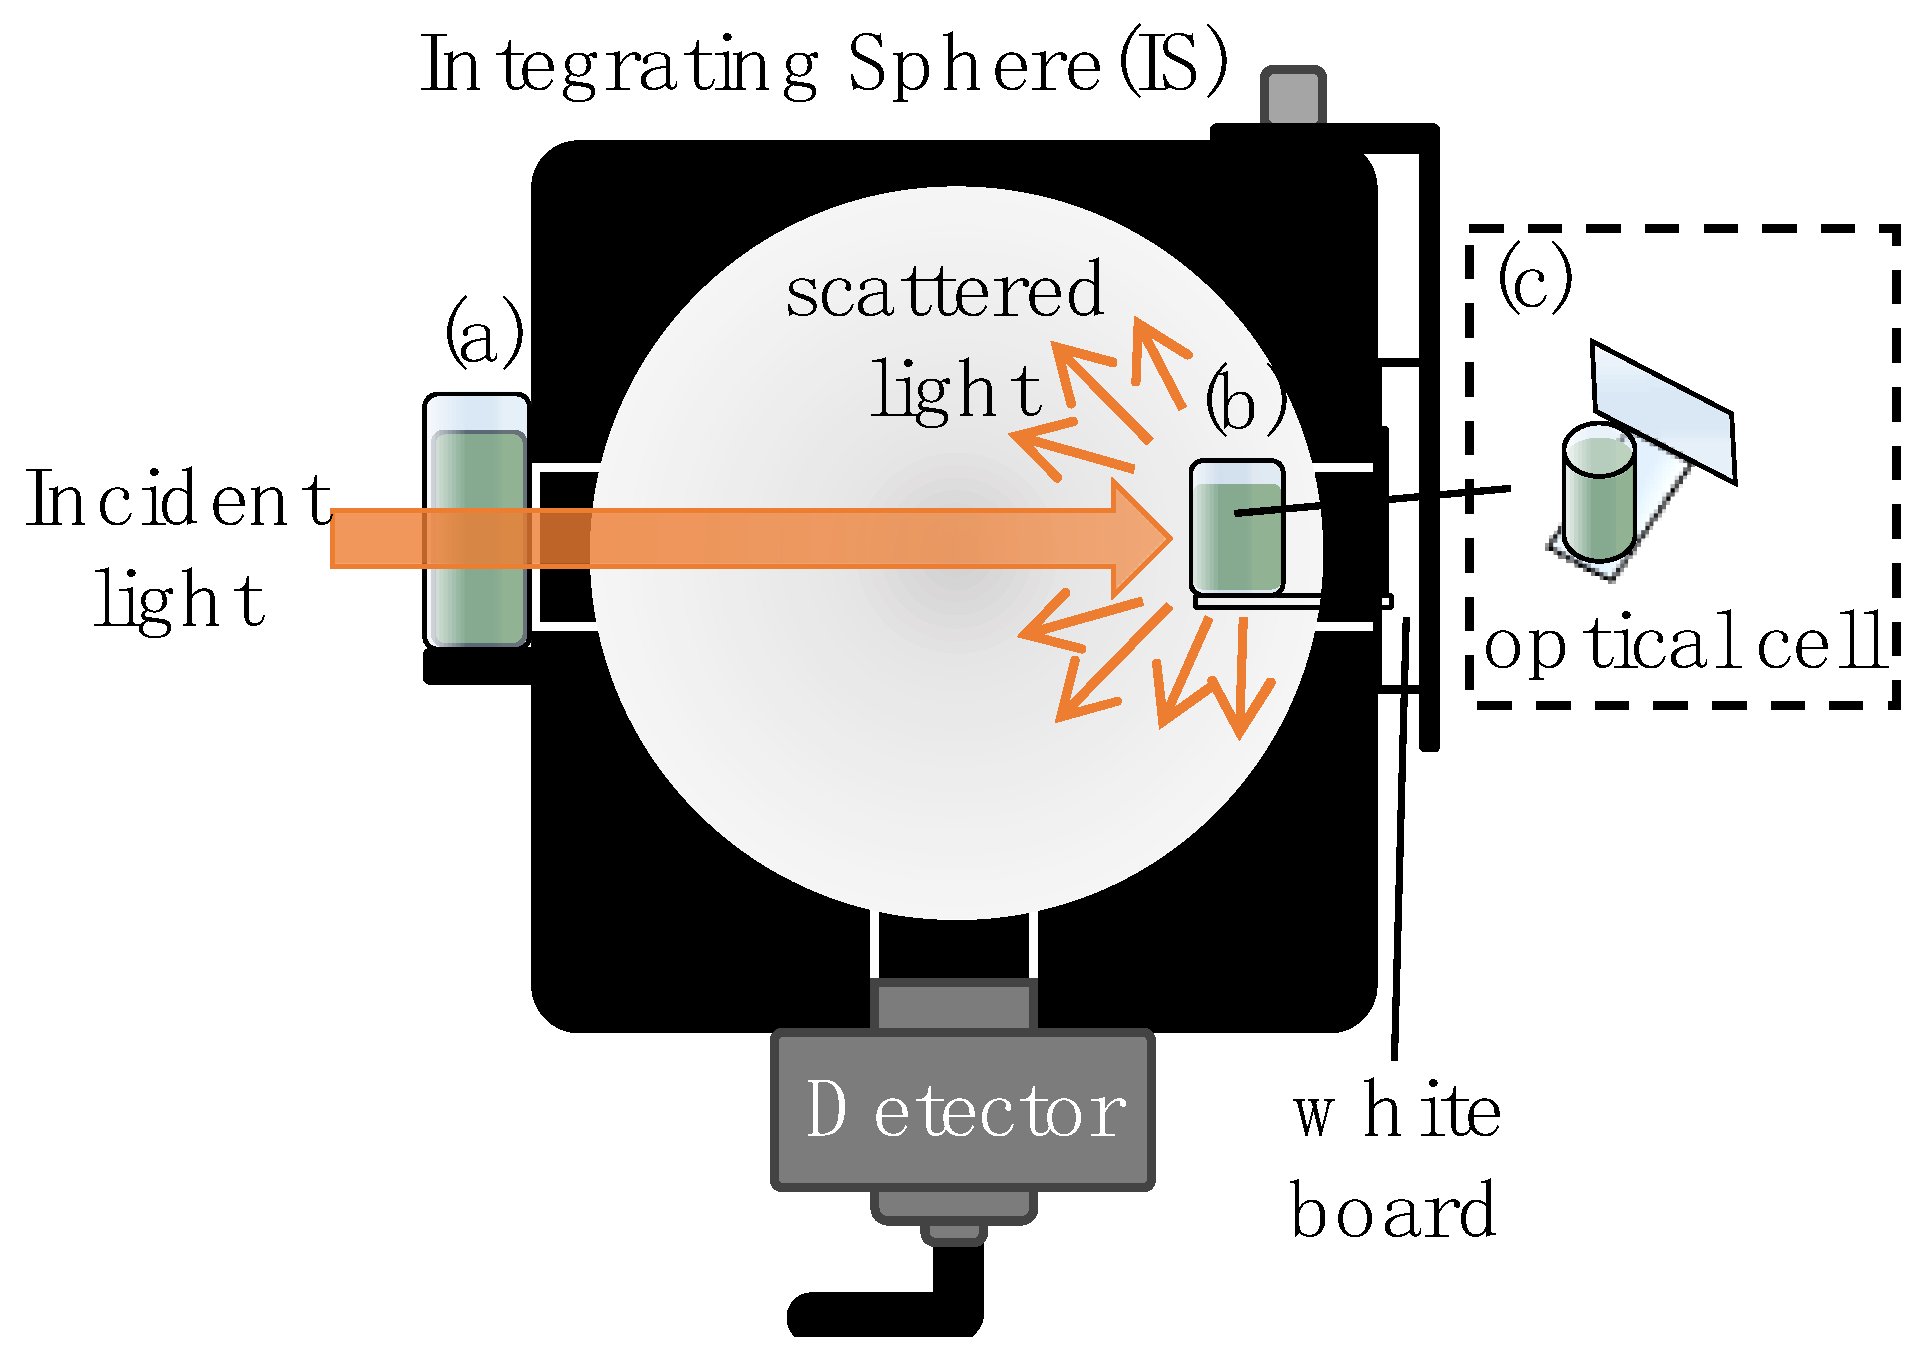
Figure 1. Setup for absorption measurements. (a) A conventional setup using an integrating sphere (IS) for transmission measurements. The absorption spectra, µa(λ), of the dye solutions were measured using this setup. (b) A setup where the sample is embedded within the IS. The integrating sphere collects light scattered at all angles from the embedded sample, enabling absorption measurements that account for scattering. The absorption measurements of the scatterer-added samples were conducted in this configuration (b), where the sample was placed in a custom cylindrical cell and inserted into the IS through a window designed for diffuse reflection measurements. The window was then sealed with a white board made of the same material as the IS’s inner wall to ensure complete light collection. (c) A custom cylindrical optical cell designed for placement inside the IS.
Photonics 11 00556 g001
Figure 2. The relation between A and µa at λ = 420 nm derived from MC for various µa. Blue circles show the results obtained from MC, and the solid red line shows the fitting of these results to Equation (1).
Photonics 11 00556 g002
Figure 3. (a) The absorbance spectra of dye solutions at various concentrations measured using the setup shown in Figure 1a. (b) The concentration dependence of A/d and µa ln(10) at 423 nm. Blue circles show the measured results, and the dashed line shows the linear approximation of these results. The true µa (orange triangles) was defined from the slope of this approximation line. (c) The absorption spectra of dye solutions derived from the linear approximation of absorbance and concentration. The inset graph in the lower-right corner shows an expanded view of the absorption spectrum between 550 and 700 nm.
Photonics 11 00556 g003
Figure 4. (a) The absorbance spectra of scatterer-added samples with various dye concentrations measured using the setup shown in Figure 1b. (b) The relation between absorbance and dye concentration at the high absorption peak (426 nm). (c) The relation between absorbance and dye concentration at the low absorption peak (630 nm). (d) The concentration dependence of the intensity ratio of the high absorption peak to the low absorption peak (blue circles) and the actual intensity ratio of 95, derived from Figure 3c (solid line).
Photonics 11 00556 g004
Figure 5. A comparison of the measured absorbance and actual µa peak shapes for scatterer-added dye samples at Cdye = 100. (a) The normalized spectra of absorbance and µa at the high absorption peak (426 nm). (b) The normalized spectra of absorbance and µa at the low absorption peak (630 nm).
Photonics 11 00556 g005
Figure 6. The shapes of the estimated absorption spectra for scatterer-added samples (Cdye = 100) derived from measured absorbance using Monte Carlo (MC) simulations. Panels (a,b) display the normalized high and low absorption peaks, respectively. Solid lines represent the true absorption spectra shapes [µa(true)], while circles depict the shapes estimated from MC [µa(MC)].
Photonics 11 00556 g006
Figure 7. A comparison of true absorption peak shapes [µa(true)] with those estimated [µa(MC)] from MC based on the measured absorbance spectra of scatterer-added dye samples at various Cdyes. Peaks have been normalized to set the maximum peak intensity to unity for clearer shape comparisons. Panels (a,c) show the normalized µa(λ) estimated by MC for each Cdye (circles) and the normalized true µa(λ) (red lines) at the high and low absorption peaks, respectively. Panels (b,d) present the mean estimated peak intensities (squares) along with their standard deviations (error bars) for each concentration, corresponding to the high and low peaks, as shown in (a,c).
Photonics 11 00556 g007
Figure 8. PL distributions estimated by MC for absorbance measurements at 426 nm (high absorption peak) in the setup of Figure 1b. The PL distributions are shown for dye solutions (Cdye = 20, 60, 100) with (a) scatterers added and (b) without scatterers, with distribution ratios in the range 0~20 mm at 1 mm intervals; the interval indicated by the light-green band is the interval including the diameter of the optical cell containing the sample.
Photonics 11 00556 g008aPhotonics 11 00556 g008b
Figure 9. PL distributions estimated by MC for absorbance measurements at 630 nm (low absorption peak) in the setup of Figure 1b. The PL distributions are shown for dye solutions (Cdye = 20, 60, 100) with (a) scatterers added and (b) without scatterers, with distribution ratios in the range 0~20 mm at 1 mm intervals; the interval indicated by the light-green band is the interval including the diameter of the optical cell containing the sample.
Photonics 11 00556 g009
Table 1. Input parameters for Monte Carlo simulations. MC simulations were conducted under a total of 4680 conditions, involving combinations of 130 values of µa and 36 values of λ. The simulations utilized three input parameters: µa, µs, and g, with µs and g being dependent on λ.
Input ParameterValues
µa [cm−1]Ranges from 0.0 to 0.09 in increments of 0.01
and from 0.1 to 12.0 in increments of 0.1
λ [nm]Ranges from 350 to 700 in increments of 10 and includes 426
µs [cm−1] and gCalculated for each λ based on Mie scattering theory
Disclaimer/Publisher’s Note: The statements, opinions and data contained in all publications are solely those of the individual author(s) and contributor(s) and not of MDPI and/or the editor(s). MDPI and/or the editor(s) disclaim responsibility for any injury to people or property resulting from any ideas, methods, instructions or products referred to in the content.