Abstract
Machine learning deals with creating algorithms capable of learning from the provided data. These systems have a wide range of applications and can also be a valuable tool for scientific research, which in recent years has been focused on finding new diagnostic techniques for particle accelerator beams. In this context, SPARC_LAB is a facility located at the Frascati National Laboratories of INFN, where the progress of beam diagnostics is one of the main developments of the entire project. With this in mind, we aim to present the design of two neural networks aimed at predicting the spot size of the electron beam of the plasma-based accelerator at SPARC_LAB, which powers an undulator for the generation of an X-ray free electron laser (XFEL). Data-driven algorithms use two different data preprocessing techniques, namely an autoencoder neural network and PCA. With both approaches, the predicted measurements can be obtained with an acceptable margin of error and most importantly without activating the accelerator, thus saving time, even compared to a simulator that can produce the same result but much more slowly. The goal is to lay the groundwork for creating a digital twin of linac and conducting virtualized diagnostics using an innovative approach.
1. Introduction
The activity of the SPARC_LAB facility [1], located in the Frascati National Laboratories of INFN, is strategically oriented to explore the feasibility of an high-brightness photoinjector to conduct FEL experiments [2] and to realize plasma-based acceleration experiments with the aim of providing an accelerating field of several GV/m while maintaining the overall accelerated electron beam quality in terms of energy spread and emittance. Additionally, a fundamental developments of the entire project is the implementation of dedicated diagnostic systems to characterize the beam dynamics. However, the diagnostic measures are often destructive, and they interrupt machine operations. In this context, we inclined to find a diagnostic technique that allows predicting the quality of the electron beam without activating the entire system, which is already in the first meter of the SPARC linac accelerator. In this regard, the project we intend to describe introduces two neural networks that implement two different data preprocessing techniques: the autoencoder neural network and Principal Component Analysis (PCA). Both algorithms aim to predict the transverse beam spot at the first diagnostic station at 1.1017 m from an RF gun. The proposed algorithms demonstrate their efficacy to obtain predictions within a reasonable error range and with a much faster pace compared to a simulator. This will enable the creation of a digital model of the accelerator and perform virtualized diagnostics also in view of the EuAPS@SPARC_LAB project, which involves the realization of a structure for the use of laser-driven betatron X-ray beams [3].
2. Photoinjector and Diagnostic Measurements @SPARC_LAB
The SPARC_LAB facility, acronym for the Sources for Plasma Accelerators and Radiation Compton with Laser And Beam, is a multidisciplinary laboratory with unique characteristics on the global scene located at Frascati National Laboratories of INFN. The research activity involves experimenting with new particle acceleration techniques such as electron plasma acceleration [4] to develop Free Electron Laser generation or THz radiation [5] to study innovative diagnostic techniques aiming to characterize the electron beam. All activities are aimed at studying the physics and applications of high brightness photoinjectors to make future accelerators more compact and promote technological development. To understand the research work analyzed in this article, we are exclusively interested in the detailed description of photoinjector and the diagnostic system present in the first 1.1017 m of the SPARC_LAB accelerator.
The SPARC high brightness photoinjector consists of a copper photocathode. The photocathode is illuminated by ultrashort pulses of a high-power UV laser (266 nm) with compressed energy of about 50 mJ and emits electrons via the photoelectric effect. The particles are immediately accelerated by a 1.6-cell RF gun operating in the S-band (2.856 GHz). After the RF gun, a solenoid with four coils, approximately 20 cm in length, is necessary to focus the electrons to oppose the space charge forces present in the non-completely relativistic beam. This element is crucial for minimizing emittance and achieving a high brightness electron beam. Additionally, a dipole for trajectory correction is present on the beamline. After the solenoid and dipole, specifically at 1.1017 m from the cathode, the first diagnostic station is present to monitor the characteristics of the beam produced in terms of spot size, energy and transverse emittance. Once generated and focused, the electrons are injected into three high gradient RF accelerating sections (22 MV/m), two 3 m long traveling wave S-bands and a 1.4 m C-band that acts as an energy booster, reaching energies of approximately 180 MeV. The beam line continues with experimental lines including FEL and THz generation. The layout of the entire linac, principally focused on the first meter, is depicted in Figure 1.
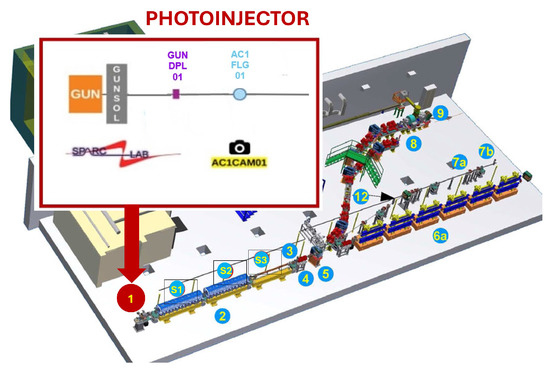
Figure 1.
Schematic layout of SPARC linear accelerator principally focused on first meter. In detail, the structure of SPARC’s first meter (1) is shown up to 1.1017 m from the RF gun. There are the solenoid and dipole elements (GUNSOL, GUNDPL01) and the diagnostic system (the scintillating screen or flag AC1FLG01 and the scientific camera AC1CAM01).
3. Neural Networks
The machine learning applications are increasingly widespread throughout accelerator physics. An innovative approach is to perform virtualized diagnostics using pre-trained machine learning algorithms. These tools do not use physics to produce results, but they predict data more or less near to ground truth, so predictions are more or less accurate, depending on the type of neural network used, the training procedure followed and the training dataset quality provided [6]. The neural network can learn from raw or preprocessed data. In our project, two data preprocessing techniques are analyzed called PCA (Principal Component Analysis) [7] and autoencoder neural network [8]. Once the training dataset was built using the compressed data, two neural networks were designed to predict the electron beam spot size on the first measurement station of SPARC starting on six machine parameters listed in Table 1.

Table 1.
The 6 machine parameters and value range used to train the neural networks.
In this regard, recovering many real measures on SPARC in a very short time and during a continuous evolution period of the machine was very difficult. Therefore, in our specific case, the training dataset was built using ASTRA simulations. ASTRA is one of the most well-known photoinjector simulators [9]. To produce simulations consistent with the reality, the simulator was alignmed with SPARC. The benchmark was performed on the emittance measurement, and the result is shown in Figure 2.
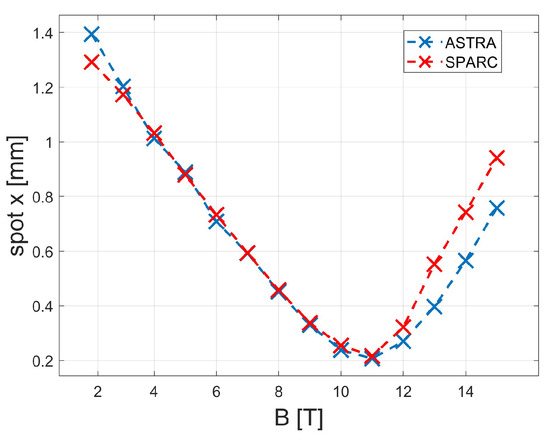
Figure 2.
Emittance measurements using ASTRA and SPARC first measure station. The current scan was performed in the range 110–123 A. The measurements converge except for the divergence beyond the minimun beam waist, which was most likely due to machine misalignments.
The trends converge except for a divergence beyond the waist, which was most likely due to machine misalignments. Using these measures, it was also possible to define a conversion factor from current to field solenoid:
Byperforming the energy measurements in the same way, the conversion factor from the current to the dipole field was also possible to evaluate:
Once the simulator was aligned with the accelerator, approximately 10,000 simulations were performed to randomly combine the six machine parameters. One simulation tracks 10,000 electrons and measures the particles’ position on x and y on the first measure station of SPARC. The simulations produced were split, using 5000 for the training set and 5000 for the testing set. To speed up the process, the procedure was performed through an automation script implemented in Python and executed in parallel on the Singularity server [10]. The cluster comprises 96 CPUs and 314 GB of RAM. The scale factor from single core to cluster reduced the execution time for one simulation from 2 min to 2 s.
3.1. Preprocessing
The 10,000 simulations produced with ASTRA were preprocessed using two techniques: Principal Component Analysis (PCA) and the autoencoder algorithm. The autoencoder neural network is a data preprocessing algorithm where compression and decompression functions are implemented using neural network layers. The training dataset is composed by the same input and output examples. The network learns to encode and decode the ASTRA simulations in the best possible way. The autoencoder is closely dependent on the hyperparameter values chosen during construction, especially from the encoding size. The latter represents the number of characteristic samples necessary to perform good decoding as well as the number of neurons in the last encoding layer. The encoding dimension used was fixed to 350 by evaluating the network performance in terms of loss. A simulation was compressed by eliminating approximately 98.25% of the redundant information. The autoencoder has three layers, and the principal hyperparameters values are reported in Table 2. The input and output layers have 20,000 neurons: one for each position of 10,000 tracking particles from ASTRA on x and y. The intermediate layer (encoding layer) has a number of neurons equal to chosen encoding dimension. The training procedure is performed using the Singularity server. The loss trend versus epochs number is shown in Figure 3.

Table 2.
Hyperparameters chosen for the autoencoder neural network. The choice was made after a careful analysis of the training procedure in terms of loss.
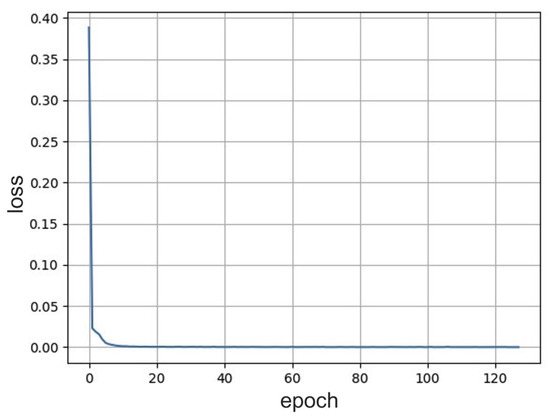
Figure 3.
Trend of the loss function of the autoencoder network as a function of epochs. The loss asymptotically decreases while increasing the number of epochs, and the minimum value is close to 0 on the order of .
The loss asymptotically decreases while increasing the number of epochs, and the minimum value is close to 0 on the order of .
The PCA technique is a method used to reduce the dimensionality of a large dataset by employing appropriate linear combinations and transforming a large set of variables into a smaller one that still contains most of the salient information. The principal components represent geometrically the directions in which there is maximum variance, maximum data dispersion, or maximum information. In our case, the number of components used (the percentage of usable information) was fixed to 50 according to the trend shown in Figure 4.
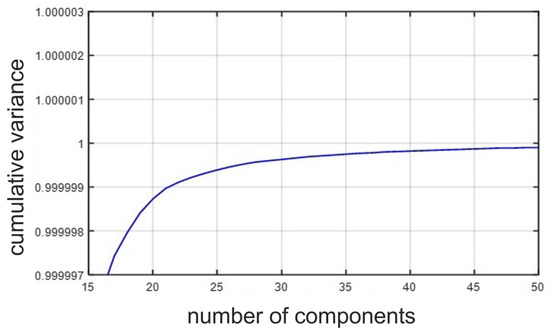
Figure 4.
Variation of the cumulative variance as a function of the number of principal components in PCA. The optimal number of principal components was fixed to 50.
3.2. Prediction Neural Networks
At this point, we proceeded to a neural networks project and train aimed at predicting the ASTRA simulations preprocessed with different data preprocessing techniques starting on six machine parameters. The ASTRA simulations represent the ground truth for the algorithms. As previously mentioned, a simulation represents the electron beam spot on the first SPARC measure station.The implementation and development of the networks were carried out using the Python programming language version 3.7. In addition to the standard libraries already present in Python, the following packages were used:
- Scikit-learn, for data standardization, PCA, autoencoder and for the metrics used to evaluate the performance of neural networks;
- Keras, to define the sequential models of the networks, layers and optimizers;
- Matplotlib, to create plots and customize their layout.
According to training procedures, the fixed network parameters are shown in Table 3.

Table 3.
Hyperparameters chosen for the PCA and autoencoder neural networks. The choice was made after a careful analysis of training procedures in terms of loss.
The number of neurons in the output layer of the prediction neural network trained with autoencoder preprocessed data was set to 350, according to the encoding size. The number of neurons in the output layer of the prediction neural network trained with PCA preprocessed data was set to 50, according to the number of principal components. The number of intermediate layers in the prediction neural network trained with autoencoder preprocessed data was fixed to three, and the other one was fixed to one. The neurons number input layer of both predition neural networks was fixed to six, according to number of machine parameters. The loss function trends during training procedures using the Sigularity server computational tool are shown in Figure 5 and Figure 6. The loss functions asymptotically decrease while increasing the number of epochs, and the minimum value is close to 0 on the order of for both networks.
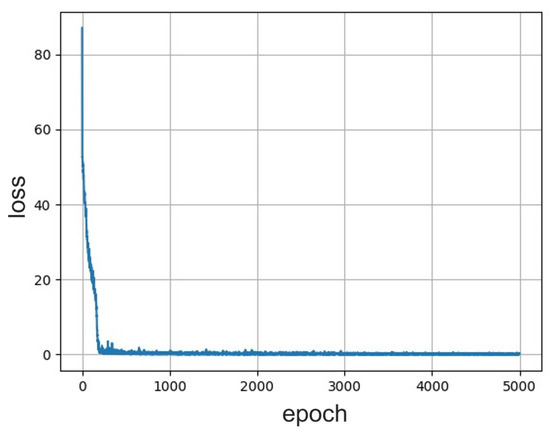
Figure 5.
Trend of the loss function of the predition neural network trained with autoencoder preprocessed simulations as a function of epochs. The loss asymptotically decreases while increasing the number of epochs and the minimum value is closed to 0 on the order of .
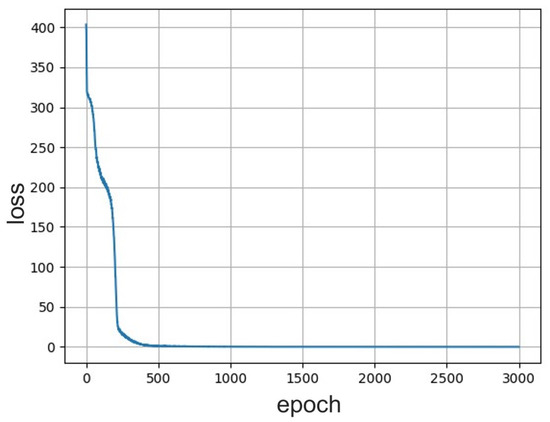
Figure 6.
Trend of the loss function of the predition neural network trained with PCA preprocessed simulations as a function of epochs. The loss asymptotically decreases while increasing the number of epochs, and the minimum value is close to 0 on the order of .
4. Results
In conclusion, the beam spots (histograms) predicted from neural networks are decompressed and compared with ASTRA simulations. In particular, the autoencoder decoding layer was called to perform the decoding of prediction from theneural network trained with autoencoder preprocessed simulations. Instead, the PCA compression process is natively reversed. The results shown in Figure 7 are related to the testing procedure and data used from the testing dataset.
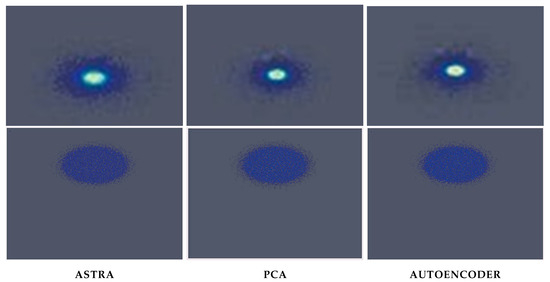
Figure 7.
Comparison of two different beam histogram generated with ASTRA simulator (first column) and predicted with the neural network trained on data encoded by the PCA (middle column) and by autoencoder (last column).
The comparison between prediction and simulation was performed using spot 2D images (electron beam histograms) after we converted them to the SPARC camera frame, with 659 × 495 resolution, considering a conversion factor of 0.014380 mm/pixel.
The neural networks on the Singularity server take 0.5 ms to obtain single prediction; however, ASTRA takes 100 s, so algorithms are approximately 200,000 times faster than the simulator.
To evaluate the predicted histograms on the training dataset, the centroids and variances on x and y were calculated. The metric used to perform the comparison with the ASTRA simulations was the Mean Absolute Error (MAE), reported in Equation (3), to not forget the distance-pixel information.
The differences between predictions and ASTRA simulations in terms of MAE for both neural networks are shown in Figure 8 and Figure 9. These trends were also used to estimate the optimal training dataset cardinality fixed to 5000 with a small number of data points.
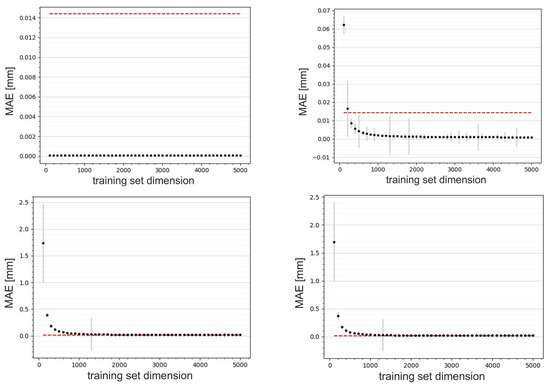
Figure 8.
Graph of the loss in terms on MAE during training in relation to the predictions of the x centroid (top left) and y centroid (bottom left) and the x spot size (top right) and y spot size (bottom right) provided by the neural network trained on the simulations encoded by the autoencoder. The red line represents the resolution of the AC1CAM. The best network performance was obtained using 5000 training data.
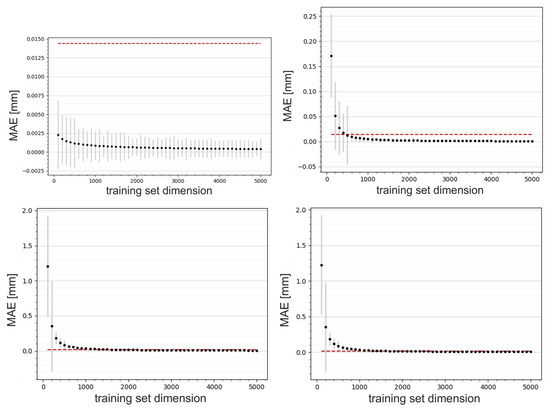
Figure 9.
Graph of the loss in terms of MAE during training in relation to the predictions of the x centroid (top left) and y centroid (bottom left) and the x spot size (top right) and y spot size (bottom right) provided by the neural network trained on the simulations encoded by the PCA. The red line represents the resolution of the AC1CAM. The best network performance was obtained using 5000 training data.
To test the neural network performances on the testing dataset, emittance and energy measurements on the predicted beam spot (histrogram) were measured [11,12]. The solenoid field and dipole current ranges to perform both scans are shown in Table 4. The other parameters were fixed out of the training parameters’ ranges.

Table 4.
Table of parameters to perform emittance and energy measurements on ASTRA and neural networks.
For the emittance measurements, the x spots measured from predicted histrograms on both neural networks were compared with the value obtained from ASTRA simulation. The result is visible in Figure 10.
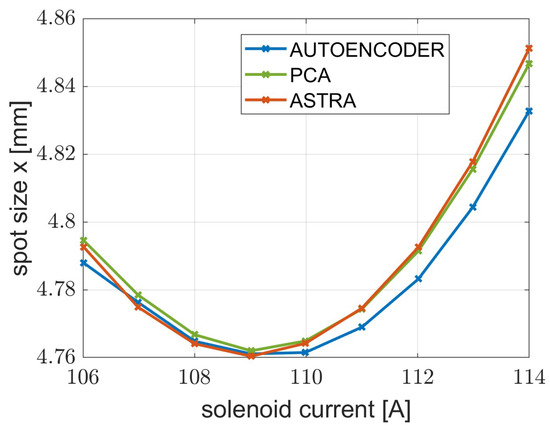
Figure 10.
Emittance measurement using solenoid scan performed on ASTRA and using both neural networks.
The trends fit well near the minimum beam waist (109 A), which is a point of interest in the optimal working point research. Furthermore, the differences between the predicted and simulated measures is on the order of mm, which is a value below the resolution of the SPARC camera (14 μm) and therefore not perceptible. For the energy measurements, the centroids y measured from the predicted histrograms on both neural networks were compared with the value obtained from ASTRA simulation. The result is visible in Figure 11.
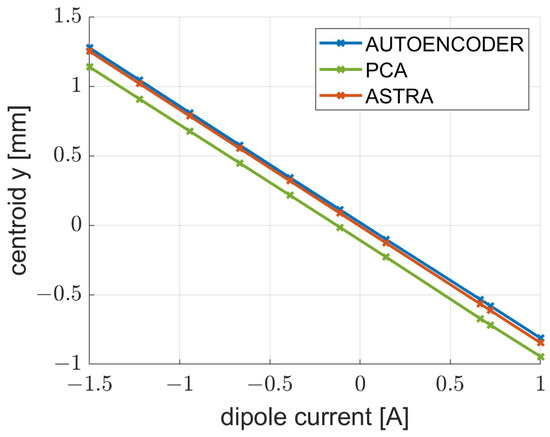
Figure 11.
Energy measurement performed on ASTRA and using both neural networks.
The line slopes are −0.8319 for the red line, −0.8319 for the green line and −0.8367 for the blue line.
5. Conclusions
The aim of this research work was to design two neural networks with two different approches to data preprocessing: the autoencoder network and PCA. The goal of both networks was predicting, starting from six machine parameters, the spot size of the electron beam at the first SPARC measure station located at the Frascati National Laboratories of INFN. Both networks were trained using preprocessed ASTRA simulations, in particular transverse beam histograms. During the test phase, the spot in terms of variances and centroids, the emittance and energy were compared with the data obtained from simulations. The results highlighted that the algorithms require a reasonable number of simulations to train (5000). This quantity could be reproduced directly on the accelerator in few months to train the networks on real data, creating a digital twin of SPARC. The differences between predictions and simulations are imperceptible as compared to SPARC camera resolution. The networks also turned out 200,000 times faster that a simulator. However, PCA, being a linear technique for dimensionality reduction, is unable to capture complex nonlinear relationships in the output data. In fact, in the energy measure, the line deviates from the other ones. This aspect makes the potential of the neural network that used the autoencoder technique evident.
Author Contributions
Conceptualization, S.P.; methodology, G.L.; software, G.L. and B.S.; validation, G.L. and B.S.; formal analysis, G.L.; investigation, G.L.; resources, G.L., B.S. and G.J.S.; data curation, G.L. and B.S.; writing—original draft preparation, G.L.; writing—review and editing, B.S. and S.P.; visualization, G.L.; supervision, E.C., A.M., V.M. and S.P.; project administration, S.P.; All authors have read and agreed to the published version of the manuscript.
Funding
This research received no external funding.
Institutional Review Board Statement
Not applicable.
Informed Consent Statement
Not applicable.
Data Availability Statement
Data is contained within the article.
Conflicts of Interest
The authors declare no conflict of interest.
References
- Ferrario, M.; Alesini, D.; Anania, M.P.; Bacci, A.; Bellaveglia, M.; Bogdanov, O.; Boni, R.; Castellano, M.; Chiadroni, E.; Cianchi, A.; et al. SPARC_LAB present and future. Nucl. Instrum. Methods Phys. Res. B 2013, 309, 183–188. [Google Scholar] [CrossRef]
- Quattromini, M.; Artioli, M.; Di Palma, E.; Petralia, A.; Giannessi, L. Focusing properties of linear undulators. Phys. Rev. Accel. Beams 2012, 15, 080704. [Google Scholar] [CrossRef]
- Ferrario, M.; Assmann, R.W.; Avaldi, L.; Bolognesi, P.; Catalano, R.; Cianchi, A.; Cirrone, P.; Falone, A.; Ferro, T.; Gizzi, L.; et al. EuPRAXIA Advanced Photon Sources PNRR_EuAPS Project. Available online: https://www.lnf.infn.it/sis/preprint/getfilepdf.php?filename=INFN-23-12-LNF.pdf (accessed on 12 March 2024).
- Chiadroni, E.; Biagioni, A.; Alesini, D.; Anania, M.P.; Bellaveglia, M.; BIsesto, F.; Brentegani, E.; Cardelli, F.; Cianchi, A.; Costa, G.; et al. Status of Plasma-Based Experiments at the SPARC_LAB Test Facility. In Proceedings of the IPAC2018—9th International Particle Accelerator Conference, Vancouver, BC, Canada, 29 April–4 May 2018. [Google Scholar] [CrossRef]
- Chiadroni, E.; Bacci, A.; Bellaveglia, M.; Boscolo, M.; Castellano, M.; Cultrera, L.; Di Pirro, G.; Ferrario, M.; Ficcadenti, L.; Filippetto, D.; et al. The SPARC linear accelerator based terahertz source. Appl. Phys. Lett. 2013, 102, 094101. [Google Scholar] [CrossRef]
- Theodoridis, S. Machine Learning: A Bayesian and Optimization Perspective; Academic Press, Inc.: Orlando, FL, USA, 2020. [Google Scholar]
- Bro, R.; Smilde, A.K. Principal component analysis. Anal. Methods 2014, 6, 2812–2831. [Google Scholar] [CrossRef]
- Chollet, F. Building Autoencoders in Keras. Available online: https://blog.keras.io/building-autoencoders-in-keras.html (accessed on 21 March 2024).
- Floettmann, K. ASTRA, A Space Charge Tracking Algorithm. Available online: https://www.desy.de/~mpyflo/Astra_manual/Astra-Manual_V3.2.pdf (accessed on 21 March 2024).
- Singularity Project. Available online: https://w3.lnf.infn.it/laboratori/singularity/ (accessed on 7 May 2024).
- Scifo, J.; Alesini, D.; Anania, M.P.; Bellaveglia, M.; Bellucci, S.; Biagioni, A.; Bisesto, F.; Cardelli, F.; Chiadroni, E.; Cianchi, A.; et al. Nano-machining, surface analysis and emittance measurements of a copper photocathode at SPARC_LAB. Nucl. Instrum. Methods Phys. Res. A 2018, 909, 233–238. [Google Scholar] [CrossRef]
- Graves, W.S.; DiMauro, L.F.; Heese, R.; Johnson, E.D.; Rose, J.; Rudati, J.; Shaftan, T.; Sheehy, B.; Yu, L.-H.; Dowell, D. DUVFEL Photoinjector Dynamics: Measurement and Simulation. In Proceedings of the PAC2001–2001 Particle Accelerator Conference, Chicago, IL, USA, 18–22 June 2001. [Google Scholar] [CrossRef]
Disclaimer/Publisher’s Note: The statements, opinions and data contained in all publications are solely those of the individual author(s) and contributor(s) and not of MDPI and/or the editor(s). MDPI and/or the editor(s) disclaim responsibility for any injury to people or property resulting from any ideas, methods, instructions or products referred to in the content. |
© 2024 by the authors. Licensee MDPI, Basel, Switzerland. This article is an open access article distributed under the terms and conditions of the Creative Commons Attribution (CC BY) license (https://creativecommons.org/licenses/by/4.0/).