Communication

Study on the Robustness of an Atmospheric Scattering Model under Single Transmittance

1
Research Center of Space Optical Engineering, Harbin Institute of Technology, Harbin 150001, China
2
NORINCO Group, Aviation Ammunition Institute, Harbin 150036, China
3
Key Laboratory of Science and Technology on Space Optoelectronic Precision Measurement, Institute of Optics and Electronics, Chinese Academy of Sciences, Chengdu 610042, China
*
Author to whom correspondence should be addressed.
Photonics 2024, 11(6), 515; https://doi.org/10.3390/photonics11060515
Submission received: 17 March 2024 / Revised: 26 April 2024 / Accepted: 21 May 2024 / Published: 28 May 2024

Abstract

:
When light propagates in a scattering medium such as haze, it is partially scattered and absorbed, resulting in a decrease in the intensity of the light emitted by the imaging target and an increase in the intensity of the scattered light. This phenomenon leads to a significant reduction in the quality of images taken in hazy environments. To describe the physical process of image degradation in haze, the atmospheric scattering model is proposed. However, the accuracy of the model applied to the usual fog image restoration is affected by many factors. In general, fog images, atmospheric light, and haze transmittances vary spatially, which makes it difficult to calculate the influence of the accuracy of parameters in the model on the recovery accuracy. In this paper, the atmospheric scattering model was applied to the restoration of hazed images with a single transmittance. We acquired hazed images with a single transmittance from 0.05 to 1 using indoor experiments. The dehazing stability of the atmospheric scattering model was investigated by adjusting the atmospheric light and transmittance parameters. For each transmittance, the relative recovery accuracy of atmospheric light and transmittance were calculated when they deviated from the optimal value of 0.1, respectively. The maximum parameter estimation deviations allowed us to obtain the best recovery accuracies of 90%, 80%, and 70%.

1. Introduction

In haze weather, there are a large number of small scattering media such as liquid droplets and solid particles in the air. The scattering and absorption of light by these scattering media is the main factor that affects imaging quality in fog. Scattering and absorption together reduce the contrast, color distortion, and signal-to-noise ratio of the image [1,2,3]. To improve the imaging quality in harsh environments, a series of imaging methods are applied in this field. At present, the most effective methods of imaging in haze are mainly divided into the following two categories.
The first category uses hardware devices to distinguish between target light and scattered light. The range gating method uses the distance of the laser radar device to detect the target and then calculates the time of the target light to reach the detection device according to the distance from the target to the detector. A time-gated device selects photons at a specific distance or at a specific transmission time to reduce the chance of scattered light entering the detector. This method can greatly reduce the backscattered light during active illumination detection, so it is often used for fog and underwater detection and imaging. However, when there is no active light to illuminate the target, the target light and scattered light enter the detector at any time. In this case, the method is difficult to distinguish between the target light and the scattered light.
The polarization detection method distinguishes the target light from the scattered light by the difference in polarization characteristics [4,5,6,7,8,9,10,11]. During imaging, polarization detection equipment is used to obtain results in multiple polarization states. The atmospheric light component and transmittance of haze are estimated by calculating the polarization degree and polarization angle of each pixel [10]. However, the method utilizes polarization detection equipment, but at the same time also works within the framework of atmospheric scattering models. Therefore, the image restoration accuracy of this method depends not only on the detection accuracy of polarization detection equipment such as extinction ratio but also on the accuracy of the image dehazing model [11].
The second category is the image dehazing method based on the physical model. At present, most of these methods are based on the atmospheric scattering model and image degradation model for dehazing. Since these methods can only calculate the results of haze removal with one image, there is almost no requirement for imaging equipment, so they are more widely used. In the image degradation model, haze is treated as an optical system with a specific point spread function and noise. When the target light passes through the haze, it is convolved with the point spread function of the system and affected by additive noise to get the degraded image. By establishing the mathematical model of point spread function and noise of haze, using deconvolution or the Wiener filter, the model can realize fog image restoration.
The atmospheric scattering model is the basis of most current image dehazing methods. The model divides the haze image into two parts: target light and atmospheric light. Due to the presence of haze, the target light is attenuated while the atmospheric light increases. The transmittance of haze and the component of atmospheric light in the image are estimated by using prior laws, mathematical models, or polarization detection equipment. By removing the atmospheric light and restoring the contrast of the target light according to the transmittance, the model can achieve better image fog removal. At present, the most effective dehazing methods, such as the dark channel prior method [12], color attenuation prior method [13], polarization dehazing method, and their improved versions are based on this model. However, methods based on this model often have the problem that they cannot be accurately restored. The reason why these methods are not accurate in dehazing is usually inaccurate parameter estimation [14,15,16,17].
Normally, the targets in hazed images of the scene are very complicated. To explore the stability of the atmospheric scattering model, this paper focuses on the quantitative effects of atmospheric light and transmittance estimation accuracy on image restoration accuracy under a single transmittance. The motivation and significance of the research are described below.
  • In a haze image, it is always possible to find a sufficiently small region in which the transmittance of the haze can be regarded as a constant. That is, any haze image can be equivalent to a combination of multiple single transmittance images. Therefore, it is of great significance to study the image dehazing model under a single transmittance to improve the dehazing model for any hazy image.
  • In the usual haze image, the distance between each target and the detector is inconsistent, resulting in the transmittance of atmospheric light and haze changing with the spatial position. In this case, the error of parameter estimation at any position in the image will cause the recovery accuracy to decrease. Therefore, it is difficult to quantitatively evaluate the influence of parameter estimation bias on image restoration accuracy by using this kind of image dehazing. When a fog image with a single transmittance is used to analyze the dehazing model, the parameters in the model no longer change with space. It is helpful to quantitatively analyze the influence of atmospheric light parameters and transmittance parameters on recovery accuracy.
Therefore, we carried out a stability study on the dehazing effect of the atmospheric scattering model under a single transmittance. The specific research contents and innovations are as follows.
  • Multiple target images in a haze environment with single transmittance (transmittance 0.05 to 1, step size 0.05) were obtained through laboratory experiments. The atmospheric scattering model and image degradation model were used to restore the hazed image, and the optimal restoration results of the two models were explored under the parameter range and precision settings.
  • The stability of the dehazing effect of the atmospheric scattering model under a single transmittance was studied. We studied the image recovery accuracy of atmospheric light and transmittance in an atmospheric scattering model with estimation deviation. In the case of each transmittance, the permissible deviation of parameter estimation was explored when the recovery accuracy was within 90%, 80%, and 70% of the best accuracy.

2. Methods

2.1. Linear Degradation Model of Image in Haze

In the linear degradation model of haze images, the scattering medium is regarded as an optical system with a specific point diffusion function and noise characteristics. The process of the target light passing through the scattering medium is shown in Equation (1). The target light g x , y passes through a linear degradation system h x , y and is affected by additive noise n x , y to become degraded image I x , y .
In this model, the scattering medium is treated as an optical system with specific point spread functions (PSFs) and noise characteristics.
I x , y = g x , y × h x , y + n x , y .
When using this model for dehazing, the mathematical model of PSFs and noise in the model is first established, and the broadening and noise parameters are estimated. Inverse convolution and the Wiener filter are used to calculate the target image g x , y without scattering media.

2.2. Atmospheric Scattering Model

In the atmospheric scattering model, the reasons for the degradation of image quality are mainly divided into two parts. The first is the attenuation of the target light intensity caused by the absorption and scattering of the scattering medium. This reduces the proportion of target light in the image and decreases the contrast [18]. The second is the enhancement of atmospheric light intensity caused by scattering, which makes the image white as a whole and further decreases the contrast of the target.
(1) Attenuation model of target light.
When light is transmitted in a haze environment, it scatters and absorbs scattering particles. As shown in Figure 1, assume that the intensity of light emitted from a pixel position in the target image is I 0 z and is transmitted in the positive direction along the z axis. When the beam passes through the fog with thickness d , its outgoing light intensity is I z . The relationship between the attenuation intensity change in light passing through a fog with a thickness of d z and the light intensity I is shown in Equation (2).
d I z , λ I z , λ = β λ d z .
Integrate both sides in the z direction of distance d , as shown in Equation (3).
I d , λ = I 0 λ exp 0 d β λ d z .
For a pixel at any position in the x , y plane, its transmittance t is defined as the ratio of I to I 0 , as shown in Equation (4).
t x , y = I x , y I 0 x , y = exp β x , y , λ d x , y .
where β is the attenuation coefficient of haze. Here, we assume that the haze concentration does not change with x and y , so the coefficient is only a function of wavelength λ . The relationship between β and λ of haze is shown in Equation (5).
β λ 1 λ γ .
where γ is the parameter that varies with the scattering particle size. For the sky in clear weather, there is γ 4 , and for larger particles such as clouds and fog, there is usually γ 0 , at which time β hardly changes with wavelength. The higher the fog concentration, the greater the β value. If the distance of the image target does not change in the x , y plane, the transmittance can be written as Equation (6).
t x , y = I x , y I 0 x , y = exp β d .
In this case, the transmittance of the entire image is exactly the same. Since β and d in Equation (6) are both positive numbers, the value of transmittance t ranges from 0 to 1.
(2) Atmospheric light model.
The effects of non-target light, such as scattered light, sunlight, and other ambient light on the image are collectively referred to as atmospheric light. The atmospheric light intensity is shown in Equation (7).
A = A 1 t x , y .
A is the atmospheric light intensity at infinity, that is, the atmospheric light intensity at the position where there is no target in the image.
The first formula in Equation (8) shows the degradation process of haze images with single transmittance under the atmospheric scattering model. In this case, both the transmittance t and the atmospheric light A are constant and do not vary with space. The reasonable values of the two parameters are between 0 and 1.
I x , y = g x , y t + A g x , y = I x , y A t .
The method to solve the dehazed image is shown in the second formula in Equation (4). In the chapter on results and analysis, the best recovery accuracy under parameter limitation is obtained. Further, the dependence of atmospheric light on the accuracy of these two parameters is investigated.

2.3. Evaluation Method of Image Dehazing

Peak signal-to-noise ratio (PSNR) and structural similarity (SSIM) are commonly used to evaluate image de-fogging results [19,20]. In addition, some no-reference evaluation indices, such as image entropy, Natural Image Quality Evaluator, and Blind/Referenceless Image Spatial Quality Evaluator, are also used in image dehazing evaluation [21,22]. As shown in Equation (9), PSNR is calculated using the mean square error (MSE) of the two images, and the larger the value, the more similar the two images are.
P S N R = 10 log 10 255 2 M S E M S E = 1 m n i = 0 m 1 j = 0 n 1 I i , j I noise i , j ,
SSIM is obtained by calculating the variance and covariance of the image. This indicator represents the degree to which two images are similar in statistical features. No reference evaluation refers to more scenes where haze-free images cannot be obtained.
The SSIM index value is in the range of 0 ~ 1 when the two images have an SSIM exactly equal to 1. However, because this index uses statistical features, the SSIM of two images with unrelated content but similar statistical features also has a high value, which is not conducive to the differential evaluation of low-quality restored images. The no reference evaluation index is usually established by relying on outdoor scene images, and the evaluation effect of indoor scene images is less applicable. In contrast, the value of PSNR is infinite when the two images are exactly the same, and the calculation method is very direct, which is more suitable to distinguishing the different qualities of dehazed images.
Therefore, to make the results as objective as possible, PSNR is used to evaluate the image restoration accuracy.

2.4. Imaging Experiment in Haze Environment with Single Transmittance

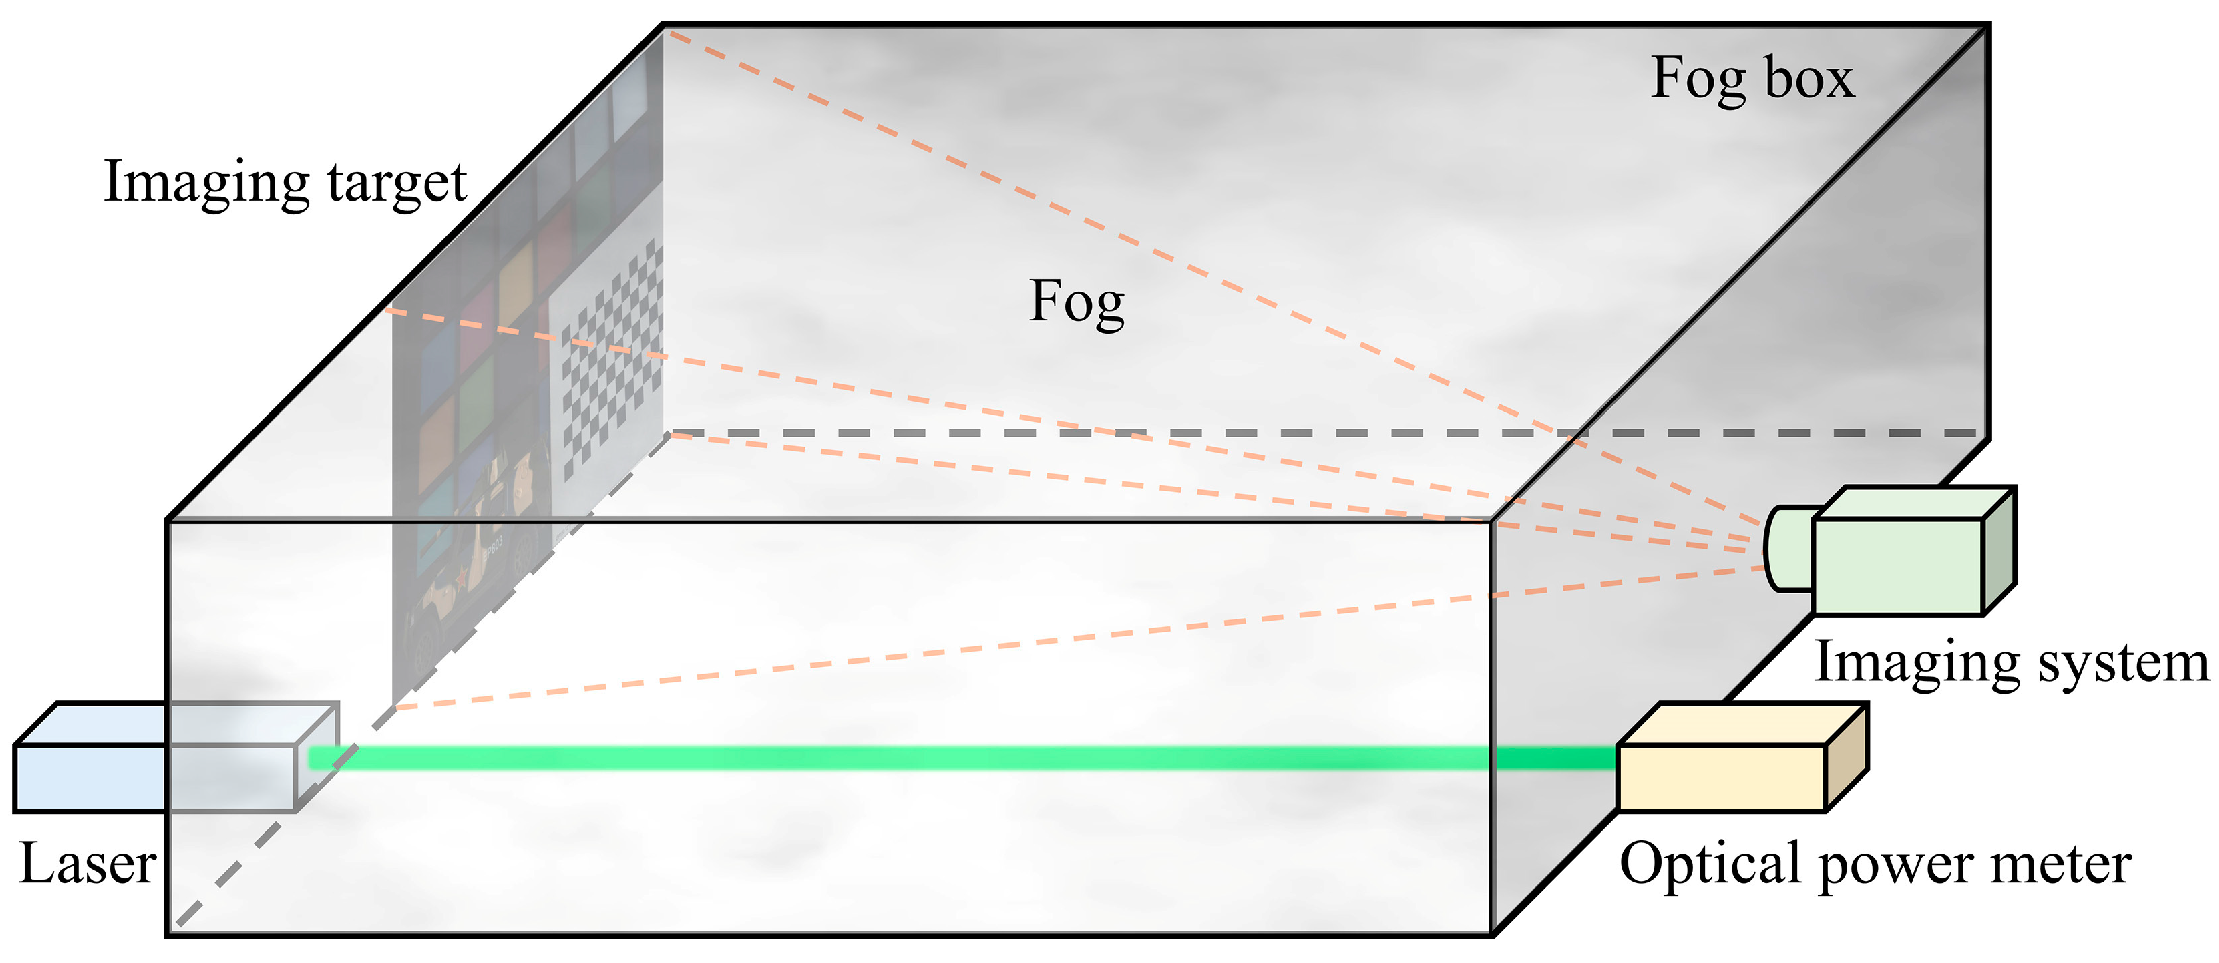
To obtain hazed images with different transmittance, an indoor experiment platform was set up. The experimental equipment included a fog box, ultrasonic atomizer, laser, optical power meter, imaging target, and imaging system.
In the experiment, an ultrasonic atomizer with a driving frequency of 1.7 MHz was used to generate fog. The diameter of the droplets generated by this method was between 2 and 3 μm, which is similar to that of natural fog outdoors.
The imaging targets were standard color plates, standard black and white plates, and car models. Among them, the standard color plate and the standard black and white plate were in the same plane, the car model was close to the standard color plate, and the width was within 10 cm. The distance between the target plane and the imaging system was 1 m.
The fog box was equipped with a monitoring optical path, using lasers and optical power meters to record the transmission rate of haze in real-time. The wavelength of the laser was 532 nm and the output power was 60 mw. An schematic diagram of the experimental device is shown in Figure 2.
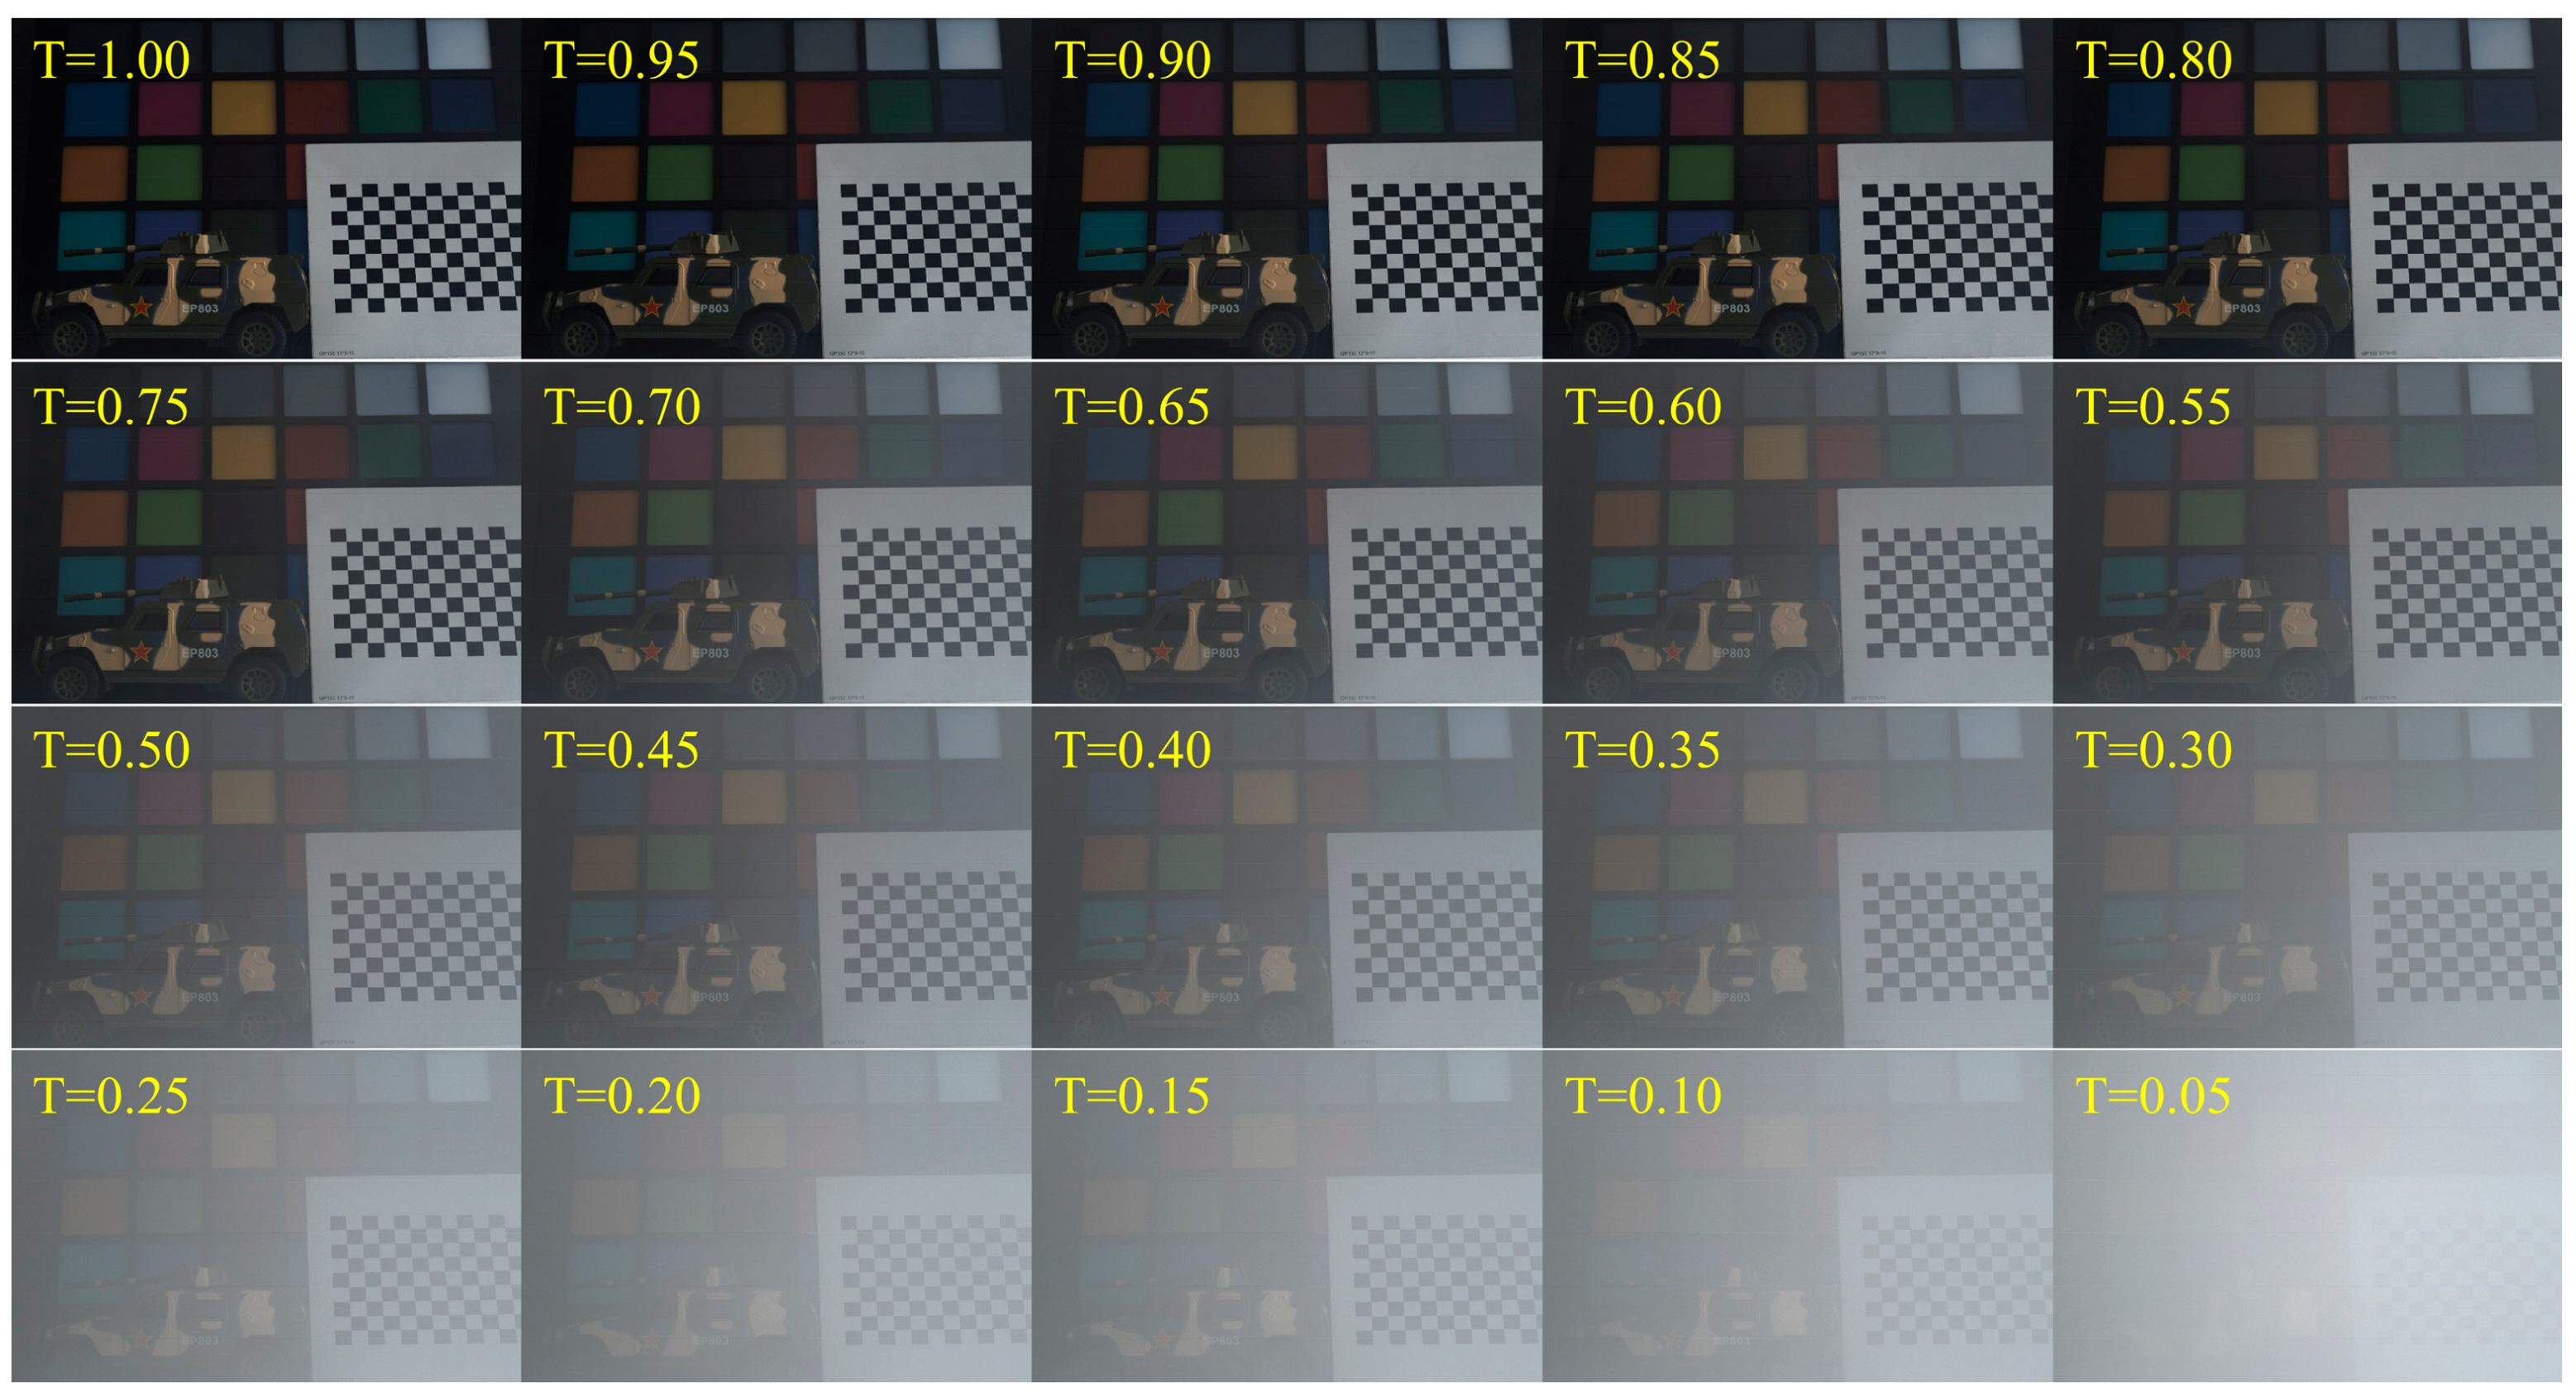
Using the experimental device in the above figure, the imaging results were obtained when the haze transmittance ranged from 0.05 to 1 (step size 0.05).
Before the fog was generated in the fog box, the target image at t = 1 was taken and the reading of the optical power meter E 0 in the reference optical path was recorded at this time. After that, the ultrasonic atomizer was turned on to make the fog concentration in the box gradually rise. The power E of real-time measurement (measurement interval was 0.1 s) was divided by the E 0 measured at the beginning of the experiment to calculate the fog transmission t and record it in real time. When the transmittance t of fog was stable below 0.05, the atomizer was closed and the imaging image of the target in the fog was collected. The time interval of the image acquisition is consistent with the measurement of the power meter, that is, the acquired image was matched with the measured transmittance. When the fog gradually dissipated to transmittance above 0.95, the image acquisition and power measurement devices were turned off. The image corresponding to the transmittance closest to 0.05 to 0.95 (step size 0.05) was selected as the experimental image, and the images in Figure 3 were be obtained.
There are two parameters that affect haze transmittance, fog concentration and distance. However, for the conventional imaging system, when the field of view angle is unchanged, the distance between the target and the imaging system will affect the imaging range, resulting in a change in the target in the image at different distances. In order to keep the imaging target as unchanged as possible under different transmittance, we chose to change the concentration of fog to adjust its transmittance. If we chose to change the distance instead of the concentration, then the same object would be larger in the image when the distance was close, and the area would gradually shrink as the distance increased. In the fog removal experiment, it was necessary to intercept and interpolate the images with different transmittance levels to obtain target images with the same size and pixel number. Considering the above factors, this paper adopts the method of changing the concentration to adjust the haze transmittance.
As shown in Figure 3, the proportion of target light in the image decreases with the decrease in transmittance, the atmospheric light component increases significantly, and the image contrast decreases significantly.
In order to make the transmittance and atmospheric light in the experimental image close to the constant, five small regions of the image were selected for an image restoration experiment, as shown in Figure 4. In the experiment, the haze in the fog box was approximately evenly distributed, but due to the influence of gravity and other factors, there may have been small differences in the haze concentration in different regions of the image, which led to a slight change in the transmittance with the space. At the same time, it was difficult to achieve a completely uniform distribution for the atmospheric light in the indoor environment. Therefore, the smaller the selected area, the closer the transmittance and atmospheric light are to the constant; however, the target information in the image will be very small, so it is necessary to choose the appropriate size. The selected area in Figure 4 contains targets of multiple colors, and it has both low- and high-frequency information, including multiple types of target information on the premise of ensuring the transmittance and atmospheric light proximity constant.
The interception area of the standard color plate and the standard black and white plate are 250 × 250 pixels, and the interception area of the car model is 170 × 580 pixels. Five small region images were applied to the atmospheric scattering model, and PSNR was used to evaluate the recovery accuracy. The PSNR average value of the recovery results of the five regions was taken as the recovery accuracy under the transmission rate.

3. Results and Discussion

3.1. Recovery Effect of Atmospheric Scattering Model under Single Haze Transmittance

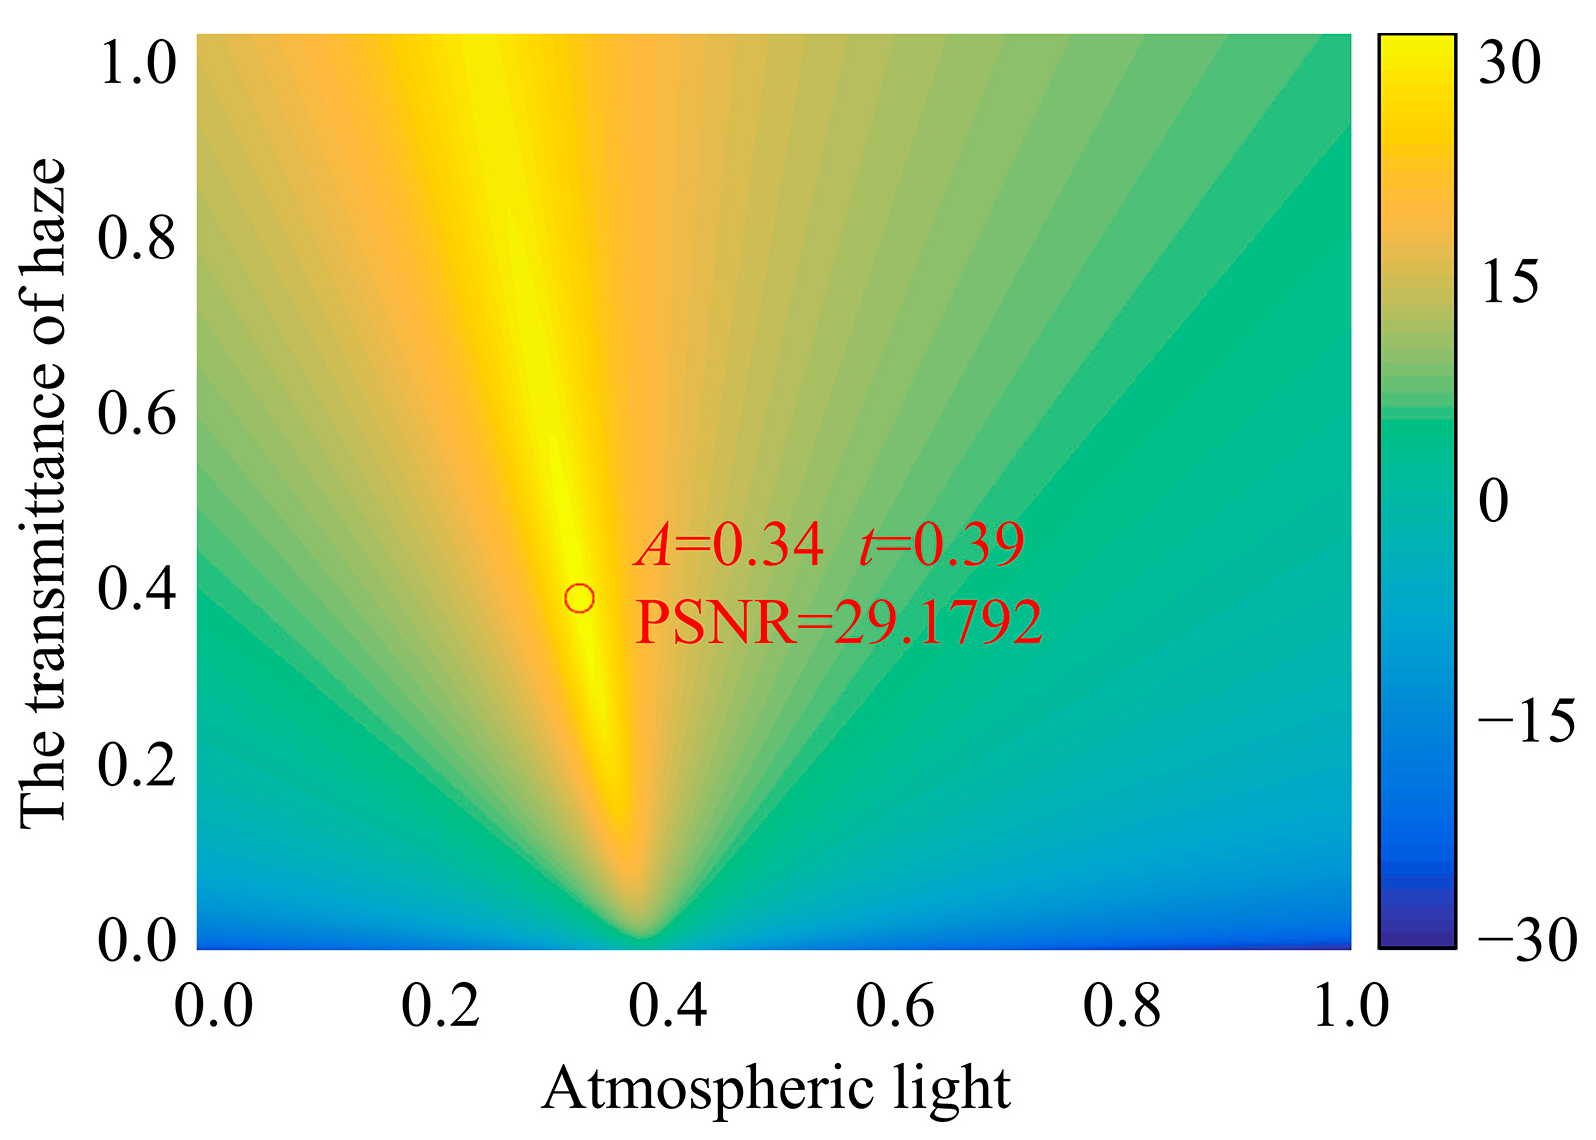
An atmospheric scattering model and image degradation model were used for single transmittance image restoration. The atmospheric scattering model is Equation (8), and the linear degradation model is Equation (1), both of which are commonly used image dehazing models. In the atmospheric scattering model, the parameters of atmospheric light and transmittance range from 0 to 1, and the minimum interval between the parameters is 0.01. When the transmittance measured by the reference optical path is 0.4, the optimal image recovery accuracy within the set parameter range is shown in Figure 5.
Fixed parameter t = 0 , parameter A was changed from 0.01 to 1 (step size 0.01), the reconstructed image of the atmospheric scattering model was calculated, the PSNR was calculated, and then the value of t was increased and the above process was repeated until t was increased to 1 (step size 0.01). By calculating 10,000 combinations of A and t , the PSNR of the defogging results obtained by these combinations under the atmospheric scattering model can be obtained, and the results in Figure 5 can be obtained.
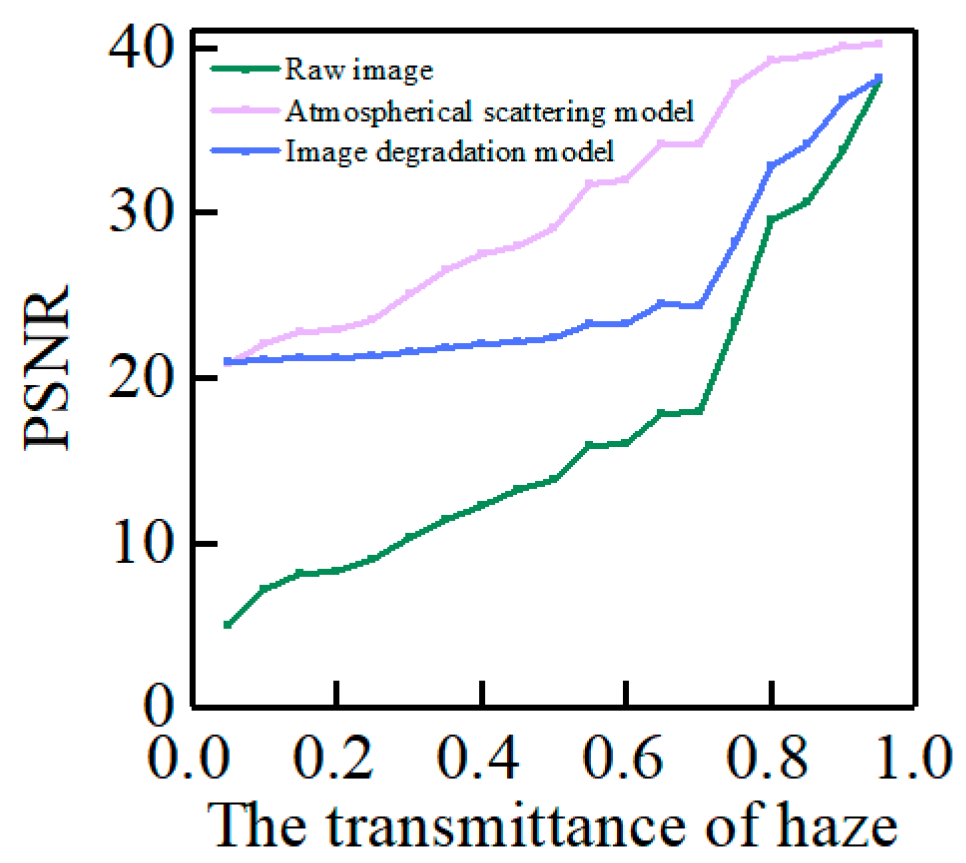
The optimal recovery results of the two models under each transmittance are shown in Figure 6. When haze transmittance is greater than 0.9, the maximum PSNR of the atmospheric scattering model is greater than 40, and the maximum PSNR of the image degradation model is between 35 and 40. When haze transmittance is greater than 0.3 and less than 0.9, the optimal PSNR of the atmospheric scattering model is greater than 25. The image degradation model is lower than 25 when the haze transmittance is 0.7. It can be seen that the recovery accuracy of the atmospheric scattering model is better than that of the image degradation model in the range of test transmittance.
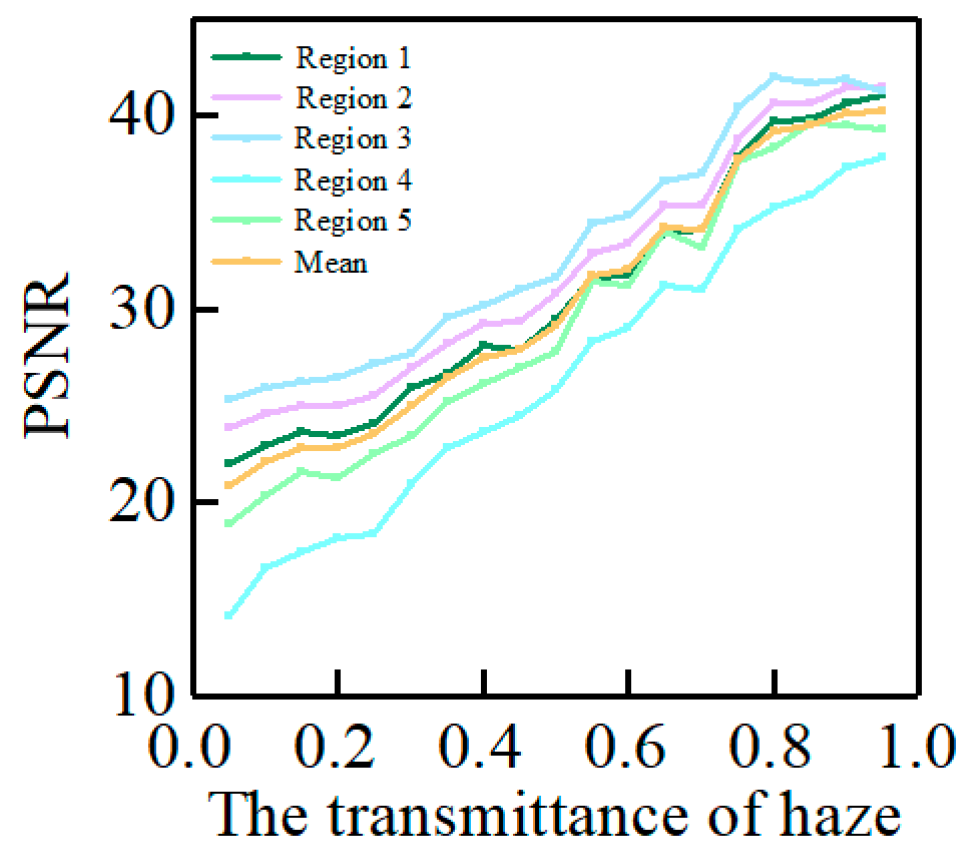
The optimal recovery accuracy of the five selected regions under the atmospheric scattering model is shown in Figure 7.
The relationship between PSNR and transmittance of target recovery results in different regions is basically the same, but there are some differences in value. Five different regions were selected to investigate the recovery effect of the atmospheric scattering model on low-frequency and high-frequency targets of different colors. The research in this paper focuses on the influence of transmittance and atmospheric light on the recovery effect, while the influence of target type on the atmospheric scattering model is a very large and complex subject that will be investigated in the follow-up research. For transmittance between 0.5 to 0.8, the different types of targets showed slightly different trends, and this may be the result of target colors and texture features.

3.2. Recovery Effect of Atmospheric Scattering Model under Single Haze Transmittance

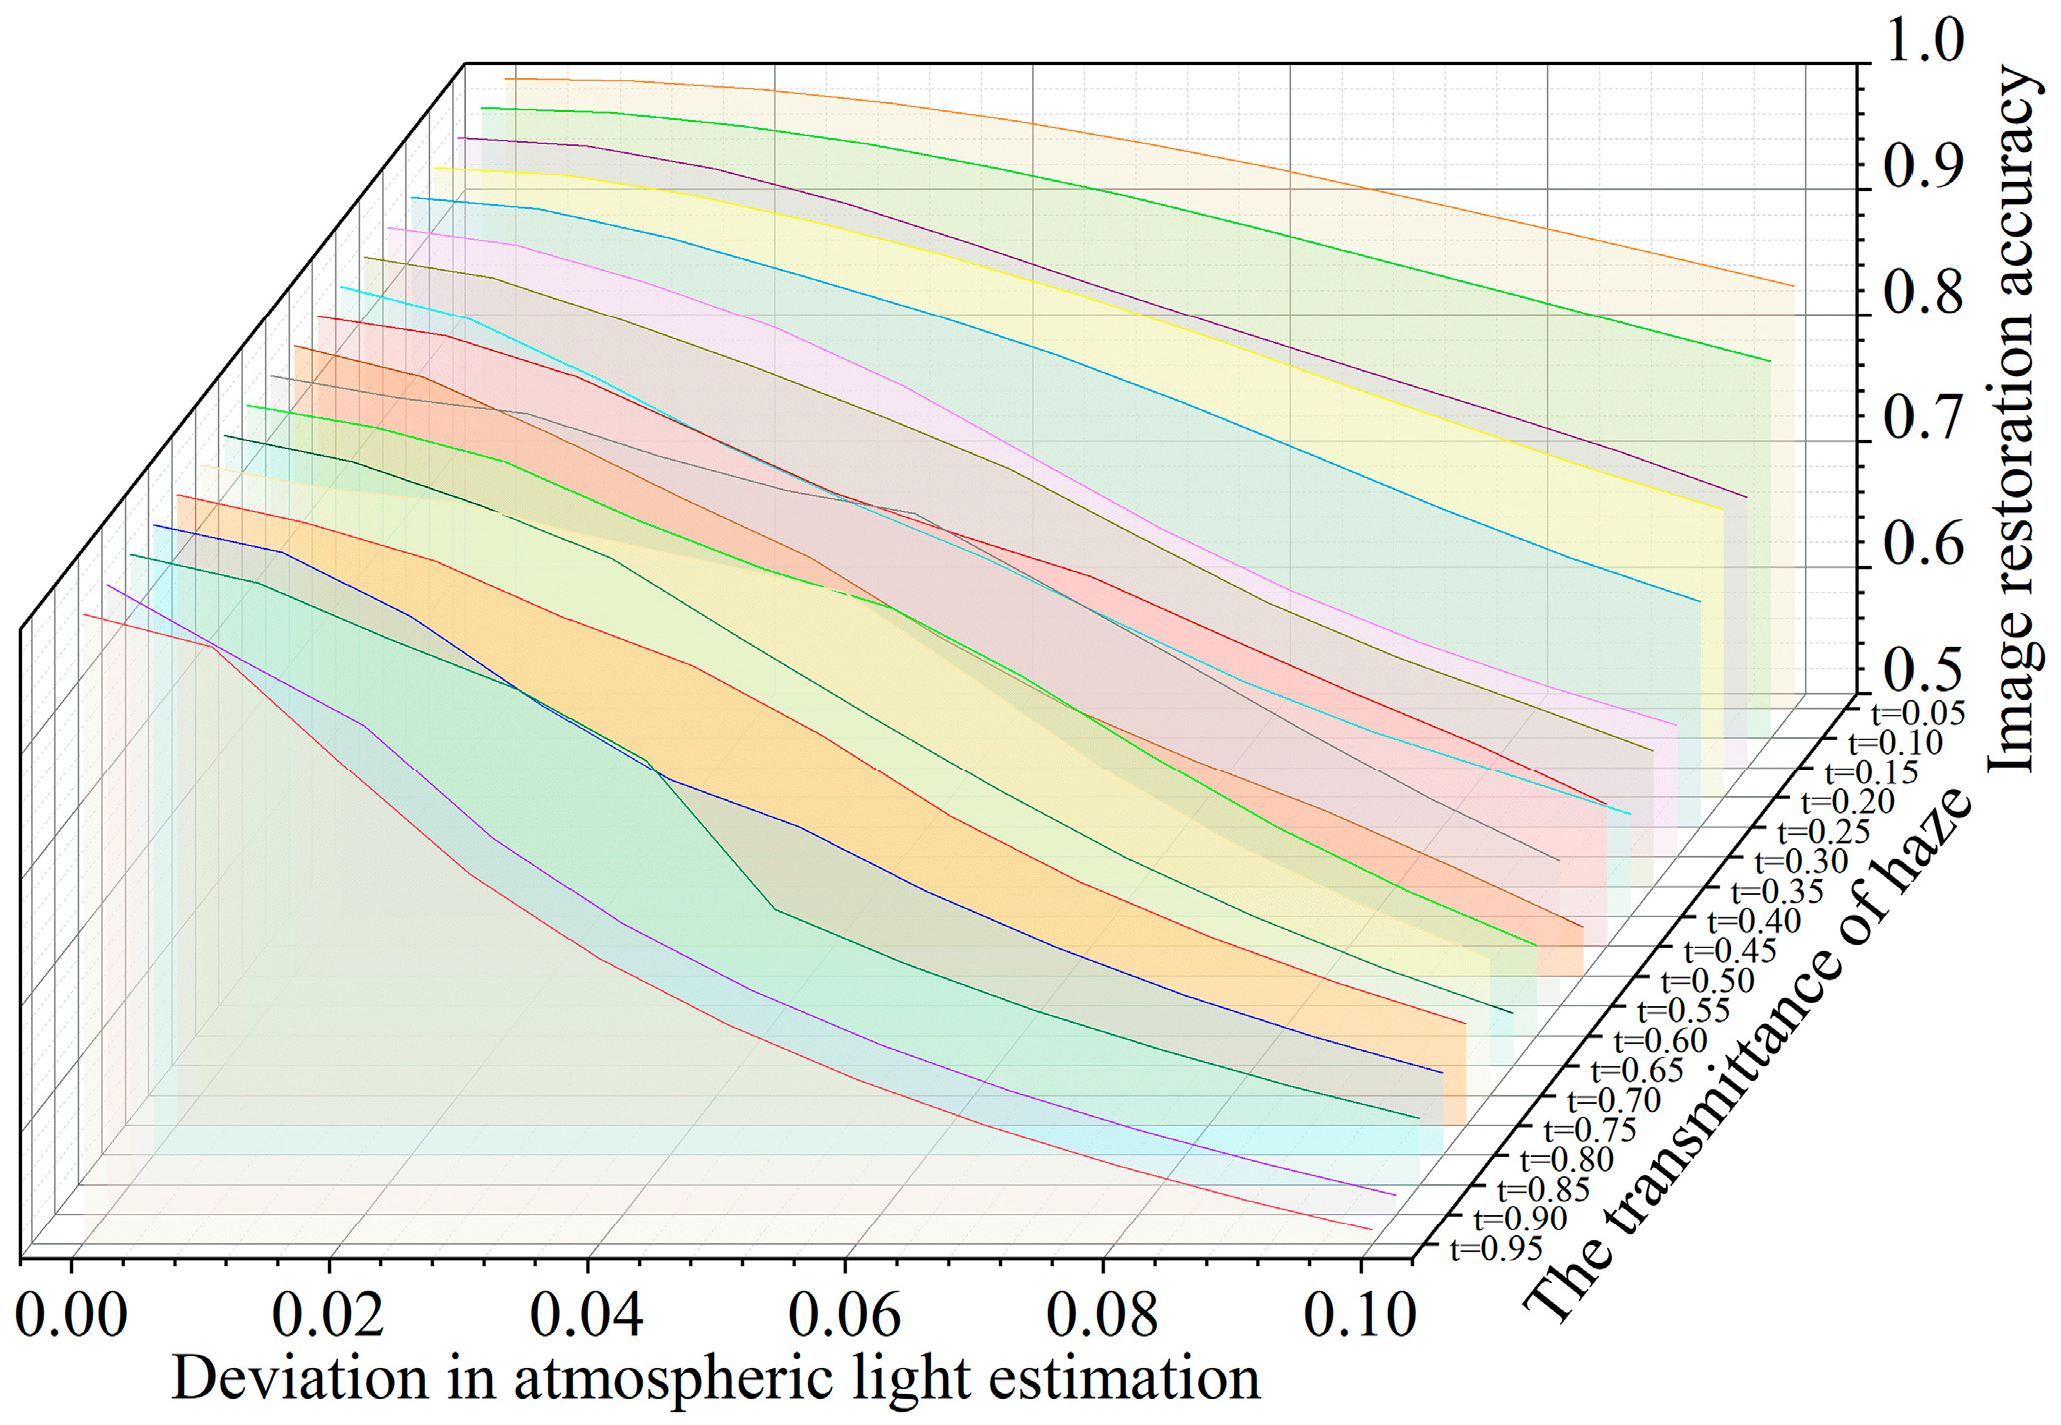
In this chapter, the dependence of atmospheric scattering models on the accuracy of atmospheric light and transmittance estimates is investigated. Figure 8 shows the ratio of PSNR to the optimal PSNR when atmospheric light parameters deviate from the optimal value. The relative recovery accuracy after parameter deviation at each transmittance is studied.
The experimental results show that the higher the transmittance, the more dependent the recovery accuracy is on the estimation accuracy of atmospheric light. When the transmittance is 0.95, the atmospheric light estimation deviation of 0.1 will cause the PSNR to almost halve. When the transmittance is 0.05, the same atmospheric light estimation deviation will only cause the PSNR to change to about 80% of the optimal value.
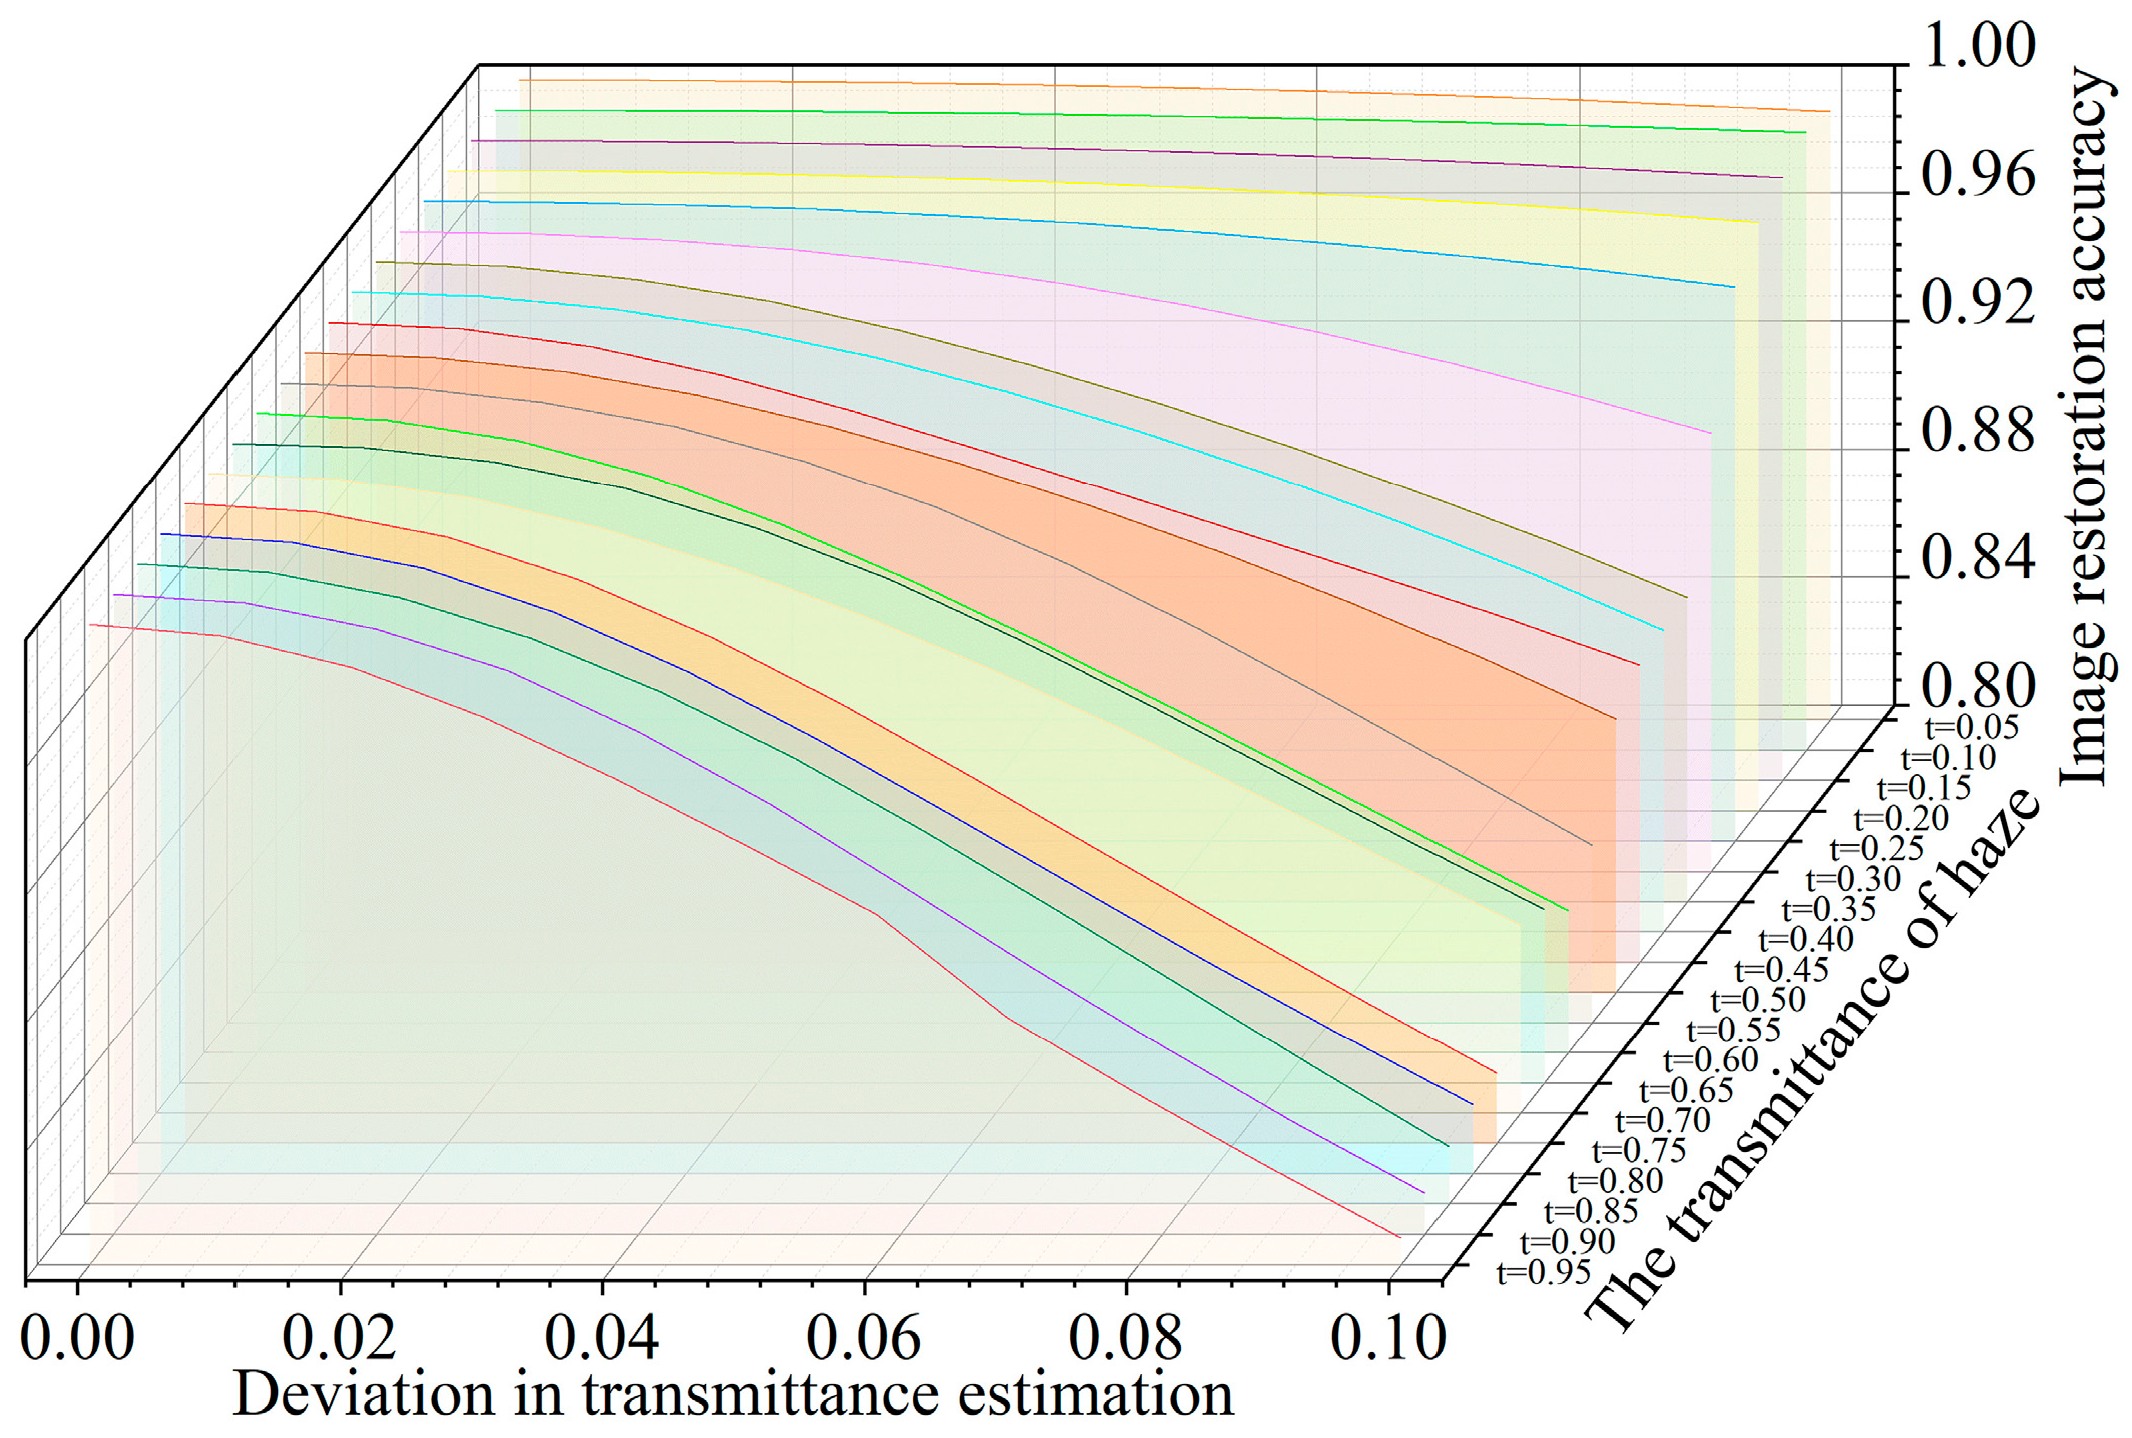
In contrast, deviations in transmittance estimates lead to a smaller reduction in image recovery accuracy, as shown in Figure 9.
In all the transmittance cases tested, PSNR is greater than 80% of the optimal PSNR after a transmittance estimate deviation of 0.1. When the transmittance is less than 0.1, the same deviation results in a PSNR reduction of less than 5%.
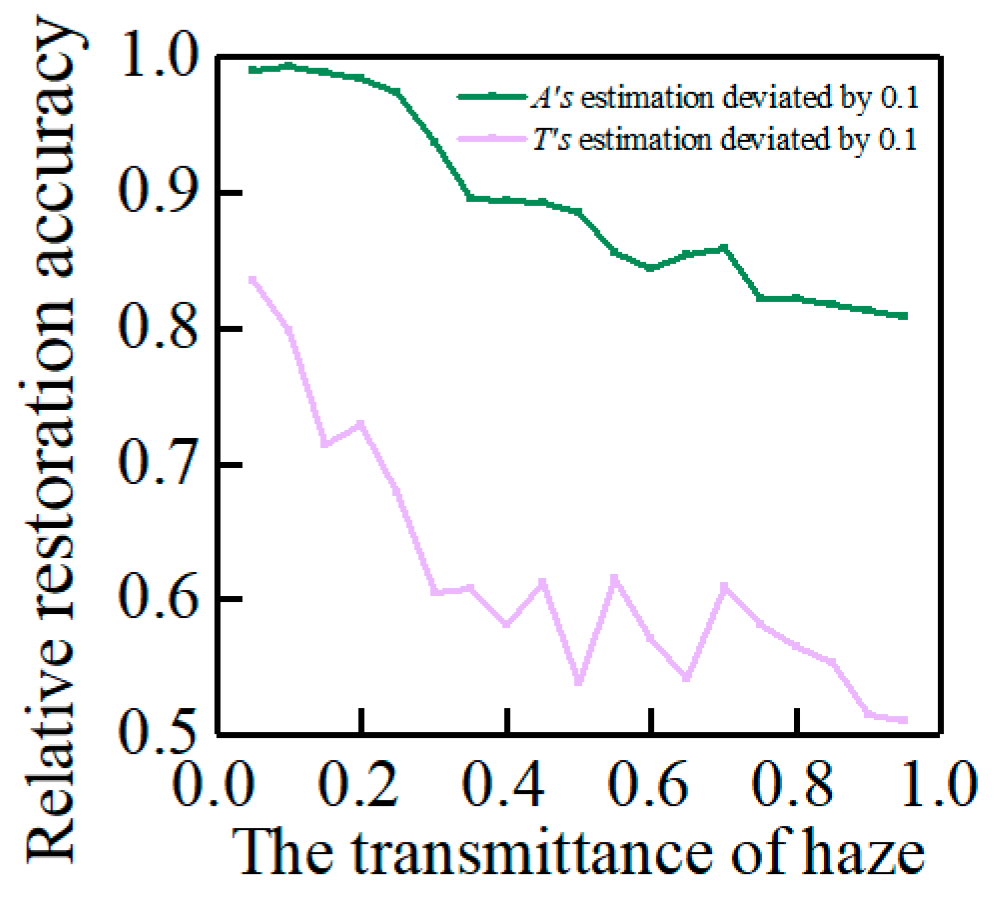
Figure 10 shows the relative recovery accuracy when the estimates of A and T deviate by 0.1, respectively. Near the transmittance of 0.65, the green curve has a small peak, while the purple curve in the nearby transmittance region has a fluctuation. The reason for the above phenomenon may be that in this transmittance region, the relative restoration accuracy of the image is not closely related to the transmittance in the case of parameter estimation deviation, so the result fluctuates. It may also be that there is not a simple negative correlation between the two, but a more complex internal connection, which will be analyzed in the future research.
With the increase in transmittance, the relative recovery accuracy showed a downward trend. In the range of parameters tested, the accuracy of image restoration depends more on the accuracy of atmospheric light estimation and less on the accuracy of transmittance estimation.
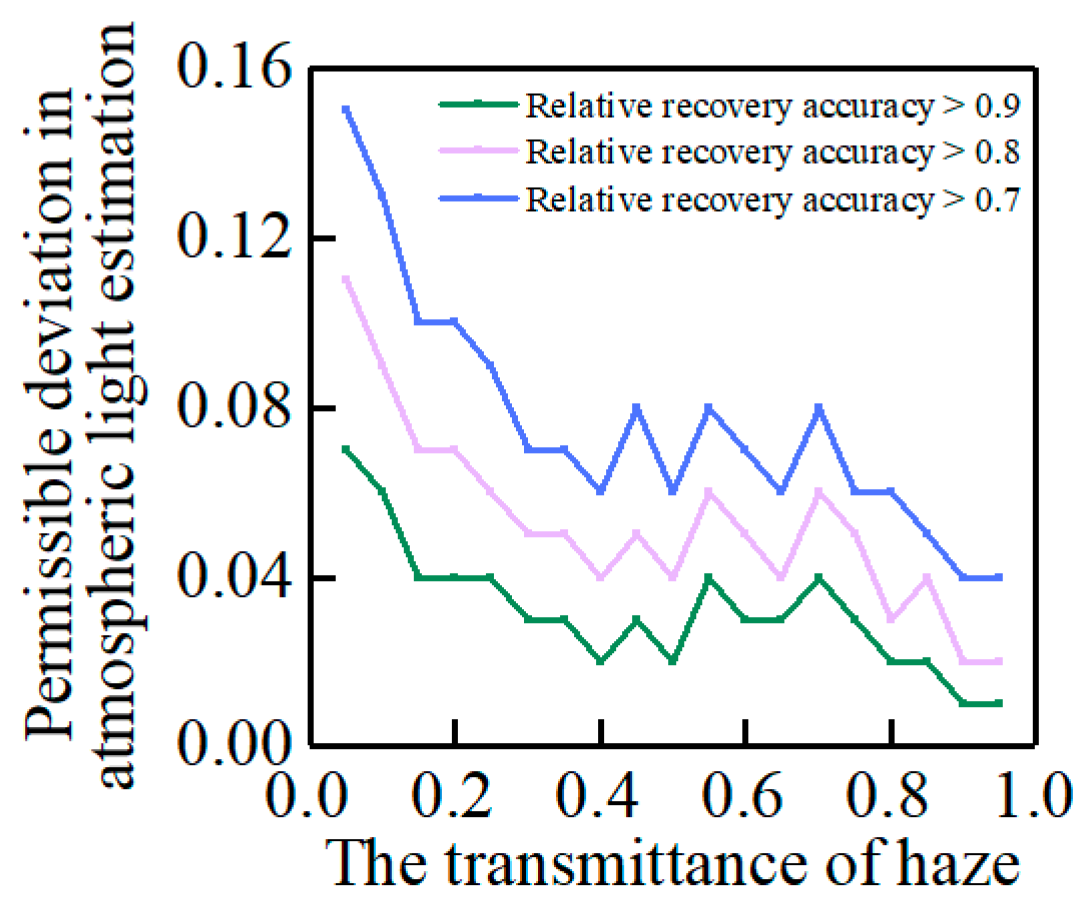
At each transmittance, the allowable atmospheric light estimation deviation when an optimal recovery accuracy of 90%, 80%, or 70% is achieved is shown in Figure 11.
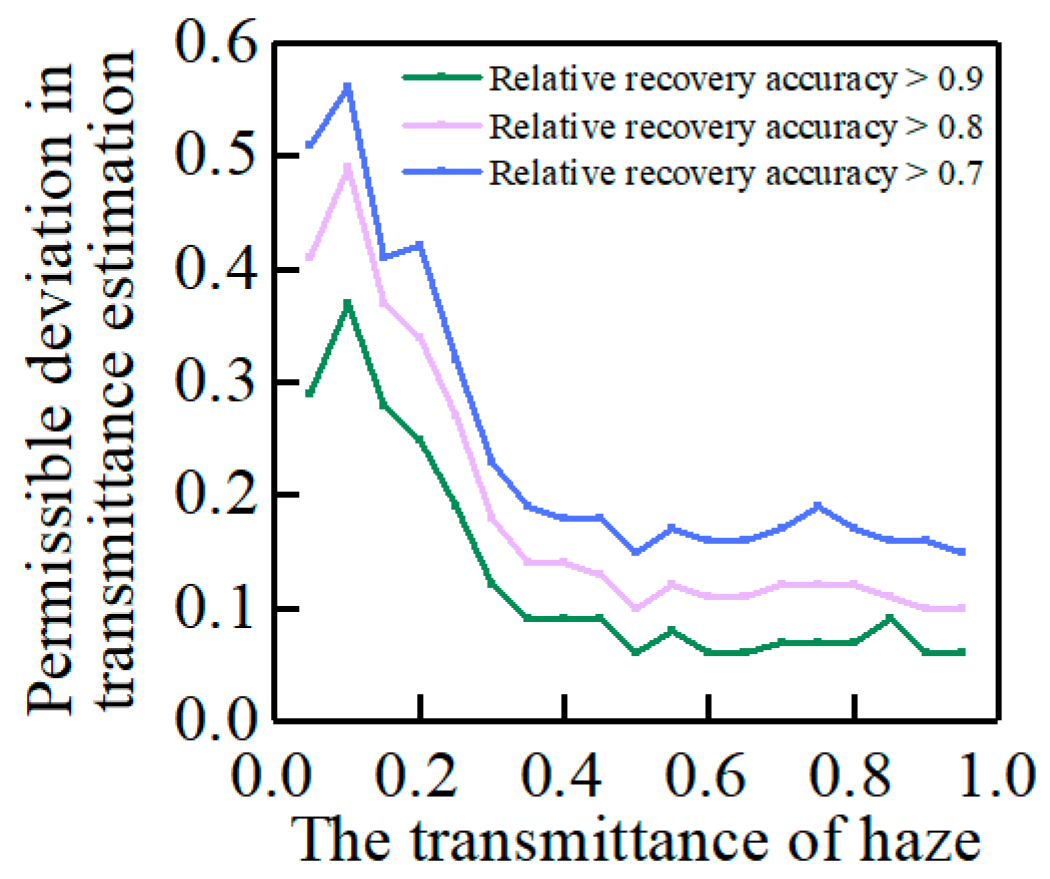
For each transmittance, the allowable transmittance estimation deviation when an optimal recovery accuracy of 90%, 80%, and 70% is achieved is shown in Figure 12.
The allowable deviations of both parameters showed a decreasing trend with the increase in transmittance. Under the same accuracy requirements, the allowable deviation of atmospheric light parameters was much lower than the transmittance. When the recovery accuracy of the limit was more than 90% of the best accuracy (transmittance 0.05), the atmospheric light parameter could only deviate from about 0.07. In contrast, the transmittance could deviate by more than 0.28, which is four times the allowable deviation of atmospheric light. This shows that the atmospheric scattering model depends much more on the estimation accuracy of atmospheric light parameters than the transmittance parameters.

4. Conclusions

In this paper, a single transmittance image is used as the research object, which avoids the problem in which parameters of the atmospheric scattering model change with space, making it possible to quantitatively analyze the influence of atmospheric light and transmittance parameters on the dehazing effect. According to the above methods, the robustness of the atmospheric scattering model and its dependence on the accuracy of parameter estimation were studied. Under the same deviation, the decrease in PSNR induced by the estimation deviation of atmospheric light parameters was higher. With the same recovery accuracy, the allowable deviation of transmittance estimation was much higher than that of atmospheric light. In other words, the atmospheric scattering model is more sensitive to atmospheric light parameters and more dependent on its estimation accuracy. Therefore, the haze removal method under the atmospheric scattering model should pay more attention to the accurate estimation of the atmospheric light component in the image rather than the transmittance. In conclusion, the stability of the atmospheric scattering model was studied, and the priority of parameter estimation in this model is provided.

Author Contributions

Conceptualization, X.S.; methodology, X.S.; data curation, L.J.; writing—original draft preparation, X.S.; writing—review and editing, Y.M.; visualization, S.C. All authors have read and agreed to the published version of the manuscript.

Funding

This research received no external funding.

Institutional Review Board Statement

Not applicable.

Informed Consent Statement

Not applicable.

Data Availability Statement

The data presented in this study are available on request from the corresponding author due to data underlying the results presented in this paper are not publicly available at this time.

Conflicts of Interest

The authors declare no conflicts of interest.

References

  1. Guo, X.; Yang, Y.; Wang, C.; Ma, J. Image dehazing via enhancement, restoration, and fusion: A survey. Inf. Fusion 2022, 87, 146–170. [Google Scholar] [CrossRef]
  2. Zhang, C.; Zhang, J.; Wu, X.; Huang, M. Numerical analysis of light reflection and transmission in poly-disperse sea fog. Opt. Express 2020, 28, 25410–25430. [Google Scholar] [CrossRef] [PubMed]
  3. Jaffe, J.S. Underwater Optical Imaging: The Past, the Present, and the Prospects. IEEE J. Ocean. Eng. 2015, 40, 683–700. [Google Scholar] [CrossRef]
  4. Zhang, L.; Yin, Z.; Zhao, K.; Tian, H. Lane detection in dense fog using a polarimetric dehazing method. Appl. Opt. 2020, 59, 5702–5707. [Google Scholar] [CrossRef] [PubMed]
  5. Sun, R.; Liao, T.; Fan, Z.; Zhang, X.; Wang, C. Polarization dehazing method based on separating and iterative optimizing airlight from the frequency domain for different concentrations of haze. Appl. Opt. 2022, 61, 10362–10373. [Google Scholar] [CrossRef] [PubMed]
  6. Qu, Y.; Zou, Z. Non-sky polarization-based dehazing algorithm for non-specular objects using polarization difference and global scene feature. Opt. Express 2017, 25, 25004–25022. [Google Scholar] [CrossRef] [PubMed]
  7. Fang, S.; Xia, X.; Huo, X.; Chen, C. Image dehazing using polarization effects of objects and airlight. Opt. Express 2014, 22, 19523–19537. [Google Scholar] [CrossRef] [PubMed]
  8. Schechner, Y.; Narasimhan, S.; Nayar, S. Polarization-based vision through haze. Appl. Opt. 2003, 42, 511–525. [Google Scholar] [CrossRef]
  9. Fade, J.; Panigrahi, S.; Carré, A.; Frein, L.; Hamel, C.; Bretenaker, F.; Ramachandran, H.; Alouini, M. Long-range polarimetric imaging through fog. Appl. Opt. 2014, 53, 3854–3865. [Google Scholar] [CrossRef]
  10. Liang, J.; Ren, L.; Ju, H.; Zhang, W.; Qu, E. Polarimetric dehazing method for dense haze removal based on distribution analysis of angle of polarization. Opt. Express 2015, 23, 26146–26157. [Google Scholar] [CrossRef]
  11. Wang, H.; Hu, H.; Jiang, J.; Li, X.; Zhang, W.; Cheng, Z.; Liu, T. Automatic underwater polarization imaging without background region or any prior. Opt. Express 2021, 29, 31283–31295. [Google Scholar] [CrossRef] [PubMed]
  12. He, K.; Sun, J.; Tang, X. Single Image Haze Removal Using Dark Channel Prior. IEEE Trans. Pattern Anal. Mach. Intell. 2011, 33, 2341–2353. [Google Scholar] [PubMed]
  13. Zhu, Q.; Mai, J.; Shao, L. A Fast Single Image Haze Removal Algorithm Using Color Attenuation Prior. IEEE Trans. Image Process. 2015, 24, 3522–3533. [Google Scholar] [PubMed]
  14. Cheng, S.; Yang, B. An efficient single image dehazing algorithm based on transmission map estimation with image fusion. Eng. Sci. Technol. Int. J. 2022, 35, 101190. [Google Scholar] [CrossRef]
  15. Zhu, Z.; Luo, Y.; Wei, H.; Li, Y.; Qi, G.; Mazur, N.; Li, Y.; Li, P. Atmospheric light estimation based remote sensing image dehazing. Remote Sens. 2021, 13, 2432. [Google Scholar] [CrossRef]
  16. Zhu, Z.; Wei, H.; Hu, G.; Li, Y.; Qi, G.; Mazur, N. A novel fast single image dehazing algorithm based on artificial multiexposure image fusion. IEEE Trans. Instrum. Meas. 2021, 70, 1–23. [Google Scholar] [CrossRef]
  17. Emberton, S.; Chittka, L.; Cavallaro, A. Underwater image and video dehazing with pure haze region segmentation. Comput. Vis. Image Underst. 2018, 168, 145–156. [Google Scholar] [CrossRef]
  18. Narasimhan, S.G.; Nayar, S.K. Vision and the Atmosphere. Int. J. Comput. Vis. 2002, 48, 233–254. [Google Scholar] [CrossRef]
  19. Shiao, Y.H.; Chen, T.J.; Chuang, K.S.; Lin, C.H.; Chuang, C.C. Quality of Compressed Medical Images. J. Digit. Imaging 2007, 20, 149–159. [Google Scholar] [CrossRef]
  20. Wang, Z.; Bovik, A.C.; Sheikh, H.R.; Simoncelli, E.P. Image quality assessment: From error visibility to structural similarity. IEEE Trans. Image Process. 2004, 13, 600–612. [Google Scholar] [CrossRef]
  21. Mittal, A.; Soundararajan, R.; Bovik, A.C. Making a ‘Completely Blind’ Image Quality Analyzer. IEEE Signal Process. Lett. 2013, 20, 209–212. [Google Scholar] [CrossRef]
  22. Mittal, A.; Moorthy, A.K.; Bovik, A.C. No-reference image quality assessment in the spatial domain. IEEE Trans. Image Process. 2012, 21, 4695–4708. [Google Scholar] [CrossRef] [PubMed]
Figure 1. The intensity attenuation process of light transmission in haze.
Photonics 11 00515 g001
Figure 2. Experimental device for imaging haze environment with single transmittance with monitoring light path.
Photonics 11 00515 g002
Figure 3. Imaging results of target in haze environment with single transmittance.
Photonics 11 00515 g003
Figure 4. Five regions captured in the target image.
Photonics 11 00515 g004
Figure 5. PSNR of a dehazed image when haze transmittance is equal to 0.4.
Photonics 11 00515 g005
Figure 6. The maximum PSNR values of the two image dehazing models within the set parameter range.
Photonics 11 00515 g006
Figure 7. The change in PSNR value with transmittance in five regions.
Photonics 11 00515 g007
Figure 8. Image restoration accuracy when atmospheric light parameters deviate under various haze transmittance conditions.
Photonics 11 00515 g008
Figure 9. Image restoration accuracy when transmittance parameters deviate under various haze transmittance conditions.
Photonics 11 00515 g009
Figure 10. Image restoration accuracy when atmospheric light and transmittance parameters deviate 0.1 under various haze transmittance conditions.
Photonics 11 00515 g010
Figure 11. The allowable deviation of atmospheric light estimation when the required recovery accuracy is achieved under various haze transmittance conditions.
Photonics 11 00515 g011
Figure 12. The allowable deviation of atmospheric light estimation when the required recovery accuracy is achieved under various haze transmittance conditions.
Photonics 11 00515 g012
Disclaimer/Publisher’s Note: The statements, opinions and data contained in all publications are solely those of the individual author(s) and contributor(s) and not of MDPI and/or the editor(s). MDPI and/or the editor(s) disclaim responsibility for any injury to people or property resulting from any ideas, methods, instructions or products referred to in the content.