Article

Humidity Sensing Using a Multimode Fiber Ring Laser with Thermal Compensation

1
Center for Optics Research and Engineering, Shandong University, Qingdao 266237, China
2
Key Laboratory of Laser and Infrared System of Ministry of Education, Shandong University, Qingdao 266237, China
3
School of Information Science and Engineering, Shandong University, Qingdao 266237, China
*
Author to whom correspondence should be addressed.
Photonics 2024, 11(6), 484; https://doi.org/10.3390/photonics11060484
Submission received: 29 March 2024 / Revised: 14 May 2024 / Accepted: 16 May 2024 / Published: 21 May 2024
(This article belongs to the Special Issue Emerging Trends in Optical Fiber Sensors and Sensing Techniques)

Abstract

:
We propose a multimode fiber laser sensor utilizing PI-SMF (polyimide-coated single mode fiber) for low-error relative humidity (RH) measurement, which is temperature compensated based on FBG. The PI-SMF in the laser cavity is used as a sensing element, and its length varies with humidity and temperature by volume-variation induced strain, which leads to frequency shift of the longitudinal mode beat frequency signal (BFS). When the 2000 MHz BFS is selected as the sensing signal, a RH sensitivity of −2.68 kHz/%RH and a temperature sensitivity of −14.05 kHz/°C are achieved. The peak shift of the FBG-based laser emission spectrum is only sensitive to temperature rather than RH with a temperature sensitivity of 9.95 pm/°C, which is used as the temperature compensation for RH measurements. By monitoring the response of the BFS and the laser wavelength, the cross-sensitivity effect of RH and temperature is overcome, and low-error RH measurement in the temperature range of 20 to 65 °C is realized with errors within ±0.67 %RH (25 to 85 %RH). The scheme does not require the design and production of complex structures and hygroscopic material coating processes, owning the advantages of simple structure, easy operation and high accuracy, and is expected to be practically applied in food safety and environmental monitoring.

1. Introduction

High accurate relative humidity (RH) measurement is vital in various fields, such as environmental monitoring, industrial and agricultural production, and food safety [1]. Compared with electronic sensors, fiber-optic sensors have competitive advantages such as small size, light weight, high sensitivity, and resistance to electromagnetic interference [2]. In recent years, there have been many reports on fiber optic sensors for humidity, with the aim of improving sensitivity and measurement range and reducing temperature crosstalk effects [3]. According to the sensing mechanism and physical structure, the optical fiber-based RH sensing methods include optical absorption [4], fiber Bragg gratings (FBGs) [5,6], long-period gratings (LPGs) [7], interferometers [8,9], resonators [10], and surface plasmon resonances(SPRs) [11]. So far, most of the sensors based on the above methods require fabrication of special sensing structures and coating the sensing region with various hygroscopic materials to obtain sensitivity to humidity. For example, in 2020, Bai et al. proposed a fiber optic RH sensor based on microfiber Sagnac rings (MSL) and MoS2 nanosheets with a RH sensitivity of 176.6 pm/%RH [8]. In 2023, Liu et al. demonstrated a hybrid sensor of FBG and Fabry-Perot interferometer (FPI) with RH and temperature sensitivities of 0.348 nm/%RH and −0.0356 nm/°C, respectively. The FPI is developed by using femtosecond (fs) laser to print a polymer microcantilever at the end of a single-mode fiber [9]. The complex sensing structure and post-coating process usually make the above sensing methods suffer from high cost, small yield and poor repeatability in batch production, which are not favorable for industrial production and commercial applications [12,13].
Recently, several works directly utilizing hygroscopic commercial optical fibers as RH sensing elements have been reported [14,15]. Compared to the above sensing structure, the direct use of commercial optical fibers as RH sensing probes reduces the complexity of sensing probe fabrication and improves the mechanical strength of the sensor. In 2021, Chen et al. proposed a polymer optical fiber (POF)-based high-resolution humidity sensor, which combined with microwave photon interrogation technique achieved a humidity sensitivity of 84 MHz/%RH and a resolution of 0.0119 %RH [14]. However, the POF’s poor thermal resistance prevents it from being applied at higher temperatures, and the demodulation scheme requires additional sensors to overcome temperature crosstalk effects. Subsequently, we demonstrated the simultaneous measurement of temperature and humidity based on forward Brillouin scattering (FBS) within a polyimide-coated single mode fiber (PI-SMF). By monitoring the characteristic peak shift and half-height width variation of the FBS spectrum, the humidity sensitivity and measurement error were obtained to be 6.32 kHz/%RH and 1.651 %RH, respectively [15]. Unfortunately, the low efficiency of FBS leads to a poor signal-to-noise ratio (SNR) of the sensing signal, which hinders further improvement of the sensing accuracy. Hence, it is significant to develop a RH measurement scheme with simple structure, less complexity, easy to fabricate, high SNR, and capable of overcoming temperature cross-sensitivity. The sensing method based on fiber laser and beat frequency demodulation technology has the advantages of high SNR and narrow linewidth, which is one of the ideal choices to solve the above problems [16]. Due to the presence of many longitudinal modes, beat frequency signals (BFSs) are generated between any two modes, resulting in a sensing technique in which a laser intra-cavity fiber is used as the sensing element. Small changes in length or refractive index of the laser cavity can lead to frequency shift of the BFSs, so measurements of strain, temperature, bending and so on can be achieved by detecting the BFSs [16,17,18]. The fiber laser with PI-SMF as the sensing element combined with beat frequency demodulation avoids the fabrication of complex microstructures and is expected to achieve high-sensitivity RH detection. In addition, considering the cross-sensitivity problem between temperature and relative humidity, it is necessary to install a temperature compensation device to realize low error relative humidity measurement.
In this paper, a multimode fiber ring laser sensor with PI-SMF and bare FBG is proposed for low-error RH detection. The PI-SMF in the laser cavity acts as a sensing element sensitive to RH and temperature changes, and the beat-frequency sensing signal is subsequently shifted when the external environment condition varies. The bare FBG at the end of the laser cavity is only sensitive to temperature and can be used as a feedback mirror for the laser emission and as a temperature compensation element, to overcome the temperature cross-sensitivity effect. The experimental results show that the RH and temperature sensitivities of the 2000 MHz beat frequency sensing signals are −2.68 kHz/%RH and −14.05 kHz/%RH, respectively, and the maximum measurement error of RH is within ±0.67 %RH. This sensing method does not require complex structures and directly utilizes commercially available optical fibers and devices, which has the advantages of simple structure, cost-effectiveness, and ease of integration.

2. Experimental Setup and Operation Principle

The experimental configuration of the fiber-optic ring laser sensor for low-error RH measurement with bare FBG-based temperature compensation is shown in Figure 1. The typical fiber ring cavity consists of a 976-nm diode laser, a wavelength division multiplexer (WDM) coupler, a 0.25 m length of erbium-doped fiber (EDF, LIEKKI, Er110-4/125, Lohja, Finland), an isolator (ISO), a 3-port circulator, a 90 m long polyimide-coated fiber (YOFC, HT 9/125-14/155, Wuhan, China), a bare FBG, an optical coupler (OC). The isolator is used to ensure that the light is transmitted unidirectionally in the laser cavity. In the system, the PI-SMF is bent into a small ring and placed into the environmental chamber as a sensing element, which does not require complex fabrication processes and ensures high mechanical strength of the probe. The bare FBG, which is only sensitive to temperature [7], acts as a feedback mirror for laser emission and as a temperature compensation element for RH measurements. The output of the laser is divided into two parts by OC2. One part of the laser output is used to monitor the optical spectrum of the laser with an optical spectrum analyzer (OSA, YOKOGAWA, AQ6370C, Tokyo, Japan). The other part of the laser output is connected to a photodetector (PD, EOT-ET3500F, 15 GHz, Traverse City, MI, USA) to generate a beat frequency signal which is detected by an electrical spectrum analyzer (ESA, Tektronix RSA306, Bandwidth 6.2 GHz, Beaverton, OR, USA).
Many longitudinal modes with the same frequency interval can be generated in the ring cavity, where the beat frequency signal (fN) generated by any two laser modes can be expressed as [16]:
f N = ( p q ) c n L = N c n L , N = 1 , 2 , 3
where p and q are the laser mode numbers, the order N = p − q is the mode number of the BFS, c is the vacuum speed of light, n is the effective refractive index of the fiber, L is the length of the ring cavity. The water absorption of the PI-SMF causes its effective refractive index and length to vary with the relative humidity, which results in a frequency shift of the BFS. Therefore, the RH value can be determined by monitoring the center frequency of the BFS. When the temperature or humidity changes, the frequency shift of the BFS can be expressed as [19]:
Δ f N = N c n L ( Δ L L + Δ n n ) = f N l L ( 1 P e ) ( Δ ε R H + Δ ε T ) f N l L ( α + ξ ) Δ T
where ΔL is the change of L, Δn is the change of n, l is the length of the PI-SMF, Pe is the photo-elastic coefficient, ΔεRH and ΔεT are the applied strains from the hygroscopic longitudinal expansion and thermal longitudinal expansion, respectively, α is the linear thermal expansion coefficient, ξ is the thermo-optic coefficient, ΔT is the change of temperature. Much previous research on the absorption properties of polyimide material has shown that it has good hygroscopic linear expansion characteristics when used as an optical fiber coating [20,21]. The good linear expansion of the polyimide moisture-sensitive material results in a good linear relationship between RH and volume-variation induced strain which will ensure the linear response of the BFSs.
FBGs are well known sensing elements that can be used to measure physical parameters such as temperature, strain or mechanical vibration. The operation principle of the FBG sensing is by monitoring the Bragg center wavelength λB, which is given by:
λ B = 2 n e f f Λ
where neff is the effective index of the fiber core, Λ refers to the spatial period of the FBG. When any external perturbation applied to the FBG causes a change in the refractive index or grating period of the fiber core, the Bragg center wavelength will shift correspondingly, which can be expressed as follows:
Δ λ B = λ B ( 1 P e ) ε + λ B [ ( 1 P e ) α + ξ ] Δ T
where ε is applied strain. Based on the characteristic that the Bragg center wavelength λB is sensitive to temperature change but not to humidity, the bare FBG can be used as the temperature compensation device of this system. With Equations (2) and (4), by tracking the laser beat frequency signal and wavelength, the temperature and RH can be determined according to the following matrix equations:
[ Δ f N Δ λ B ] = [ S T , f N S H , f N S T , B 0 ] [ Δ T Δ R H ]
where ST,fN and ST,B is the temperature sensitivities of the BFS and the laser wavelength, respectively, SH,fN is the humidity sensitivity of the BFS, ΔRH is the change of RH. The ΔT and ΔRH can be obtained from Equation (5), and can be expressed as:
[ Δ T Δ R H ] = [ S T , f N S H , f N S T , B 0 ] 1 [ Δ f N Δ λ B ]

3. Experimental Methods and Calibration Tests

3.1. Optical Spectrum and Frequency Spectrum

Figure 2a shows the optical spectra of the FBG and the fiber ring laser measured with an OSA. The laser wavelength is near 1558.405 nm, which matches the center wavelength of the FBG, and the output signal-to-noise ratio (OSNR) of the laser is 67 dB at a pump power of 200 mW. The 3dB linewidth of the laser (0.071 nm) is significantly narrower compared to the FBG (0.23 nm), which is beneficial for improving the measurement precision and accuracy of wavelength detection. Since the BFS is generated by any two modes in the laser, increasing the pump power to enhance the output spectral intensity will help to generate BFSs with more frequencies and higher SNR. As shown in Figure 2b, the range and intensity of the BFS increases as the pump power rises until it saturates at 200 mW. Therefore, the pump power is fixed at 200 mW in the following sensing experiments, and Figure 2c,d show the BFSs in different frequency ranges under this condition, respectively. From Figure 2c, it can be found that the frequency interval of the BFSs is 0.978 MHz, which corresponds to the total laser cavity length of 209.6 m. According to Figure 2c,d, as the frequency of the BFSs is raised from 2000 MHz to 6000 MHz, the SNR decreases from 35 dB to 20 dB. When the frequency of the BFS is higher than 6000 MHz, the SNR further decreases and does not facilitate signal detection, so it is no longer considered in subsequent studies.

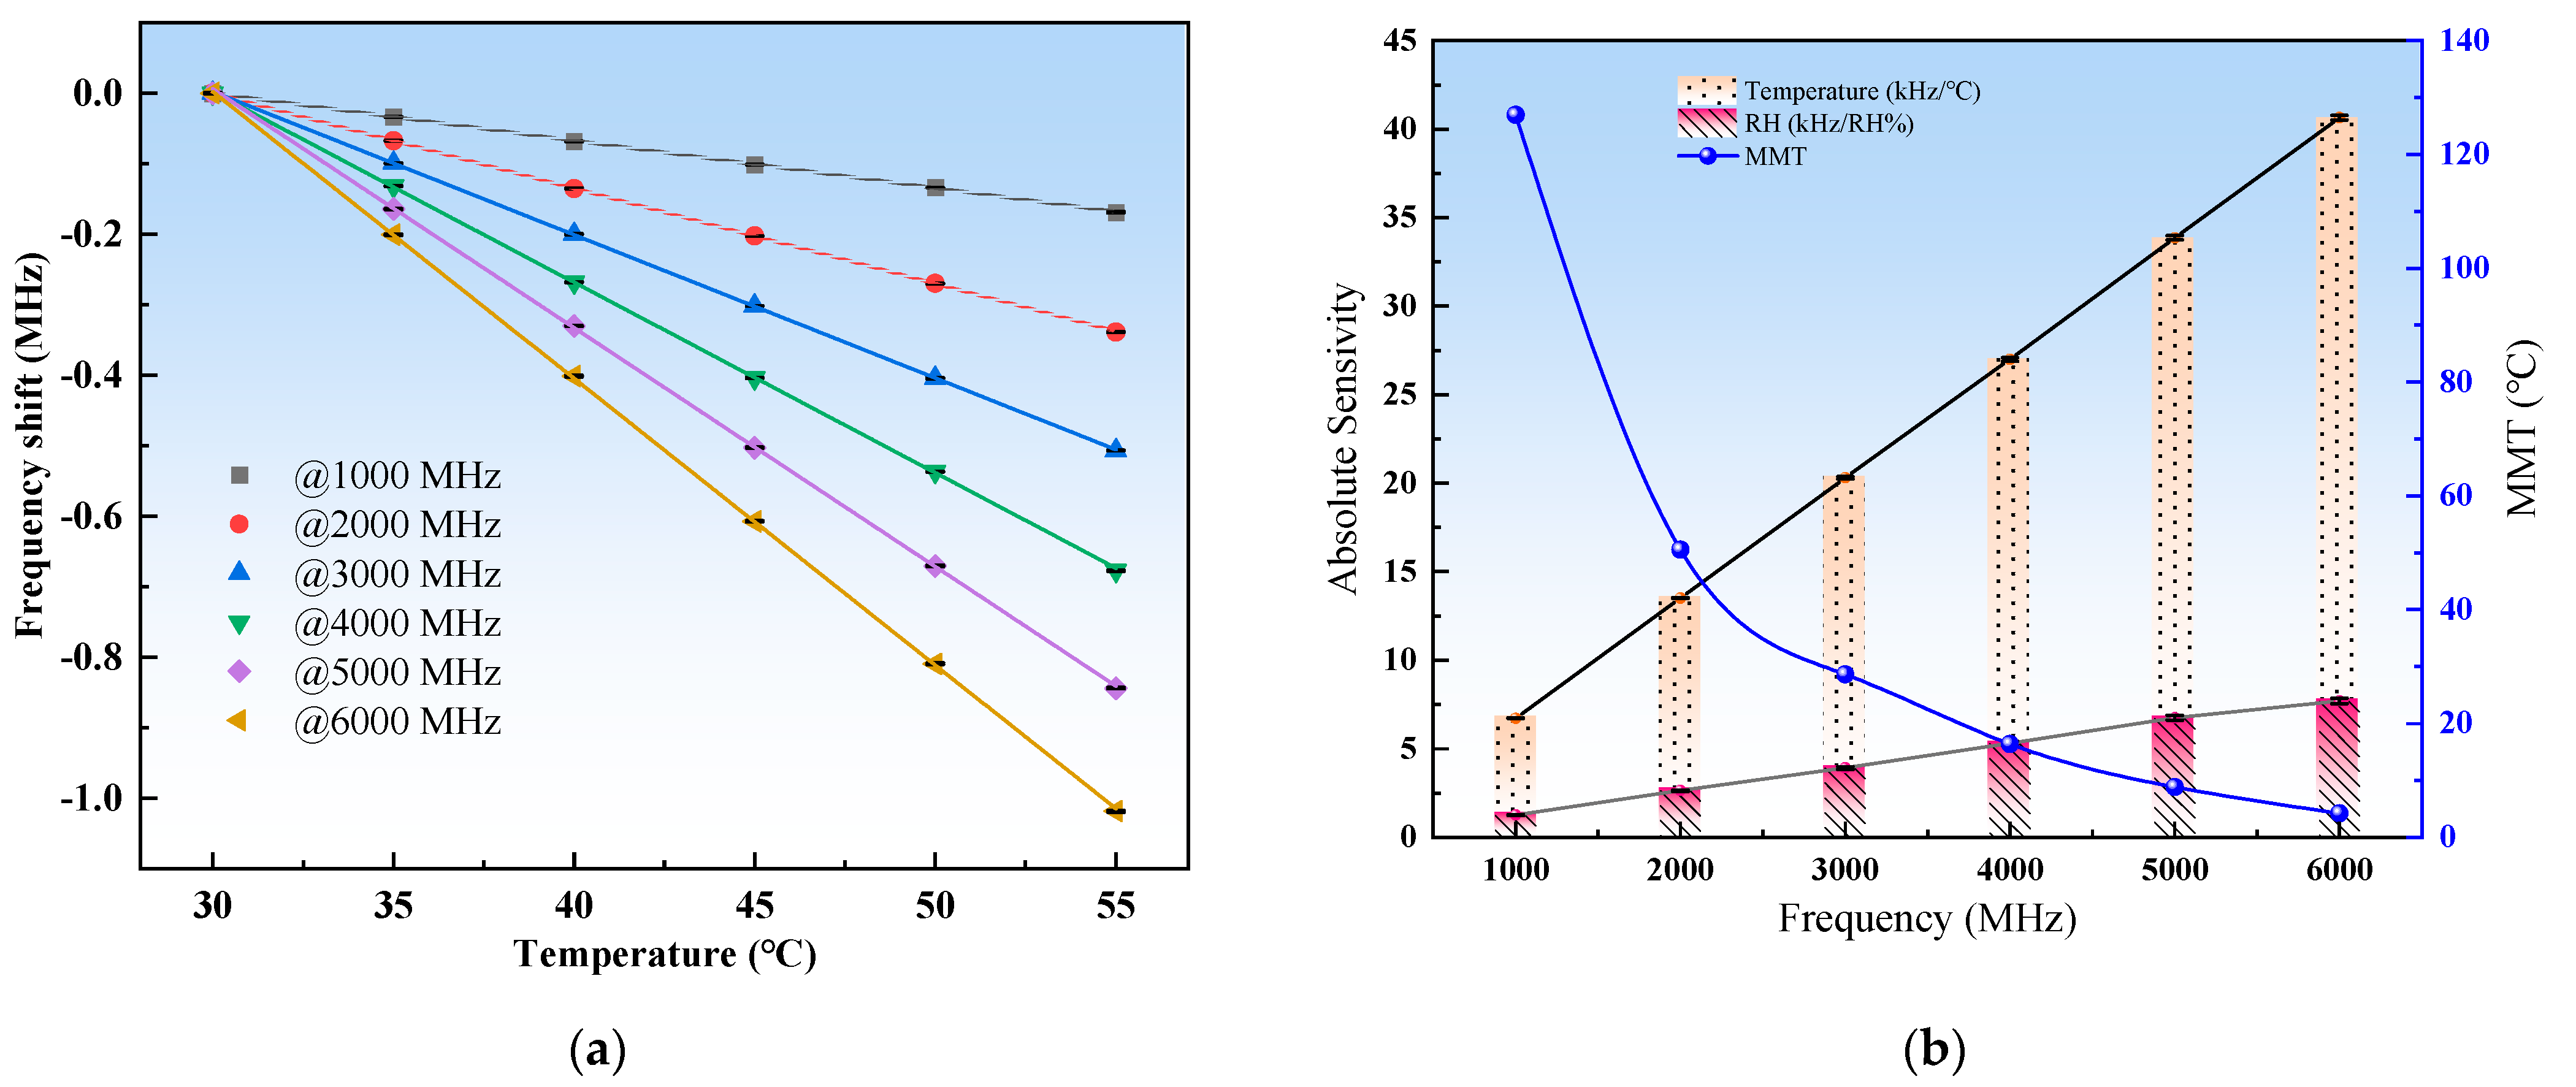
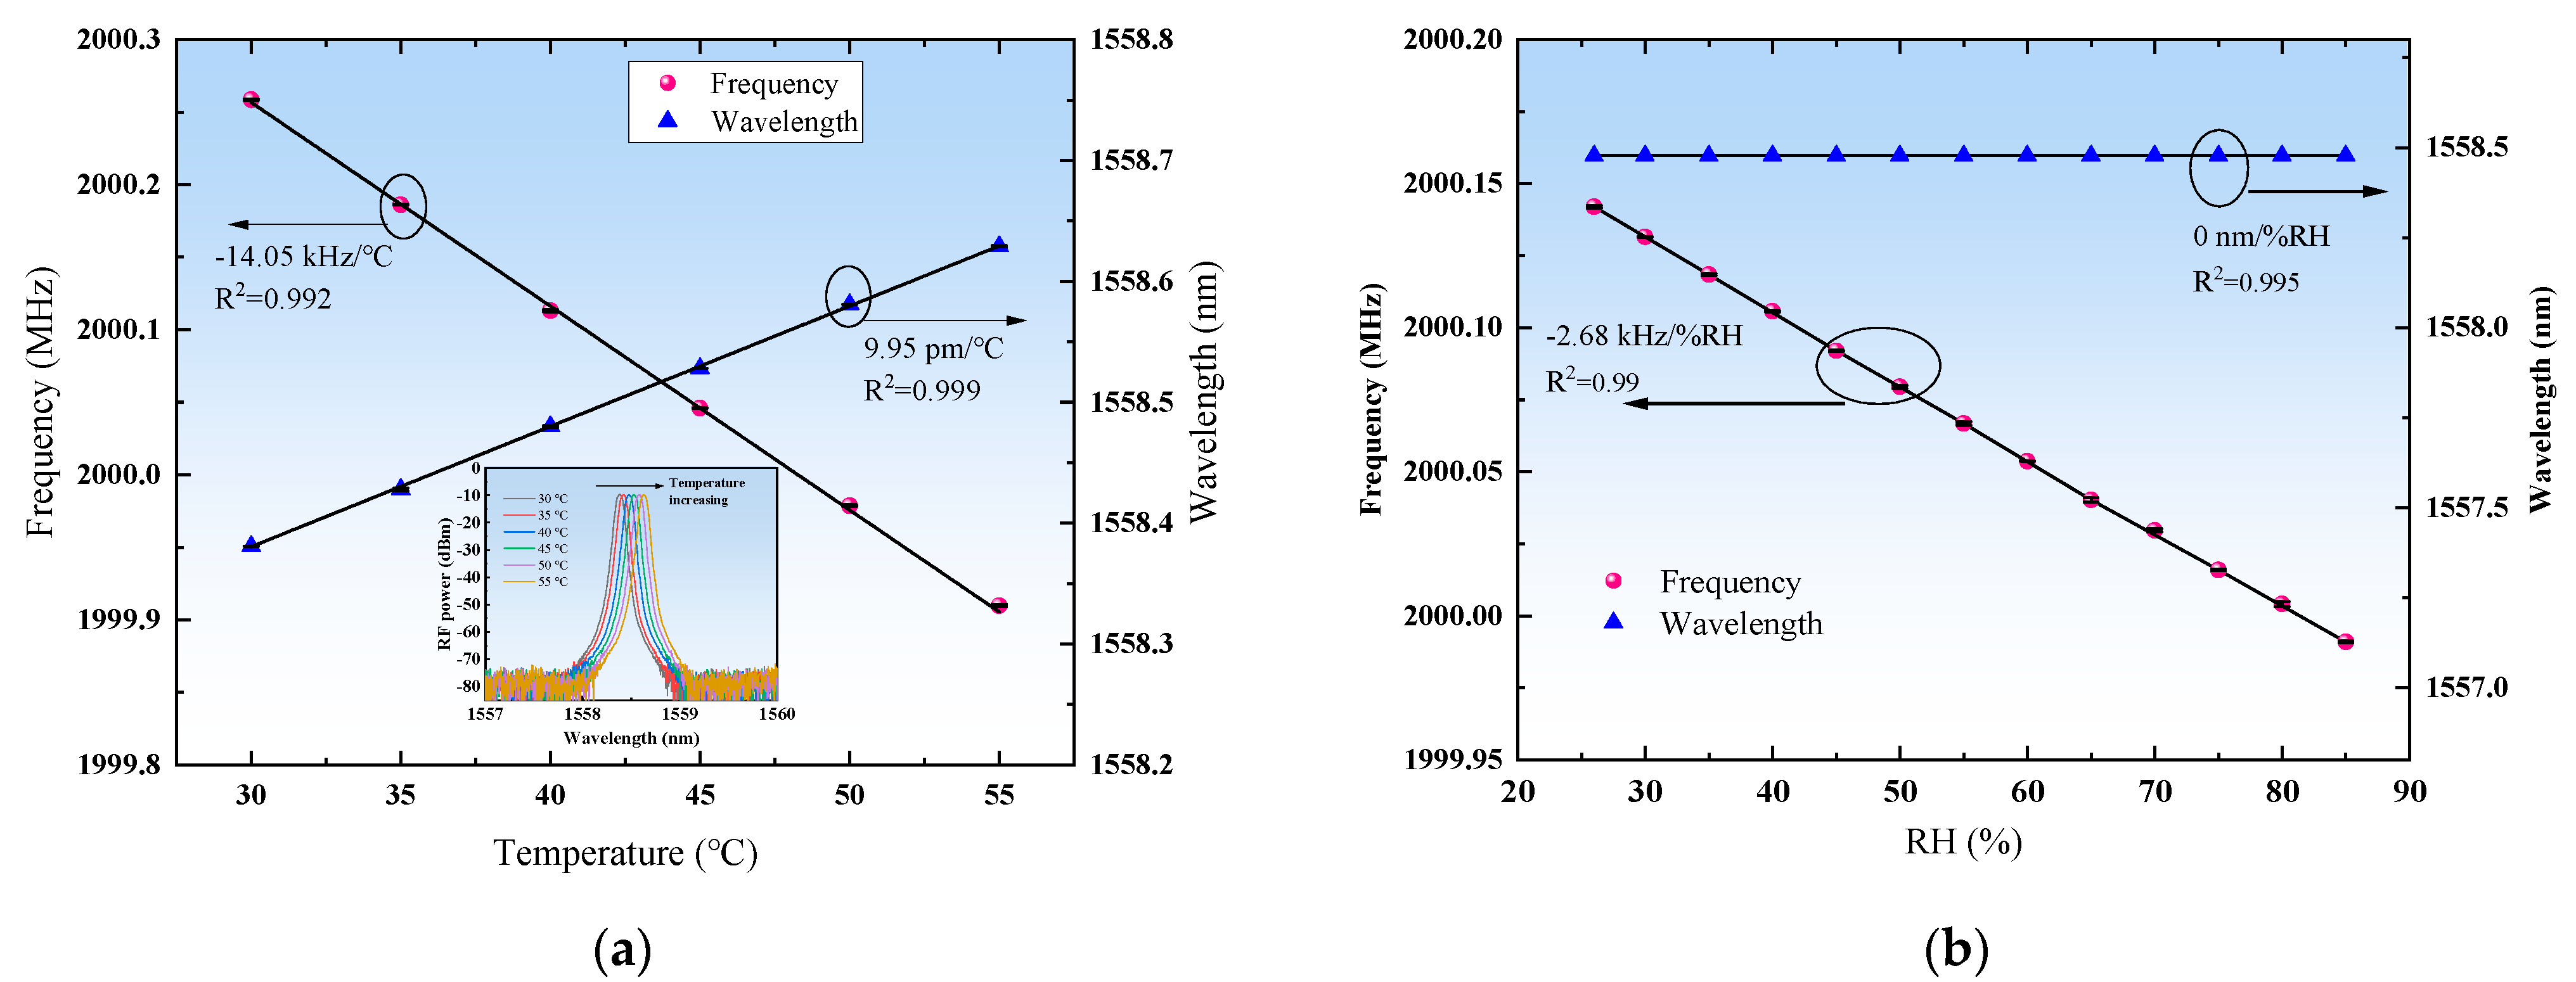
3.2. Experimental Investigation of BFSs Response

To characterize the humidity response of the sensor, the PI-SMF and the bare FBG are placed in the environment chamber and the experimental study is carried out. The fiber section outside the environmental chamber may be affected by environmental changes, resulting in some calibration drifts. Thus, the length (lout) of the fiber section outside the environment chamber is shortened as much as possible to ensure a higher percentage of the fiber under test (FUT, lFUT) in the whole laser cavity (L). From Equation (2), the ratio of their frequency shift response coefficient is 1:6.08, which means that a 5 °C temperature change (for example, temperature drifts between 20–25 °C) in the outside fiber can only cause the sensor to deviate from the measurement by 0.822 °C or even less. Moreover, all outside optical fibers with an outer jacket (isolated from water molecules in the air) are placed in acoustic cotton for thermal insulation and noise reduction, so the influence of the outside optical fibers on the sensors can be avoided. All spectral measurements for each RH are made after 20 min of stabilization and data is recorded using the ESA with the resolution bandwidth (RBW) setting of 50 Hz. Figure 3 includes the measured response of the sensor over a range of 25–85% RH at a constant temperature of 40 °C. Figure 3b,c show the BFS spectrum at 2000 MHz frequency during RH increase and decrease with 10% RH interval, respectively. As RH increases/decreases, the strain guided by water absorption/desorption of the PI-SMF changes, resulting in a drift in the BFS spectrum. The spectrum shifts to the low frequency region when RH increases and shifts to the high frequency region as RH decreases. The measurements for each RH value are repeated three times and the average frequencies of BFSs and their deviations are calculated. A linear curve is applied to the dataset and the frequency of BFS as a function of RH for the RH increasing and decreasing is shown in Figure 3c. The result of the linear fitting shows that the R-square of the linear relationship between the RH increasing and decreasing processes is 0.997, no significant hysteresis phenomenon is found, and the relative humidity sensitivity of the fitted monitored BFS is −2.68 kHz/%RH. From Equation (2), it is expected that the frequency shift corresponding to high-frequency BFSs is larger for the same amount of humidity variation. To verify this point, RH response characteristics of the BFSs at 1000 MHz, 3000 MHz, 4000 MHz, 5000 MHz and 6000 MHz are investigated in the same way. Figure 3d shows the frequency shift as a function of RH for the six selected BFSs. Linear fitting results show that the RH sensitivities of the monitored BFS are −1.25 kHz/%RH, −3.97 kHz/%RH, −5.35 kHz/%RH, −6.79 kHz/%RH, and −8.07 kHz/%RH, respectively. For sensing demodulation, the humidity sensitivity SH,fN of the PI-SMF can be determined based on the selected BFS frequency.
Similarly, the temperature response characteristics of the six selected BFSs are investigated, and the measured frequency response of the BFSs to temperature is shown in Figure 4a. Their sensitivities are −6.72 kHz/°C @1000 MHz, −14.05 kHz/°C @2000 MHz, −20.3 kHz/°C @3000 MHz, −27.02 kHz/°C @4000 MHz, −33.86 kHz/°C @5000 MHz, and −40.65 kHz/°C @6000 MHz, respectively. Although high-frequency BFS has a higher frequency sensitivity, the actual sensing signal should be selected considering the trade-off between sensitivity and test range. Since the frequency interval is fixed, the maximum measurable range of these BFSs is different. The probability of frequency shifts beyond the BFS frequency interval is higher for high frequency BFSs with high sensitivity, resulting in crosstalk between BFSs and therefore a smaller test range. With the priority of ensuring that the BFS can measure a 100% RH change, the maximum measurable temperature (MMT) range of different BFS can be used as a weighing criterion. As shown in Figure 4b, the temperature/humidity sensitivity of the BFSs for different frequencies and the MMT are given. It can be found that the MMT decreases sharply with increasing frequency and sensitivity. Therefore, to ensure that the sensor has as large a temperature/humidity test range and sensitivity as possible, the 2000 MHz BFS is used as the frequency sensing signal. Thus, it can realize 0–100% RH measurement within the temperature variation range of 51 °C.

3.3. Experimental Investigation of Wavelength Response

As shown in Figure 5, the response of the sensor’s BFS and wavelength to temperature/RH are obtained from the calibration experiments, respectively. The RH of the environmental chamber is set to be fixed at 35% RH, and the temperature is increased from 30 °C to 55 °C with 5 °C interval. The inset of Figure 5a shows the variation of the laser output spectrum with increasing temperature. The responses of the sensing signal frequency and wavelength to temperature are given in Figure 5a, with temperature sensitivities of −14.05 kHz/°C and 9.95 pm/°C, respectively. Figure 5b illustrates the response of the sensing signal frequency and wavelength to RH, where RH varies between 25% and 85% and the temperature is fixed at 40 °C. The RH sensitivities of them are −2.68 kHz/%RH and 0 nm/%RH, respectively.
Hence, by bringing the sensitivity coefficients obtained from the above experimental results into Equation (6), the RH and temperature measurement matrix can be expressed as:
[ Δ T Δ R H ] = [ 14.05 kHz / 9.95 pm / 2.68 kHz / % RH 0 ] 1 [ Δ f N Δ λ B ] = [ 0 0.101 0.373 0.527 ] [ Δ f N Δ λ B ]
Therefore, the values of RH and temperature changes can be obtained by bringing the measured BFS shift (ΔfN, expressed in units of kHz) and the wavelength variation (ΔλB, expressed in units of pm) into the above equation.

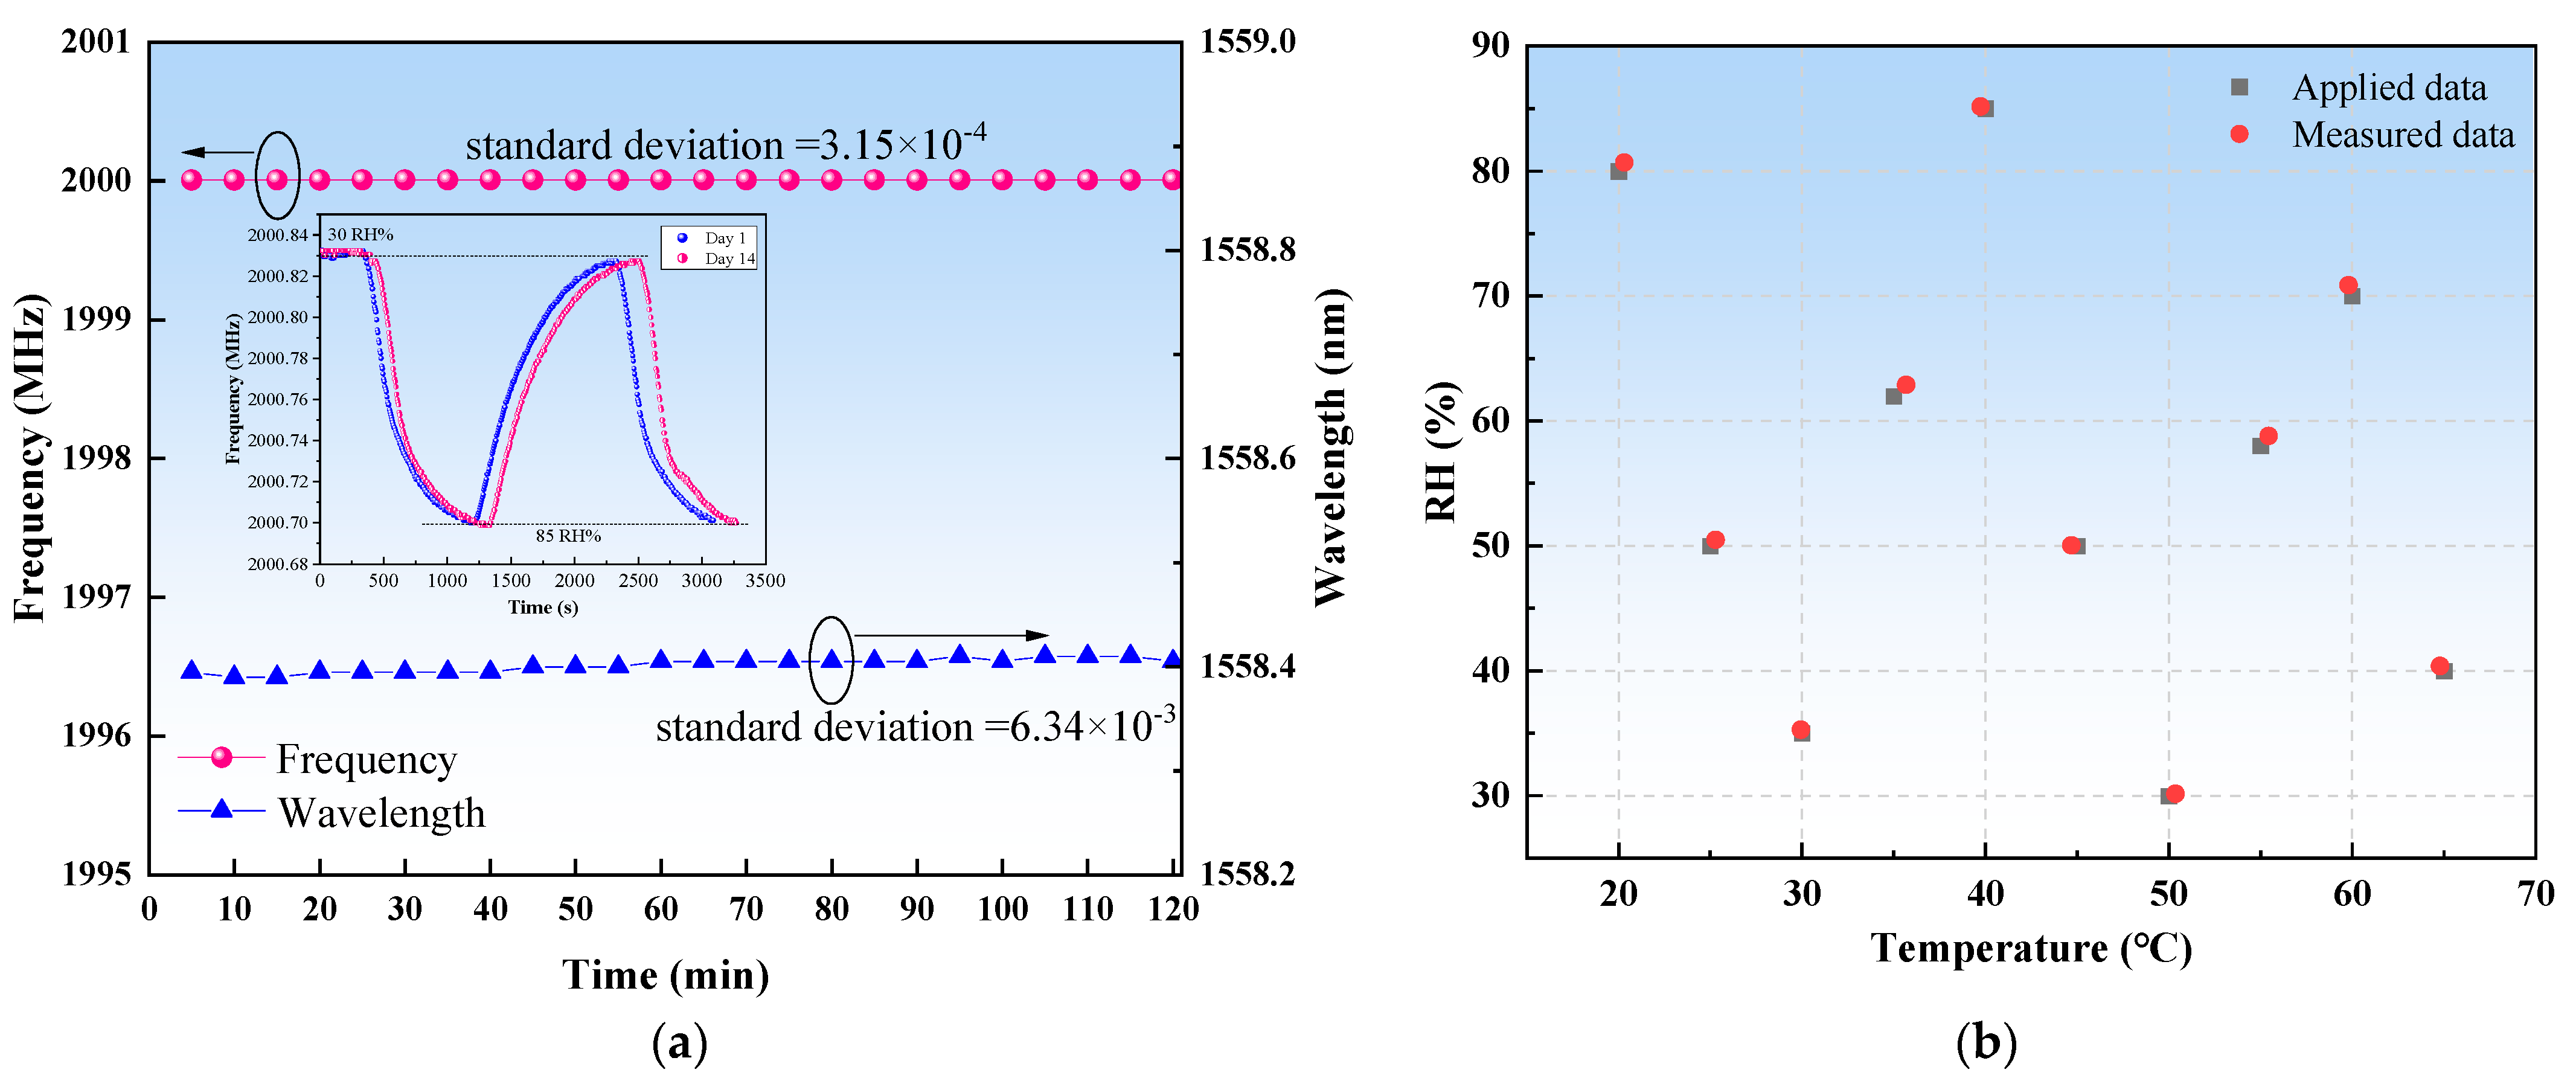
4. Experiment Results and Discussion

To demonstrate the stability of the proposed sensor, the frequency and wavelength of the sensed signal are measured every 5 min for 2 h with constant temperature and RH. The output response of the sensor as a function of time is shown in Figure 6a. Frequency and wavelength are quite stable during the test period, with the maximum deviations of ±0.93 kHz and ±10.46 pm, respectively. Based on the stability test results and Equation (6), the estimated maximum errors for simultaneous RH and temperature measurements are ±0.35 %RH and ±1.11 °C, respectively. The inset of Figure 6a shows the cyclic response (30–85% RH) curve of the BFS frequency as a function of time on the first day and after 14 days. During the test process, the frequency offset can be recovered to its initial value with a maximum deviation of ±3 kHz, demonstrating the long-term stability and reliability of the sensor. In addition, to evaluate the discriminative measurement capability of the proposed sensor, temperature and RH applied to the sensor are changed by adjusting the environmental chamber. Firstly, the temperature and RH are set to 40°C and 85% RH as the initial state, in which the corresponding initial sensing signal frequency and wavelength are 2000.0071 MHz and 1558.462 nm, respectively. Then the temperature is varied from 20 °C to 65 °C and the RH is also varied randomly between 30% RH and 85% RH. The temperature and RH values for each test point are obtained by bringing the recorded ΔfN and ΔλB into Equation (7). Figure 6b illustrates the comparison between the applied and measured parameters. The maximum experimental errors for RH and temperature are within ±0.67 %RH and ±0.79 °C over the test range. The main cause of the error is the poor wavelength detection accuracy due to the limited spectral resolution of the OSA and the relatively broad 3dB linewidth of the laser output spectrum. The experimental error is close to the estimated error, demonstrating the ability of the proposed sensor to measure temperature and RH simultaneously with a small error.
Moreover, the sensing performance of the laser sensor is compared with other RH sensors with temperature compensation, as shown in Table 1. It can be found that the proposed sensor does not require complex structure and hygroscopic material coating process, which has the advantage of simple structure and high mechanical strength. In addition, compared to intensity or wavelength demodulation, the high SNR and the narrow linewidth of the beat frequency signal guarantee the sensor a much smaller humidity measurement error.

5. Conclusions

In conclusion, a fiber laser sensor for low-error relative humidity measurement using PI-SMF and a bare FBG is reported. The PI-SMF is utilized as the RH sensing element while the bare FBG is used for temperature compensation. There are a number of beat frequency signals in the laser cavity, which are shifted with the variation of the sensing probe PI-SMF in the cavity. Thus, low-error RH measurement can be achieved by monitoring the beat frequency signal of the laser and the center wavelength of the thermo-compensated FBG. In this experiment, six beat frequency signals are selected, and the humidity sensitivities obtained are −1.25 kHz/%RH @1000 MHz, −2.68 kHz/%RH @2000 MHz, −3.97 kHz/%RH @3000 MHz, −5.35 kHz/%RH @4000 MHz, −6.79 kHz/%RH @5000 MHz, and −8.07 kHz/%RH @6000 MHz, respectively. After comprehensive consideration, the 2000 MHz BFS is confirmed as the beat sensing signal. The experiments show that the temperature sensitivities of the BFS @2000MHz and wavelength are −14.05 kHz/°C and 9.95 pm/°C, and the humidity sensitivities are −2.68 kHz/%RH and 0 nm/%RH, with maximum experimental measurement errors of ±0.67 %RH and ±0.79 °C. The use of bare FBG in this paper aims to confirm the feasibility of the sensing scheme. In practical applications, an all-metal encapsulated FBG realized by placing the FBG into a metal capillary and potting it with a modified epoxy adhesive can replace the bare FBG. In this way, the encapsulated FBG and the bare FBG have the same role in the sensing scheme and better long-term stability. Low error RH measurements with temperature compensation can be achieved by recalibrating the sensing sensitivity of the encapsulated FBG before the sensing application. The proposed laser sensor system is compact, low-cost and suitable for food storage, smart industry, modern agriculture, environmental monitoring and other applications.

Author Contributions

Conceptualization, Y.X. and S.M.; methodology, Y.X.; software, S.M.; validation, Y.X. and S.M.; formal analysis, Y.X.; investigation, Y.X., S.M. and Q.J.; resources, Y.X.; data curation, Y.X., S.M.; writing—original draft preparation, S.M.; writing—review and editing, Y.X. and S.M.; visualization, Y.X. and S.M.; supervision, Y.X., X.Z., Z.Q., Z.L.; project administration, Y.X.; funding acquisition, Y.X. All authors have read and agreed to the published version of the manuscript.

Funding

This research was funded by National Natural Science Foundation of China (62105180), Taishan Scholar Foundation of Shandong Province (tsqn202211027), Qilu Young Scholar Program of Shandong University, the National Grant Program for High-level Returning Oversea Talents (2023), Shandong Higher School Youth Innovation Team Technology Program (2022KJ024) and Natural Science Foundation of Shandong Province (ZR2020MF110, ZR2020MF118).

Institutional Review Board Statement

Not applicable.

Informed Consent Statement

Not applicable.

Data Availability Statement

Data underlying the results presented in this paper are not publicly available at this time but may be obtained from the authors upon reasonable request.

Conflicts of Interest

The authors declare no conflict of interest.

References

  1. Farahani, H.; Wagiran, R.; Hamidon, M. Humidity Sensors Principle, Mechanism, and Fabrication Technologies: A Comprehensive Review. Sensors 2014, 14, 7881–7939. [Google Scholar] [CrossRef] [PubMed]
  2. Sikarwar, S.; Yadav, B.C. Opto-Electronic Humidity Sensor: A Review. Sens. Actuators A Phys. 2015, 233, 54–70. [Google Scholar] [CrossRef]
  3. Wang, Y.; Li, J.; Guo, L.-N.; Tian, M.; Meng, F. Development of Fabrication Technique and Sensing Performance of Optical Fiber Humidity Sensors in the Most Recent Decade. Measurement 2023, 215, 112888. [Google Scholar] [CrossRef]
  4. Luo, Y.; Chen, C.; Xia, K.; Peng, S.; Guan, H.; Tang, J.; Lu, H.; Yu, J.; Zhang, J.; Xiao, Y.; et al. Tungsten Disulfide (WS_2) Based All-Fiber-Optic Humidity Sensor. Opt. Express 2016, 24, 8956. [Google Scholar] [CrossRef] [PubMed]
  5. Guo, J.-Y.; Shi, B.; Sun, M.-Y.; Zhang, C.-C.; Wei, G.-Q.; Liu, J. Characterization of an ORMOCER®-Coated FBG Sensor for Relative Humidity Sensing. Measurement 2021, 171, 108851. [Google Scholar] [CrossRef]
  6. Wang, Y.; Huang, Q.; Zhu, W.; Yang, M. Simultaneous Measurement of Temperature and Relative Humidity Based on FBG and FP Interferometer. IEEE Photon. Technol. Lett. 2018, 30, 833–836. [Google Scholar] [CrossRef]
  7. Hromadka, J.; Mohd Hazlan, N.N.; Hernandez, F.U.; Correia, R.; Norris, A.; Morgan, S.P.; Korposh, S. Simultaneous in Situ Temperature and Relative Humidity Monitoring in Mechanical Ventilators Using an Array of Functionalised Optical Fibre Long Period Grating Sensors. Sens. Actuators B Chem. 2019, 286, 306–314. [Google Scholar] [CrossRef]
  8. Bai, Y.; Miao, Y.; Zhang, H.; Yao, J. Simultaneous Measurement of Temperature and Relative Humidity Based on a Microfiber Sagnac Loop and MoS2. J. Light. Technol. 2020, 38, 840–845. [Google Scholar] [CrossRef]
  9. Liu, D.; Cai, Z.; Li, B.; Zou, M.; Zhang, L.; Hua, Y.; Mai, J.; Zhao, C.; Liao, C.; He, J.; et al. Simultaneous Measurement of Humidity and Temperature Based on Fiber-Tip Microcantilever Cascaded with Fiber Bragg Grating. Opt. Express 2023, 31, 8738. [Google Scholar] [CrossRef]
  10. Liao, J.; Qavi, A.; Adolphson, M.; Yang, L. High-Q WGM Resonators Encapsulated in PDMS for Highly Sensitive Displacement Detection. J. Light. Technol. 2022, 41, 2862–2869. [Google Scholar] [CrossRef]
  11. Cheng, T.; Li, B.; Zhang, F.; Chen, J.; Zhang, Q.; Yan, X.; Zhang, X.; Suzuki, T.; Ohishi, Y.; Wang, F. A Surface Plasmon Resonance Optical Fiber Sensor for Simultaneous Measurement of Relative Humidity and Temperature. IEEE Sens. J. 2022, 22, 3246–3253. [Google Scholar] [CrossRef]
  12. Yan, J.; Wang, D.N.; Ge, Y.; Guo, Y.; Xu, B. A Humidity Sensor Based on a Whispering-Gallery-Mode Resonator With an L-Shaped Open Microcavity. J. Light. Technol. 2022, 40, 2651–2656. [Google Scholar] [CrossRef]
  13. Wu, X.; Gao, F.; Jin, F.; Wang, D.N.; Wang, Y.; Chen, Q.; Yang, H.; Gong, H.; Wang, Z.; Zhao, C.; et al. Optical Fiber Humidity Sensor with C60-THAM as Molecule Receptors. Sens. Actuators B Chem. 2022, 370, 132344. [Google Scholar] [CrossRef]
  14. Cheng, X.; Hu, J.; Zhu, K.; Zhao, Z. High-Resolution Polymer Optical Fibre Humidity Sensor Utilizing Single-Passband Microwave Photonic Filter. Measurement 2021, 179, 109462. [Google Scholar] [CrossRef]
  15. Xu, Y.; Zhao, X.; Li, Y.; Qin, Z.; Pang, Y.; Liu, Z. Simultaneous Measurement of Relative Humidity and Temperature Based on Forward Brillouin Scattering in Polyimide-Overlaid Fiber. Sens. Actuators B 2021, 348, 130702. [Google Scholar] [CrossRef]
  16. Gao, L.; Huang, L.; Chen, L.; Chen, X. Study on Fiber Ring Laser in Sensing Application with Beat Frequency Demodulation. Opt. Laser Technol. 2013, 45, 137–141. [Google Scholar] [CrossRef]
  17. Yin, Z.; Gao, L.; Liu, S.; Zhang, L.; Wu, F.; Chen, L.; Chen, X. Fiber Ring Laser Sensor for Temperature Measurement. J. Light. Technol. 2010, 28, 3403–3408. [Google Scholar] [CrossRef]
  18. Liu, S.; Yin, Z.; Zhang, L.; Gao, L.; Chen, X.; Cheng, J. Multilongitudinal Mode Fiber Laser for Strain Measurement. Opt. Lett. 2010, 35, 835. [Google Scholar] [CrossRef]
  19. Qin, Z.; Qu, S.; Wang, Z.; Yang, W.; Li, S.; Liu, Z.; Xu, Y. A Fully Distributed Fiber Optic Sensor for Simultaneous Relative Humidity and Temperature Measurement with Polyimide-Coated Polarization Maintaining Fiber. Sens. Actuators B Chem. 2022, 373, 132699. [Google Scholar] [CrossRef]
  20. Kronenberg, P.; Rastogi, P.K.; Giaccari, P.; Limberger, H.G. Relative Humidity Sensor with Optical Fiber Bragg Gratings. Opt. Lett. 2002, 27, 1385. [Google Scholar] [CrossRef]
  21. Huang, X.F.; Sheng, D.R.; Cen, K.F.; Zhou, H. Low-Cost Relative Humidity Sensor Based on Thermoplastic Polyimide-Coated Fiber Bragg Grating. Sens. Actuators B Chem. 2007, 127, 518–524. [Google Scholar] [CrossRef]
Figure 1. Experimental setup for RH measurement with temperature compensation. (WDM: wavelength division multiplexer, EDF: erbium-doped fiber, ISO: isolator, CIR: circulator, PI-SMF: polyimide-coated single-mode fiber, FBG: fiber Bragg grating, OC: optical coupler (OC1: 2 × 2 90:10, OC2: 2 × 2 50:50), OSA: optical spectrum analyzer, PD: photodetector, ESA: electrical spectrum analyzer.).
Photonics 11 00484 g001
Figure 2. (a) The wavelength spectra of the bare FBG and the proposed fiber ring laser; (b) Beat frequency spectra with the Pump power from 0 to 280 mW; Frequency spectrum of the proposed laser in the range of (c) 1997 to 2003 MHz; (d) 5900 to 6000 MHz.
Photonics 11 00484 g002
Figure 3. (a) The recorded BFS spectra during a process of increasing RH at 40 °C; (b) The recorded BFS spectra during a process of decreasing RH at 40 °C; (c) The frequency of the BFS as a function of RH during processes of increasing and decreasing RH; (d) The frequency shifts of the six selected BFSs as a function of RH.
Photonics 11 00484 g003
Figure 4. (a) The frequency shifts of the six selected BFSs as a function of Temperature; (b) Measured absolute sensitivities and theoretical MMT of sensing signals.
Photonics 11 00484 g004
Figure 5. Temperature and RH responses of the 2000 MHz BFS and Bragg wavelength: (a) The linear fitting of temperature testing results (inset: measured laser output spectra with increasing temperature); (b) The linear fitting of RH testing results.
Photonics 11 00484 g005
Figure 6. (a) stability test results of the sensor: The frequency and wavelength of the sensing signal are recorded every 5 min for 2 h (inset: humidity cycling (30–85% RH) response test results of the same sensing element on the first day and after 14 day); (b) Comparison of measured and applied values of RH and temperature when RH and temperature are changed simultaneously (red circles: measured values, black square: applied values).
Photonics 11 00484 g006
Table 1. Performance comparison of different RH measurement methods.
StructureRH
Sensitivity
Temperature
Sensitivity
RH
Error
Fabrication simplicityRef.
Cascaded structure of FBG and FPI22.07 pm/%RH11.48 pm/°C3.88 %RHMedium[7]
9.98 pm/°C
Fiber-tip microcantilever cascading FBG348 pm/%RH−356 pm/°C2.3 %RHLow[9]
12 pm/°C
SI based Microfiber176.6 pm/%RH−123.5 pm/°CNot
available
Low[8]
−0.017 dB/%RH−0.079 dB/°C
SPR based on No-core fiber−2.932 nm/%RH
(50–65 %RH)
−2.213 nm/°CNot
available
Low[11]
−2.932 nm/%RH
(65–70 %RH)
FBS in the PI-SMF6.32 kHz/%RH−20.99 kHz/°C1.027 %RHHigh[15]
2.56 kHz/%RH11.33 kHz/°C
PI-SMF and FBG−2.68 kHz/%RH−14.05 kHz/°C0.67 %RHHighThis work
9.95 pm/°C
FPI: Fabry-Perot interferometer; SI: Sagnac Interferometer; SPR: Surface plasmon resonance.
Disclaimer/Publisher’s Note: The statements, opinions and data contained in all publications are solely those of the individual author(s) and contributor(s) and not of MDPI and/or the editor(s). MDPI and/or the editor(s) disclaim responsibility for any injury to people or property resulting from any ideas, methods, instructions or products referred to in the content.

