The Optimization of Microwave Field Characteristics for ODMR Measurement of Nitrogen-Vacancy Centers in Diamond


Abstract
1. Introduction
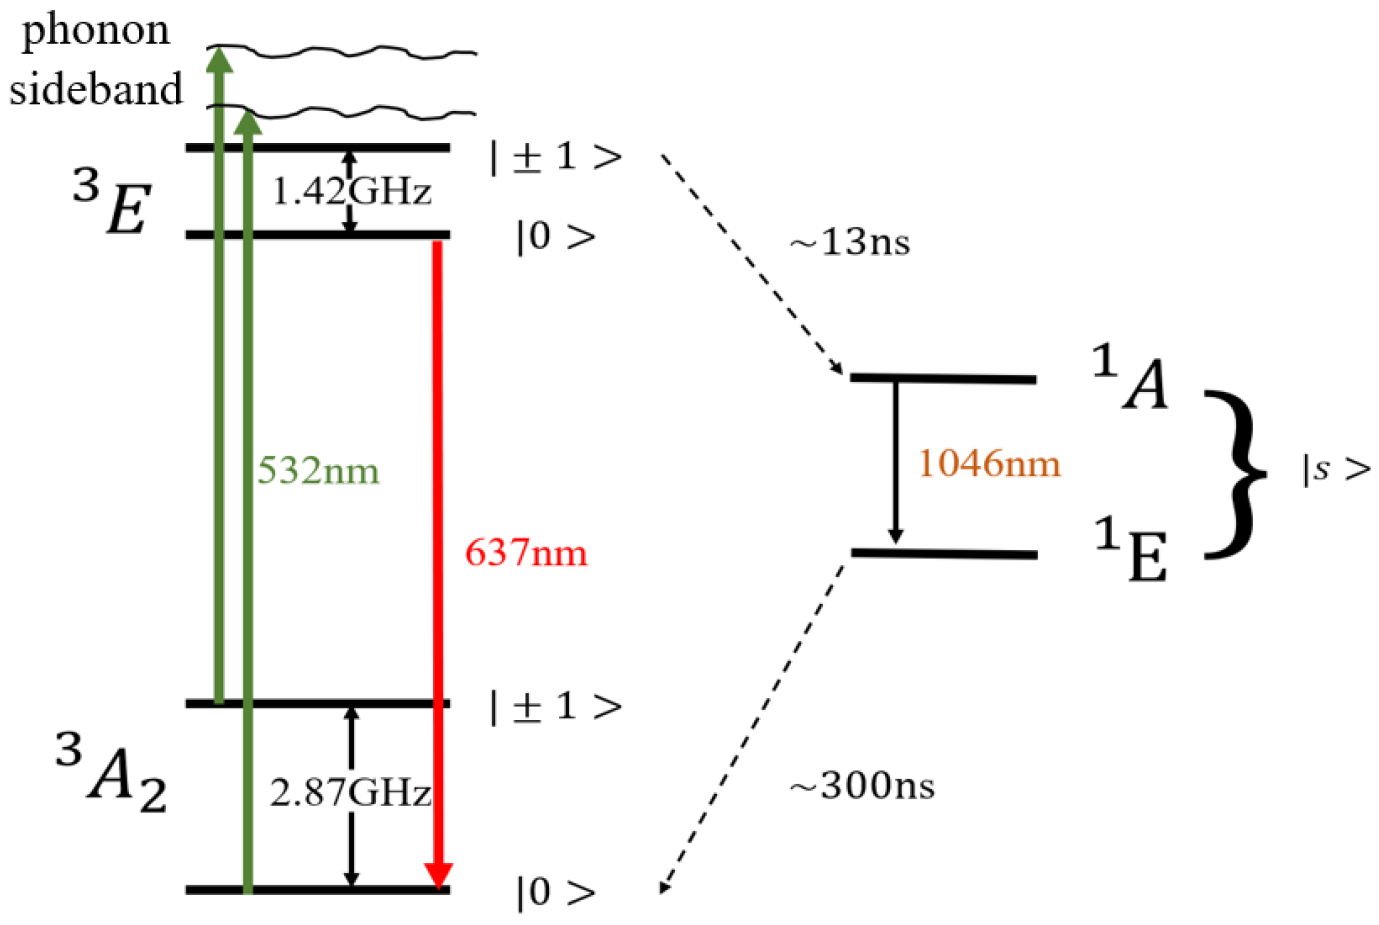
2. The Fundamental Principles
3. Simulation and Optimization of Irregular Antennas
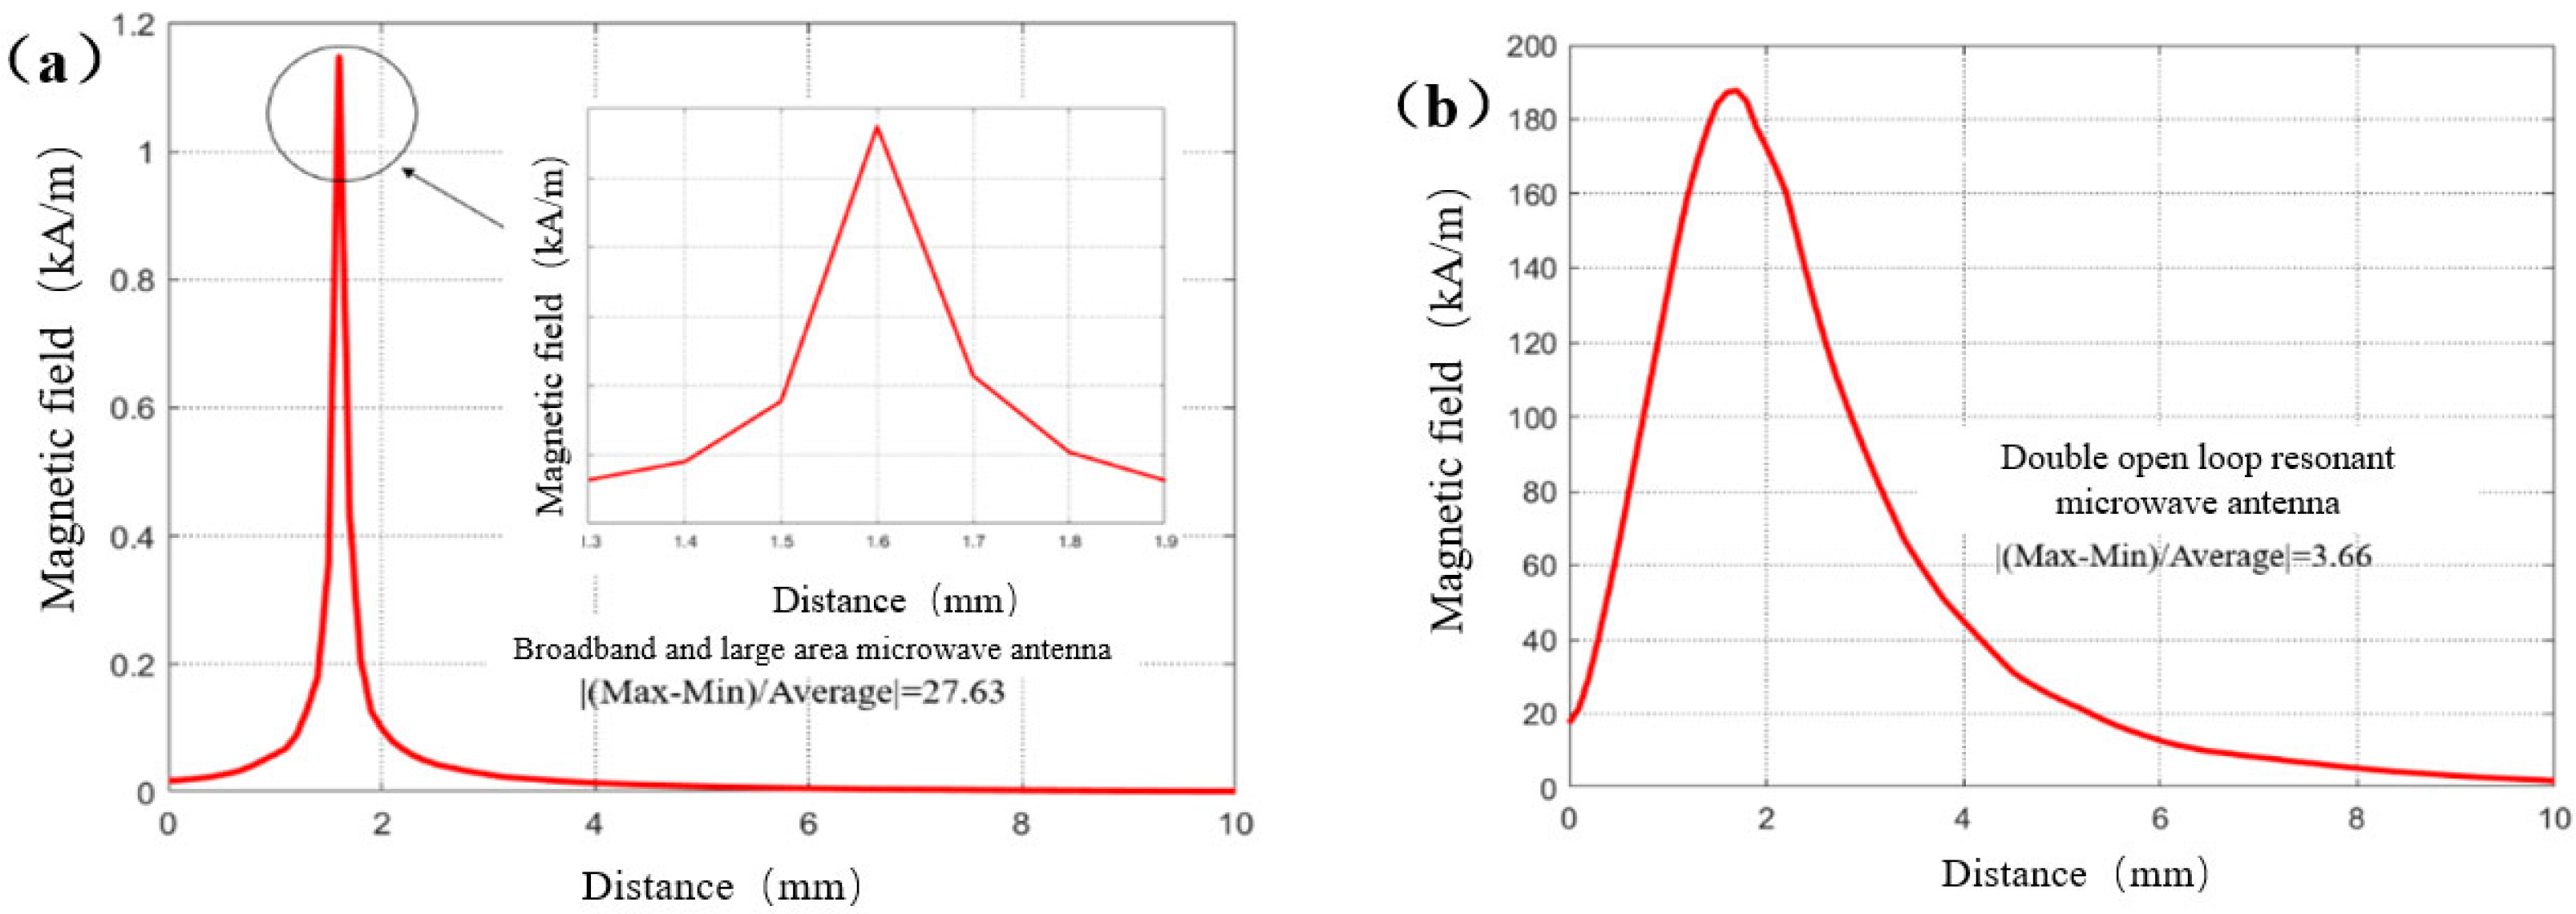
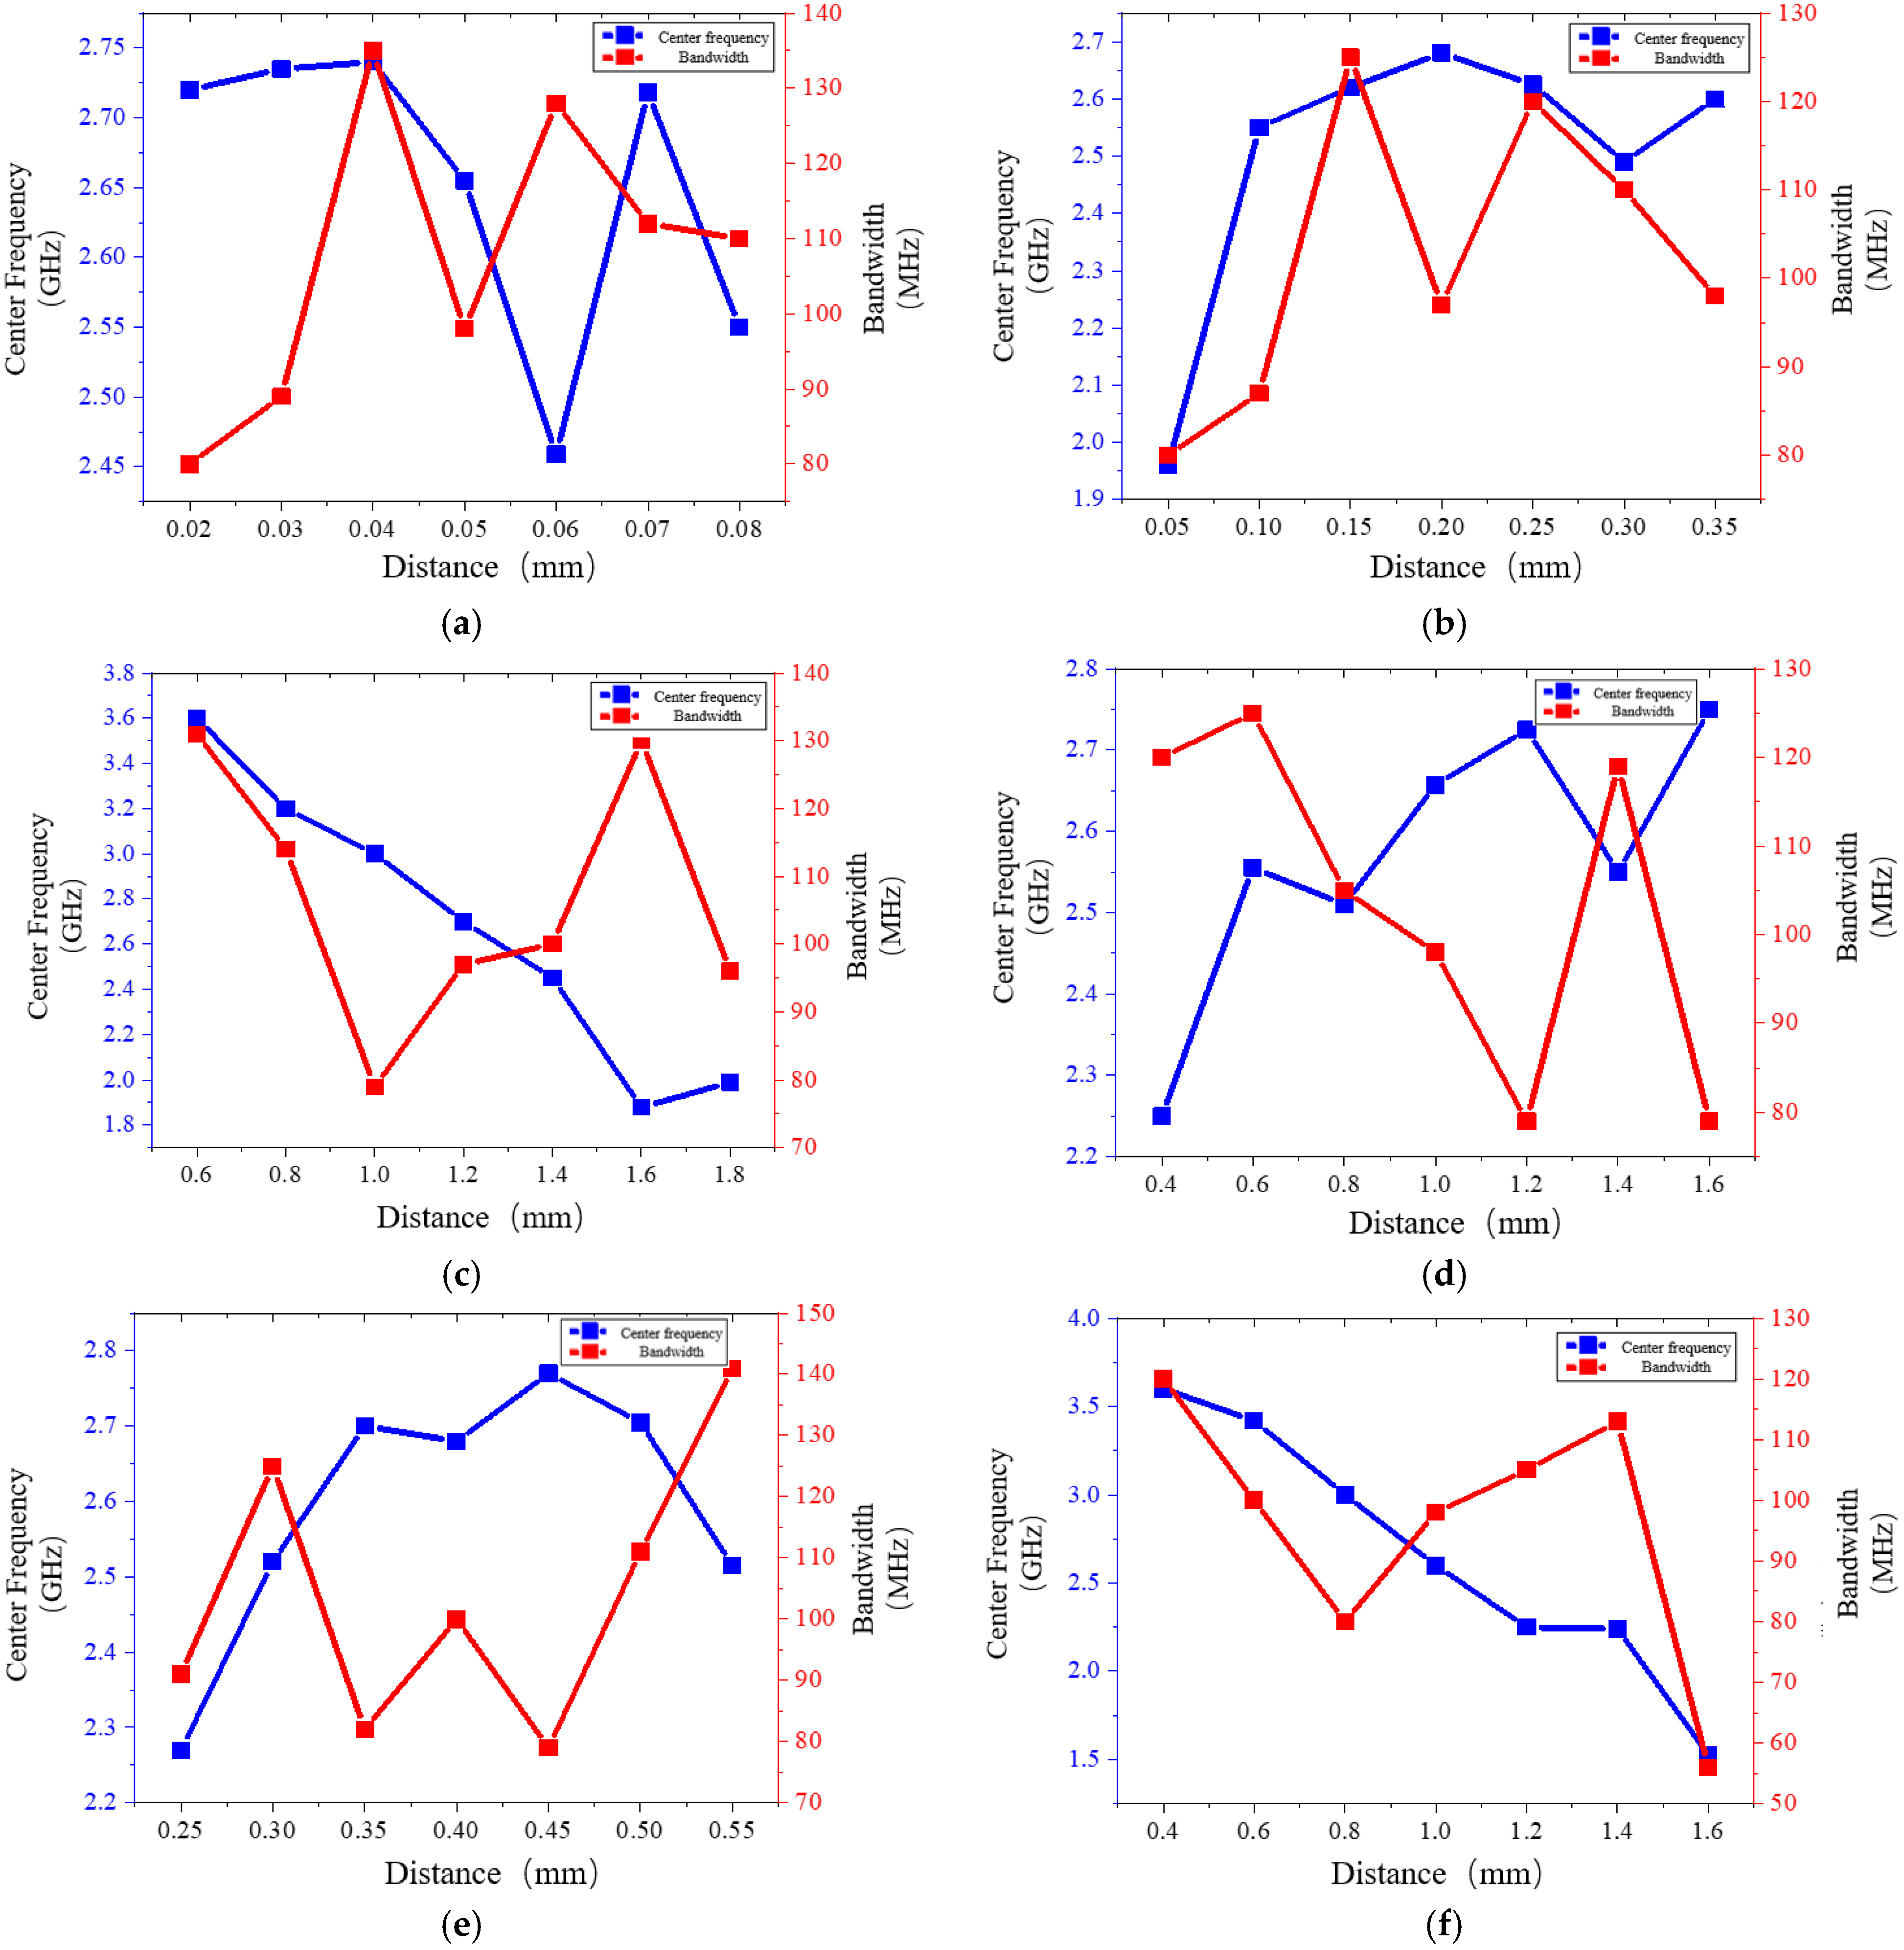
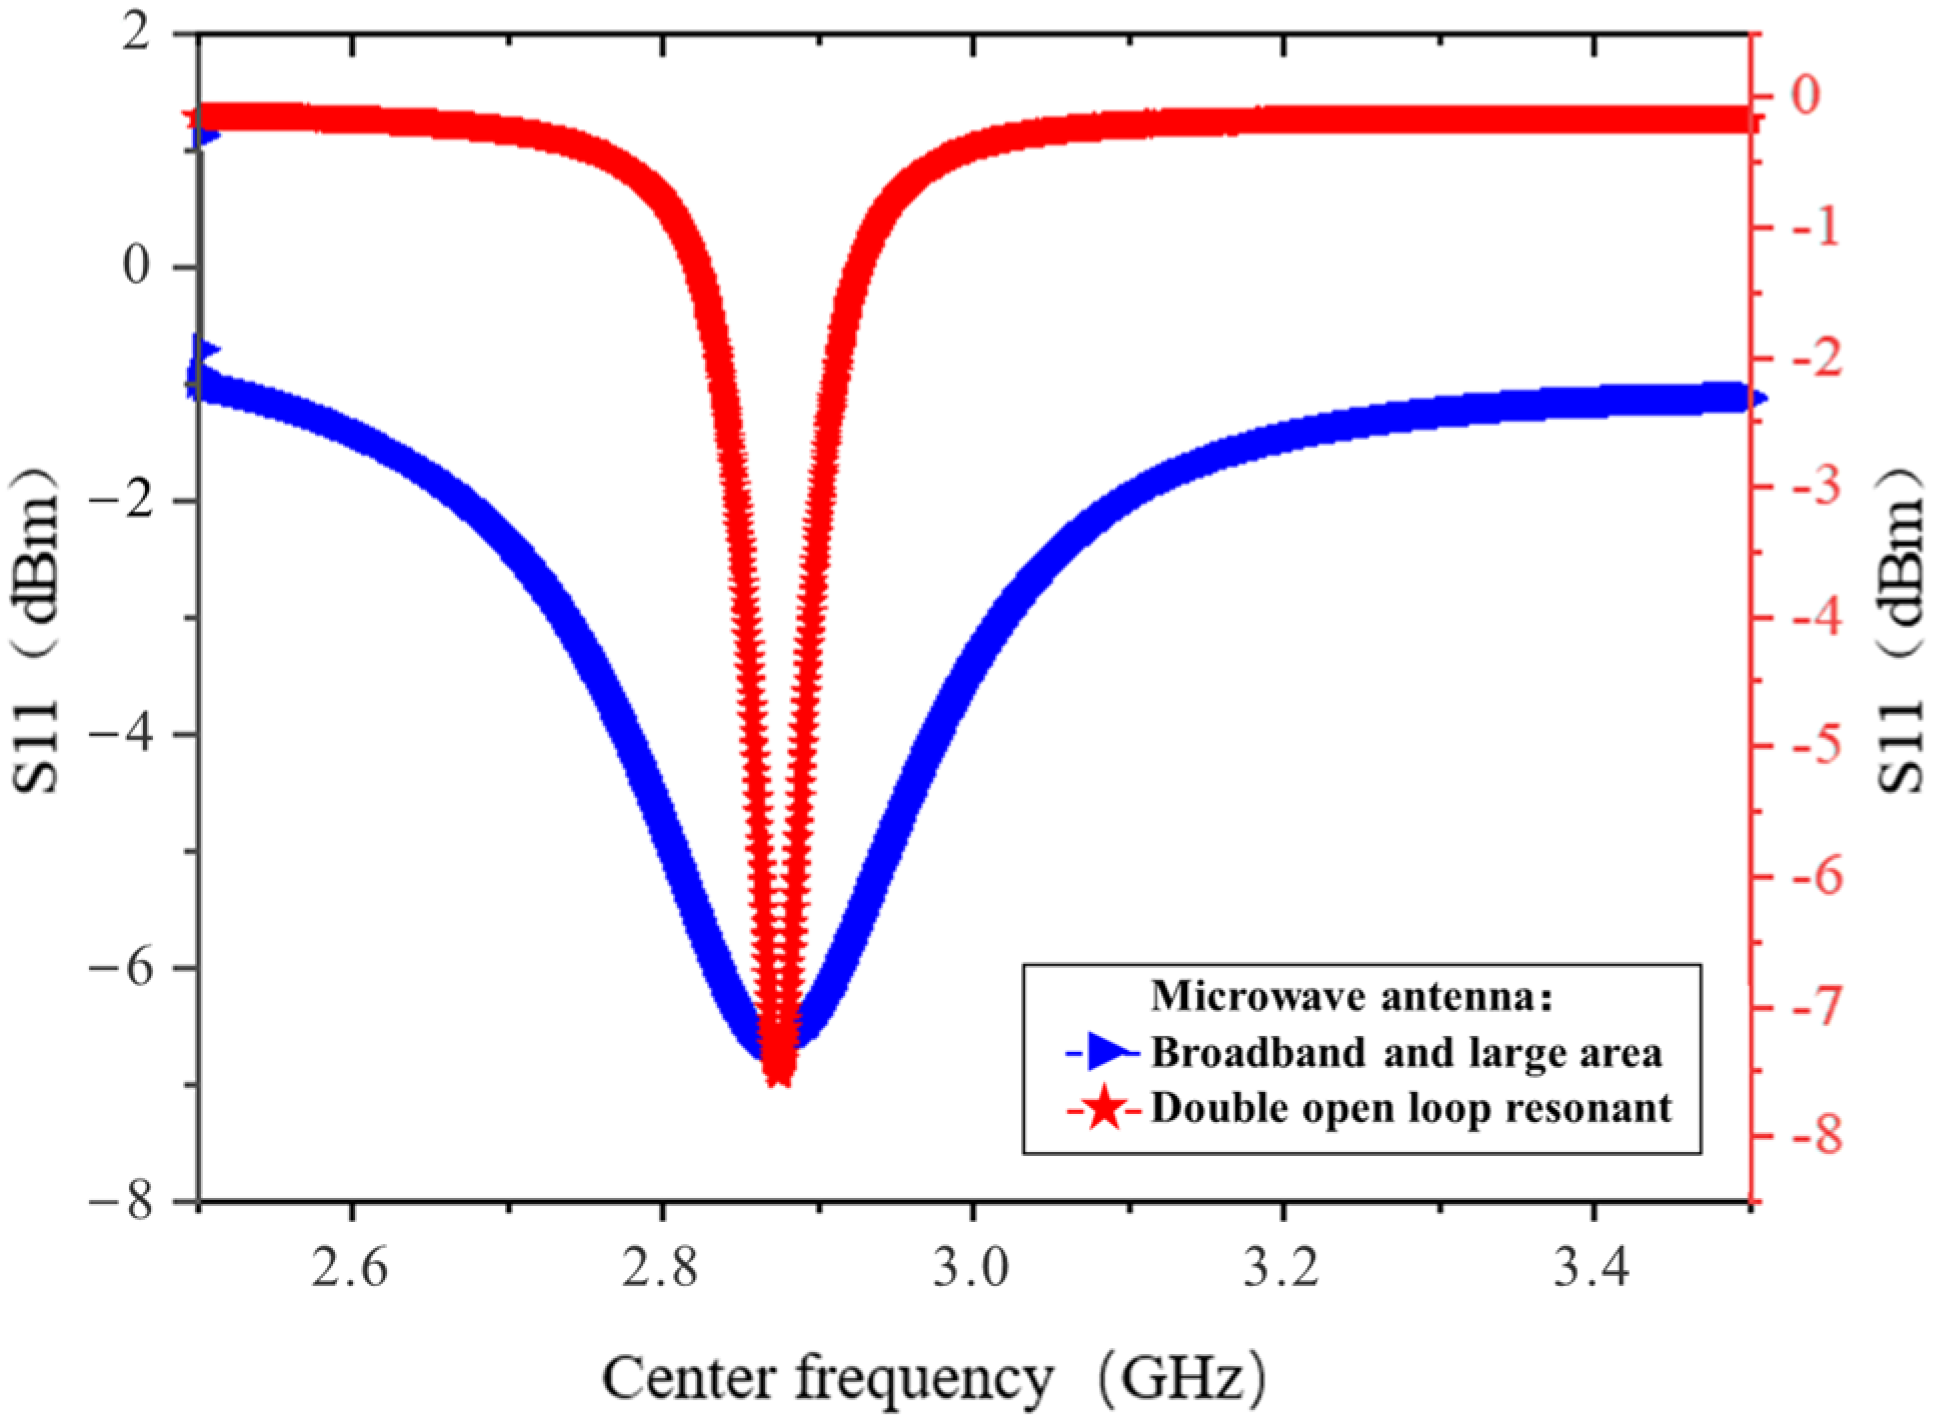
3.1. Microwave Radiation Element Simulation
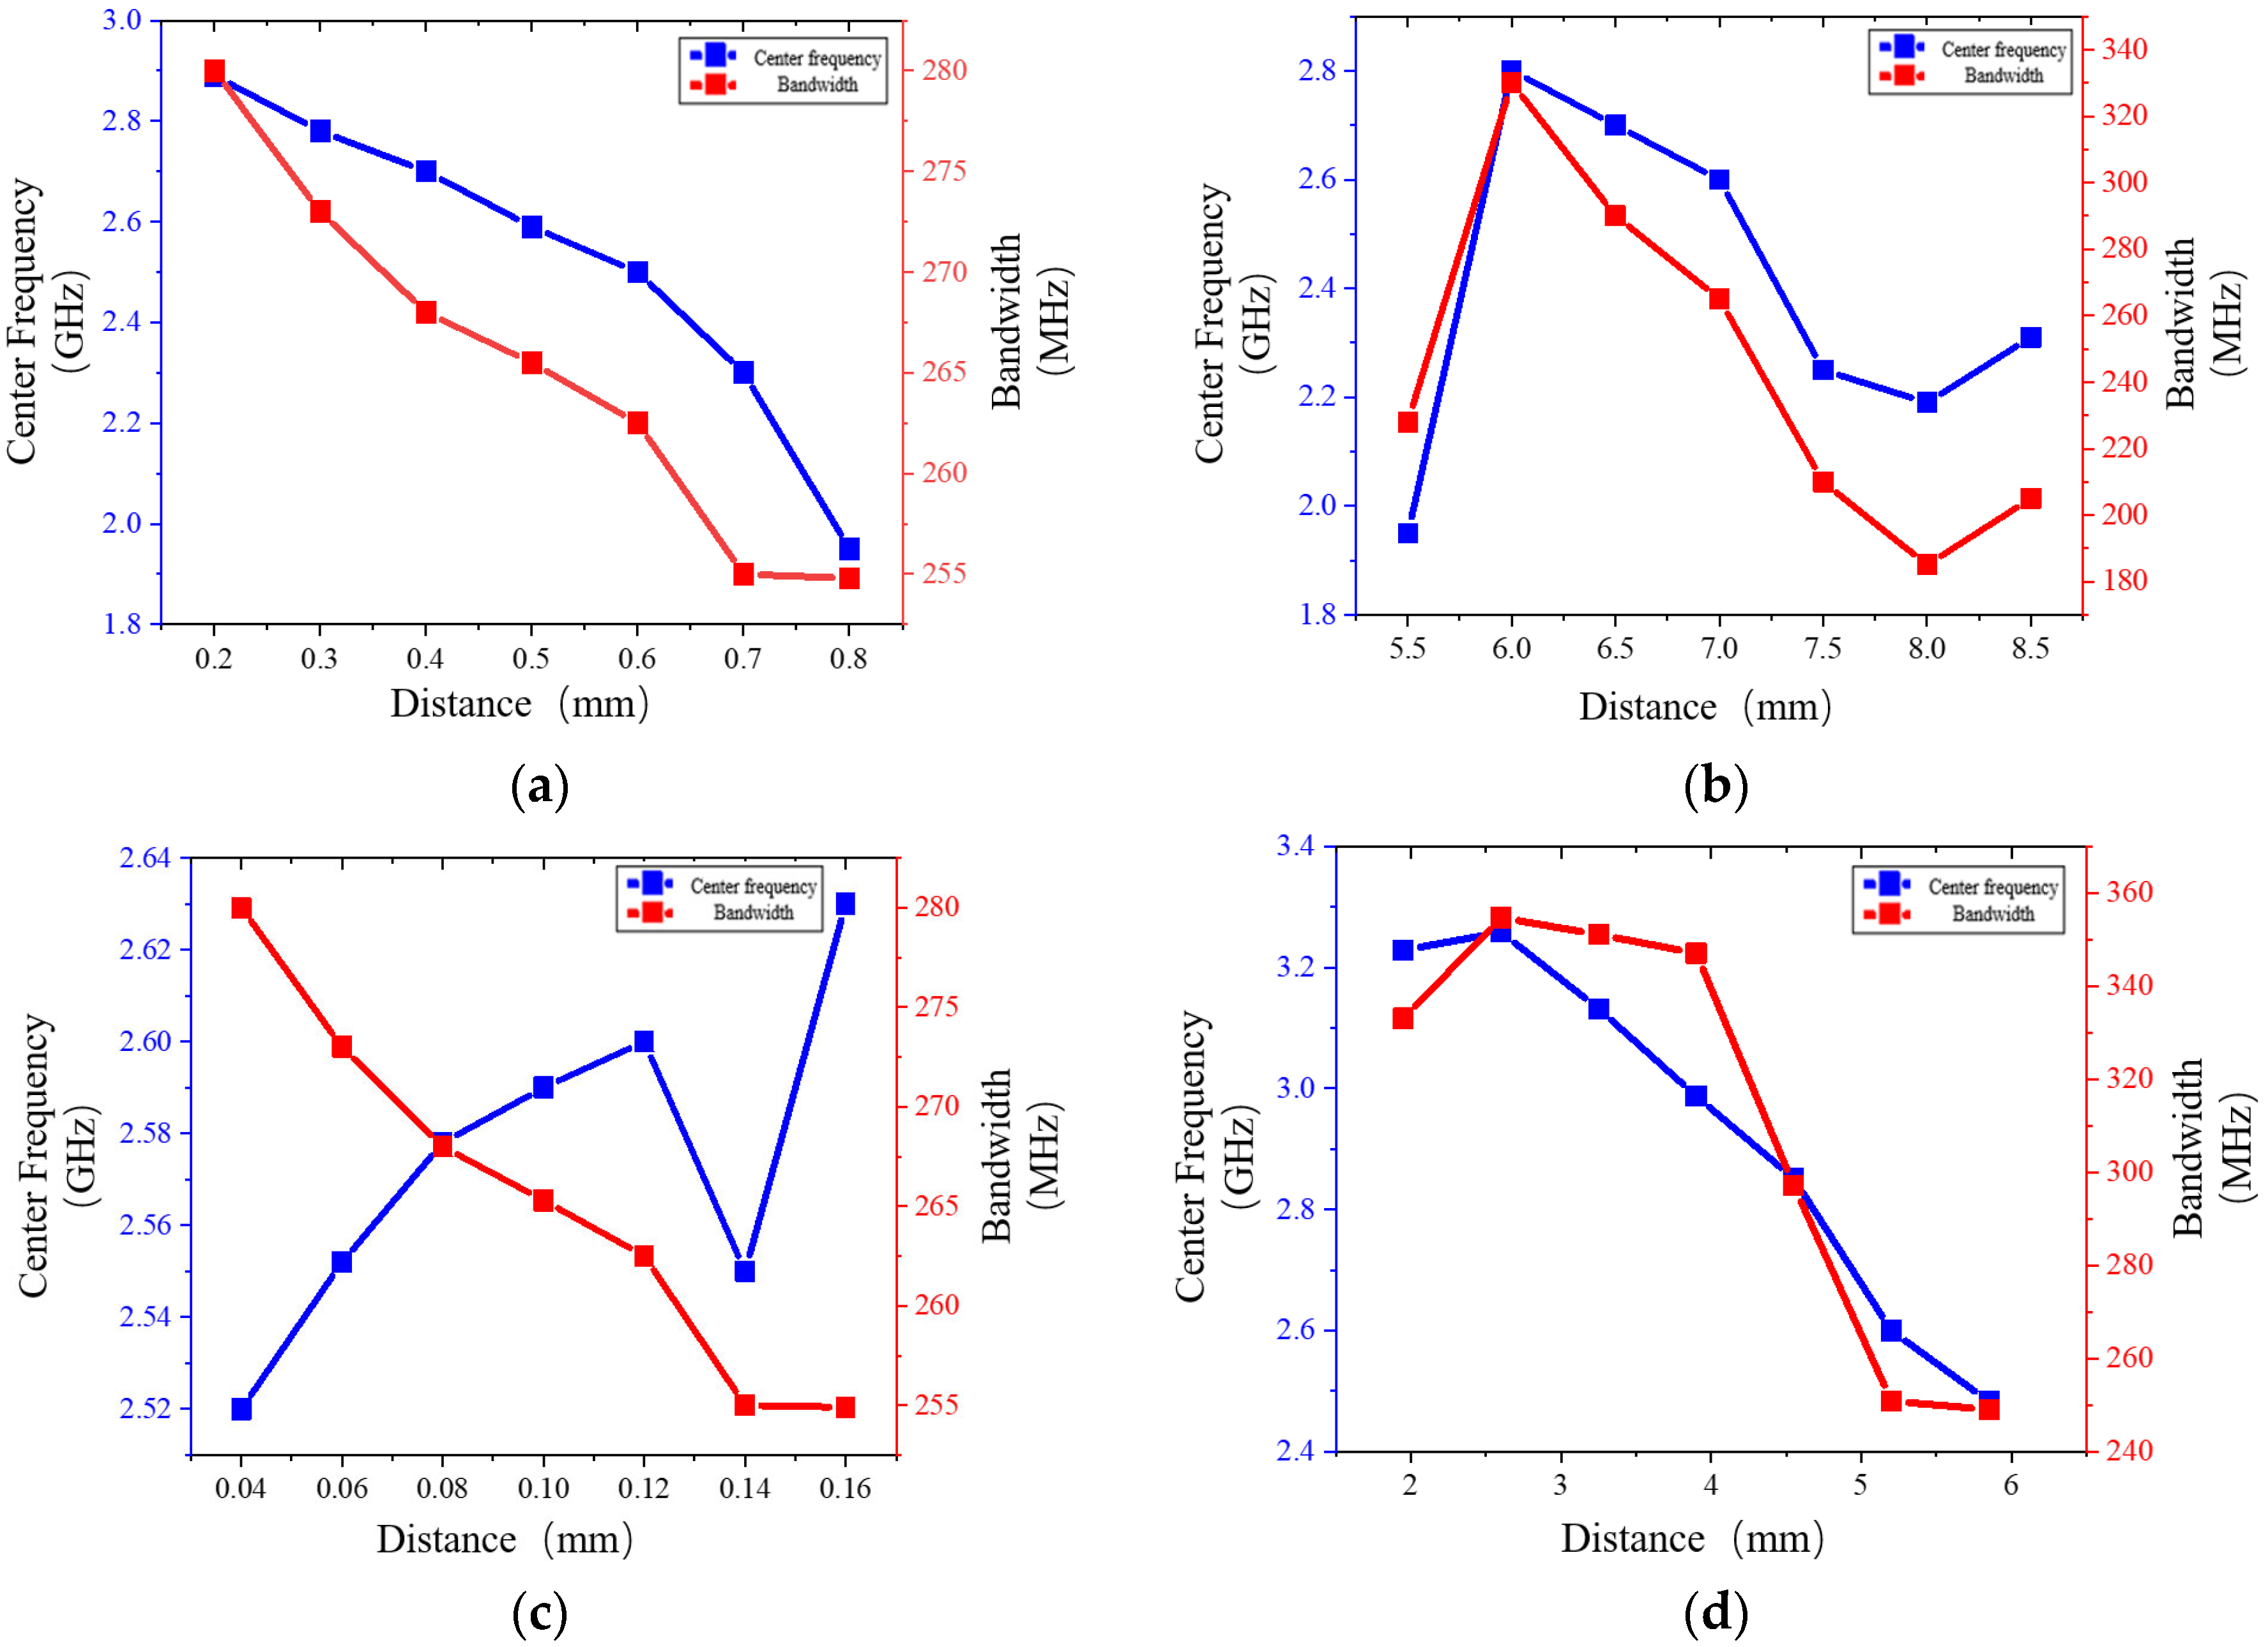
3.2. Model Optimization
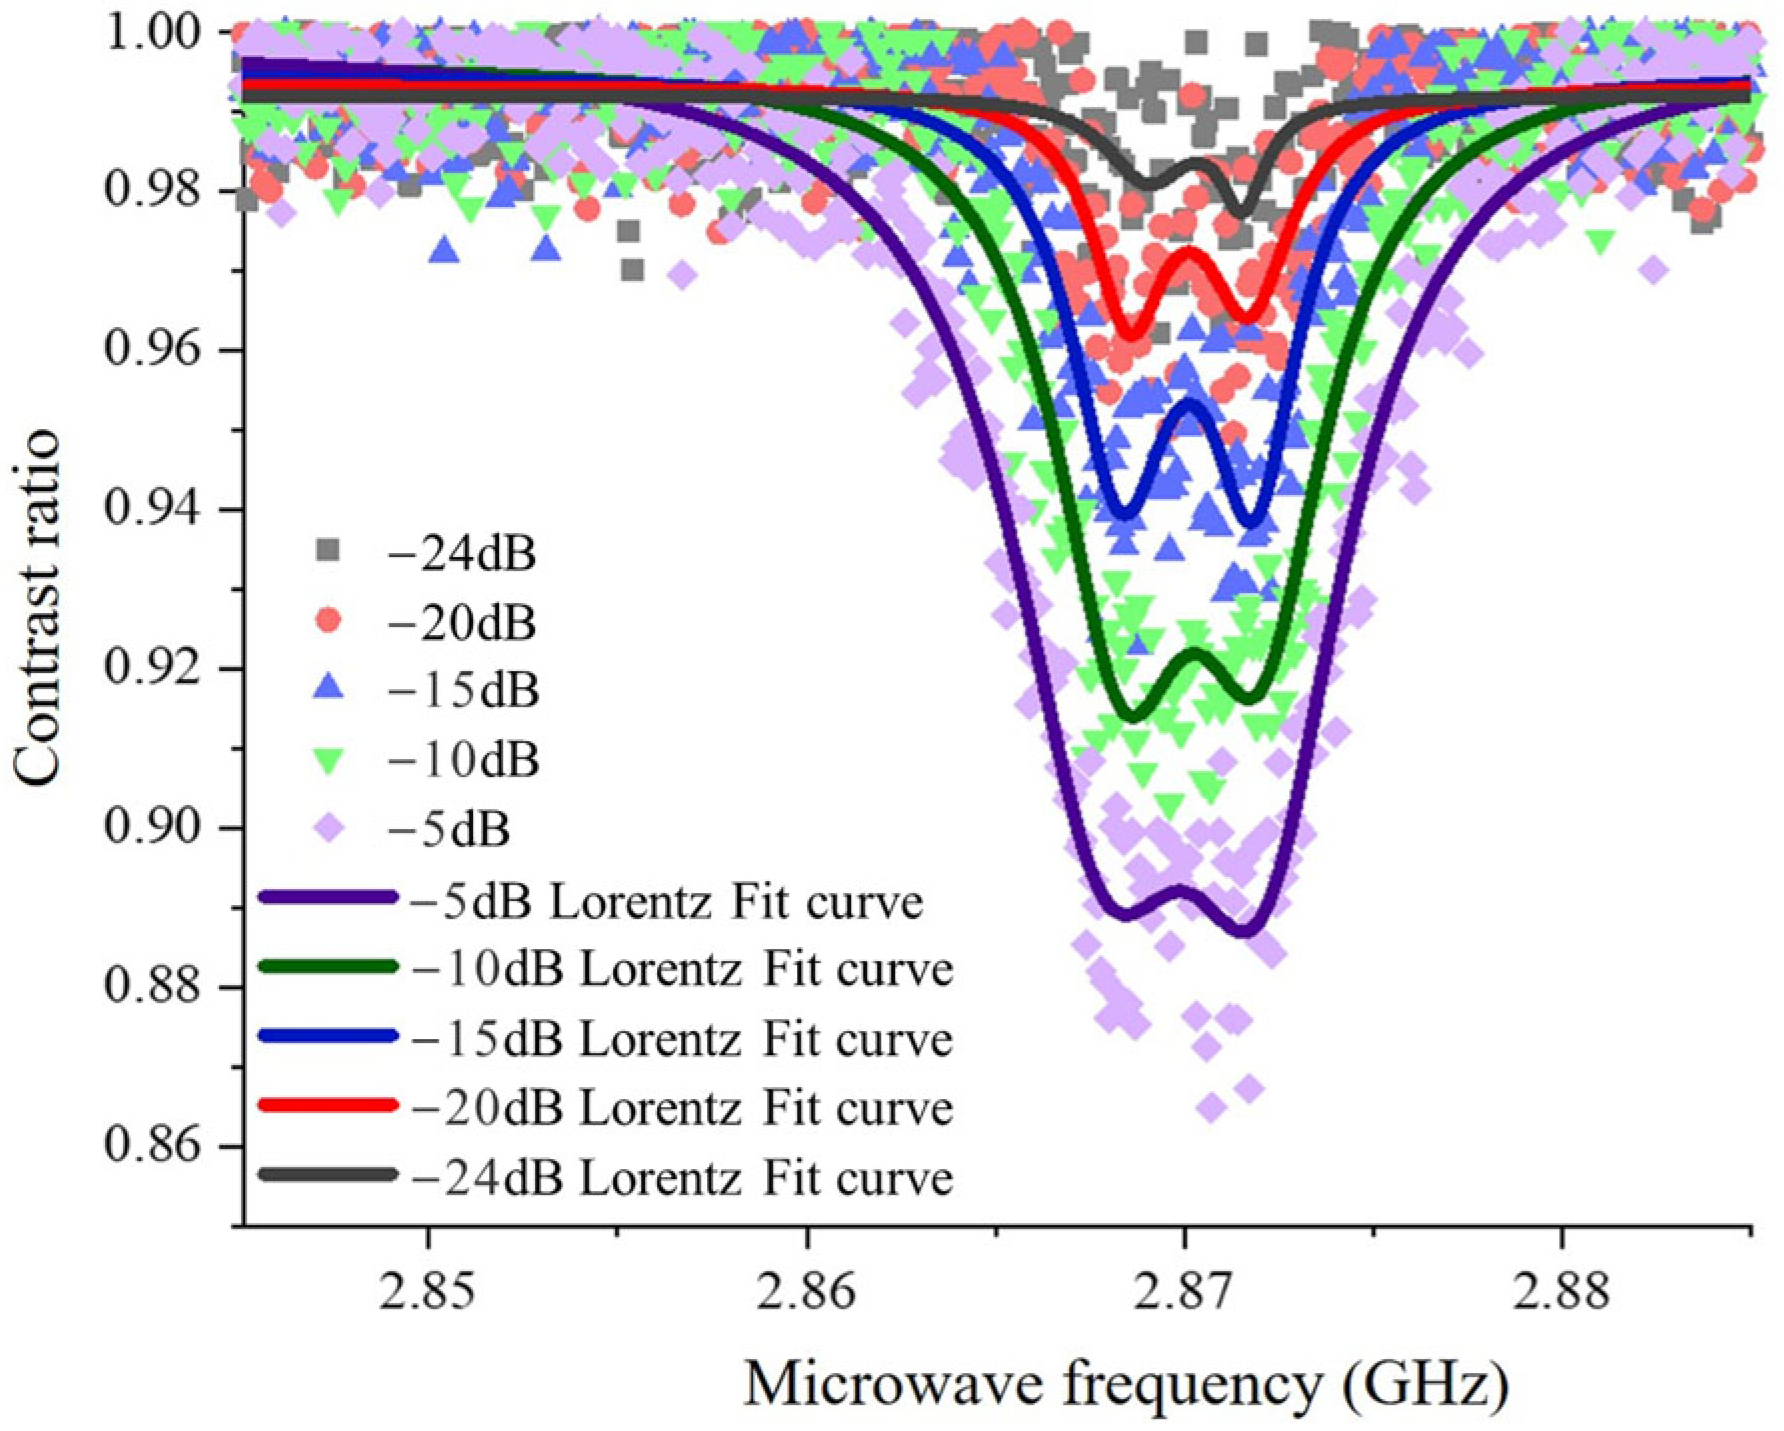
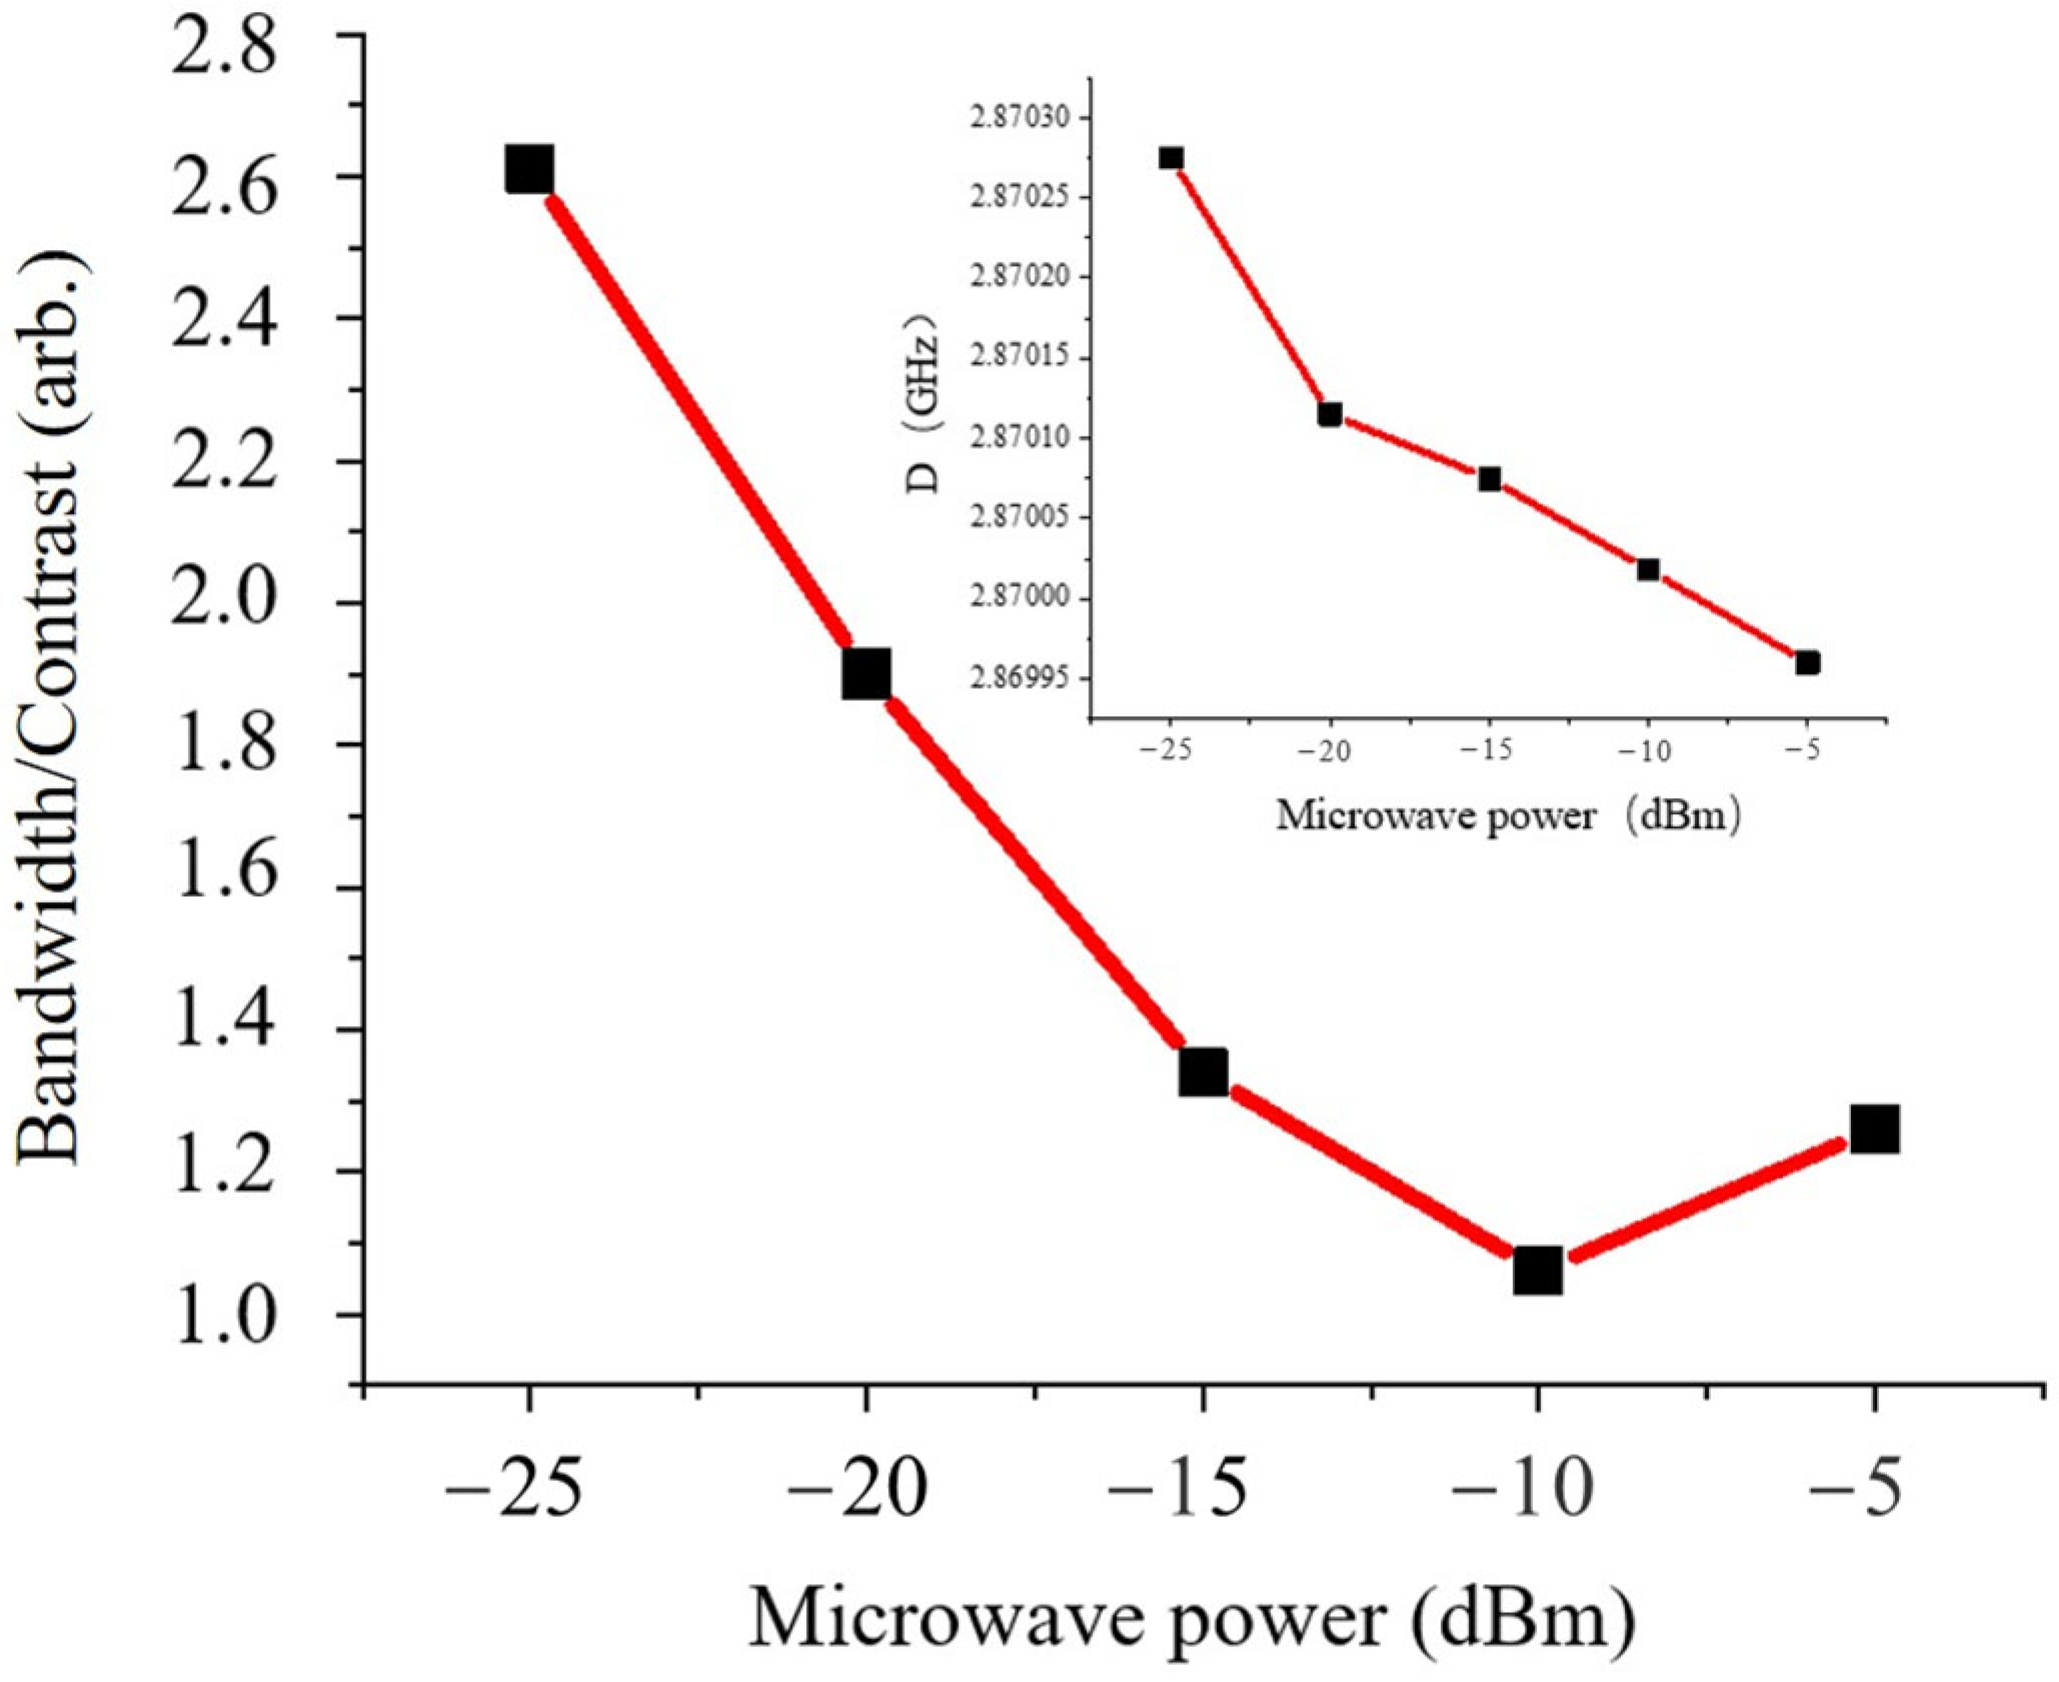
4. ODMR Experiments and Discussion
5. Conclusions
Author Contributions
Funding
Institutional Review Board Statement
Informed Consent Statement
Data Availability Statement
Acknowledgments
Conflicts of Interest
Appendix A
References
- Seymour, R.S. Biophysics and Physiology of Temperature Regulation in Thermogenic Flowers. Biosci. Rep. 2001, 21, 223–236. [Google Scholar] [CrossRef] [PubMed]
- Patel, D.; Franklin, K.A. Temperature-regulation of plant architecture. Plant. Signal. Behav. 2009, 4, 577–579. [Google Scholar] [CrossRef] [PubMed]
- Fan, J.W.; Cojocaru, I.; Becker, J.; Fedotov, I.V.; Alkahtani, M.H.A.; Alajlan, A.; Blakley, S.; Rezaee, M.; Lyamkina, A.; Palyanov, Y.N.; et al. Germanium-vacancy color center in diamond as a temperature sensor. ACS Photonics 2018, 5, 765–770. [Google Scholar] [CrossRef]
- Donner, J.S.; Thompson, S.A.; Kreuzer, M.P.; Baffou, G.; Quidant, R. Mapping intracellular temperature using green fluorescent protein. Nano Lett. 2012, 12, 2107–2111. [Google Scholar] [CrossRef] [PubMed]
- Okabe, K.; Inada, N.; Gota, C.; Harada, Y.; Funatsu, T.; Uchiyama, S. Intracellular temperature mapping with a fluorescent polymeric thermometer and fluorescence lifetime imaging microscopy. Nat. Commun. 2012, 3, 705. [Google Scholar] [CrossRef] [PubMed]
- Ximendes, E.C.; Santos, W.Q.; Rocha, U.; Kagola, U.K.; Sanz-Rodríguez, F.; Fernández, N.; Gouveia-Neto, A.d.S.; Bravo, D.; Domingo, A.M.; Rosal, B.d.; et al. Unveiling in vivo subcutaneous thermal dynamics by infrared luminescent nanothermometers. Nano Lett. 2016, 16, 1695–1703. [Google Scholar] [CrossRef] [PubMed]
- Liu, C.F.; Leong, W.H.; Xia, K.; Feng, X.; Finkler, A.; Denisenko, A.; Wrachtrup, J.; Li, Q.; Liu, R.B. Ultra-sensitive hybrid diamond nanothermometer. Natl. Sci. Rev. 2021, 5, nwaa194. [Google Scholar] [CrossRef]
- Bernardi, E.; Moreva, E.; Traina, P.; Petrini, G.; Tchernij, S.D.; Forneris, J.; Pastuović, Ž.; Degiovanni, I.P.; Olivero, P.; Genovese, M. A biocompatible technique for magnetic field sensing at (sub)cellular scale using nitrogen-vacancy centers. EPJ Quantum Technol. 2020, 7, 13. [Google Scholar] [CrossRef]
- Yu, S.J.; Kang, M.W.; Chang, H.C.; Chen, K.M.; Yu, Y.C. Bright fluorescent nanodiamonds: No photobleaching and low cytotoxicity. J. Am. Chem. Soc. 2005, 127, 17604–17605. [Google Scholar] [CrossRef]
- Fu, C.C.; Lee, H.Y.; Chen, K.; Lim, T.S.; Wu, H.Y.; Lin, P.K.; Wei, P.K.; Tsao, P.H.; Chang, H.C.; Fann, W. Characterization and application of single fluorescent nanodiamonds as cellular biomarkers. Proc. Natl. Acad. Sci. USA 2007, 104, 727–732. [Google Scholar] [CrossRef]
- Xie, Y.; Yu, H.; Zhu, Y.; Qin, X.; Rong, X.; Duan, C.K.; Du, J. A hybrid magnetometer towards femtotesla sensitivity under ambient conditions. Sci. Bull. 2021, 66, 127–132. [Google Scholar] [CrossRef]
- Neumann, P.; Jacobi, I.; Dolde, F.; Burk, C.; Reuter, R.; Waldherr, G.; Honert, J.; Wolf, T.; Brunner, A.; Shim, J.H.; et al. High-precision nanoscale temperature sensing using single defects in diamond. Nano Lett. 2013, 13, 2738–2742. [Google Scholar] [CrossRef] [PubMed]
- Toyli, D.M.; de las Casas, C.F.; Christle, D.J.; Dobrovitski, V.V.; Awschalom, D.D. Fluorescence thermometry enhanced by the quantum coherence of single spins in diamond. Proc. Natl. Acad. Sci. USA 2013, 110, 8417–8421. [Google Scholar] [CrossRef] [PubMed]
- Plakhoynik, T.; Doherty, M.W.; Cole, J.H.; Chapman, R.; Manson, N.B. All-optical thermometry and thermal properties of the optically detected spin resonances of the NV– Center in nanodiamond. Nano Lett. 2014, 14, 4989–4996. [Google Scholar] [CrossRef] [PubMed]
- Maze, J.R.; Stanwix, P.L.; Hodges, J.S.; Hong, S.; Taylor, J.M.; Cappellaro, P.; Jiang, L.; Gurudev Dutt, M.V.; Togan, E.; Zibrov, A.S.; et al. Nanoscale magnetic sensing with an individual electronic spin in diamond. Nature 2008, 455, 644–647. [Google Scholar] [CrossRef] [PubMed]
- Taylor, J.M.; Cappellaro, P.; Childress, L.; Jiang, L.; Budker, D.; Hemmer, P.R.; Yacoby, A.; Walsworth, R.; Lukin, M.D. High-sensitivity diamond magnetometer with nanoscale resolution. Nat. Phys. 2008, 4, 810–816. [Google Scholar] [CrossRef]
- Ivády, V.; Simon, T.; Maze, J.R.; Abrikosov, I.A.; Gali, A. Pressure and temperature dependence of the zero-field splitting in the ground state of NV centers in diamond: A first-principles study. Phys. Rev. B 2014, 90, 235205. [Google Scholar] [CrossRef]
- Doherty, M.W.; Struzhkin, V.V.; Simpson, D.A.; McGuinness, L.P.; Meng, Y.; Stacey, A.; Karle, T.J.; Hemley, R.J.; Manson, N.B.; Hollenberg, L.C.L.; et al. Electronic properties and metrology applications of the diamond NV− center under pressure. Phys. Rev. Lett. 2014, 112, 047601. [Google Scholar] [CrossRef] [PubMed]
- Dolde, F.; Fedder, H.; Doherty, M.W.; Nöbauer, T.; Rempp, F.; Balasubramanian, G.; Wolf, T.; Reinhard, F.; Hollenberg, L.C.L.; Jelezko, F.; et al. Electric-field sensing using single diamond spins. Nat. Phys. 2011, 7, 459–463. [Google Scholar] [CrossRef]
- Iwasaki, T.; Naruki, W.; Tahara, K.; Makino, T.; Kato, H.; Ogura, M.; Takeuchi, D.; Yamasaki, S.; Hatano, M. Direct nanoscale sensing of the internal electric field in operating semiconductor devices using single electron spins. ACS Nano 2017, 11, 1238–1245. [Google Scholar] [CrossRef]
- Jensen, K.; Leefer, N.; Jarmola, A.; Dumeige, Y.; Acosta, V.M.; Kehayias, P.; Patton, B.; Budker, D. Cavity-enhanced room-temperature magnetometry using absorption by nitrogen-vacancy centers in diamond. Phys. Rev. Lett. 2014, 112, 160802. [Google Scholar] [CrossRef] [PubMed]
- Sasaki, K.; Monnai, Y.; Saijo, S.; Fujita, R.; Watanabe, H.; Ishi-Hayase, J.; Itoh, K.M.; Abe, E. Broadband, large-area microwave antenna for optically detected magnetic resonance of nitrogen-vacancy centers in diamond. Rev. Sci. Instrum. 2016, 87, 053904. [Google Scholar] [CrossRef] [PubMed]
- Bayat, K.; Choy, J.; Farrokh Baroughi, M.; Meesala, S.; Loncar, M. Efficient, Uniform, and large area microwave magnetic coupling to NV centers in diamond using double split-ring resonators. Nano Lett. 2014, 14, 1208–1213. [Google Scholar] [CrossRef] [PubMed]
- Kapitanova, P.; Soshenko, V.V.; Vorobyov, V.V.; Dobrykh, D.; Bolshedvorskii, S.V.; Sorokin, V.N.; Akimov, A.V. 3D uniform manipulation of NV centers in diamond using a dielectric resonator antenna. JETP Lett. 2018, 108, 588–595. [Google Scholar] [CrossRef]
- Qin, L.; Fu, Y.; Zhang, S.; Zhao, J.; Gao, J.; Yuan, H.; Ma, Z.; Shi, Y.; Liu, J. Near-field microwave radiation function on spin assembly of nitrogen vacancy centers in diamond with copper wire and ring microstrip antennas. Jpn. J. Appl. Phys. 2018, 57, 072201. [Google Scholar] [CrossRef]
- Chen, Y.; Guo, H.; Li, W.; Wu, D.; Zhu, Q.; Zhao, B.; Wang, L.; Zhang, Y.; Zhao, R.; Liu, W.; et al. Large-area, tridimensional uniform microwave antenna for quantum sensing based on nitrogen-vacancy centers in diamond. APEX 2018, 11, 123001. [Google Scholar] [CrossRef]
- Fujiwara, M.; Shikano, Y. Diamond quantum thermometry: From fundations to applications. Nanotechnology 2021, 32, 482002. [Google Scholar] [CrossRef] [PubMed]
- Gao, Y.C.; Sun, J.H.; Yu, G.F. Measurement of dielectric constant of cell culture dishes. J. Univ. Electron. Sci. Technol. China 2007, 36, 70–72. [Google Scholar]
- Fujiwara, M.; Sun, S.; Dohms, A.; Nishimura, Y.; Suto, K.; Takezawa, Y.; Oshimi, k.; Zhao, L.; Sadzak, N.; Umehara, Y.; et al. Real-time nanodiamond thermometry probing in vivo thermogenic responses. Sci. Adv. 2020, 6, eaba9636. [Google Scholar] [CrossRef]
- Wang, Z.; Zhang, J.T.; Feng, X.J.; Xing, L. Microwave heating effect on diamond samples of nitrogen-vacancy centers. ACS Omega 2022, 7, 31538–31543. [Google Scholar] [CrossRef]
- Loubser, J.H.N.; van Wyk, J.A. Electron spin resonance in the study of diamond. Rep. Prog. Phys. 1978, 41, 1201. [Google Scholar] [CrossRef]
- Felton, S.; Edmonds, A.M.; Newton, M.E.; Martineau, P.M.; Fisher, D.; Twitchen, D.J.; Baker, J.M. Hyperfine interaction in the ground state of the negatively charged nitrogen vacancy center in diamond. Phys. Rev. B 2009, 79, 075203. [Google Scholar] [CrossRef]
- Barry, J.F.; Turner, M.J.; Schloss, J.M.; Glenn, D.R.; Song, Y.; Lukin, M.D.; Park, H.; Walsworth, R.L. Optical magnetic detection of single-neuron action potentials using quantum defects in diamond. Proc. Natl. Acad. Sci. USA 2016, 113, 14133–14138. [Google Scholar] [CrossRef] [PubMed]
- Schoenfeld, R.S.; Harneit, W. Real time magnetic field sensing and imaging using a single spin in diamond. Phys. Rev. Lett. 2011, 106, 030802. [Google Scholar] [CrossRef] [PubMed]
- Toyli, D.M.; Christle, D.J.; Alkauskas, A.; Buckley, B.B.; Van de Walle, C.G.; Awschalom, D.D. Measurement and control single nitrogen-vacancy center spins above 600K. Phys. Rev. X 2012, 2, 031001. [Google Scholar]
- Doughty, A.C.V.; Hoover, A.R.; Layton, E.; Murray, C.K.; Howard, E.W.; Chen, W.R. Nanomaterial applications in photothermal therapy for cancer. Materials. Nat. Mater. 2019, 12, 779. [Google Scholar]
- Acosta, V.M.; Bauch, E.; Ledbetter, M.P.; Waxman, A.; Bouchard, L.S.; Budker, D. Temperature dependence of the nitrogen-vacancy magnetic resonance in diamond. Phys. Rev. Lett. 2010, 104, 070801. [Google Scholar] [CrossRef] [PubMed]
- Hsiao, C.W.; Chuang, E.Y.; Chen, H.L.; Wan, D.; Korupalli, C.; Liao, Z.X.; Chiu, Y.L.; Chia, W.T.; Lin, K.J.; Sung, H.W. Photothermal tumor ablation in mice with repeated therapy sessions using NIR-absorbing micellar hydrogels formed in situ. Biomaterials 2015, 56, 26–35. [Google Scholar] [CrossRef] [PubMed]
- Chen, Q.; Xu, L.; Liang, C.; Wang, C.; Peng, R.; Liu, Z. Photothermal therapy with immune-adjuvant nanoparticles together with checkpoint blockade for effective cancer immunotherapy. Nat. Commun. 2016, 7, 13193. [Google Scholar] [CrossRef]
- Zhang, C.; Bu, W.; Ni, D.; Zuo, C.; Cheng, C.; Li, Q.; Zhang, L.; Wang, Z.; Shi, J. A polyoxometalate cluster paradigm with self-adaptive electronic structure for acidity/reducibility-specific photothermal conversion. J. Am. Chem. Soc. 2016, 138, 8156–8164. [Google Scholar] [CrossRef]
- Wu, Y.K.; Alam, M.N.A.; Balasubramanian, P.; Ermakova, A.; Fischer, S.; Barth, H.; Wagner, M.; Raabe, M.; Jelezko, F.; Weil, T. Nanodiamond theranostic for light-controlled intracellular heating and nanoscale temperature sensing. Nano Lett. 2021, 21, 3780–3788. [Google Scholar] [CrossRef] [PubMed]


| Antenna Type | BLA Microwave Antenna | DOLR Microwave Antenna | ||
|---|---|---|---|---|
| Microwave Field Characteristics | ||||
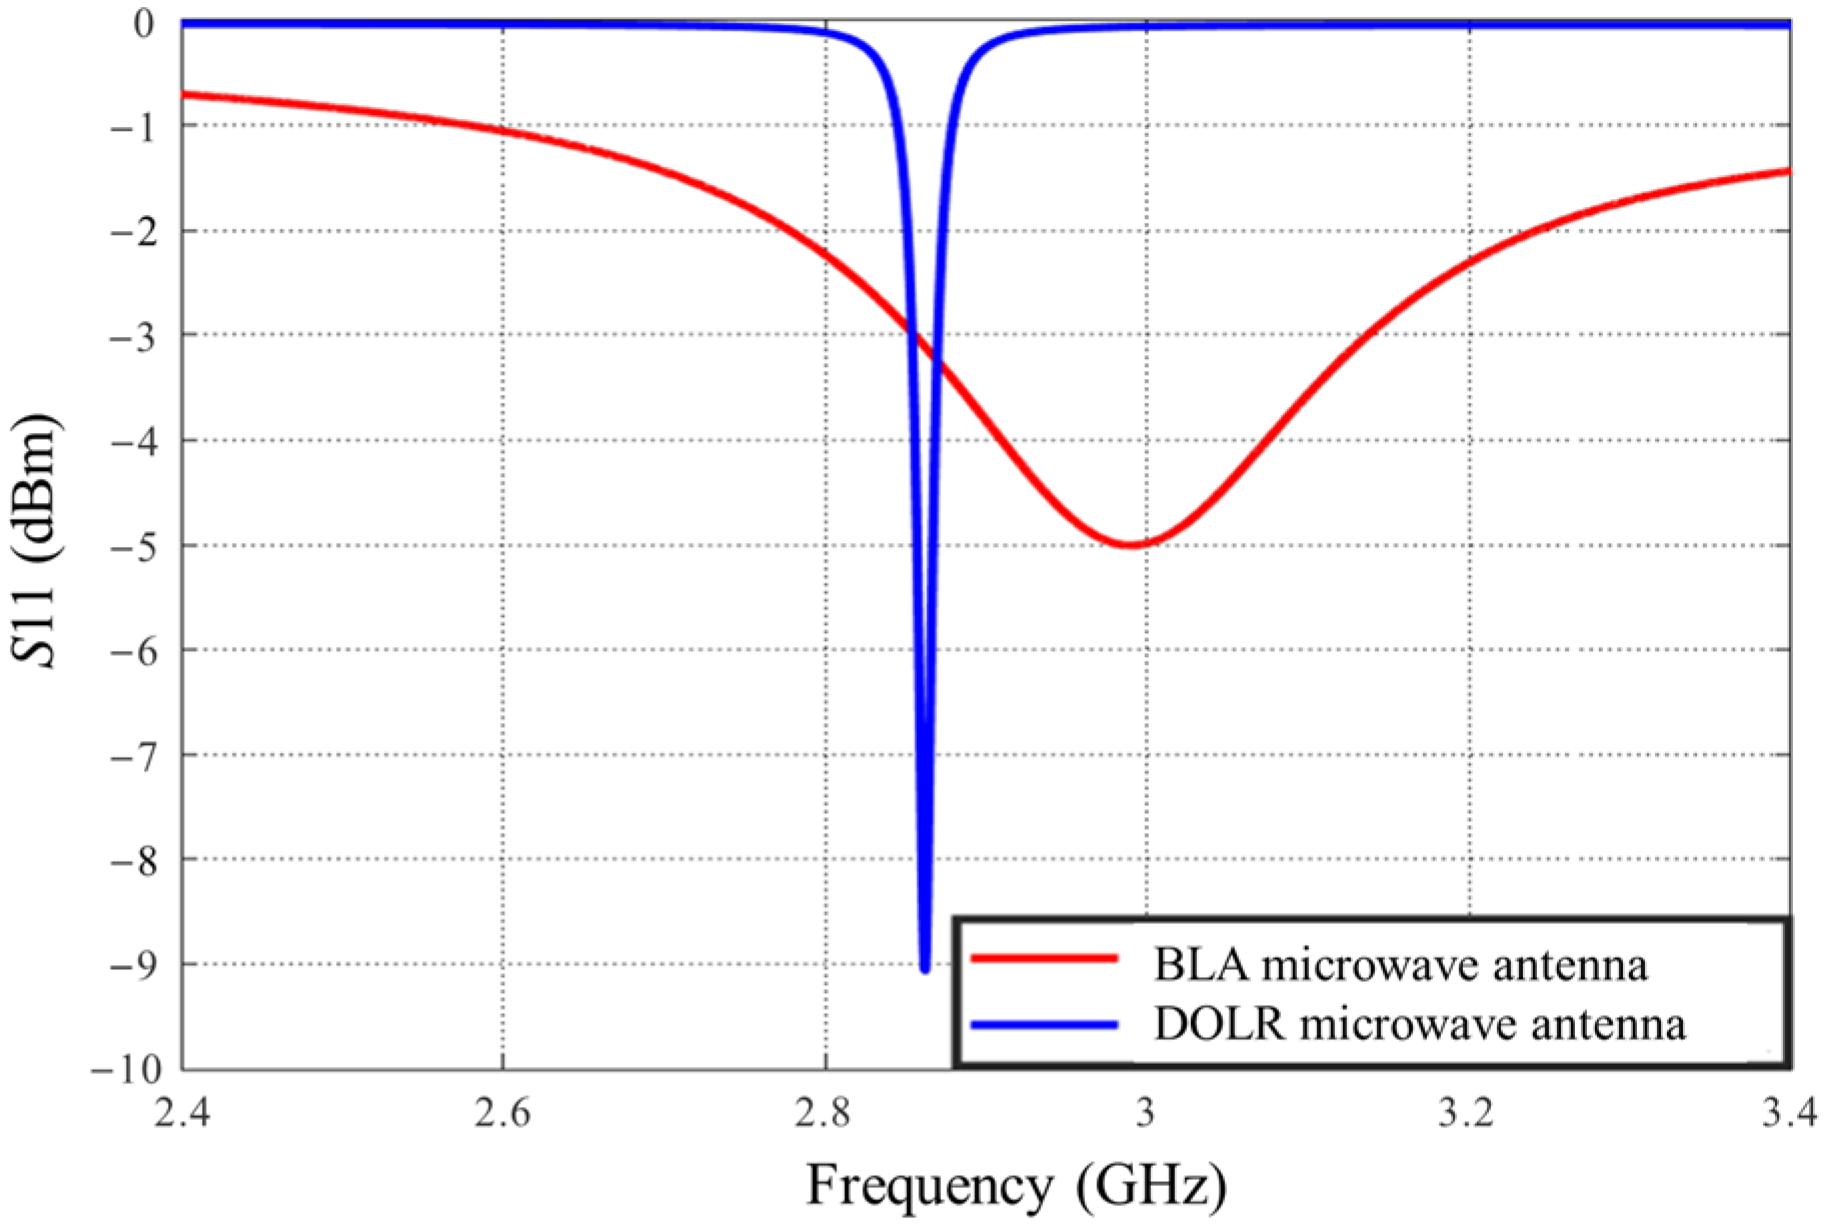
| Center frequency (GHz) | 2.968 | 2.880 | ||
| Bandwidth (MHz) | 379 | 19 | ||
| Q value | 7.8 | 151.6 | ||
| Uniformity of microwave field on different areas of microwave antennas () | 4 mm × 4 mm | 1.95 | 1.80 | |
| 3 mm × 3 mm | 1.89 | 1.75 | ||
| 2 mm × 2 mm | 1.80 | 1.27 | ||
| 1 mm × 1 mm | 0.77 | 0.65 | ||
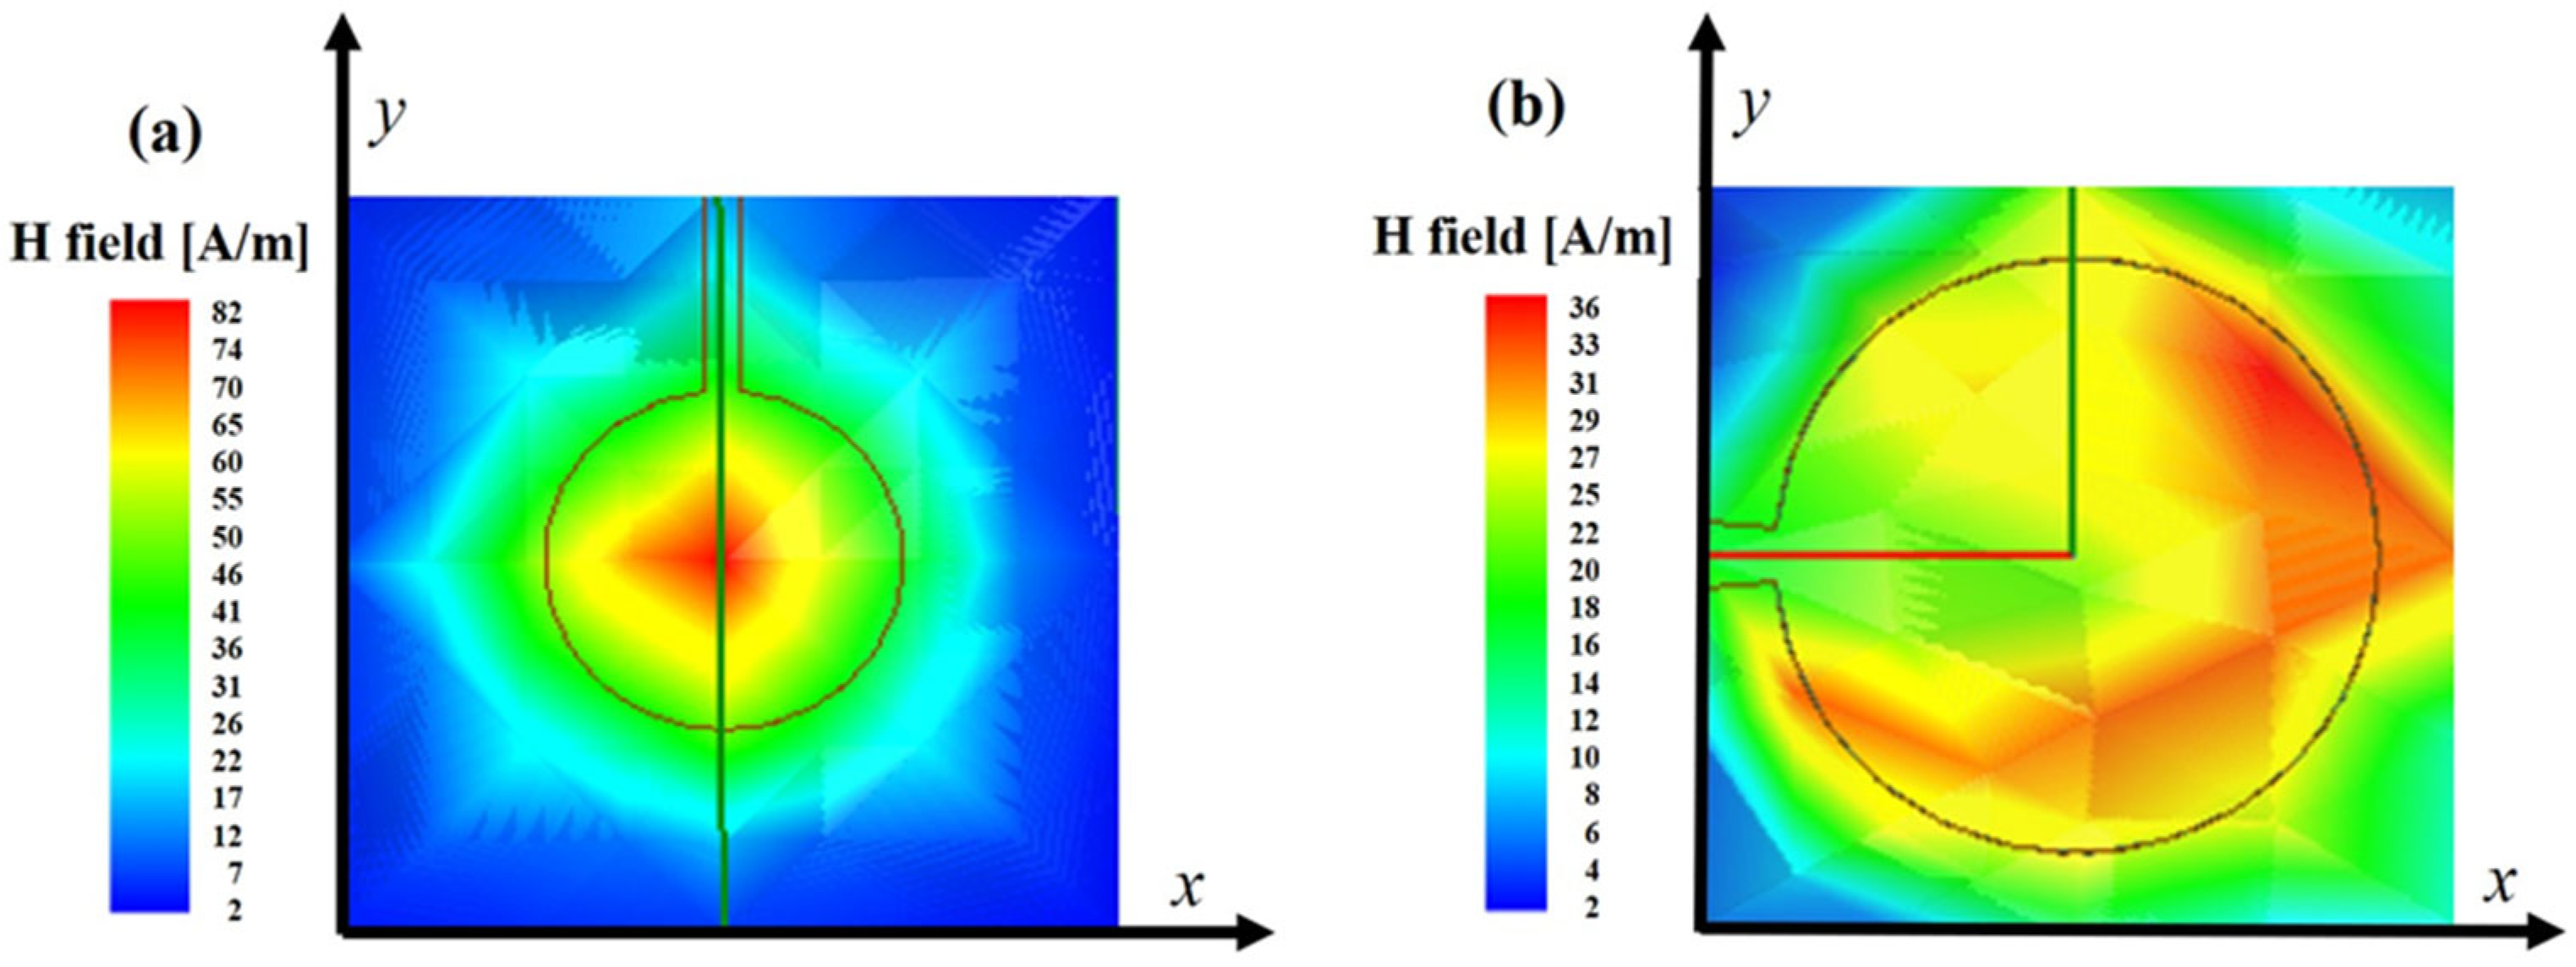
| Radiation element microwave field strength (A/m) | 4405.7 | 2569.5 | ||
| Considering the microwave field strength under the diamond chip model (A/m) | 82.8 | 36.6 | ||
| Antenna Type | BLA Microwave Antenna | DOLR Microwave Antenna | |
|---|---|---|---|
| Microwave Field Characteristics | |||
| Center frequency (GHz) | Radiation element | 2.990 | 2.890 |
| Diamond sheet | 2.979 | 2.897 | |
| Cellular environment | 2.589 | 2.731 | |
| Bandwidth (MHz) | Radiation element | 382 | 20 |
| Diamond sheet | 422 | 22 | |
| Cellular environment | 337 | 84 | |
| Q value | Radiation element | 7.8 | 148.2 |
| Diamond sheet | 7.1 | 130.0 | |
| Cellular environment | 7.7 | 32.7 | |
| Magnetic field strength (A/m) | Radiation element | 2366.5 | 948.5 |
| Diamond sheet | 2871.5 | 413.00 | |
| Cellular environment | 236.9 | 161.4 | |
| Magnetic field uniformity | Radiation element | 2.00 | 1.93 |
| Diamond sheet | 1.98 | 1.88 | |
| Cellular environment | 0.96 | 0.42 |
| Antenna Type | Q Value | Uniformity of Planar Magnetic Field | Magnetic Field Strength (A/m) |
|---|---|---|---|
| BLA microwave antenna | 9.22 | 1.97 | 144.1 |
| DOLR microwave antenna | 40.43 | 0.98 | 344.9 |
Disclaimer/Publisher’s Note: The statements, opinions and data contained in all publications are solely those of the individual author(s) and contributor(s) and not of MDPI and/or the editor(s). MDPI and/or the editor(s) disclaim responsibility for any injury to people or property resulting from any ideas, methods, instructions or products referred to in the content. |
© 2024 by the authors. Licensee MDPI, Basel, Switzerland. This article is an open access article distributed under the terms and conditions of the Creative Commons Attribution (CC BY) license (https://creativecommons.org/licenses/by/4.0/).
Share and Cite
Fan, Z.; Xing, L.; Wu, F.; Feng, X.; Zhang, J. The Optimization of Microwave Field Characteristics for ODMR Measurement of Nitrogen-Vacancy Centers in Diamond. Photonics 2024, 11, 436. https://doi.org/10.3390/photonics11050436
Fan Z, Xing L, Wu F, Feng X, Zhang J. The Optimization of Microwave Field Characteristics for ODMR Measurement of Nitrogen-Vacancy Centers in Diamond. Photonics. 2024; 11(5):436. https://doi.org/10.3390/photonics11050436
Chicago/Turabian StyleFan, Zhenxian, Li Xing, Feixiang Wu, Xiaojuan Feng, and Jintao Zhang. 2024. "The Optimization of Microwave Field Characteristics for ODMR Measurement of Nitrogen-Vacancy Centers in Diamond" Photonics 11, no. 5: 436. https://doi.org/10.3390/photonics11050436
APA StyleFan, Z., Xing, L., Wu, F., Feng, X., & Zhang, J. (2024). The Optimization of Microwave Field Characteristics for ODMR Measurement of Nitrogen-Vacancy Centers in Diamond. Photonics, 11(5), 436. https://doi.org/10.3390/photonics11050436