Abstract
An easy-to-implement and cost-effective Fiber Bragg Grating (FBG) sensor interrogation technique based on a ring Erbium-Doped Fiber Laser (EDFL) topology is proposed and experimentally assessed. The FBG sensor is part of the EDFL cavity and must have a central wavelength located within the linear region of the EDF’s amplified spontaneous emission (ASE) spectrum, which occurs at between 1530 and 1540 nm. In this manner, the wavelength-encoded response of the FBG under strain is converted to a linear variation in the laser output power, removing the need for spectrum analysis as well as any limitations from the use of external edge-filtering components. In addition, the laser linewidth is significantly reduced with respect to the FBG bandwidth, thus improving the resolution of the system, whereas its sensitivity can be controlled through pumping power. The performance of the system has been characterized by modeling and experiments for EDFs with different lengths, doping concentrations, and pumping power levels. The influence of mode-hopping in the laser cavity on the resolution and accuracy of the system has also been investigated.
1. Introduction
Strain and structural health monitoring systems are increasingly used for infrastructures and constructions with high standards and strict specifications. The state of the art of these systems utilizes complicated and sophisticated fiber optic sensor techniques in order to monitor the increased number of sensing points [1,2]. Most of them require sequentially located FBGs with different central wavelengths, while their interrogation systems are mainly based on either tunable lasers or spectrum analyzers [3,4,5], which are, in general, high-end and high-cost components. Alternative methods utilize tunable optical filters [6] or the time-to-wavelength mapping method [7], resulting in increased complexity or the use of precise measuring instruments.
On the other hand, there are also many small-scale applications that require a small number of FBG sensors, where cost and simplicity are the most significant requirements. For these applications, alternative lower-cost systems are required. A potential interrogation method could use a time division multiplexing topology consisting of FBGs with similar center wavelengths inscribed on different fibers and polled by means of the optical switch. Then, a single channel interrogator is required and may be based on an edge-filtering component matched to the FBG wavelength range that transforms the wavelength-encoded strain or temperature response of the FBG into power variation [8,9].
Edge filters are usually implemented either by biconical fibers [10] or by means of chirped and apodized grating inscriptions on the fiber core and, therefore, require a rather complicated design [8,11,12]. In addition, they exhibit a limited linear spectral response of up to 2 nm that remains unchanged unless their temperature is varied through a temperature control system. Nevertheless, by employing long-period gratings (LPGs) as edge filters, the spectral range may be increased but at the expense of linearity [13]. Edge filters for FBG interrogation based on unpumped erbium-doped fibers (EDFs) have also been proposed [14,15]. They exploit the linear region of the absorption spectrum of the EDF and, in general, suffer from low output power levels. Finally, a special type of edge filtering technique is based on an arrayed waveguide grating (AWG) filter that functions as a spectral analyzer using spectral channels compared to an edge filter with a linear slope [16,17].
In the present work, we propose and evaluate an FBG interrogation technique that relies on an erbium-doped fiber laser (EDFL) in a well-known ring cavity configuration, which includes the strain-sensing FBG. The novelty of the proposed technique is that the FBG sensing element must exhibit a central reflectivity wavelength within the 1532–1537 nm wavelength range, where the ASE spectrum of Erbium exhibits an abrupt slope. By means of the combination of a ring EDFL cavity with this specific FBG, any strain-induced wavelength shift of the FBG not only shifts the laser wavelength but also induces a linear variation in the laser power due to the abrupt variation in the EDF-ASE spectrum within the above wavelength range. Thus, the proposed topology behaves like an edge filter, eliminating the need for spectrum analysis or external linear edge-filtering components, which are commonly used in typical power-detection interrogation systems [18]. Therefore, the proposed topology is simpler, reducing complexity and costs while, at the same time, extending the linear range of operation to more than 3 nm, covering many possible sensor variations. In addition, the ring laser topology provides higher power compared to the unpumped EDFs that are used for edge-filtering and also reduces the output half-power bandwidth, offering higher resolutions. Furthermore, by embedding a 1 × N optical switch, the proposed topology may be connected to several identical sensors [19] in order to evaluate multiple sensing points and temperature-reference sensors.
The paper is organized as follows: Section 2 comprises the system’s principle of operation and a theoretical investigation by means of a numerical model for validation of the principle and specific case studies. Section 3 describes the experimental setup and characterization of the most significant components. Finally, in Section 4, the operation of the device as a strain sensor interrogator is fully characterized and analyzed, considering potential application requirements.
2. Principle of Operation
The proposed interrogation technique exploits the quasi-linear slope of the amplified spontaneous emission (ASE) of an erbium-doped fiber (EDF) in a narrow spectral range between 1532 and 1537 nm and is explained by the sketch in Figure 1. The EDF is used as the gain element of a ring laser cavity, which also includes the FBG that can be used as a strain-sensing element. The FBG is connected to the cavity by means of a circulator and is chosen so that its central wavelength is in the linear region of the EDF emission (1532–1537 nm) and, therefore, determines the central emission wavelength of the laser.
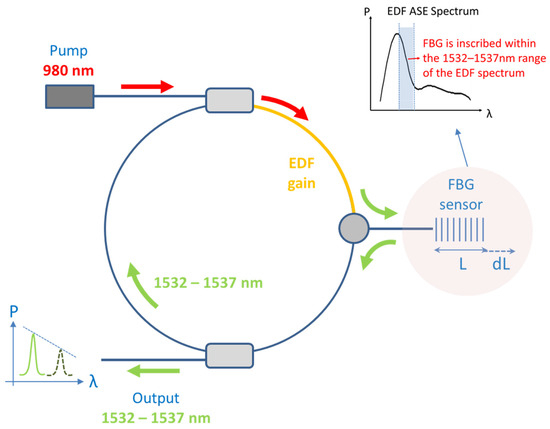
Figure 1.
Illustrative presentation of the unidirectional EDFL-based FBG sensor interrogation system.
Any strain or temperature-induced wavelength shift of the FBG shifts the laser emission wavelength as well and induces a linear variation in the cavity gain and, therefore, a linear variation in the laser output power. Therefore, the wavelength-encoded strain or temperature response of the FBG is transformed into a laser power variation, which can be trivially measured with a photodiode. In this manner, the system behaves similarly to an edge-filtering device without the main drawbacks of edge filters.
In order to verify that the system exhibits a linear response for EDFs with different doping concentrations, lengths, and pumping levels, we performed simulations based on the numerical model that is described in Appendix A herein. The model is based on gain saturation models for EDFs [20,21,22,23,24], including the pair-induced quenching phenomenon for high doping concentration [25,26,27] and the fitting of unknown parameters with experimental results. It is noted that only high-doping EDFs have been used to keep their length short and, at the same time, provide sufficient small-signal gains.
The model provides an efficient way to calculate steady-state values of critical parameters for the ring-laser topology in Figure 1 (e.g., saturated gain and output power), assuming the single-pass amplification of a signal through an EDF with specific characteristics. Each value of the EDF input power considered in this model corresponds to a value of the saturated optical power circulating in the EDFL cavity of Figure 1.
A typical simulation result is presented in Figure 2 and shows the calculated EDF gain versus the input signal power of five different wavelengths for a 62 cm long Er30 EDF with a pumping level of 60 mW. From this diagram, the output power of the EDFL sketched in Figure 1 at each wavelength can be extracted in a straightforward manner since it is equal to the input power value for which the loop gain of the ring cavity compensates for the loop losses. The specific example shown in Figure 2 assumes 7.65 dB of total loop losses in the EDFL ring cavity (horizontal dashed line) according to the experimental setup of Section 3 and results in output power levels marked with the vertical dashed lines. As clearly shown in the inset of Figure 2, the laser output power varies linearly with wavelength, leading to a linear system response.
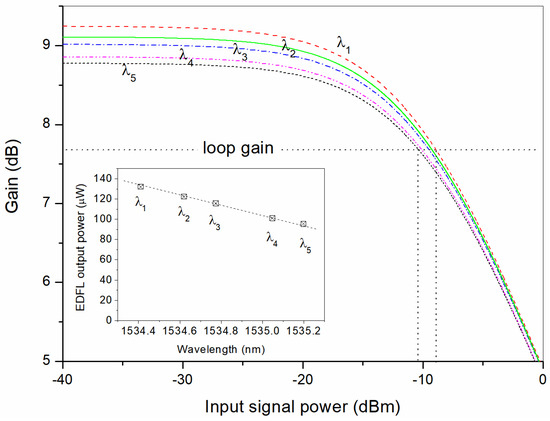
Figure 2.
Calculated gain saturation versus the input signal power for five different wavelengths for a 62 cm Er30 EDF with 60 mW pump power. Considering the 7.65 dB loop gain, the input signal is calculated for each wavelength and depicted in the inset.
In addition, the aforementioned model was used to provide some design rules with respect to setup parameters, such as the EDF’s doping, length, and pumping power, which affect the ring-laser’s output power.
Figure 3 presents a calculation example with a higher-doped EDF (Er110). The EDF gain is plotted versus the input optical signal power for two lengths of 40 cm (solid lines) and 47 cm (dashed lines) and two pumping levels of 75 mW (blue lines) and 90 mW (red lines). For input power higher than −25 dBm, the EDF length does not provide any significant gain difference. On the contrary, the pumping level (75 or 95 mW) affects gain significantly. Regarding the doping concentration of the two EDFs, there is no clear choice between the two examined. Lower doping requires a relatively longer length and less pumping, although it provides less small signal gain, which makes the laser ignition more difficult. In any case, there is a tradeoff between the loop losses, the EDF doping, and length, together with the required pumping power.
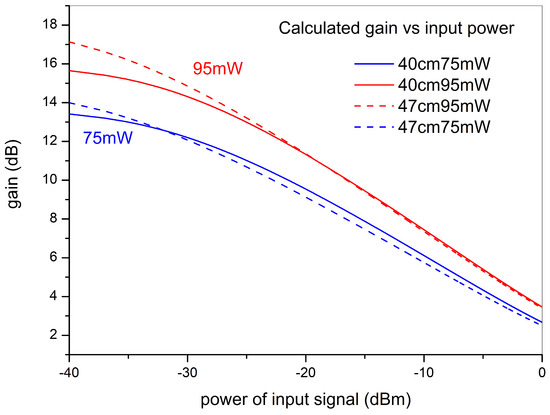
Figure 3.
Calculation of gain saturation vs. the input signal power for an Er110 EDF with lengths of 40 cm (solid lines) and 47 cm (dashed lines) and a pumping power of 75 mW (blue lines) and 95 mW (red lines).
3. Experimental Setup
The experimental setup used for the proof of concept of the proposed interrogator is sketched in Figure 4. The EDF is part of a unidirectional ring laser cavity and is pumped at 975 nm by a laser diode (Thorlabs PL980P330J) through a WDM combiner. An optical circulator imposes a unidirectional operation, whereas a fiber splitter sends a fraction of the cavity power to a photodiode for the measurement of the laser power or to a spectrum analyzer (Anritsu-MS9740A) for monitoring the wavelength shift. The strain sensing FBG is chosen so that its central wavelength is in the quasi-linear region of the EDF ASE emission (1532–1537 nm) and is connected to the cavity by means of the circulator, thus reflecting part of the cavity signal power back in the cavity.
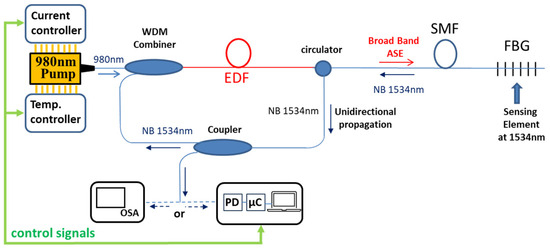
Figure 4.
Experimental setup of the FBG interrogator. PD: photodiode, μC: microcontroller, OSA: optical spectrum analyzer, EDF: erbium-doped fiber.
Considering the required strain-induced wavelength shift of the FBG for structural health monitoring applications, together with the width of the quasi-linear slope of the EDF, the FBG sensor for optimal operation should be inscribed with a central wavelength close to the center of the above region, which is close to 1534 nm and with an optimal bandwidth of 1–3 nm.
Since the laser power is expected to exhibit a linear response to the wavelength shift of the FBG for fibers of different doping concentrations, as mentioned in the previous section, for the experimental demonstration, we used a heavily doped single-mode fiber (Thorlabs, LIEKKI Er110-4/125) with an erbium-ion concentration of 6.6 × 1025 ions per m3. The high erbium-ion concentration was adopted in order to reduce the required length of the EDF while, at the same time, the high small signal gain compensated for the loop’s losses, as mentioned in the analysis of Section 2.
The FBG of Figure 4 was inscribed in-house using a UV laser emitting at 266 nm, a phase mask with a 1060 nm pitch, and a GF1 as photosensitive fiber. Figure 5 shows the power reflectivity spectrum of the inscribed FBG (red solid line), together with the theoretically calculated response (black dashed line) [28]. The FBG exhibits a peak power reflectivity of about 48% at a center (Bragg) wavelength of λΒ = 1534.1 nm and with a 1 dB bandwidth of about 80 pm. The length of the FBG is approximately 6 mm.
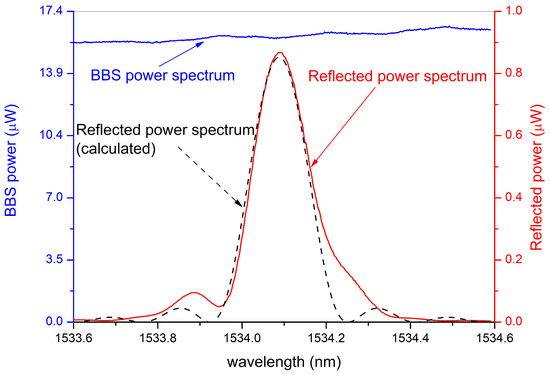
Figure 5.
Spectral reflected power from the FBG (red solid line), together with the broadband source (BBS) power spectrum (blue solid line) and FBG’s calculated spectral reflectivity (dashed black line).
Figure 6 depicts the spectrum of the ring laser for 75 mW of pumping power (solid blue line), along with the FBG bandwidth (solid red line). The laser power at the peak wavelength of 1534.1 nm is approximately 23 μW, which is in good agreement with the −16 dBm value predicted by the model for 8.2 dB of cavity loss (3.2 dB of FBG reflectivity and 5 dB residual loop losses) and 75 mW of pumping power (see Figure 3). Furthermore, the laser exhibits a significantly narrower spectrum compared to the FBG reflectivity bandwidth (20 pm and 80 pm bandwidth at −1 dB, respectively). The narrow linewidth, together with the high output power, leads, respectively, to the improved resolution and lower noise floor of FBG-sensing applications compared to systems that rely on other types of edge filters.
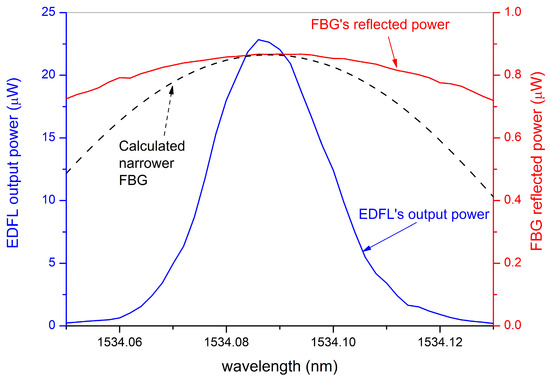
Figure 6.
Spectral output power of the ring-EDFL for 75 mW of pumping power (solid blue line), together with the FBG’s power-reflection spectrum (solid red line) and a calculated example of a narrower uniform FBG (dashed line) that is proposed in order to reduce mode hopping.
Nevertheless, this family of long cavity EDF ring lasers exhibits a strongly multi-longitudinal mode spectrum and suffers from the mode-jumping (or mode-hopping) phenomenon, which causes wavelength and optical power instability [29,30]. In our case, mode-hopping limits the resolution of FBG interrogation and needs to be addressed. To tackle this problem, a much narrower FBG with reflectivity at less than 50% should be used in order to act as a narrowband filter. An example is depicted in Figure 6 (dashed line), which could limit mode jumping at a range of approximately 20 pm around the center wavelength without significant variation in the laser power. This FBG can be implemented by increasing the inscription length of the grating and reducing the index modulation depth at the same time.
4. Characterization as a Strain Sensor Interrogator
In the last step, we evaluated the proposed technique as a strain-sensing interrogator using the setup in Figure 7. By applying a variable strain up to 1200 με to the FBG sensor, its center wavelength was red-shifted by more than 1 nm, and we recorded the laser power at the peak wavelength using a spectrum analyzer for two pumping levels of 75 mW and 95 mW (see Figure 8). The power versus wavelength-shift sensitivity (dP/dλ) of the device increases with the pumping level (8.8 μW/nm to 11.6 μW/nm for 75 mW and 95 mW pumping, respectively) and, consequently, the strain sensitivity increases from 1.38 μW/100 με to 1.79 μW/100 με for 75 mW and 95 mW pumping. Moreover, for both pumping levels, the system response remains linear, while any small fluctuations are mainly due to noise and residual mode-hopping effects. Finally, the dynamic range of the system is also affected by the pumping level since higher pumping leads to increased laser power and, therefore, a larger dynamic range before approaching the noise floor of the photodetector. Specifically, for our experimental conditions, the dynamic range for a pumping level of 75 mW was approximately 1300 με, while for 95 mW, the dynamic range exceeded 2000 με. The above results show that the pumping power critically affects both the resolution and the dynamic range of the proposed technique.
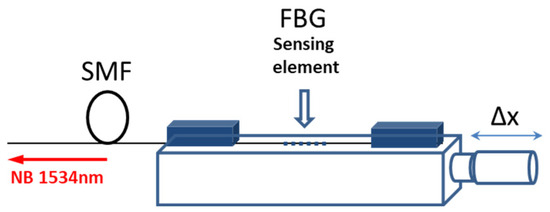
Figure 7.
One-dimensional stage for the axial elongation of the FBG element.
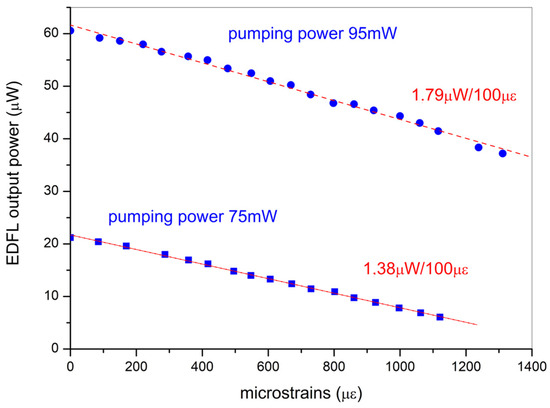
Figure 8.
Output power of the ring EDFL vs. the strain applied on the FBG for 75 mW (square dots) and 95 mW (round dots) of pumping power of the Er110 EDF, together with linear fitting.
Similar results were obtained with a 62 cm long EDF with a lower doping concentration (Er30). Figure 9 shows the laser power at the peak wavelength, as recorded with the optical spectrum analyzer, for various strain levels and a pumping power of 60 mW. The squares represent the calculated power values at the corresponding peak wavelengths, using the numerical model of Appendix A and considering a cavity loss of 7.65 dB (see also the inset of Figure 2). We remark again on the linear response of the output power to the strain-induced wavelength shift as well as the good agreement between the experimental and theoretical results. The sensitivity in this configuration example increases up to 7.22 μW/100 με due to the higher output power in comparison with the Er110 EDF.
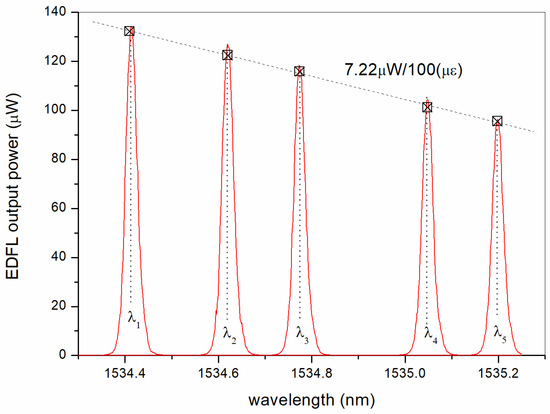
Figure 9.
Ring–EDFL emission spectra for Er30 EDF and 60 mW of pump power (red solid lines). The square symbols represent the corresponding theoretical calculation for each wavelength, while the linear fitting provides a sensitivity of 7.22 μW/100 (με).
Furthermore, a photodiode with an analog-to-digital converter (ADC), which is embedded in a low-cost microcontroller (which also controls the LD’s current and temperature), was employed in order to evaluate the accuracy and the resolution of the proposed method. With the previously used Er30 EDF, we plotted the output voltage versus the axial strain in Figure 10 (red data). For a strain range up to 1000 με, the sensitivity was approximately 200 mV per 100 με (R2 = 99.31%). However, we notice a fluctuation in sensitivity of approximately ±2.5%, which limits the resolution to approximately 20 με, which may fulfill applications with loose specifications and is mainly caused by mode-hopping. This value of the resolution is of the same order as that of other similar techniques (see, for example, [15,16]). An improvement in the resolution is expected by a narrower FBG, as was discussed in the previous section. In order to experimentally confirm this assumption, a 25% narrower FBG was used (inscribed in-house with a slight increase in the inscription length and a small reduction in the peak reflectivity). The corresponding results are depicted in Figure 10 (blue data). The calculated sensitivity is now 270 mV per 100 με (R2 = 99.79%), while the maximum fluctuation in sensitivity is less than 2%, which leads to a resolution better than 15 με. This improvement is mainly caused by a reduction in the mode hopping due to the respective reduction in the FWHM bandwidth. A further reduction in the FBG bandwidth improves the strain resolution and accuracy of the method down to the limit imposed by the stability of the pump power.
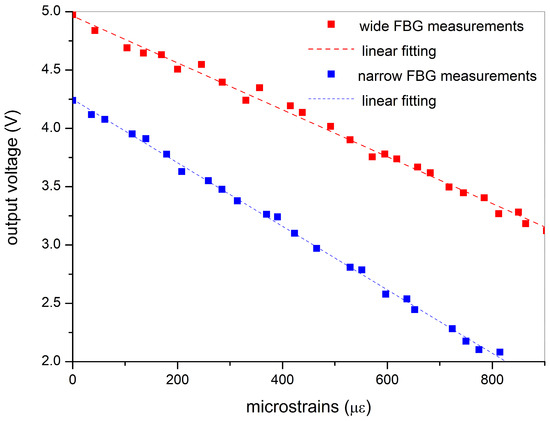
Figure 10.
The output voltage of an ADC that reads the photodiode’s photocurrent versus the axial strain applied on the FBG in microstrains. The red dotted line is the linear fitting for the measured data (square dots), while both the blue line and the blue square dots represent the measured data from a narrower FBG, together with their linear fit.
Finally, we evaluated the sensitivity of the system to environmental temperature changes. This is a crucial parameter for sensing applications because, due to the thermo-optic effect, temperature is expected to affect the reflectivity and the peak wavelength of the FBG. Specifically, the FBG (Bragg) wavelength increases with temperature while reflectivity decreases due to the change in the material refractive index. Both parameters lead to a change in the output power of the device, which can be falsely translated to strain-originating changes. In order to assess the temperature sensitivity of the device, we varied the FBG temperature, keeping strain constant, and we recorded the output spectra for several temperatures.
The results depicted in Figure 11 show that the temperature sensitivity is almost 2 μW per 10 °C, also providing a temperature sensing perspective, although in a simple manner compared to other low-cost interrogation techniques [31]. However, due to the high-temperature sensitivity, strain-sensing applications require a dummy (strain-free) identical FBG as a reference for temperature compensation. The reference FBG can be used not only to compensate for the temperature variations but the pumping power fluctuations as well. Moreover, the LD’s output power could be monitored and corrected accordingly through the adequate controller’s software. Nevertheless, each sensor’s calibration procedure, together with its reference FBG, should be conducted individually in order to determine the strain and temperature sensitivity.
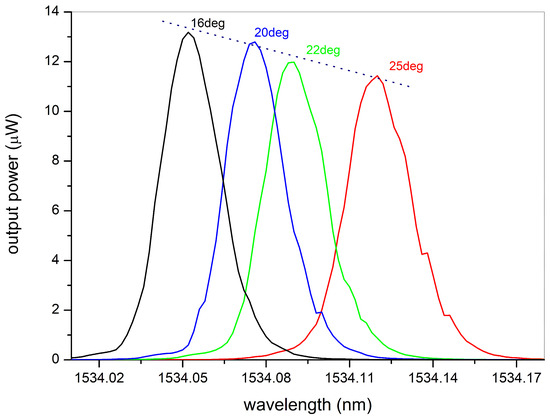
Figure 11.
Ring–EDFL topology emission spectra for 75 mW pumping power without any strain on the FBG and for temperatures from 16 to 25 °C.
5. Conclusions
An FBG sensor and interrogation techniques suitable for low-cost and small-scale sensing applications have been proposed. The interrogator is based on an EDFL in a ring cavity configuration, which comprises the FBG sensor as part of the cavity. The proposed configuration transforms the strain or temperature-induced wavelength shift of the FBG into a variation in the laser power, relying on the slope of EDF ASE between 1532 and 1537 nm, provided that a sensor with a central wavelength within this range is used. The topology has been evaluated for an FBG with a center wavelength of 1534.1 nm for several pumping powers and different EDF types and lengths. It is demonstrated theoretically and experimentally that for strain-induced wavelength shifts of the order of 1–3 nm, which are sufficient for structural health monitoring applications, the laser power varies linearly with the wavelength, thus leading to a linear system response. The main advantages of the technique include the easy and cost-effective implementation of high power levels thanks to the laser topology and an increased resolution with respect to edge filter implementations thanks to the narrow laser linewidth and tunable sensitivity. The device exhibits temperature sensitivity due to the sensitivity of the FBG sensors and requires compensation by means of an identical dummy FBG. Therefore, the simplest configuration utilizes a 1 × 2 optical switch with two identical FBGs, one of them acting as a reference sensor. Multiple sensors may be interrogated using multiple-port optical switches. The cost of the optical switches increases with the number of ports, limiting the application of this topology to small-scale applications.
6. Patents
A patent is pending for the technique presented in this paper.
Author Contributions
Conceptualization, N.A.S., I.S. and C.S. Methodology, software, formal analysis, investigation and writing—original draft preparation, N.A.S., C.L., I.S. and C.S. All authors have read and agreed to the published version of the manuscript.
Funding
This research received no external funding.
Institutional Review Board Statement
Not applicable.
Informed Consent Statement
Not applicable.
Data Availability Statement
Data presented in this work are available upon request.
Conflicts of Interest
The authors declare no conflicts of interest.
Appendix A
The core refractive index of an EDF is a complex number with its imaginary part representing the gain (if it is positive) or the loss (if it is negative) of the signal (which is assumed within the ASE spectrum), while, for the pumping wavelength, it is always negative due to the absorption of the pump from the Erbium ions [20,21]. It can be calculated through the state populations and the steady state equations for both wavelengths. Although the formalism described in [20,21] may be adopted, the ion cluster formation for heavily doped EDF requires modeling that includes the effects due to the interaction within ion pairs [22]. According to this model, the density of clustered ions is where is the total ion density in the core, is the number of ions in a cluster and is the percentage of ions in cluster form. Considering a two-level system, including the pair-induced quenching (PIQ) of the clusters, the steady-state solutions of the rate equations lead to the following [22]:
where is the density of single ions (), , while the absorption and emission rates , for the signal wavelength are given by the relations
Moreover, the pump rate at = 980 nm is
where h is the Plank’s constant and for the signal wavelength = 1534 nm, the emission and absorption cross-sections are = 3.24 × 10⁻²⁵ and = 3.69 × 10⁻²⁵ m2, respectively, and the absorption cross-section for the pump wavelength is = 2 × 10⁻²⁵ m2. Additionally, the overlap integrals are calculated as follows:
with
and 5 μ, 1, , 0.2. Moreover, A1 = 0.616, A2 = 1.66, A3 = 0.987, the doping concentration is 6.6 × 1025 ions/m3 and the spontaneous emission rate is A21 = 1/0.0103 s−1. Considering the input signal power and pumping power , the gain for the signal and the absorption of the pumping wavelength are given [20,21,22,23], respectively:
where the involved value of is determined experimentally and = 2 ions per cluster. For the calculation of the gain of an EDF with length L and the remaining pump power at the end of it, a numerical procedure should be applied. Particularly, we discretize the length L in small segments, as depicted in Figure A1.

Figure A1.
Segmentation of heavily doped EDF for gain and residual pumping calculation.
Figure A1.
Segmentation of heavily doped EDF for gain and residual pumping calculation.

The length of each segment has been selected to be so short that G and A may be considered constants throughout ΔL. For heavily doped EDF, in the gain saturation range, each segment is characterized by different gain and pumping powers. Using a recursive procedure, both the residual pump power and the final gain are calculated by the signal ratio . By a suitable experimental setup, the residual pumping power may be measured, and through the aforementioned calculation scheme, the input pumping power may be derived.
The proposed experimental setup is depicted in Figure A2 and may be used for the EDF’s gain saturation region as well. In Figure A2, a broadband source is shown in combination with a circulator and an FBG centered at the signal wavelength λs. An Erbium-Doped Fiber Amplifier (EDFA) device was employed in order to amplify the signal wavelength λs at a level from −40 dBm to −10 dBm. Moreover, the pumping level for the EDF under test ranged from 70 to 100 mW. For two levels of pumping power, 75 and 95 mW, the gain is depicted in Figure A3, where the input signal changes from a small signal (Pin(λs) = −40 dBm) up to almost −10 dBm.

Figure A2.
Experimental setup for the evaluation of the gain saturation versus the input signal power. The EDF is 47 cm long and heavily doped with Erbium.
Figure A2.
Experimental setup for the evaluation of the gain saturation versus the input signal power. The EDF is 47 cm long and heavily doped with Erbium.


Figure A3.
Experimental gain values (symbols) vs. input signal power for 95 mW pumping power (blue symbols) and 75 mW (red symbols). The fitted calculation curves for 95 mW (blue solid line) and 75 mW (red solid line) are depicted, according to the procedure described in the text.
Figure A3.
Experimental gain values (symbols) vs. input signal power for 95 mW pumping power (blue symbols) and 75 mW (red symbols). The fitted calculation curves for 95 mW (blue solid line) and 75 mW (red solid line) are depicted, according to the procedure described in the text.

Using the experimental values of Figure A3, we can calculate the small signal gain by applying (A8) and the segmentation calculation scheme and adjusting the value of k in order to coincide with the experimental ones. For the EDF of Figure A2’s experimental setup, and the values depicted in Figure A3, the value of k is estimated to be 15.6%, which is in the same order as the values referred to in the literature [25]. Moreover, the pumping power was calculated from the measured power at the end of the EDF and the segmentation technique of Figure A1. Next, the curve of the saturation gain was determined.
The gain saturation vs. the input power signal is provided by the calculation scheme of the steady state PIQ equations, but this rather corresponds to the intrinsic parameters than the experimental conditions [24,27]. A similar drawback appears at the gain calculation through the saturation power parameter [23,26]. Nevertheless, the PIQ model incorporates the cluster phenomenon and gives the potentiality to adjust the small signal gain according to the experimental results. On the other hand, the saturation parameter method provides the possibility to adjust the saturation according to the experimental conditions. Consequently, we adopted the PIQ model for the small signal gain and the estimation of k, but we had to follow the saturation parameter method for the approximation of the gain saturation vs. the input power signal.
For the application of the saturation parameter method, we defined the saturation power for the signal and pump as follows [20]:
where and . By introducing the normalized saturation power for the signal and pump, respectively, and , the gain and absorption relations are given as follows:
In (A12) and (A13), the normalized field profile of the fundamental mode at the center of the core was taken to be equal to one. Moreover, the small signal gain according to (A12), coincided with the small signal gain derived by (A8). However, (A12) did not feature any parameter that might include the PIQ phenomenon and the potential adoption of effective cross-sections in order to equate the small signal gains from both calculation schemes, which is a tedious and controversial procedure. Instead, a rather reasonable approach is to follow the gain saturation response given by (A12), normalized to the small signal gain, while adjusting the saturation power in order to fit the experimental results. In particular, by applying the segmentation procedure and reducing accordingly (i.e., to approximately 7.5% of the maximum value), the gain saturation is scaled to the small signal gain provided by the PIQ method.
Following this method, the fitting curves were derived, as depicted in Figure A3, for 47 cm Er110 and for 75 mW and 95 mW pump power, respectively. The saturation power is now approximately reduced to 7.5% of its intrinsic value.
Next, we repeated the aforementioned procedure for a lower doping-density EDF, such as the Er30 fiber, with 2.1 × 1025 ions/m3. The value of k was estimated to be 9%, while was reduced to 30% of its intrinsic value. Both parameters differ reasonably from those of the Er110 fibers since the cluster phenomenon is mitigated, whereas the is closer to its maximum (i.e., intrinsic) value, as anticipated [24,32].
In Figure A4, the experimental values for two pump powers are depicted, together with the corresponding fitting through the proposed model and for a 62 cm EDF. Although the small signal gain is less than that in the higher-doped EDF, the saturation is pushed towards a higher input power that consequently gives a higher output power from the ring topology. Nevertheless, its loop losses are less in order to ignite the laser operation.

Figure A4.
Experimental gain values (symbols) vs. input signal power for 90 mW pump power (red symbols) and 60 mW (blue symbols). The fitted calculation curves for 90 mW (red solid line) and 60 mW (blue solid line) are depicted according to the procedure described in the text.
Figure A4.
Experimental gain values (symbols) vs. input signal power for 90 mW pump power (red symbols) and 60 mW (blue symbols). The fitted calculation curves for 90 mW (red solid line) and 60 mW (blue solid line) are depicted according to the procedure described in the text.

The proposed method is applied for a unidirectional ring EDFL, such as that in Figure 1, with a circulator that forces the clockwise propagation direction. The output power is provided by the saturated gain vs. the input signal power, as depicted in Figure A3. By determining the ring losses (i.e., the losses from the couplers and the reflectivity loss from the FBG), the input signal power can provide the required gain that balances the losses and, therefore, corresponds to the output power. However, for higher output power or equivalently with less reflective FBG, a bidirectional operation can be adopted. The estimation of the output power for the bidirectional operation is rather more complicated, although its evaluation may be provided by a modified figure of merit.
References
- Lopez-Higuera, J.M.; Rodriguez Cobo, L.; Quintela Incera, A.; Cobo, A. Fiber Optic Sensors in Structural Health Monitoring. J. Light. Technol. 2011, 29, 587–608. [Google Scholar] [CrossRef]
- Tosi, D. Review and Analysis of Peak Tracking Techniques for Fiber Bragg Grating Sensors. Sensors 2017, 17, 2368. [Google Scholar] [CrossRef]
- Grattan, K.T.V.; Sun, T. Fiber Optic Sensor Technology: An Overview. Sens. Actuators A Phys. 2000, 82, 40–61. [Google Scholar] [CrossRef]
- Othonos, A.; Kalli, K. Fiber Bragg Gratings: Fundamentals and Applications in Telecommunications and Sensing. Phys. Today 2000, 53, 61–62. [Google Scholar] [CrossRef]
- Kashyap, R. Fiber Bragg Gratings, 2nd ed.; Academic Press: Burlington, MA, USA, 2010; ISBN 9780123725790. [Google Scholar]
- Díaz, C.; Leitão, C.; Marques, C.; Domingues, M.; Alberto, N.; Pontes, M.; Frizera, A.; Ribeiro, M.; André, P.; Antunes, P. Low-Cost Interrogation Technique for Dynamic Measurements with FBG-Based Devices. Sensors 2017, 17, 2414. [Google Scholar] [CrossRef] [PubMed]
- Lei, M.; Zou, W.; Li, X.; Chen, J. Ultrafast FBG Interrogator Based on Time-Stretch Method. IEEE Photon. Technol. Lett. 2016, 28, 778–781. [Google Scholar] [CrossRef]
- Shao, L.; Song, J.; Zhang, A.; He, S. Novel FBG Triangular Filter for Interrogating a FBG Sensor in Dynamic Strain Measurement. Optoelectron. Lett. 2006, 2, 336–338. [Google Scholar] [CrossRef]
- Kumar, S.; Ghorai, S.K.; Sengupta, S. Fiber Bragg Grating Sensor Interrogation Using Edge-Filtering with Long Period Grating Modulated Light Source. Opt. Quantum Electron. 2023, 55, 847. [Google Scholar] [CrossRef]
- Kieu, K.Q.; Mansuripur, M. Biconical Fiber Taper Sensors. IEEE Photon. Technol. Lett. 2006, 18, 2239–2241. [Google Scholar] [CrossRef]
- Bandyopadhyay, S.; Biswas, P.; Pal, A.; Bhadra, S.K.; Dasgupta, K. Empirical Relations for Design of Linear Edge Filters Using Apodized Linearly Chirped Fiber Bragg Grating. J. Light. Technol. 2008, 26, 3853–3859. [Google Scholar] [CrossRef]
- Romero, R.; Frazão, O.; Marques, P.V.S.; Salgado, H.M.; Santos, J.L. Fibre Bragg Grating Interrogation Technique Based on a Chirped Grating Written in an Erbium-Doped Fibre. Meas. Sci. Technol. 2003, 14, 1993–1997. [Google Scholar] [CrossRef][Green Version]
- Fallon, R.W.; Zhang, L.; Everall, L.A.; Williams, J.A.R.; Bennion, I. All-Fibre Optical Sensing System: Bragg Grating Sensor Interrogated by a Long-Period Grating. Meas. Sci. Technol. 1998, 9, 1969–1973. [Google Scholar] [CrossRef]
- Yucel, M.; Koyuncu, O. Design and Implementation of a Passive Edge Filter with High Bandwidth and Slope. Microw. Opt. Technol. Lett. 2019, 61, 2572–2578. [Google Scholar] [CrossRef]
- Tiwari, U.; Thyagarajan, K.; Shenoy, M.R.; Jain, S.C. EDF-Based Edge-Filter Interrogation Scheme for FBG Sensors. IEEE Sens. J. 2013, 13, 1315–1319. [Google Scholar] [CrossRef]
- Marrazzo, V.R.; Fienga, F.; Sito, L.; Beni, N.; Szillasi, Z.; Riccio, M.; Buontempo, S.; Irace, A.; Breglio, G. Experimental Tests of a Full Analog Fiber Optic Monitoring System Suitable for Safety Application at CERN. IEEE Trans. Instrum. Meas. 2023, 72, 7002408. [Google Scholar] [CrossRef]
- Marrazzo, V.R.; Fienga, F.; Borghese, A.; Remondini, E.; Schettini, C.; Cafarelli, L.; Laudati, A.; Cusano, A.; Irace, A.; Breglio, G. IoT Node Interrogation System for Fiber Bragg Grating Sensors: Design, Characterization, and On-Field Test. IEEE Trans. Instrum. Meas. 2024, 73, 2002008. [Google Scholar] [CrossRef]
- Yu, F.T.S.; Yin, S. (Eds.) Fiber Optic Sensors; Optical Engineering; Marcel Dekker: New York, NY, USA, 2002; ISBN 9780824707323. [Google Scholar]
- Tanaka, S.; Ogawa, T.; Yokosuka, H.; Takahashi, N. Multiplexed Fiber Bragg Grating Vibration Sensor with Temperature Compensation Using Wavelength-Switchable Fiber Laser. Jpn. J. Appl. Phys. 2004, 43, 2969. [Google Scholar] [CrossRef]
- Sunanda, S.; Sharma, E.K. Field Variational Analysis for Modal Gain in Erbium-Doped Fiber Amplifiers. J. Opt. Soc. Am. B 1999, 16, 1344–1347. [Google Scholar] [CrossRef]
- Stathopoulos, N.A.; Savaidis, S.P. Gain Calculation and Propagation Characteristics in Erbium-Doped Devices with Nonlinear Host Materials. Opt. Commun. 2008, 281, 80–89. [Google Scholar] [CrossRef]
- Myslinski, P.; Nguyen, D.; Chrostowski, J. Effects of Concentration on the Performance of Erbium-Doped Fiber Amplifiers. J. Light. Technol. 1997, 15, 112–120. [Google Scholar] [CrossRef]
- Giles, C.R.; Desurvire, E. Modeling Erbium-Doped Fiber Amplifiers. J. Light. Technol. 1991, 9, 271–283. [Google Scholar] [CrossRef]
- Desurvire, E. Erbium-Doped Fiber Amplifiers: Principles and Applications. Phys. Today 1995, 48, 56–58. [Google Scholar] [CrossRef]
- Teyo, T.C.; Leong, M.K.; Ahmad, H. Noise Characteristics of Erbium-Doped Fiber Amplifier with Optical Counter-Feedback. Jpn. J. Appl. Phys. 2002, 41, 2949–2950. [Google Scholar] [CrossRef]
- Bellemare, A.; Karbsek, M.; Riviere, C.; Babin, F.; He, G.; Roy, V.; Schinn, G.W. A Broadly Tunable Erbium-Doped Fiber Ring Laser: Experimentation and Modeling. IEEE J. Sel. Top. Quantum Electron. 2001, 7, 22–29. [Google Scholar] [CrossRef]
- Durak, F.E.; Altuncu, A. The Effect of ASE Reinjection Configuration through FBGs on the Gain and Noise Figure Performance of L-Band EDFA. Opt. Commun. 2017, 386, 31–36. [Google Scholar] [CrossRef]
- Stathopoulos, N.A.; Simos, I. Modelling of Non-Uniform and Fs-Laser Inscribed Fibre Bragg Gratings. Opt. Fiber Technol. 2022, 70, 102878. [Google Scholar] [CrossRef]
- Zhu, L.; Chen, Q.; Zhao, R.; Lou, X.; He, W. A Switchable Dual-Wavelength Erbium-Doped Fiber Laser Based on Saturable Absorber and Active Optical Fiber Ring Filter. Optoelectron. Lett. 2014, 10, 434–438. [Google Scholar] [CrossRef]
- He, W.; Zhu, L.; Dong, M.; Luo, F.; Chen, X. Stable and Tunable Narrow-Linewidth Erbium-Doped Fibre Laser Based on Polarization-Maintaining Fibre Ring Filter and PM-FBG. Laser Phys. 2014, 24, 125102. [Google Scholar] [CrossRef]
- Darwich, D.; Youssef, A.; Pisco, M.; Zaraket, H. Investigation of Low-Cost Interrogation Technique Based on Modulated Distributed Feedback Laser. IEEE Sens. J. 2020, 20, 2460–2466. [Google Scholar] [CrossRef]
- Saleh, A.A.M.; Jopson, R.M.; Evankow, J.D.; Aspell, J. Modeling of Gain in Erbium-Doped Fiber Amplifiers. IEEE Photon. Technol. Lett. 1990, 2, 714–717. [Google Scholar] [CrossRef]


Disclaimer/Publisher’s Note: The statements, opinions and data contained in all publications are solely those of the individual author(s) and contributor(s) and not of MDPI and/or the editor(s). MDPI and/or the editor(s) disclaim responsibility for any injury to people or property resulting from any ideas, methods, instructions or products referred to in the content. |
© 2024 by the authors. Licensee MDPI, Basel, Switzerland. This article is an open access article distributed under the terms and conditions of the Creative Commons Attribution (CC BY) license (https://creativecommons.org/licenses/by/4.0/).