Abstract
The resolution of an optical microscope is determined by the overall point spread function of the system. When examining structures significantly smaller than the wavelength of light, the contribution of the background or surrounding environment can profoundly affect the point spread function. This research delves into the impact of reflective planar substrate structures on the system’s resolution. We establish a comprehensive forward imaging model for a reflection-type confocal laser scanning optical microscope, incorporating vector field manipulation to image densely packed nanoparticle clusters. Both theoretical and experimental findings indicate that the substrate causes an interference effect between the background field and the scattered field from the nanoparticles, markedly enhancing the overall spatial resolution. The integration of vector field manipulation with an interferometric scattering approach results in superior spatial resolution for imaging isolated particles and densely distributed nanoscale particle clusters even with deep subwavelength gaps as small as 20 nm between them. However, the method still struggles to resolve nanoparticles positioned directly next to each other without any gap, necessitating further work to enhance the resolving ability. This may involve techniques like deconvolution or machine learning-based post-processing methods.
Keywords:
optical microscope; far-field super-resolution microscopy; label-free microscopy; interferometric scattering microscopy; reflection-type confocal laser scanning microscopy; vector field manipulation; vector diffraction focusing; point spread engineering; computational microscopic imaging; nanoparticle cluster detection 1. Introduction
The point spread function (PSF) is pivotal in optical imaging, acting as the depiction of a point source within a microscopy system. It plays a critical role not only in image formation but also in the subsequent image processing and in the determination of the system’s resolution limit [1]. The PSF is essential for reconstructing the image of micro- and nano-objects in linear and shift-invariant systems [2], such as far-field point-scanning microscopy. It also enables the extraction of an object’s structure from the captured image through deconvolution techniques [3,4]. Moreover, the PSF’s full width at half maximum (FWHM) serves as a measurable quantity for the spatial resolution. As a result, PSF engineering has emerged as a preferred method for enhancing imaging qualities [5,6]. This involves the integration of various specialized optical components [7,8,9,10,11,12,13,14] into the system, especially in the far-field domain of the sample space, to facilitate the control of waveform characteristics like polarization, amplitude, phase, and quantum aspects such as spin angular momentum (SAM) and orbital angular momentum (OAM).
There is evidence suggesting that modifying the near-field structure around a sample can change a microscope’s resolution. An example of this is using a photonic crystal to transform the evanescent waves produced by the object into modes that can propagate [15]. Replacing the microscope slide with a mirror to create local light field interference can also enhance the compression of the PSF in a confocal system [16]. Using a suitable cover glass can induce total internal reflection on the incident light’s side, ensuring that only the sample positioned within a subwavelength distance gets excited [17]. The improved resolution of microscopy methods mentioned relies on a distinct near-field background structure, primarily hinging on near-field interactions or local interference effects in the object space. Here, the background field is carefully managed to prevent it from impacting the imaging quality. Beyond this, another common strategy involves using the reflection or transmission of the background field from the substrate to interfere with the signal field emitted by the excited nanostructures. This approach allows for the detection of nanoparticles smaller than the resolution limit under coherent illumination microscopy, despite being subject to the Abbe diffraction limit. This technique is generally known as interferometric scattering microscopy (iSCAT) [18,19].
In most practical microscopy systems, the reflection or transmission of the background from a planar structure should not be overlooked, except in cases involving fluorescence-labeled measurements or nonlinear optical effects. These exceptions allow the signal field to be differentiated from the background field due to its unique spectral characteristics [20]. Alternatively, one can design a specialized illumination and imaging system that separates the signal light field from the background within a specific spatial area, similar to the approach used in dark-field microscopy [21]. Direct measurement in optical microscopy offers significant advantages, as it avoids chemical contamination from fluorescence labeling and eliminates strict requirements on material selection and excitation conditions. However, strategies to differentiate the signal field from the background field in the spatial domain typically result in a trade-off, often sacrificing spatial resolution.
This research aims to explore how a reflective substrate affects the resolution of a coherent illumination far-field super-resolution optical microscopy system. The focus is on sub-resolution nanoparticles, which are smaller than the effective excitation light spot. These nanoparticles can be considered dipole particles in accordance with Mie theory [22,23]. The forward theoretical imaging model will address the intricate interactions between the excitation light field, nanoparticles, and substrate within the sample space, alongside light field manipulation during both far-field illumination and detection processes. A comprehensive explanation of the system and a complete forward imaging model, incorporating far-field PSF engineering and near-field light–matter interaction, will be elaborated for imaging point-shaped nanoparticle samples. Numerical analysis, rooted in the comprehensive full-path vector imaging theory, will be performed to examine the imaging outcomes for single-dipole nanoparticles at varying depths in the excitation light field and against different planar substrate materials. This research aims to provide profound insights into the principles of iSCAT label-free super-resolution imaging, thereby offering valuable guidance for future experimental inquiries in this domain.
2. Super-Resolution Microscopy System
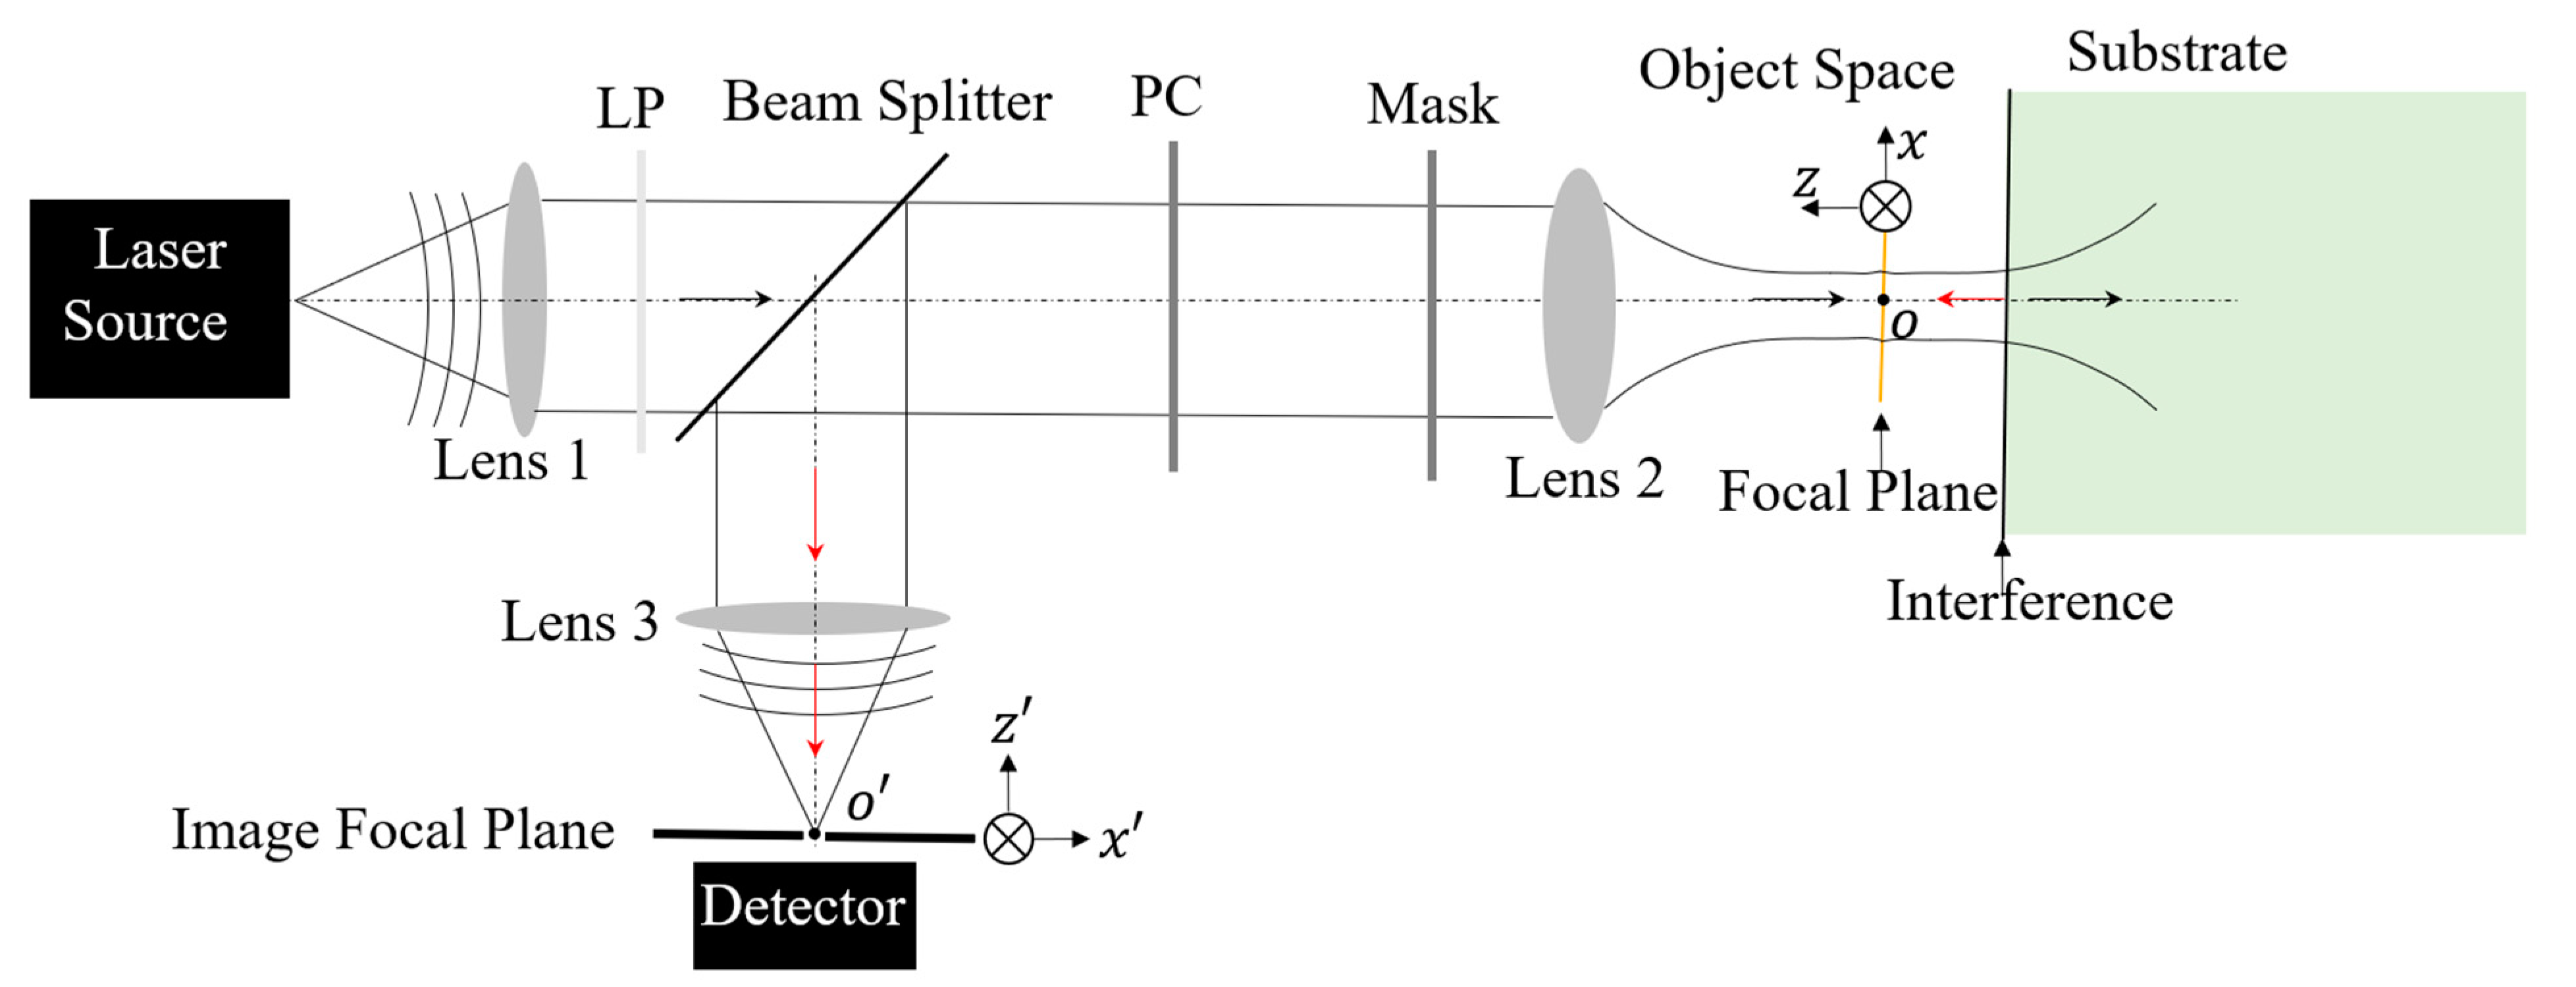
Confocal laser scanning microscopy (CLSM) stands as a pivotal instrument in microscopic research, offering significantly enhanced resolution compared to wide-field microscopy [24]. The far-field super-resolution optical microscopy investigated in this study, depicted in Figure 1, is an inverted configuration of CLSM. To exceed the Abbe diffraction limit inherent in confocal microscopy, radially polarized (RP) light, coupled with wavefront shaping, is introduced into the illumination system. This approach, when focused through a high numerical aperture (NA) objective, enables the generation of a deep subwavelength excitation light spot, accompanied by an extensive depth of focus [7,9,14,25,26]. In order to enhance the axial resolution [16,27], a reflective substrate is proposed to replace a transparent substrate in the super-resolution system. The local interference effect created by the interplay between the incident-focusing light field and the reflected beam plays a critical role in altering the characteristics of the effective excitation light. This modification results from the backward propagating field emanating from the sample, due to complex light–matter interactions, which is captured by the same objective lens used for illumination. The light entering the inverted detection system is then subjected to Light Field Modulation (LFM) via optical components located in the path of the illumination light, between the beam splitter and the objective lens. These LFM components, such as the polarization converter (PC) and the wavefront shaping mask, adjust the characteristics of the detection light field. After modulation, this light is focused onto the image focal plane, having been reflected by the beam splitter. This process of LFM applied to the detecting light fields contributes to achieving a resolution in the detection system that surpasses the traditional diffraction limit [8,28].
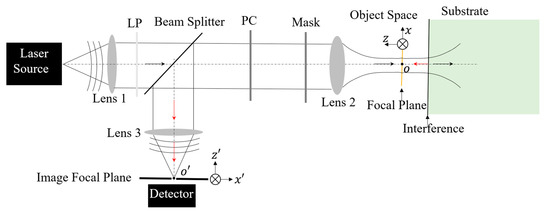
Figure 1.
Schematic diagram of a reflective substrate-enhanced super-resolution optical microscopy system. A laser source is employed and located at the front focal plane of Lens 1. The light emitted by the laser is collected by Lens 1 and then refracted into the direction of the optical axis. To obtain a pure linearly polarized light field for the subsequent LFM, a linear polarizer (LP) is inserted prior to the beam splitter. Lens 2 is an objective lens with a high magnification factor and high NA for tightly focusing the manipulated illumination light beam and collecting the responding field from the sample with a light ray angle as large as possible for higher resolution. Lens 3 is positioned away from the image pinhole with a focal length so that it allows the focused field to enter into the pinhole.
3. Computational Imaging Theory
To theoretically characterize the far-field illumination and detection processes, both vector LFM and vector diffraction theory are incorporated into the derivation of the PSF. The PSF for the illumination system illustrates how a point laser source affects the focal plane. The emitted light from this point source undergoes vector LFM, leading to a focused excitation light spot that surpasses the diffraction limit. Nanoparticles within the field of view emit a scattered field, which is then captured by the same objective lens used in the inverted imaging optical system setup. The reflective substrate beneath the nanoparticles reflects both the nanoparticles’ scattering field and the excitation light field that has passed through the nanoparticles. This reflected light field re-excites the nanoparticles, regardless of whether its origin is the nanoparticles’ scattering or the initial illumination field. This intricate cycle of light–matter interactions, involving both the excitation of nanoparticles and reflection from the substrate, repeats multiple times in theory, contributing to the complex dynamics observed in the system [29]. The local induced field within and surrounding nanoparticles, whose sizes are smaller than or comparable to the wavelength of the incident radiation, can be calculated using various methods, including the finite-difference time-domain (FDTD) method [30], the discrete-dipole approximation (DAA) approach [31,32,33,34], the Lippmann–Schwinger equation [35,36], and the Mie theory [37,38]. To streamline the explanation of the imaging theory for this microscopy system, one can initially derive the detection point spread function (PSF), which represents the response image field of a dipole source positioned at the focus of the objective lens. Subsequently, the imaging of any excited nanoparticle(s), which can either be approximated as a single dipole source or broken down into multiple dipole sources, can be achieved through the superposition of the image field from each dipole. This is conducted using the image reconstruction methods specific to CLSM [22,39]. The theory underpinning forward computational imaging for reflective substrate-assisted optical microscopy encompasses several key steps: deriving the effective excitation field; calculating the induced dipole(s) on the nanoparticle(s); deriving the detection PSF influenced by the substrate; and ultimately, expressing the image field resulting from the reflected incident excitation field.
In a typical setup where a sample is in free space, the excitation field is often regarded as the tightly focused field produced by the objective lens. This condition is generally achieved by preparing the target object sample with a matched cover slip, object slide, and immersion liquid to optimize imaging. However, in the context of the sample investigated in this work, it is crucial to consider not only the incident-focusing field but also the reflected illumination field [18,29,40]. Thus, it can be expressed as
Here, denotes the position vector in object space around the focal plane, and the Cartesian coordinate system’s origin point is positioned at the intersection point of the optical axis and the focal plane. and , respectively, represent the incident-focusing vector light field and the reflected ones. Therefore, by modifying the reflection properties of the substrate, the characteristics of the effective excitation light field can be significantly changed. The volumetric focused vector light field of a radially polarized illumination light beam, when subjected to various wavefront shaping methods [9,26,41,42,43,44], is typically represented in integral form over spatial coordinates [44]. The integral operation often leads to cumbersome and inefficient computations. To enhance both calculation efficiency and flexibility, it is recommended to express the focusing field in terms of its Fourier transform, incorporating a further transformation process between real space and k-space [45]. In this study, the frequency spectrum expression for the focusing field within the microscopy system is utilized. Section S1 of the Supplementary Materials offers a comprehensive mathematical breakdown of the vector Light Field Modulation (LFM), diffraction focusing, and reflection behavior, along with the associated derivations and the final formulation of the effective excitation field.
If the induced dipole(s) on the nanoparticle(s)’ local position is assumed to have the susceptibility of , then under the linear excitation mode, the corresponding dipole moment is proportional to the substrate-assisted effective excitation field, written as is the vacuum permittivity constant.
Then, combining the Dyadic Green function (DGF) tensor of the far-field detection imaging system that is assumed to satisfy the linear and shift-invariant principle, the single-shot image field of any induced dipole moment on the nanoparticle(s) can be expressed as
where represents the position vector on the confocal image plane; denotes the permeability of vacuum; is the angular frequency of the light wave; and , respectively, denote the position vector in object space and image space in the transverse plane and the longitudinal plane; and and , respectively, stand for the magnification times of the inverted microscopy system in lateral and longitudinal directions. The detection Green function tensor is a tensor, the first to third columns in this tensor denote, respectively, the response image field of the induced dipoles oriented along the x-, y-, and z-axes. Unlike detecting point sources in free space, the far-field radiation detected from a dipole located above a reflective substrate combines its own radiation field in the upper half-space and the reflections of its radiation field in the lower half-space by the substrate. The detailed step-by-step derivation process of the substrate-assisted DGF tensor is presented in Section S2 of the Supplementary Materials. The expression for DGF for a vector dipole above a reflective substrate is derived to have a similar form as that for a free-space dipole as presented in our previous published paper [46]. In this study, the impact of a reflective substrate is taken into account. Consequently, the characteristics of the substrate also modify the dipole’s response field on the image focal plane.
The total image field on the confocal image plane for a single shot can be expressed as the coherent superposition of the image field of the induced dipole(s) and that of the reflected focal spot (FS).
Since the same detection system images both the scattering field and the reflected background field, deriving the reflected image field of the focal field is similar to that of the dipole radiation field, with the only change being the substitution of the dipole’s radiation field with the reflected focal field. A detailed explanation is available in Section S3 of the Supplementary Materials. Notably, the image field for the reflected background field contains only polarization components along the x-axis.
Finally, the image field detected via the pinhole for any scanning position in the sample can be denoted as
where stands for the transmission function of the pinhole. Therefore, combining Equations (1)–(5), the reconstructed image field in this CLSM can be written as
where denotes the total Dynamic Green function, the reconstructed image field for a vector dipole scanning through the excitation field, which can be calculated by the following formula:
Based on the theoretical framework and detailed expressions for the far-field PSF engineering, as well as the near-field substrate-manipulated excitation light field and detection DGF tensor, a comprehensive forward imaging theory model is established. This model uses the approximation of dipoles for the nanoparticles. When considering the illumination from a point laser source, the derived excitation field on the nanoparticles can be treated as the excitation PSF.
4. Numerical Analysis on Vectorial PSF
4.1. Excitation PSF
To enhance the resolution within the visible light spectrum for this microscopy system, achieving higher resolution involves setting the working wavelength of the point laser source to the shortest possible value and the numerical aperture (NA) of the objective lens to the highest feasible level. In this study, a 405 nm working wavelength is used, along with an oil-immersed objective lens featuring an NA of 1.4. To ensure the system operates in far-field mode, the objective lens serves both focusing and detecting purposes, boasting a long working distance of 137 μm—significantly greater than the working wavelength. An annular aperture acts as the wavefront shaping mask, blocking the paraxial portion of the RP light from reaching the object space. Thus, only the remaining off-axis RP light beam with a large focusing angle is permitted to illuminate the sample. In the transverse plane before the objective lens, the inner boundary of the RP light field, shaped by the annular aperture mask, is positioned at a distance from the optical axis equivalent to 0.85 of the aperture radius of the objective lens.
The simulated results for the excitation PSF under these conditions are shown in Figure 2a–c, illustrating scenarios in a homogeneous space and with a silicon (Si)/silver (Ag) substrate at the focal plane, respectively. It is observed that the effective excitation field above a substrate along the z-axis significantly diverges from that in a homogeneous isotropic medium. The depth of focus is approximately 8.3 times the size of the lateral focal spot in free space, as depicted in Figure 2a. Introducing a reflective substrate at the focal plane dramatically changes the longitudinal light field distribution, due to the local interference effect. This creates a series of hot spots along the optical axis, as shown in Figure 2b,c. The axial light field contrast (saddle-to-peak ratio) is substantially higher when on a Ag substrate compared to a Si substrate.

Figure 2.
The field intensity distribution along the XZ-plane, as well as the corresponding profile along the focal plane (right-side sub-image) and along the optical axis (below sub-image), while focusing (a) in homogeneous oil space, (b) with a silicon substrate, and (c) with a Ag substrate below the focal plane (). The intensity for the free-space excitation field is normalized to 1. The excitation field intensities for that with a Si and Ag substrate are represented as relative intensity to that in free space.
4.2. Detection PSF
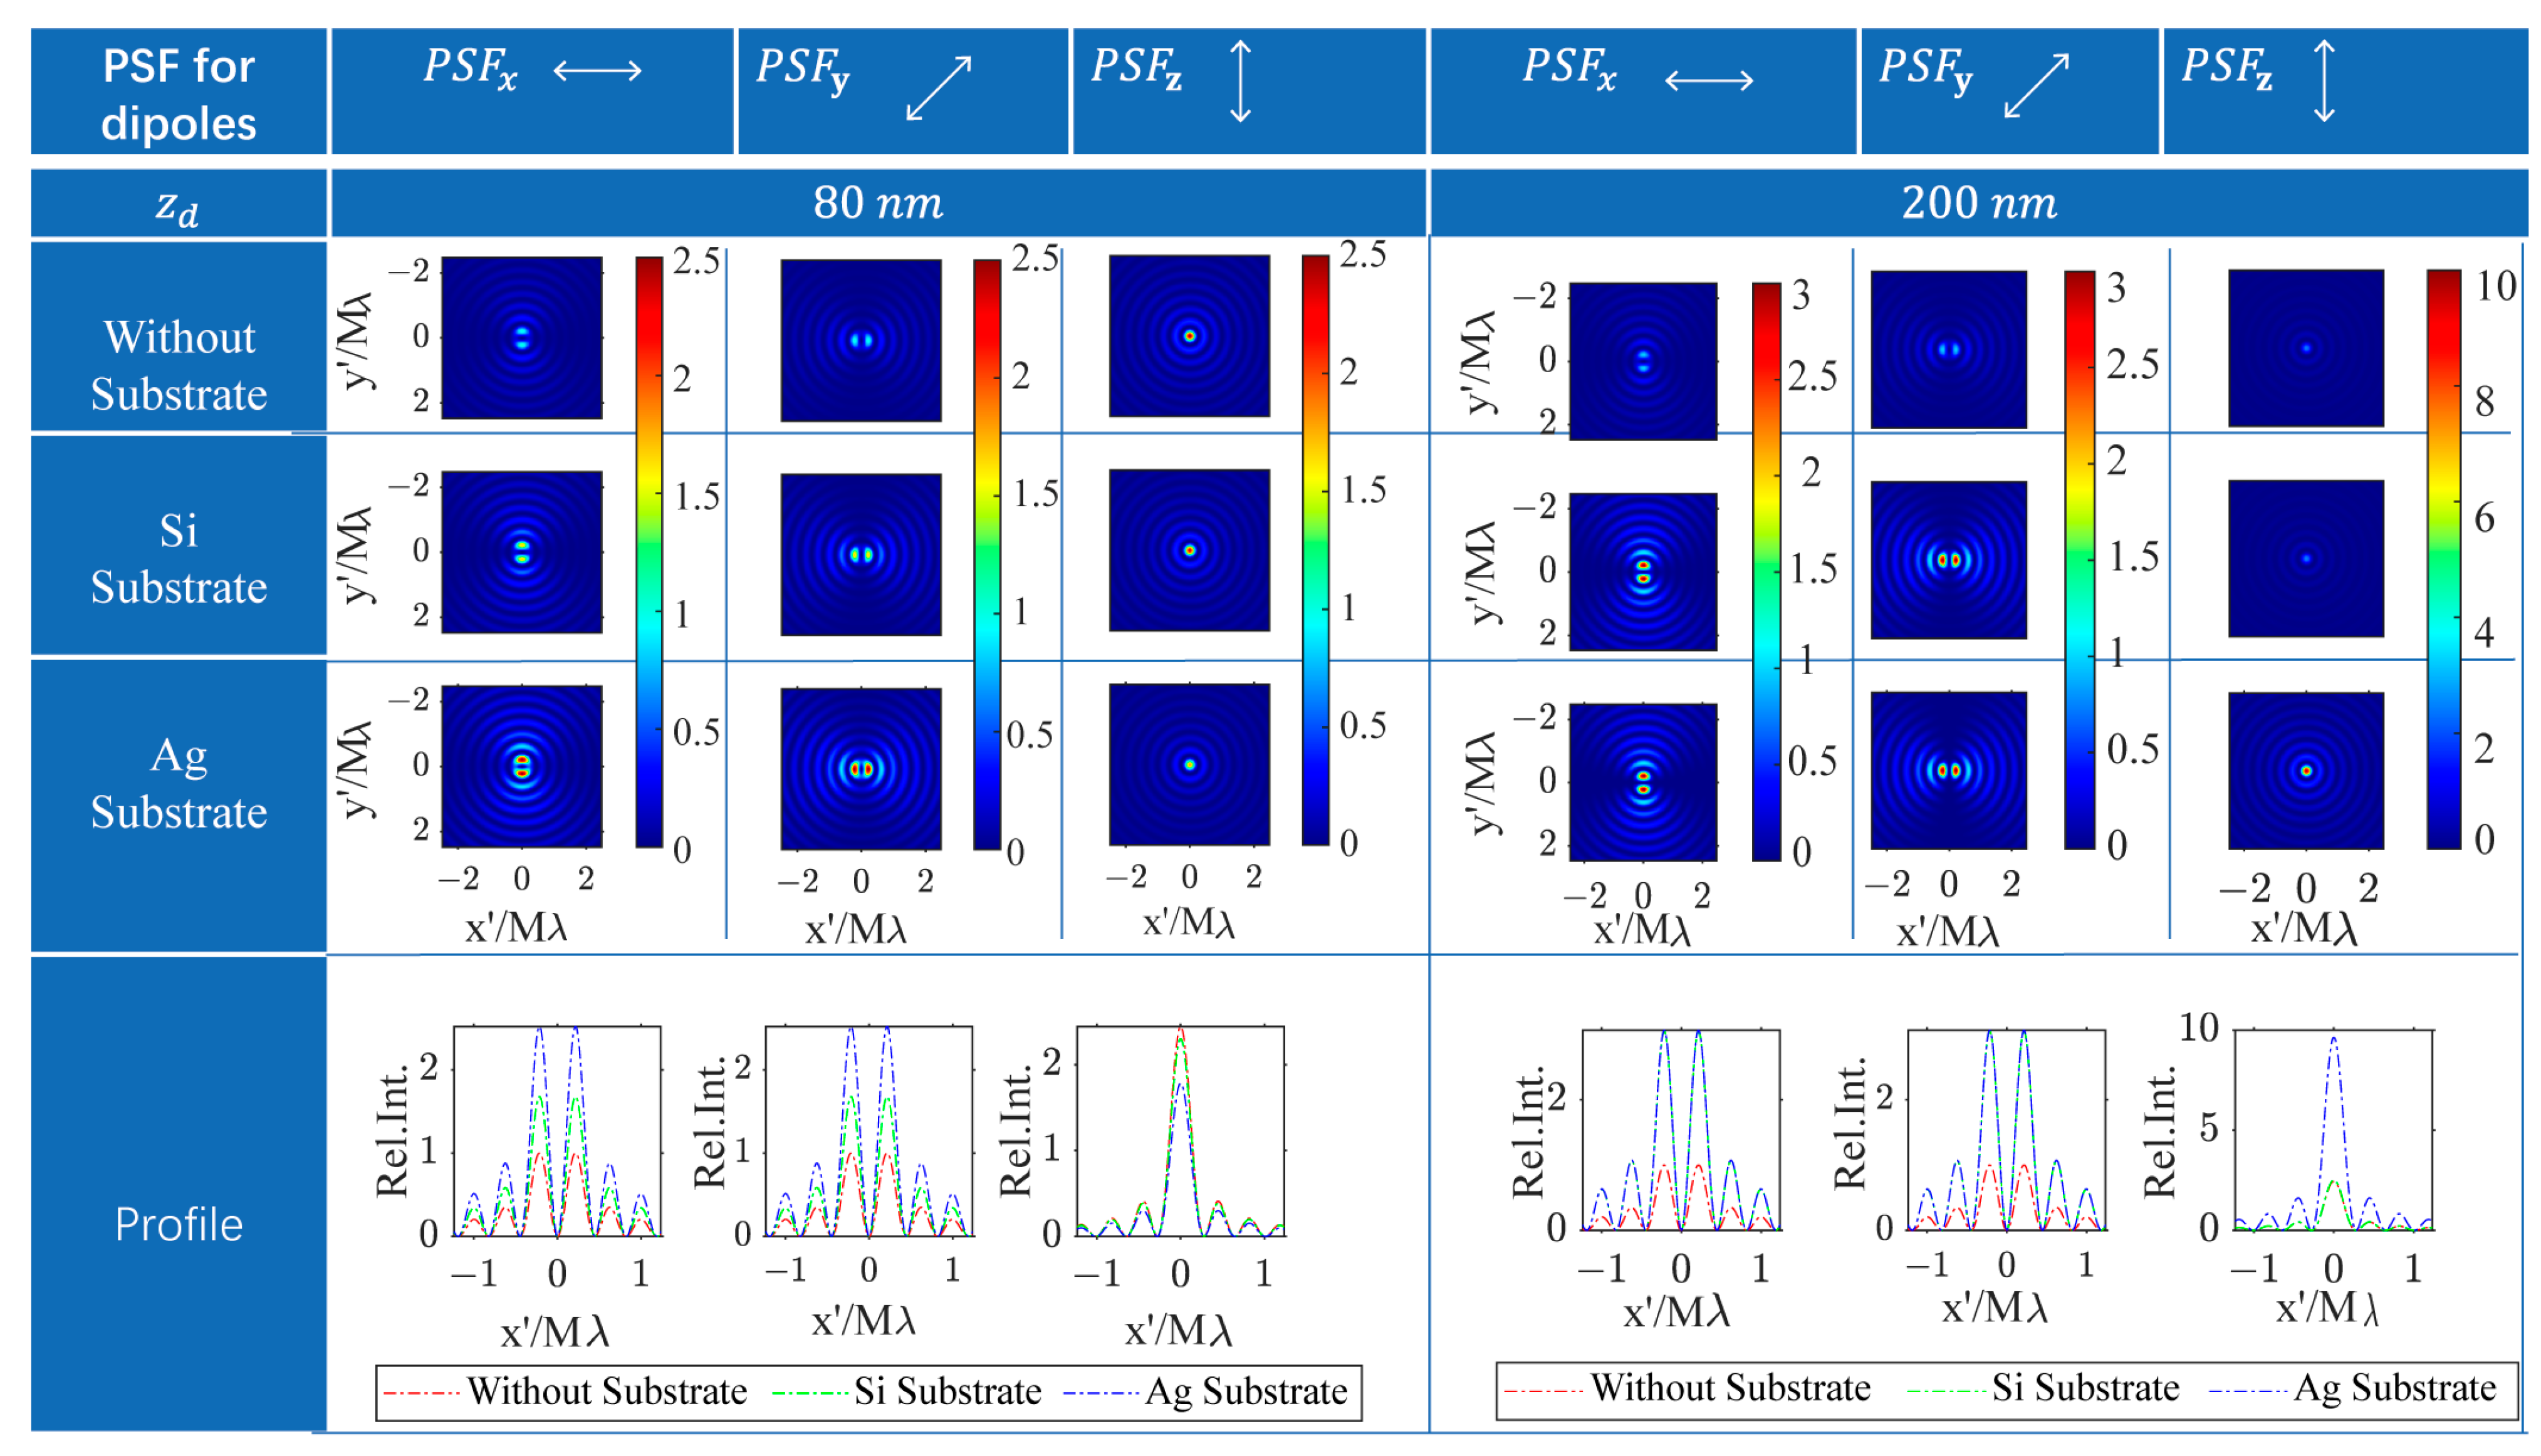
Based on the mathematical formulation of the DGF tensor, the responsive light field on the confocal image plane for arbitrarily oriented dipoles comprises only the transverse x-polarized and y-polarized light field components, excluding the axial polarized light field component. The PSF for dipoles with unit amplitudes along the x-, y-, and z-axes, respectively, denoted as , , and . Each one is the superposition of the all-transverse components. Figure 3 illustrates the numerically calculated PSFs for dipoles positioned above the substrate with gaps of 80 nm and 200 nm to compare the response image patterns of dipoles at different depths across three distinct planar substrate conditions. The PSF patterns for the x- and y-oriented dipoles, regardless of depth positions and substrate types, all display two bright spots symmetrically positioned around their respective symmetry axes, separated by a dark center. Additionally, the patterns for x- and y-oriented dipoles can be interchanged by rotating them by 90 degrees. In contrast, the PSF patterns for z-oriented dipoles above various substrates exhibit rotational symmetry with a central bright spot. The PSF pattern characteristics of differently oriented dipoles with substrates are akin to those of vector dipoles in a homogenous space, as observed under this super-resolution microscopy technique [46].
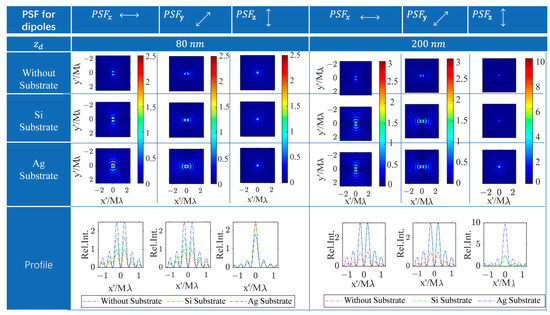
Figure 3.
The PSFs for x/y/z-dipoles in homogeneous space and with a Si or Ag substrate appeared at the focal plane. The responding images resulting from dipoles located at and away from the focal plane are compared. The PSF intensity for the free-space lateral dipole is normalized to 1. The intensity of all PSFs in other situations is represented as relative intensity to that of the PSF for the free-space lateral dipole.
The PSF intensity patterns for dipoles oriented differently are all altered by the planar substrate compared to in a homogeneous space. For a dipole 80 nm above the focal plane, the PSF intensities for transverse dipoles (x and y orientations) are increased with both Si and Ag substrates, while the intensity for the longitudinal (z-oriented) dipole decreases, especially with the Ag substrate exhibiting a more significant effect. Conversely, for a dipole 200 nm above the substrate, the variations in PSF intensity for transverse dipoles with Si and Ag substrates are similar, but the changes in PSF intensity for the z-dipole are markedly different. Specifically, the PSF intensity for a z-dipole remains almost unchanged on the Si substrate, whereas it experiences nearly a threefold increase on the Ag substrate.
The numerical simulations and their analysis clearly show that under this super-resolution microscopy system, the pattern distribution of the PSF for a z-dipole remains largely consistent, unaffected by the substrate’s properties. Conversely, the pattern distribution of the PSF for lateral (x- and y-oriented) dipoles rotates according to the dipole’s orientation. Moreover, the PSF intensity for dipoles of almost any orientation is influenced to some extent by the planar substrate’s characteristics and varies with the dipole’s depth. Thus, analyzing the PSF in terms of both pattern and intensity reveals that the resultant image will be impacted by the dipole source’s nonlocal background environment.
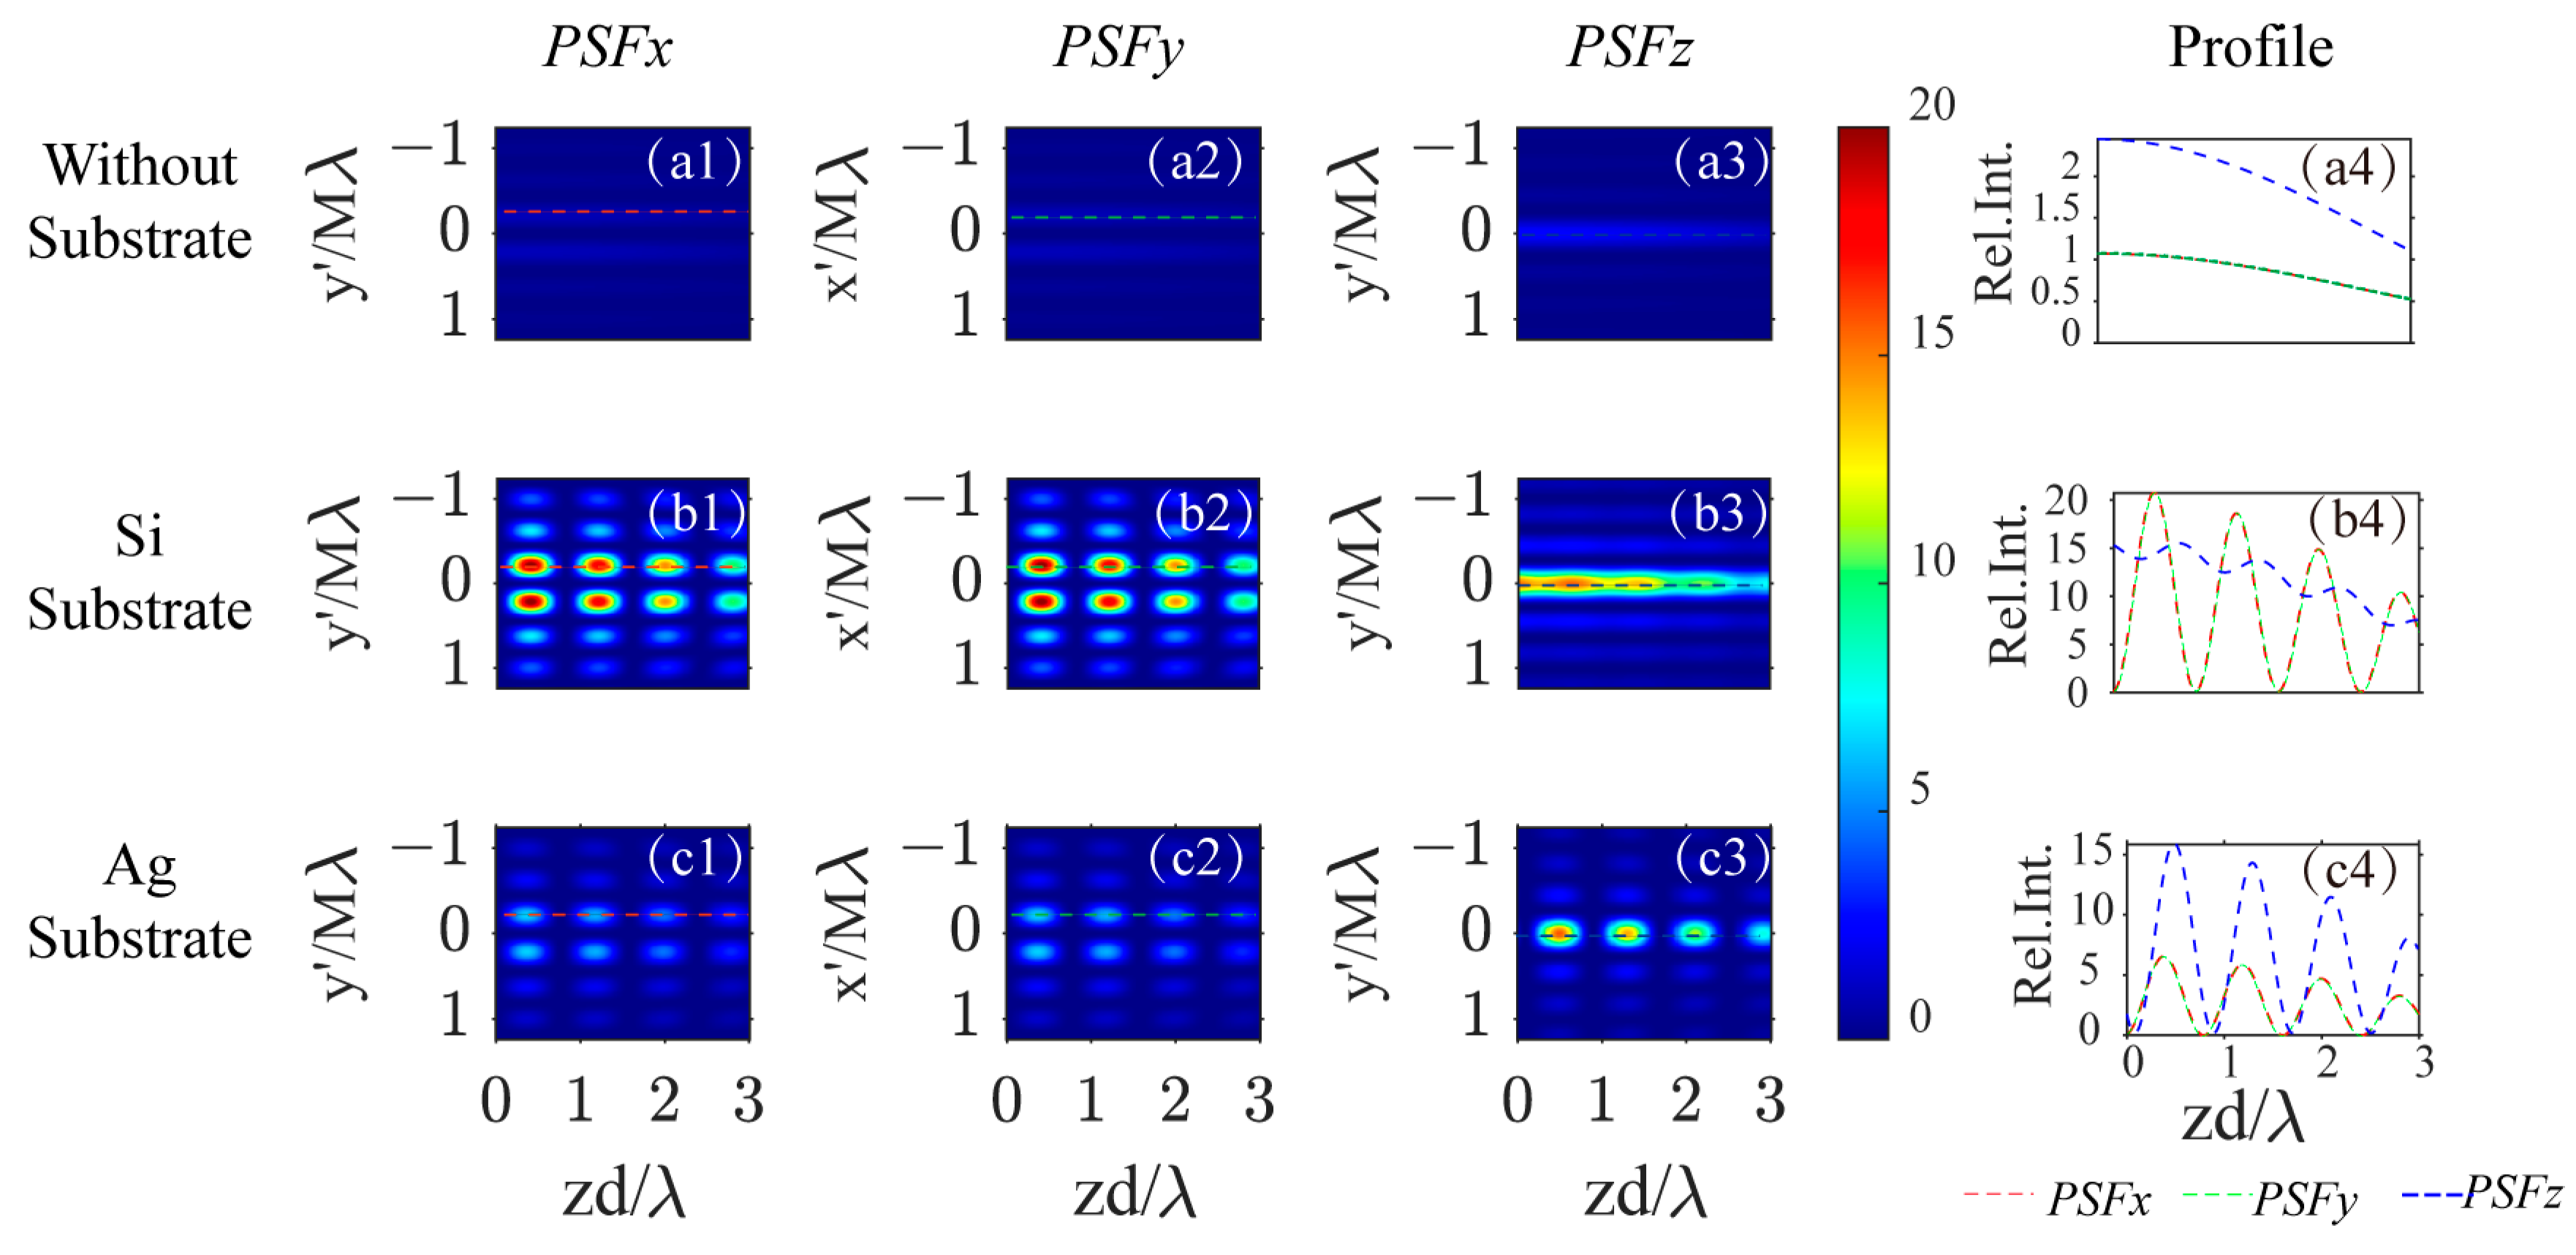
Figure 4 illustrates how the PSFs change with the depth of the dipole in different backgrounds. The first three rows show the cases without a substrate, with a Si substrate, and with a Ag substrate. The profiles of the PSFs for x-, y-, and z-dipoles along the -axis in image space as the dipole’s depth varies in the excitation field are presented in Figure 4(a1–a3) for no substrate, b1–b3 for a Si substrate, and d1–d3 for a Ag substrate. The peak intensity profiles for , , and are represented by red/green/blue curves in Figure 4(a4,b4,c4) for the three background scenarios.
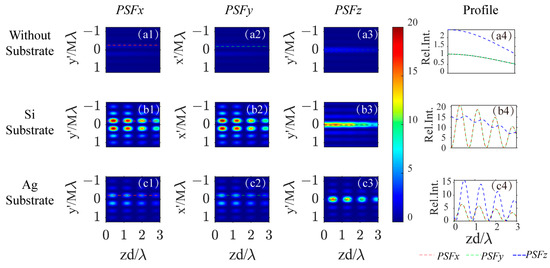
Figure 4.
The PSF profile on the image plane varies with the dipole’s depth position , for x-, y-, and z- oriented dipoles (from the first column to the third column) and three different backgrounds: no substrate (first row), Si substrate (second row), and Ag substrate (third row). The fourth column indicates how the PSF peak intensity varies with the dipole’s depth position. (a1–a3): the PSF profile vary with dipole’s depth position for x-/y-/z- oriented dipoles in free space, (a4): the profile along the red/green/blue dotted line labeled in image (a1–a3); (b1–b3): the PSF profile vary with dipole’s depth position for x-/y-/z- oriented dipoles above a Si substrate, (b4): the profile along the red/green/blue dotted line labeled in image (b1–b3); (c1–c3): the PSF profile vary with dipole’s depth position for x-/y-/z- oriented dipoles above a Ag substrate, (c4): the profile along the red/green/blue dotted line labeled in image (c1–c3).
As the depth of the dipole increases, the strength of the PSFs gradually decreases in free space, as depicted in Figure 4(a4). The introduction of a reflective substrate at the focal plane leads to periodic variation in PSF strength depending on the dipole’s depth position, due to the interference between the dipole’s radiation field and its reflection, as illustrated in Figure 4(b4,c4). The variation in PSF strength for transverse dipoles above a silicon substrate is more pronounced than for longitudinal dipoles. In contrast, with a Ag substrate, the variations are greater for longitudinal dipoles compared to transverse ones. This phenomenon is attributable to the reflection characteristics of the substrate, which are intimately linked to the polarization state of the incident light. Consequently, the imaging capabilities of this substrate-assisted super-resolution optical microscopy system are influenced by the optical properties of the substrate, as well as by the orientation, amplitude, and depth of the induced dipole(s) within the focusing field.
4.3. iPSF
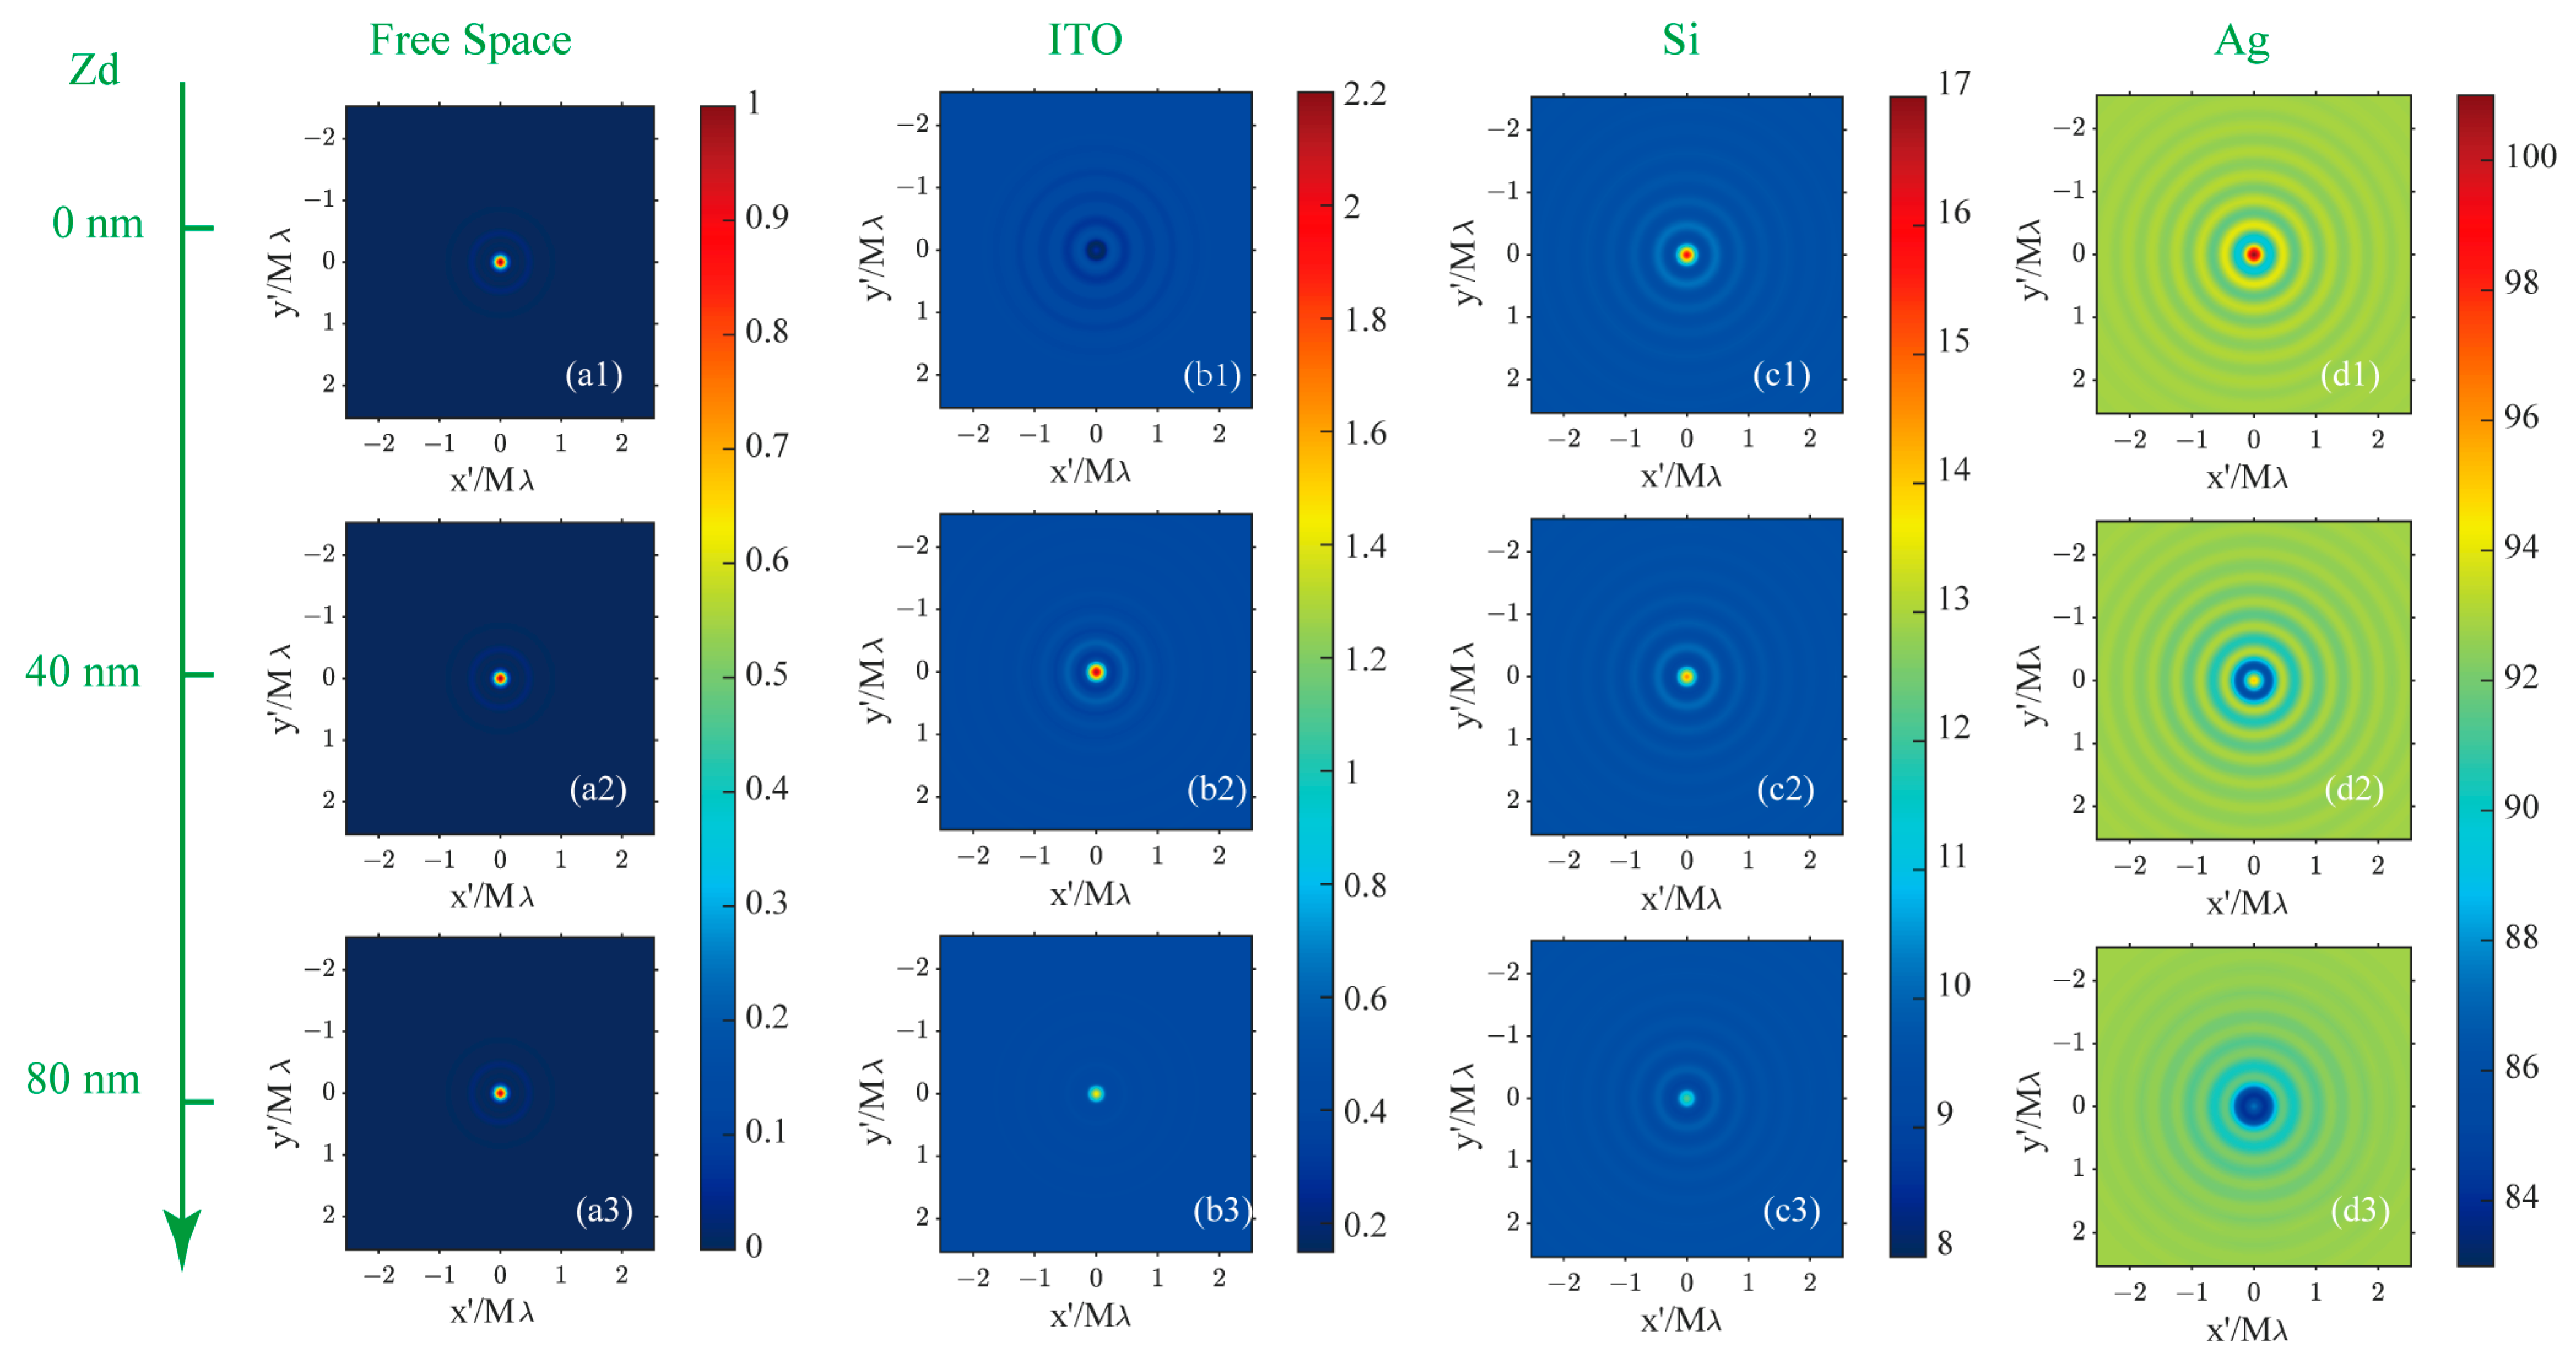
The iPSF is defined as the interferometric scattering image of a point source in a substrate-assisted CLSM. The iPSF for a point source at various positions relative to the focal plane and against different backgrounds is simulated to showcase the impact of a reflective substrate on the imaging properties of dipole nanoparticles. The patterns and profiles of the iPSF are presented in Figure 5 and Figure 6, where the first to fourth columns correspond to the imaging results for a point source in homogenous free space and above ITO/Si/Ag substrates, respectively. The iPSF patterns from the first to the third rows of Figure 5 are obtained by placing the point source on the focal plane and above the focal plane at distances of 40 nm and 80 nm, respectively. The iPSF profiles for each depth’s point source are indicated by the color of the dotted profiles: red, green, and blue profiles denote the iPSF on the focal plane and above the focal plane at distances of 40 nm and 80 nm, respectively.
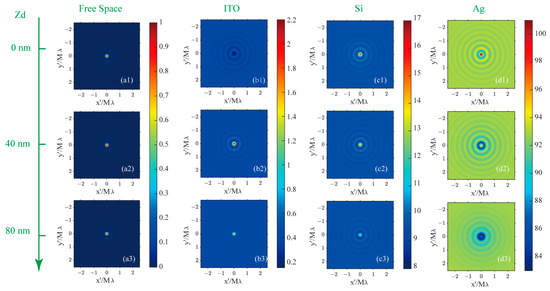
Figure 5.
The iPSF for dipoles positioned on the focal plane (first row) and above the focal plane with a longitudinal distance of 40 nm (second row) and 80 nm (third row) while in homogeneous free space (first column), with an ITO (second column), Si (third column), and Ag (fourth column) substrate on the focal plane. (a1–a3): the iPSF for dipole source in free space at the depth position of 0/40/80 nm; (b1–b3): the iPSF for dipole source above a ITO substrate at the depth position of 0/40/80 nm; (c1–c3): the iPSF for dipole source above a Si substrate at the depth position of 0/40/80 nm; (d1–d3): the iPSF for dipole source above a Ag substrate at the depth position of 0/40/80 nm.

Figure 6.
The profiles for iPSFs for dipole nanoparticles (a) in the free space, (b) above an ITO substrate, (c) above a Si substrate, and (d) above a Ag substrate. The red, green, and blue dotted lines represent the image profiles of dipoles on the focal plane at distances of 40 nm and 80 nm from the focal plane. The FWHM for each case is labeled in the top-right corner.
The complex linear polarizability of the point source used in the simulation along each excitation light field direction is that of the approximated dipole of an 80 nm Au nanoparticle, determined with the Mie theory as [22,23] , where is the dimensionless dipolar Mie coefficient, which is related to the nanoparticle’s feature size, material components, and immersion medium. The point-like model for nanoparticles, which are significantly smaller than the wavelength of light, serves as a standard approach to simplify the calculations of their response to the excitation light field. The expressions for polarizability and their validity have been derived and discussed previously [23,47,48,49].
In free space, the iPSF patterns for three simulated positions are normalized to that on the focal plane. The intensity of the iPSF in other substrate environments is represented as relative to that on the focal plane in free space. When the dipole sources are situated in a homogeneous oil space, the size of the iPSF hot spots remains nearly constant for three depth positions within the excitation light field, as observed in the first column images in Figure 5(a1–a3). The Full Widths at Half Maximum (FWHMs) are consistently evaluated at 74 nm, as shown in Figure 6a. In the presence of a reflective substrate, the size of the central spot, peak intensity, and image contrast (defined as the ratio between maximum and minimum intensity) are all altered, as seen from the second to fourth column patterns in Figure 5 and profiles in Figure 6. The central spot intensity and image contrast are either enhanced or suppressed due to the coherent superposition between the dipole nanoparticle’s scattering field and the reflected background field. Concurrently, the FWHMs of the central spots are either narrowed or broadened.
When destructive interference takes place at the central image spot, such as with an ITO substrate for a dipole source positioned on the focal plane as depicted in Figure 5(b1), or with a Ag substrate for a dipole source placed 80 nm above the substrate as shown in Figure 5(d3), the central spot’s intensity becomes smaller than that of the sidelobes. These sidelobes are also the result of interference effects when the sample is scanned away from the central view of the field (VOF), which is defined by the central spot of the excitation optical field. In these cases, the FWHM of the central image spot in Figure 5(b1) is 61 nm, which is 17% smaller than that of the dipole image spot in free space. The spot size in Figure 5(d3) is also slightly smaller than in free space. Conversely, when constructive interference occurs at the central image spot, as illustrated in Figure 5(b2,b3,c1–c3,d1,d2), the intensity of the central spot significantly exceeds that of the dipole image spot in free space, though the central image spot experiences varying degrees of broadening.
A key advantage of incorporating a reflective substrate in coherent illumination microscopy is the enhancement of the weak scattering signal from nanoparticles by superimposing it on the background field via interference effects. The intensity of this background field is contingent on the substrate’s reflective properties. Even if the intensity of the central spot is lower than that of the sidelobes, the precise positioning of nanoparticles can still be achieved by identifying the center of the interference rings. Furthermore, the utilization of a reflective substrate can lead to a reduction in the size of the central spot for a point-like nanoparticle, which in turn enhances the spatial resolution when imaging nanoparticle clusters in areas below the diffraction limit.
5. Experiment and Analysis
To validate the theoretical model, experiments were conducted on patterns of assembled Au nanoparticles placed above an ITO substrate. The essential steps in sample preparation included cleaning the ITO-coated glass substrate, applying a PMMA coating, using a thermal probe to write the designed nanostructure, developing the nanogroove structure in the PMMA layer with a liquid developing process, and finally positioning the Au nanoparticles into the crafted nanogrooves using an electric motor. These processes are detailed in our previously published paper [46].
The experiment setup is shown in Figure 1. The illumination light is a single-mode optical fiber laser operating at a wavelength of 405 nm. The lens used for focusing the illumination light field and collecting the responding field from a sample is an immersion objective (Olympus UPLXAPO, Tokyo, Japan), with a numerical aperture (NA) of 1.4, a magnification of 100×, and a focal length of 1.8 mm. A nanopositioner (P-733.3CD, Physik Instrumente, Karlsruhe, Germany), with travel ranges of 100 µm × 100 µm × 10 µm in X, Y, and Z and with resolution down to 0.1 nm, is used for placing the sample and for providing the scanning process across the tightly focused illumination light field. The focal length of the compatible tube lens is 180 mm. The polarization converter (PC) utilized to transform the input linear polarized light beam into a radially polarized light beam is a zero-order vortex half-wave retarder (WPV10L-405,Thorlabs, Newton, NJ, USA). The mask is made up of an annular aperture with an outer diameter of 4.2 mm, which matches the full-aperture size of the objective lens. The inner light-obstructing disk is 0.85 of the full aperture size of the objective lens. The detector is a charge-coupled device with a pixel size of 5 µm.
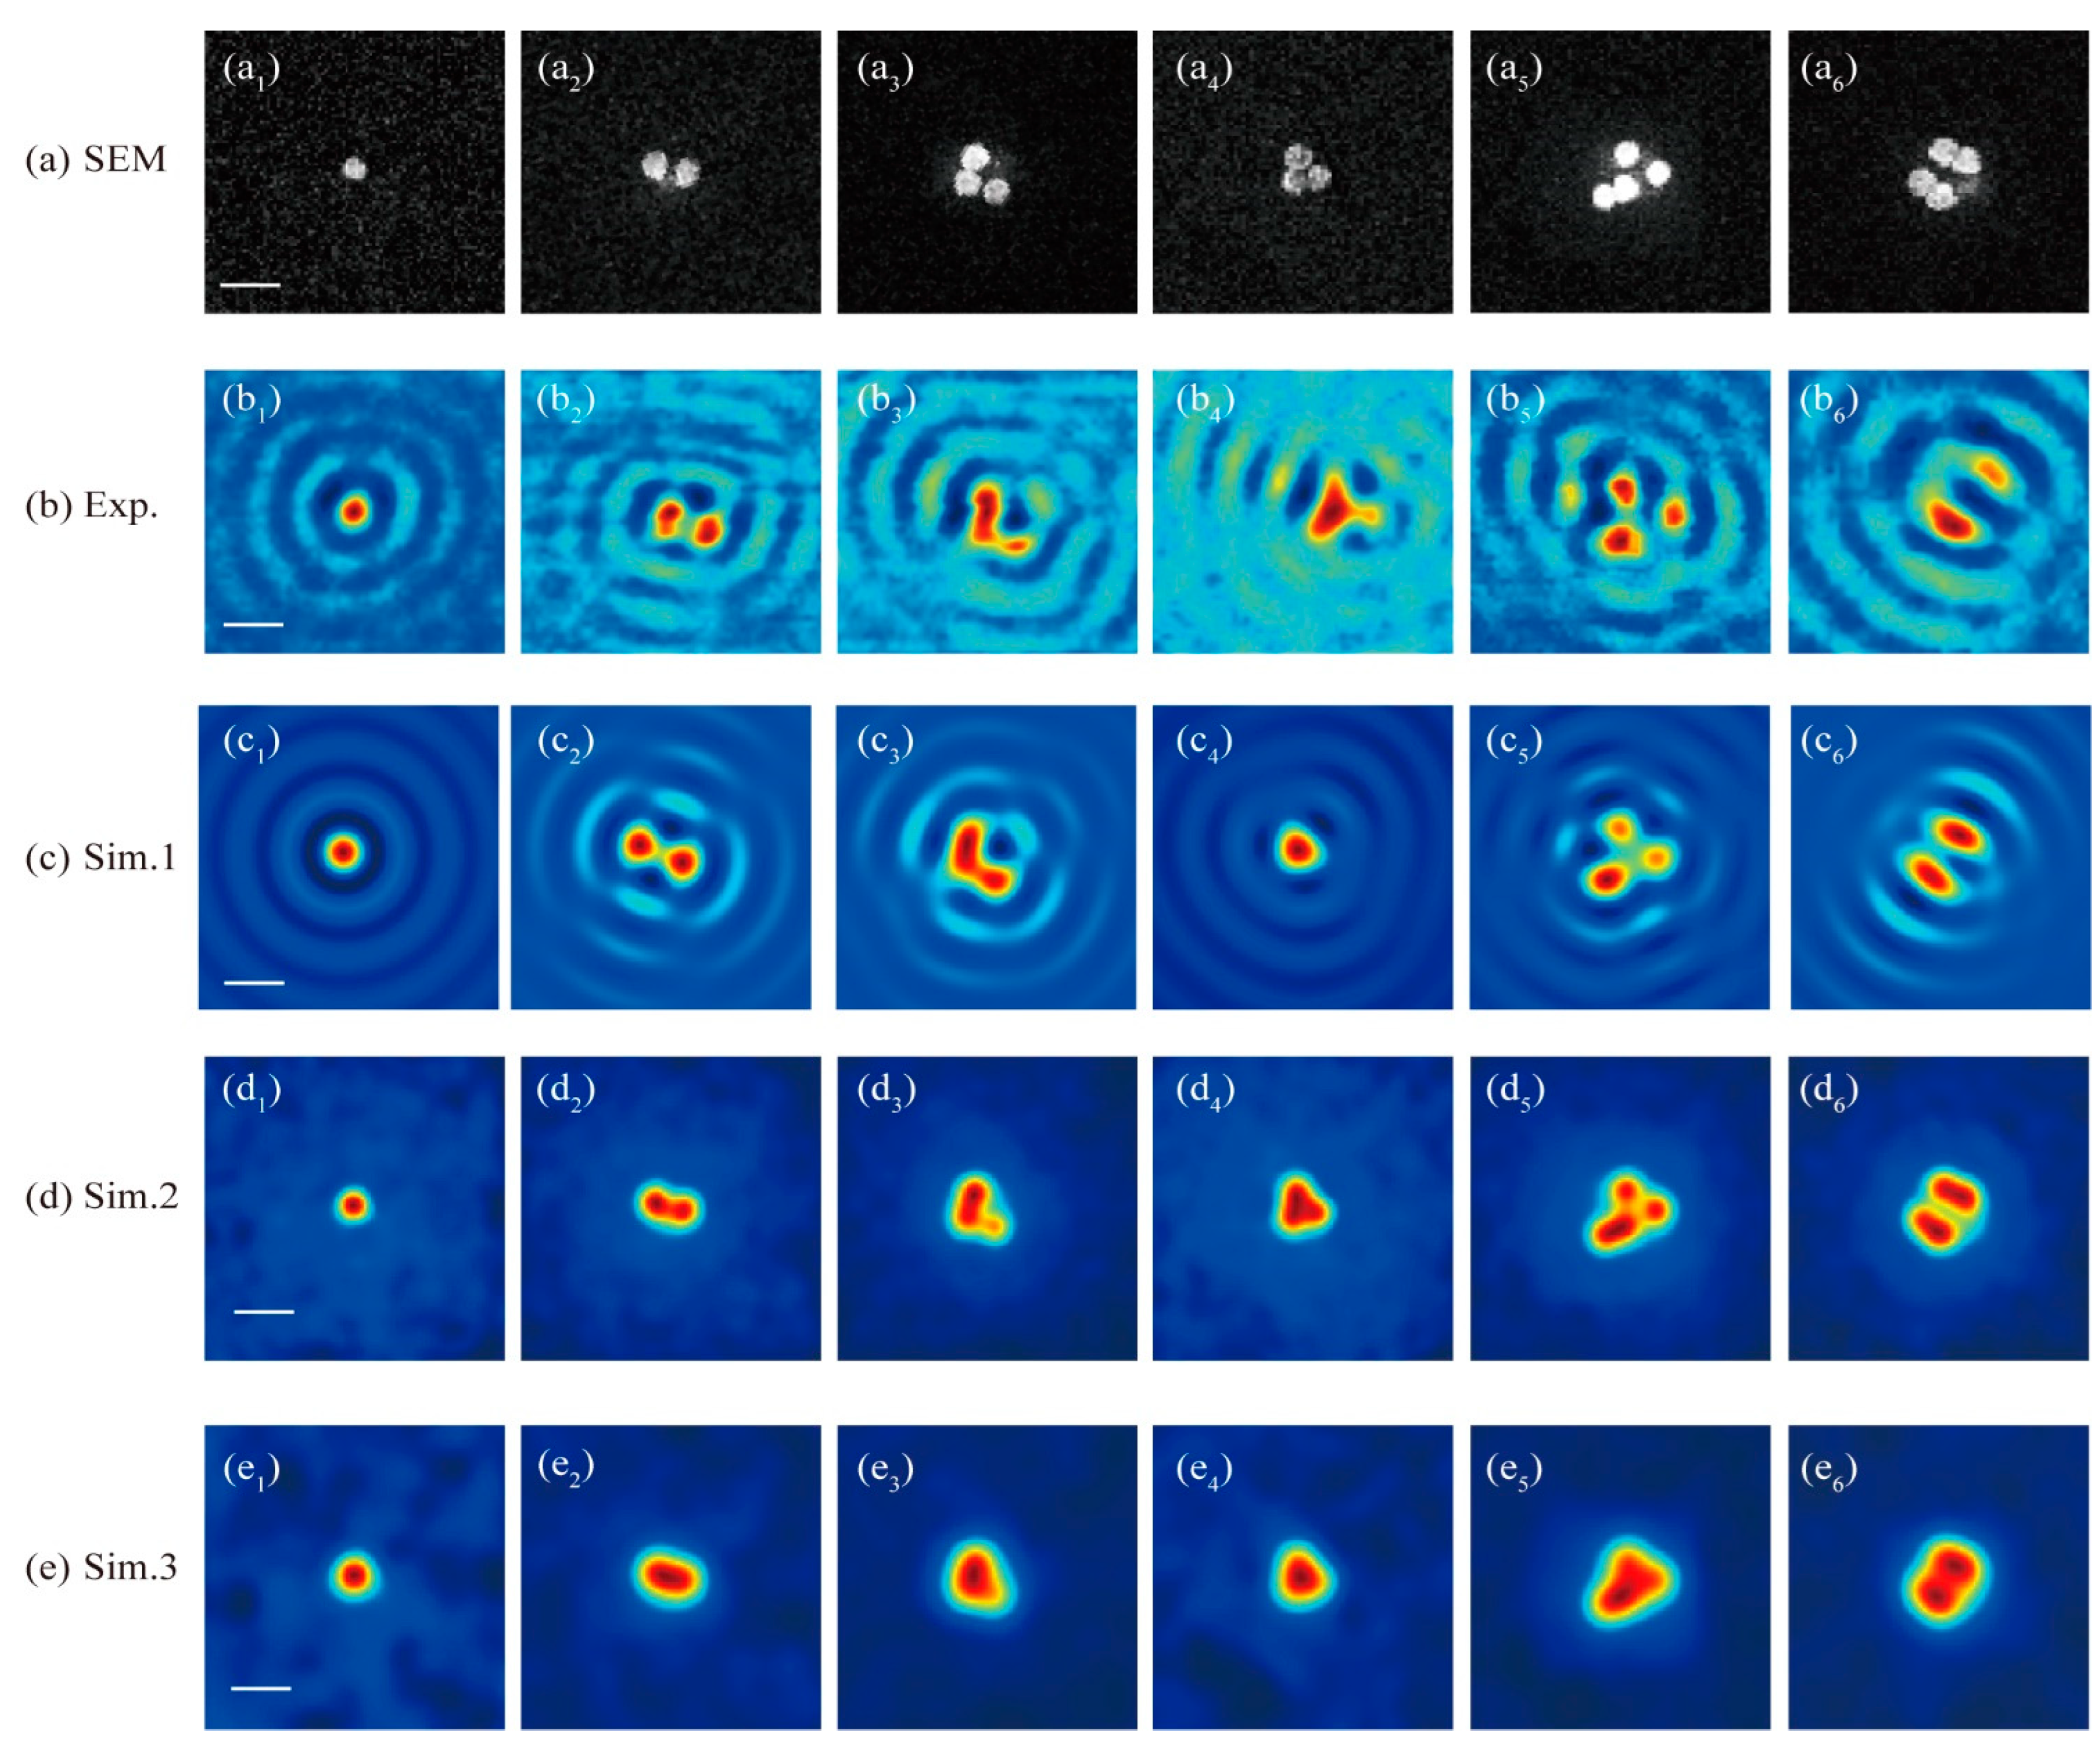
The first row of images in Figure 7 displays the sample patterns as observed through scanning electron microscopy (SEM), showing Au nanoparticles with an average size of about 80 nm and a designed gap of 40 nm between the nanoparticles’ bottom and the upper surface of the ITO layer. The experimental results for these samples, as captured by the microscopy system discussed in this study, are presented in Figure 7(b1–b6), covering a specific image range. The third and fourth rows of the graphs in Figure 7, respectively, showcase the simulated image results for the nanoparticles with and without the influence of the ITO substrate. The fifth row of Figure 7 provides simulation results for a conventional CLSM setup without the vector field manipulation technique applied in the far field for the purpose of comparison.
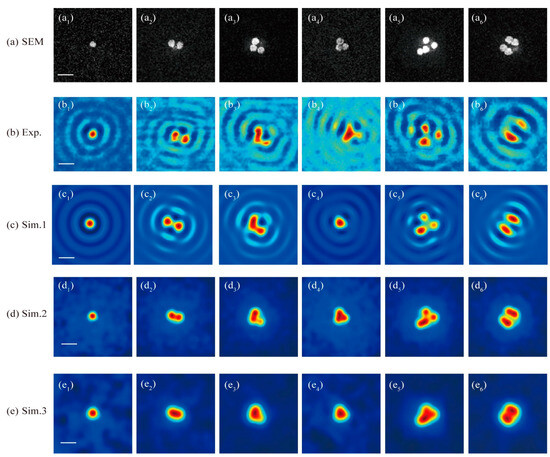
Figure 7.
(a) SEM images for the Au nanoparticle samples. (b) The image patterns obtained by the far-field optical super-resolution microscopy studied in this paper. The simulated image results of the studied microscopy for nanoparticle(s) sample (c) with and (d) without the influence of the ITO substrate. (e) The simulated image results for a common CLSM without the PSF engineering and without the influence of the ITO substrate. The scale bars labeled with a white line in images (a1,b1,c1,d1,e1) denote 200 nm. (a1–a6): the SEM images for 1 nanoparticle, 2 nanoparticles with a gap of about 40 nm, 3 nanoparticles where the bottom right corner one is about 20 nm away from its nearest left one, 3 nanoparticles seamlessly connected to each other, 4 nanoparticles with symmetric and asymmetric distribution pattern existing both connected arrangement and separated arrangement; (b1–b6): the experimental results for the samples in (a1–a6) under the studied super-resolution CLSM as shown in Figure 1; (c1–c6): the corresponding simulation results for the samples in (a1–a6); (d1–d6): the simulation results for the nanoparticles pattern as shown in (a1–a6) but with ITO substrate’s influence removed by assuming the nanoparticles are located in a homogeneous space; (e1–e6): the simulated results for the nanoparticles pattern in (a1–a6), but assumed in homogeneous space, under a common CLSM system degraded from the system shown in Figure 1 by removing the light field manipulation devices, including the PC and the Mask.
The experimental outcomes, as illustrated in Figure 7(b1–b6), reveal the presence of a series of sidelobes surrounding the central image spots of the nanoparticles, aligning with the simulated results shown in Figure 7(c1–c6). This phenomenon occurs due to the interference between the substrate’s reflection of the incident excitation field and the scattering field from the excited nanoparticles as they are laterally scanned across the excitation field within the scanning range. The experimental results allow for the differentiation of individual nanoparticles when they are not densely packed, as evidenced in Figure 7(b1–b3) (the lower-right nanoparticle), and Figure 7(b5) (the top and right two nanoparticles). However, when nanoparticles are positioned in close proximity to each other, such as the two particles arranged vertically in subgraph Figure 7(a3) and the three particles clustered in Figure 7(a4–a6), they manifest as an unresolved spot in the experimental images.
As the cylindrosymmetric nature of the excitation light field around the optical axis perpendicular to the sample surface, it is anticipated based on the theory that images of symmetrical samples, like those in Figure 7(a1,a2,a6), should also display good symmetry. Consequently, observed variations in peak intensity and spot size in the experimental images, as seen in Figure 7(b2,b6), may stem from the changing depth positions of the nanoparticles within the excitation field. This variation could be due to potential surface distortions in the PMMA layer incurred during the fabrication process. The sensitivity of the peak intensity and central spot size to the depth positioning of the nanoparticles, as evidenced by our experimental findings, underscores that optical super-resolution microscopy can reveal additional structural details about nanoparticles, such as depth variation, which are not discernible in SEM images. This highlights the capability of optical super-resolution techniques to provide a more comprehensive understanding of nanoparticle structures beyond what can be achieved with traditional imaging methods.
Removing the reflective substrate from the simulation leads to the disappearance of the ring structures in the simulated image results, as illustrated in Figure 7(d1–d6). This alteration also slightly decreases the resolving capability of the imaging system. For example, nanoparticles positioned less than 40 nm apart can be distinguished in the images with an ITO substrate, as seen in Figure 7(b2,c2). In contrast, without the reflective substrate, these nanoparticles appear unresolved, and they cannot be identified as separate entities, as shown in Figure 7(d2). Similarly, the nanoparticle in the lower-right corner of the sample pattern Figure 7(a3), with a gap of around 20 nm to its left-adjacent nanoparticle, which is clearly visible as an isolated particle in Figure 7(b3,c3), becomes less distinguishable in the absence of the substrate-assisted interference effect, as depicted in Figure 7(d3).
If the reflective ITO substrate is removed and the PSF engineering typically employed in far-field microscopy is not utilized, effectively reducing the system to a conventional CLSM, the simulated imaging results are presented in Figure 7(e1–e6). The PSF for this common CLSM can be approximated as a Gaussian function with FWHM expressed as , determined by both the Abbe diffraction limit and confocal scheme. The confocal scheme can provide a improvement in the resolution compared to a non-confocal microscopy. The images from Figure 7(e2–e6) reveal that almost all the nanoparticles in the densely distributed patterns, as illustrated in Figure 7(a2–a6), cannot be resolved when both the PSF engineering typical of far-field systems and the reflective substrate-assisted interference effect are absent. This underscores the essential roles that PSF engineering and substrate-assisted interference effects play in enhancing the system’s resolving capability, demonstrating their significance in achieving superior resolution in optical microscopy.
The nanoparticles next to each other can only be distinguished when they are separated by a certain distance, such as 40 nm and 20 nm in the sample shown in Figure 7(a2,a3). This edge-to-edge distance is much smaller than the FWHM of the PSF (around 80 nm), which was evaluated at an illumination wavelength of 405 nm via a free-space dipole at the focus. As the size of the nanoparticles in the experimental sample is around 80 nm, the center-to-center distance for nanoparticles with a certain gap is slightly larger than the FWHM. In principle, two ideal point sources in a background can be distinguished from each other if their separation distance is larger than the FWHM of the system. However, for denser nanoparticles distribution in the samples shown in Figure 7, next to each other without a separated gap, even their center-to-center distance is equal to or slightly larger than the FWHM, but they cannot be distinguished from each other, due to the non-central parts of the nanoparticles also producing imaging information that will overlay with the nonlocal nanoparticle information. Therefore, nanoparticles with a certain feature size should be separated by a center-to-center distance larger than the FWHM of the system PSF that is evaluated for a free-space dipole. The final imaging results are a synthetic result of the sample’s actual material, pattern, and background environment for the microscopy system.
6. Conclusions and Outlook
This research develops a comprehensive forward imaging theory for a coherent illumination far-field CLSM system that employs a VFM approach along with a reflective substrate-assisted interference effect to significantly improve the resolution of densely packed nanoparticle clusters within a diffraction-limited area. The excitation PSF, detection PSF, and iPSF across both homogeneous free space and various substrate conditions are systematically studied. Additionally, the depth-dependent characteristics of all the PSFs are examined.
The numerical analysis of the PSF for both the excitation/detection subsystems and the overall CLSM structure reveals that the microscopy system’s performance is highly sensitive to the depth of the nanoparticles and the presence of surrounding structures. Factors such as the spot size, intensity in iPSF, and image contrast are all influenced by the planar reflective substrate. Experimental work involving Au nanoparticles positioned above an ITO substrate confirms the substrate’s significant role in affecting the imaging properties by introducing an interference effect between the background and signal fields. This interference effect is shown to enhance the system’s capability to resolve densely packed nanoparticles even with deep subwavelength gaps as small as 20 nm between them compared to configurations lacking such an effect. Moreover, the VFM approach further enhances lateral spatial resolution beyond what is achievable with standard CLSM.
The findings suggest that the principles and techniques introduced in this study could facilitate the resolution of nanostructures that are closely spaced, surpassing the limitations of traditional microscopy which typically requires nanoparticles or single molecules to be sparsely distributed. In super-resolution microscopy techniques such as Stochastic Optical Reconstruction Microscopy (STORM) and Photoactivated Localization Microscopy (PALM), it is challenging to simultaneously resolve multiple fluorescent molecules within a subdiffraction limit area. This is because the responding spot for a single molecule is restricted to the diffraction limit, preventing precise localization. If the interferometric scattering super-resolution method is introduced, the imaging efficiency of STORM and PALM may be significantly enhanced, which can reduce the need for frequent activation and extinction processes, allowing for more accurate localization of molecules with deep subwavelength precision. Additionally, the use of inverse imaging restoration techniques could allow the determination of not only topological structures but also the complex field distribution within nanostructures, offering deeper insights into their characteristics. While the method continues to struggle with resolving nanoparticles placed directly next to each other without any gap, further enhancements such as deconvolution or machine learning-based post-processing methods could potentially help overcome this issue.
Supplementary Materials
The following supporting information can be downloaded at: https://www.mdpi.com/article/10.3390/photonics11050409/s1.
Author Contributions
Conceptualization, A.Z. and J.Z.; methodology, A.Z.; software, A.Z.; validation, G.G., A.Z., X.X. and J.Z.; formal analysis, A.Z., K.L. and G.G.; investigation, A.Z.; resources, J.Z.; data curation, A.Z. and G.G.; writing—original draft preparation, A.Z.; writing—review and editing, J.Z., H.L. and X.X.; visualization, A.Z., K.L. and G.G.; supervision, J.Z.; project administration, J.Z. and H.L.; funding acquisition, J.Z. and H.L. All authors have read and agreed to the published version of the manuscript.
Funding
This work was funded by the Guangdong Major Project of Basic and Applied Basic Research Foundation (2020B0301030009), the National Natural Science Foundation of China (62305233, 61991452, and 12074444), and the Guangdong Basic and Applied Basic Research Foundation (2020A1515011184 and 2022A1515110658).
Institutional Review Board Statement
Not applicable.
Informed Consent Statement
Not applicable.
Data Availability Statement
The original contributions presented in the study are included in the article/Supplementary Materials, further inquiries can be directed to the corresponding author.
Conflicts of Interest
Guorong Guan was employed by the Guangdong KST Optical Co., Ltd. The authors declare no conflicts of interest.
References
- Shaw, P.J.; Rawlins, D.J. The point-spread function of a confocal microscope: Its measurement and use in deconvolution of 3-D data. J. Microsc. 2011, 163, 151–165. [Google Scholar] [CrossRef]
- Conchello, J.-A.; Preza, C.; Cogswell, C.J.; Conchello, J.-A.; Wilson, T. Image estimation accounting for point-spread function depth cariation in three-dimensional fluorescence microscopy. In Proceedings of the Three-Dimensional and Multidimensional Microscopy: Image Acquisition and Processing X, San Jose, CA, USA, 28–29 January 2003. [Google Scholar]
- Lai, X.; Lin, Z.; Ward, E.S.; Ober, R.J. Noise suppression of point spread functions and its influence on deconvolution of three-dimensional fluorescence microscopy image sets. J. Microsc. 2005, 217, 93–108. [Google Scholar] [CrossRef] [PubMed]
- He, H.; Xie, X.; Liu, Y.; Liang, H.; Zhou, J. Exploiting the point spread function for optical imaging through a scattering medium based on deconvolution method. J. Innov. Opt. Health Sci. 2019, 12, 1930005. [Google Scholar] [CrossRef]
- Wen, G.; Li, S.; Wang, L.; Chen, X.; Sun, Z.; Liang, Y.; Jin, X.; Xing, Y.; Jiu, Y.; Tang, Y.; et al. High-fidelity structured illumination microscopy by point-spread-function engineering. Light Sci. Appl. 2021, 10, 70. [Google Scholar] [CrossRef] [PubMed]
- Jia, S.; Vaughan, J.C.; Zhuang, X. Isotropic three-dimensional super-resolution imaging with a self-bending point spread function. Nat. Photonics 2014, 8, 302–306. [Google Scholar] [CrossRef] [PubMed]
- Wang, H.; Shi, L.; Lukyanchuk, B.; Sheppard, C.; Chong, C.T. Creation of a needle of longitudinally polarized light in vacuum using binary optics. Nat. Photonics 2008, 2, 501–505. [Google Scholar] [CrossRef]
- Xie, X.; Chen, Y.; Yang, K.; Zhou, J. Harnessing the Point-Spread Function for High-Resolution Far-Field Optical Microscopy. Phys. Rev. Lett. 2014, 113, 263901. [Google Scholar] [CrossRef] [PubMed]
- Kozawa, Y.; Matsunaga, D.; Sato, S. Superresolution imaging via superoscillation focusing of a radially polarized beam. Optica 2018, 5, 86–92. [Google Scholar] [CrossRef]
- Maslov, A.V.; Astratov, V.N. Resolution and Reciprocity in Microspherical Nanoscopy: Point-Spread Function Versus Photonic Nanojets. Phys. Rev. Appl. 2019, 11, 064004. [Google Scholar] [CrossRef]
- Fu, S.; Li, M.; Zhou, L.; He, Y.; Liu, X.; Hao, X.; Li, Y. Deformable mirror based optimal PSF engineering for 3D super-resolution imaging. Opt. Lett. 2022, 47, 3031–3034. [Google Scholar] [CrossRef]
- He, C.; Shen, Y.; Forbes, A. Towards higher-dimensional structured light. Light Sci. Appl. 2022, 11, 205. [Google Scholar] [CrossRef] [PubMed]
- Beversluis, M.R.; Novotny, L.; Stranick, S.J. Programmable vector point-spread function engineering. Opt. Express 2006, 14, 2650–2656. [Google Scholar] [CrossRef] [PubMed]
- Kitamura, K.; Sakai, K.; Noda, S. Sub-wavelength focal spot with long depth of focus generated by radially polarized, narrow-width annular beam. Opt. Express 2010, 18, 4518–4525. [Google Scholar] [CrossRef] [PubMed]
- Smolyaninov, I.I.; Davis, C.C.; Elliott, J.; Wurtz, G.A.; Zayats, A.V. Super-resolution optical microscopy based on photonic crystal materials. Phys. Rev. B 2005, 72, 085442. [Google Scholar] [CrossRef]
- Yang, X.; Xie, H.; Alonas, E.; Liu, Y.; Chen, X.; Santangelo, P.J.; Ren, Q.; Xi, P.; Jin, D. Mirror-enhanced super-resolution microscopy. Light-Sci. Appl. 2016, 5, e16134. [Google Scholar] [CrossRef] [PubMed]
- Wu, J.; Liu, W.; Ngai, T. Total internal reflection microscopy: A powerful tool for exploring interactions and dynamics near interfaces. Soft Matter 2023, 19, 4611–4627. [Google Scholar] [CrossRef] [PubMed]
- Taylor, R.W.; Mahmoodabadi, R.G.; Rauschenberger, V.; Giessl, A.; Schambony, A.; Sandoghdar, V. Interferometric scattering microscopy reveals microsecond nanoscopic protein motion on a live cell membrane. Nat. Photonics 2019, 13, 480–487. [Google Scholar] [CrossRef]
- Arroyo, J.O.; Cole, D.; Kukura, P. Interferometric scattering microscopy and its combination with single-molecule fluorescence imaging. Nat. Protoc. 2016, 11, 617–633. [Google Scholar] [CrossRef]
- Gong, L.; Wang, H. Breaking the diffraction limit by saturation in stimulated-Raman-scattering microscopy: A theoretical study. Phys. Rev. A 2014, 90, 013818. [Google Scholar] [CrossRef]
- Repan, T.; Lavrinenko, A.V.; Zhukovsky, S.V. Dark-field hyperlens: Super-resolution imaging of weakly scattering objects. Opt. Express 2015, 23, 25350–25364. [Google Scholar] [CrossRef]
- Khadir, S.; Chaumet, P.C.; Baffou, G.; Sentenac, A. Quantitative model of the image of a radiating dipole through a microscope. J. Opt. Soc. Am. A Opt. Image Sci. Vis. 2019, 36, 478–484. [Google Scholar] [CrossRef] [PubMed]
- Colom, R.; Devilez, A.; Bonod, N.; Stout, B. Optimal interactions of light with magnetic and electric resonant particles. Phys. Rev. B 2016, 93, 045427. [Google Scholar] [CrossRef]
- Elliott, A.D. Confocal Microscopy: Principles and Modern Practices. Curr. Protoc. Cytom. 2020, 92, e68. [Google Scholar] [CrossRef] [PubMed]
- Dorn, R.; Quabis, S.; Leuchs, G. Sharper focus for a radially polarized light beam. Phys. Rev. Lett. 2003, 91, 233901. [Google Scholar] [CrossRef] [PubMed]
- Yang, L.; Xie, X.; Wang, S.; Zhou, J. Minimized spot of annular radially polarized focusing beam. Opt. Lett. 2013, 38, 1331–1333. [Google Scholar] [CrossRef] [PubMed]
- Liu, Z.; Agarwal, K. Silicon substrate significantly alters dipole-dipole resolution in coherent microscope. Opt. Express 2020, 28, 39713–39726. [Google Scholar] [CrossRef] [PubMed]
- Yang, K.; Xie, X.; Zhou, J. Generalized vector wave theory for ultrahigh resolution confocal optical microscopy. J. Opt. Soc. Am. A Opt. Image Sci. Vis. 2017, 34, 61–67. [Google Scholar] [CrossRef] [PubMed]
- Bauer, T.; Orlov, S.; Peschel, U.; Banzer, P.; Leuchs, G. Nanointerferometric amplitude and phase reconstruction of tightly focused vector beams. Nat. Photonics 2013, 8, 23–27. [Google Scholar] [CrossRef]
- Teixeira, F.L.; Sarris, C.; Zhang, Y.; Na, D.Y.; Berenger, J.P.; Su, Y.; Okoniewski, M.; Chew, W.C.; Backman, V.; Simpson, J.J. Finite-difference time-domain methods. Nat. Rev. Methods Primers 2023, 3, 75. [Google Scholar] [CrossRef]
- Draine, B.T.; Flatau, P.J. Discrete-dipole approximation for scattering calculations. J. Opt. Soc. Am. A (Opt. Image Sci.) 1994, 11, 1491–1499. [Google Scholar] [CrossRef]
- Flatau, P.J.; Fuller, K.A.; Mackowski, D.W. Scattering by two spheres in contact: Comparisons between discrete-dipole approximation and modal analysis. Appl. Opt. 1993, 32, 3302–3305. [Google Scholar] [CrossRef] [PubMed]
- Yurkin, M.A.; Hoekstra, A.G. The discrete dipole approximation: An overview and recent developments. J. Quant. Spectrosc. Radiat. Transf. 2007, 106, 558–589. [Google Scholar] [CrossRef]
- Draine, B.T.; Flatau, P.J. Discrete-dipole approximation for periodic targets: Theory and tests. J. Opt. Soc. Am. A Opt. Image Sci. Vis. 2008, 25, 2693–2703. [Google Scholar] [CrossRef] [PubMed]
- Girard, C.; Dujardin, E.; Baffou, G.; Quidant, R. Shaping and manipulation of light fields with bottom-up plasmonic structures. New J. Phys. 2008, 10, 105016. [Google Scholar] [CrossRef]
- Cazé, A.; Pierrat, R.; Carminati, R. Radiative and non-radiative local density of states on disordered plasmonic films. Photonics Nanostruct. Fundam. Appl. 2012, 10, 339–344. [Google Scholar] [CrossRef][Green Version]
- Bashkatova, T.A.; Bashkatov, A.N.; Kochubey, V.I.; Tuchin, V.V. Light scattering properties for spherical and cylindrical particles: A simple approximation derived from Mie calculations. In Proceedings of the Saratov Fall Meeting 2000: Optical Technologies in Biophysics and Medicine II, Saratov, Russia, 3–6 October 2000; pp. 247–259. [Google Scholar]
- Fan, X.; Zheng, W.; Singh, D.J. Lightscattering and surface plasmons on small spherical particles. Light Sci. Appl. 2014, 3, e179. [Google Scholar] [CrossRef]
- Marian, A.; Charriere, F.; Colomb, T.; Montfort, F.; Kuhn, J.; Marquet, P.; Depeursinge, C. On the complex three-dimensional amplitude point spread function of lenses and microscope objectives: Theoretical aspects, simulations and measurements by digital holography. J. Microsc. 2007, 225, 156–169. [Google Scholar] [CrossRef] [PubMed]
- Hecht, B.; Novotny, L. Principles of Nano-Optics, 2nd ed.; Cambridge University Press: Cambridge, UK, 2012. [Google Scholar]
- Xiaoqiang, Z.; Ruishan, C.; Anting, W. Focusing properties of cylindrical vector vortex beams. Opt. Commun. 2018, 414, 10–15. [Google Scholar] [CrossRef]
- Kozawa, Y.; Sakashita, R.; Uesugi, Y.; Sato, S. Imaging with a longitudinal electric field in confocal laser scanning microscopy to enhance spatial resolution. Opt. Express 2020, 28, 18418–18430. [Google Scholar] [CrossRef]
- Cheng, K.; Li, Z.; Wu, J.; Hu, Z.D.; Wang, J. Super-resolution imaging based on radially polarized beam induced superoscillation using an all-dielectric metasurface. Opt. Express 2022, 30, 2780–2791. [Google Scholar] [CrossRef]
- Hu, Y.; Wang, Z.; Wang, X.; Ji, S.; Zhang, C.; Li, J.; Zhu, W.; Wu, D.; Chu, J. Efficient full-path optical calculation of scalar and vector diffraction using the Bluestein method. Light Sci. Appl. 2020, 9, 119. [Google Scholar] [CrossRef] [PubMed]
- Leutenegger, M.; Rao, R.; Leitgeb, R.A.; Lasser, T. Fast focus field calculations. Opt. Express 2006, 14, 11277–11291. [Google Scholar] [CrossRef] [PubMed]
- Guan, G.; Zhang, A.; Xie, X.; Meng, Y.; Zhang, W.; Zhou, J.; Liang, H. Far-Field and Non-Intrusive Optical Mapping of Nanoscale Structures. Nanomaterials 2022, 12, 2274. [Google Scholar] [CrossRef] [PubMed]
- Grigoriev, V.; Bonod, N.; Wenger, J.; Stout, B. Optimizing Nanoparticle Designs for Ideal Absorption of Light. ACS Photonics 2015, 2, 263–270. [Google Scholar] [CrossRef]
- Stout, B.; Devilez, A.; Rolly, B.; Bonod, N. Multipole methods for nanoantennas design: Applications to Yagi-Uda configurations. J. Opt. Soc. Am. B 2011, 28, 1213–1223. [Google Scholar] [CrossRef]
- Colas des Francs, G.; Girard, C.; Bruyant, A.; Dereux, A. SNOM signal near plasmonic nanostructures: An analogy with fluorescence decays channels. J. Microsc. 2008, 229, 302–306. [Google Scholar] [CrossRef]
Disclaimer/Publisher’s Note: The statements, opinions and data contained in all publications are solely those of the individual author(s) and contributor(s) and not of MDPI and/or the editor(s). MDPI and/or the editor(s) disclaim responsibility for any injury to people or property resulting from any ideas, methods, instructions or products referred to in the content. |
© 2024 by the authors. Licensee MDPI, Basel, Switzerland. This article is an open access article distributed under the terms and conditions of the Creative Commons Attribution (CC BY) license (https://creativecommons.org/licenses/by/4.0/).

