Article

Photoreflectance Analysis of InAsPSb/InGaAs Multi-Quantum Well LED Structures with Different Well/Barrier Numbers

by
Behnam Zeinalvand Farzin
1,
S. Bahareh Seyedein Ardebili
1,
Tae In Kang
1,
Jong Su Kim
1,*,
Phuc Dinh Nguyen
2,3 and
Sang Jun Lee
2,*
1
Department of Physics, Yeungnam University, Gyeongsan 38541, Republic of Korea
2
Division of Interdisciplinary Materials Measurement Institute, Korea Research Institute of Standards and Science, Daejeon 34113, Republic of Korea
3
Department of Nano Convergence Measurement, University of Science & Technology, Daejeon 34113, Republic of Korea
*
Authors to whom correspondence should be addressed.
Photonics 2024, 11(3), 277; https://doi.org/10.3390/photonics11030277
Submission received: 20 February 2024 / Revised: 18 March 2024 / Accepted: 19 March 2024 / Published: 21 March 2024
(This article belongs to the Special Issue Recent Advances and Future Perspectives in LED Technology)

Abstract

:
InAsPSb is an emerging material used as an efficient barrier in quantum well structures, and the resulting devices can be employed in the mid-infrared region of the electromagnetic spectrum. This study investigates the photoreflectance spectra of two InAsPSb/InGaAs multi-quantum well light-emitting diodes with 6 and 15 quantum well periods. The photoreflectance of the samples was analyzed at various temperatures and excitation powers. By examining the Franz-Keldysh oscillations in the spectra, we explored the influence of the number of well layers on the electric field strength in the junction. The results showed that the number of quantum wells can influence the electric field at the junction, potentially impacting the overall performance of the devices. The simulation of the electric field strength aligns with the results of the photoreflectance analysis. This suggests that the field extracted from Franz-Keldysh oscillations characterizes the field inside the multi-quantum wells, offering potential reasons for the observed effects on the number of multi-quantum wells in the field.

1. Introduction

Semiconductor devices operating in the mid-wave infrared (MWIR) region of the electromagnetic spectrum have been widely investigated in the last few decades [1,2,3]. Among them, light-emitting diodes (LEDs) in the wavelength range of 2–5 μm have emerged as efficient structures for various applications, including remote sensing of pollutants [4], carbon dioxide ( C O 2 ) and methane ( C H 4 ) gas leakage monitoring systems [5], and more. Quantum well (QW) LED structures offer significant advantages over conventional ones, as the confined states for electrons and holes result in more efficient recombination and higher efficiency [6].
Various compound materials have been extensively studied to enhance the efficiency of QW LED structures in the MWIR range, primarily falling into two categories: II–VI and III–V compounds. Some examples of these investigations include GeSn/Ge [7], GeSn/SiGeSn [8], AlInAs/InAs [9], GaN/AlGaN [10], and InAs/GaSb [11] QW structures. Considerable focus has also been directed toward InAs and its alloys, including InAsPSb, InGaAs, InAsSb, and InGaAsSb, as highly promising materials for crafting optoelectronic devices in the infrared wavelength region [12,13,14,15,16]. Specifically, InAsPSb is one of the quaternary compounds with three group V materials studied in the literature [17]. The InAsPSb quaternary material has a more considerable bandgap energy ( E g = 1.01 eV) than traditional barrier materials near the lattice constant of In0.83Ga0.17As. Since the barrier height in the conduction band increases, the confinement of the electrons could be enhanced. For example, comparisons between InAsP and InAsPSb for InGaAs wells have been investigated, and a higher carrier extraction efficiency when using the InAsPSb barrier has been demonstrated [18]. The lattice mismatch between InAsP and InP substrates could be addressed by incorporating step-graded buffer layers of InAsP as a virtual substrate. This approach enabled the realization of a two-color InGaAs detector [19].
However, photoreflectance (PR), known as a powerful contactless spectroscopy technique, can reveal various features in semiconductor structures, particularly interface and surface characteristics [20]. This valuable information includes optical transitions [21], built-in electric fields [22], defect densities [23], strain influence [24], quantum efficiency [25], and more. Several works have also investigated the dynamics of carriers in structures such as photodiodes by employing a similar experimental setup and observing the transient behavior of reflectivity [26,27,28]. Specifically, the built-in electric fields in the junction can be characterized by oscillations that appear in the high-field and higher bandgap regions of the PR spectrum. These oscillations, known as Franz-Keldysh oscillations (FKOs), allow the extraction of the strength of the electric field in the junctions [29].
The number of wells/barriers in the MQW structures is one of the critical factors that can influence the overall performance of the device [30,31,32,33]. There are no specific numbers for the wells/barriers that represent an optimized state, as they can vary across different materials and depend on manufacturing conditions. The built-in electric field in a p-n junction device plays a crucial role for various reasons. It prevents majority carriers from recombining with minority carriers, accelerates the minority carriers injected into the junction, and establishes a potential barrier that charged carriers must surpass to traverse the junction [34]. This field serves as a barrier that regulates the flow of electrons and holes, which is crucial for adequately functioning devices such as diodes and transistors. The built-in electric field is responsible for diodes, bipolar junction transistors (BJTs), and field-effect transistors (FETs)-integral components in numerous electronic devices [35,36,37]. Hence, taking into account how other components of a device influence the strength of the electric field can be a valuable strategy in the quest for high-performance devices.
Although LED structures incorporating InAsSbP, as an effective material in the infrared region of the spectrum, have been investigated in the literature [19,38,39,40,41,42,43,44,45,46], to the best of our knowledge, InAsSbP/InGaAs MQW LED structures have rarely been investigated. Furthermore, there is limited research on the influence of the number of quantum wells on the PR spectra and its impact on built-in electric fields. This lack of investigations prompted us to explore the photoreflectance response regarding the number of quantum wells in this type of structure. In this study, we prepared two InAsSbP/InGaAs MQW LED structures with different numbers of wells: 6 and 15. For the well, the composition of I n was chosen to be 0.83; for the barrier material, compositions of A s and P were selected at 0.30 and 0.65, respectively. The photoreflectance spectra of the samples were collected at different temperatures and power levels, and the influence of the number of wells on the spectra was analyzed. As a primary result, an increase in the number of quantum wells led to a decrease in the electric field within the MQWs, as observed in the case of the structures with 6 and 15 MQWs. Finally, we conducted simulations to analyze the electric field strength in the structure and compared the theoretical and experimental results to draw conclusions regarding possible reasons influencing this behavior.

2. Experimental Method

Lattice-mismatched materials were grown on n+-InP substrates using a D180 VEECO metal (Veeco, originated from New York, U.S.)-organic chemical vapor deposition (MOCVD) system. An n+-InAsxP1−x metamorphic virtual substrate was designed to relieve lattice strain. Our virtual substrate consisted of four-stage buffers. To further reduce the residual strain and smooth the surface, 350 nm of overshoot n+-InAs0.65P0.35 was grown. Following that, In0.83Ga0.17As/InAs0.30P0.65Sb0.05 multiple quantum wells (MQWs) with six and fifteen periods were grown on the InAsxP1−x virtual substrate, sandwiched between InAs0.63P0.37 top and bottom cladding layers. Finally, p+-InAs0.63P0.37 charge and p+-In0.83Ga0.17As contact layers were developed to ensure a uniform electric field distribution. A doping level of 2 × 10 18 cm−3 was chosen for all doped layers. The details of the growth procedure are described in [18]. A schematic diagram of the samples is illustrated in Figure 1.
The PR spectra of the samples were obtained using a typical experimental setup described elsewhere [47]. A 405 nm laser diode was used as an excitation source, which was chopped at 800 Hz, and a monochromator was used to diffract the halogen lamp into various wavelengths. The photoluminescence spectrum was achieved using a continuous wave 532 nm laser, which was mechanically chopped at 800 Hz. The reflected and luminescence beams were collected via an InGaAs extended wavelength photodetector.

3. Results and Discussion

In this section, we summarize the overall results over five subsections.

3.1. Band Diagram and PR Spectra

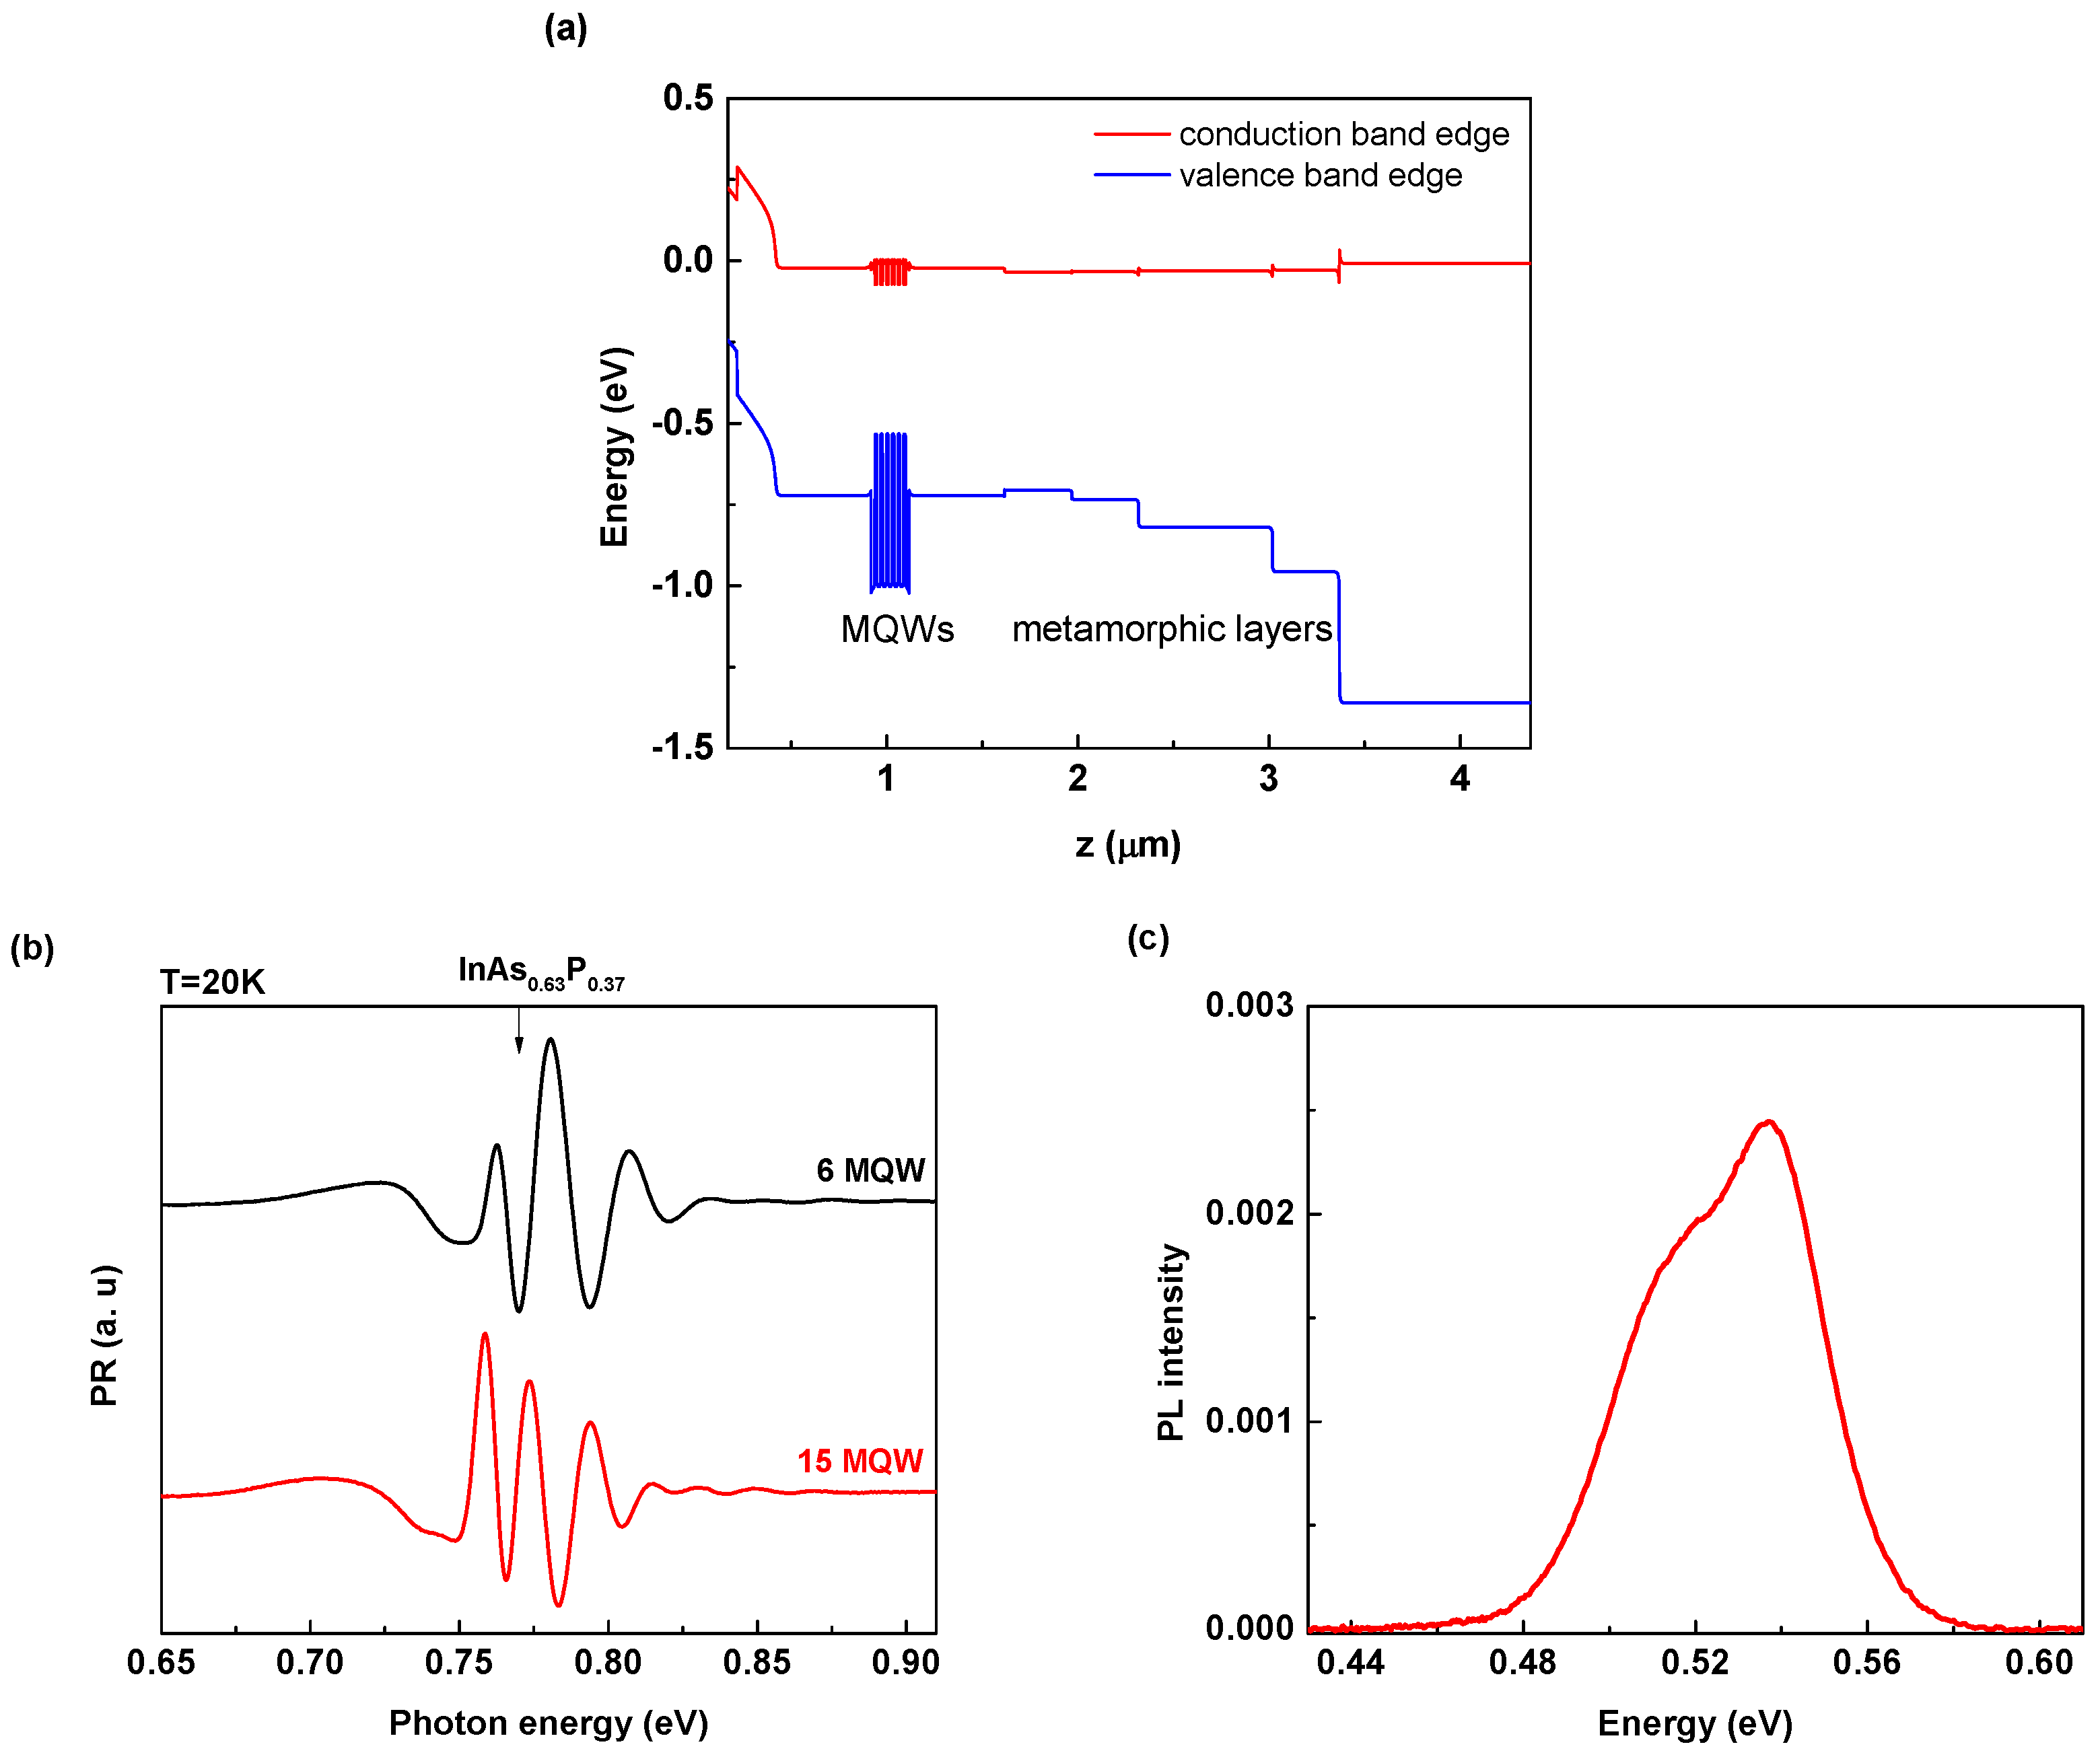
The band diagram of the structure (Figure 1) with 6 MQWs is shown in Figure 2a. The resulting PR spectra of the samples with both 6 and 15 MQWs were taken at 20 K and are presented in Figure 2b. We present the PR spectra obtained at low temperatures due to the significant noise observed in the spectra at higher temperatures (around room temperature). As the band diagram shows, the minimum energy can belong to the transitions in the QWs higher than the In0.83Ga0.17As band-to-band energy (∼0.47 eV at 20 K). The main band-to-band energy of InAs0.63P0.37 (∼0.77 eV at 20 K) is also depicted in Figure 2b. The spectra are confined to the range of 0.65–0.9 eV to better visualize the oscillations that appeared. It is noteworthy that, according to the calculations, the quantum well transitions are located around 0.52 eV, which is far from the selected range for the PR spectra shown in Figure 2b. The PL spectrum of the 15 MQW sample was measured, and the result is shown in Figure 2c. This spectrum also indicates that the QW transitions (estimated as the peak point of the PL spectrum) lie in the range of 0.52–0.54 eV, which almost coincides with the simulation results based on 8-band k.p theory. The asymmetric shape of the PL spectrum can be attributed to air absorption [11,48] and/or the presence of two different emission bands. The PL spectra confirm the calculated quantum well (QW) transition range. Additionally, it can be observed that the QW transitions are a significant distance from the FKO oscillations. However, as demonstrated in Figure 2b, altering the number of QWs strongly affects the FKO, suggesting that the number of QWs influences both the FKO frequency and the associated field. Section 3.5 will further explore this assumption through simulations of the field inside the structure.
Upon initial observation, two key points can be inferred from the PR spectra: a minor redshift observed in the 15 MQW spectrum compared to the 6 MQW spectrum, and significant variation in the oscillations observed in the energy range above the bandgap of InAsP. To consider this variation, in the remainder of this paper, we mainly focus on the differences in the oscillations that appeared. We claim that the oscillations are FKO-type; however, to demonstrate this, we need to monitor the field extracted from these oscillations and show that the extracted field obeys the electric field trends in the junction. Hence, considering the power and temperature dependence of the spectra is essential.
By observing the redshift of the 15 MQW structure compared to the 6 MQW structure, we can provide information with regard to their structures. The lattice constants of In0.83Ga0.17As and InAs0.3Sb0.05P0.65 are 5.9895 A° and 5.95672 A°, respectively, resulting in a ∼0.5% mismatch between the lattice constants. The top cladding layer (InAs0.63P0.37) lattice mismatch is ∼0.02%. The lattice constant of the InAsP layer value is adopted from [49], and for the InAsSbP sample, we used the lattice constants of InAs, InP, and InSb, along with Vegard’s law, to estimate the value [17]. Although these calculations suggest that the chosen lattice for the well/barrier and the cladding layer is almost lattice-matched, the small positive mismatch indicates that the strain is of the tensile type. Therefore, increasing the number of wells in this structure can impose a more tensile-type strain and decrease the energy states, as the PR results also demonstrated. Another possible reason for the observed redshift can be explained as follows. Increasing the number of QWs can lead to a redshift in the transition energy due to overlapping wavefunctions of charge carriers localized in the wells. In the present work, we focused on variations in field strength inside the structure, and determining how much these factors influence the observed redshift is an issue that could be addressed in future work.

3.2. Fast Fourier Transform (FFT) of the PR Spectra

Extracting the oscillation features in PR spectra is a well-known technique for identifying the various characteristics of the corresponding structure. Specifically, oscillations appearing in the intermediate field region for energies higher than the main bandgap (FKO) could be an appropriate tool for characterizing the interfaces and surfaces. An electro-optic function describes these oscillations, and the asymptotic form of PR spectra can be estimated using the following [20]:
R / R cos { ( 4 / 3 ) [ ( E E g ) / ( θ ) ] 3 / 2 + π ( d 1 ) / 2 } ,
where E g is the bandgap, ( θ ) 3 e 2 2 F 2 / 2 μ , d is the dimension of the critical point, F is the electric field strength in the depletion region, and μ is the reduced effective mass in the direction of the field. If we introduce the FFT into Equation (1), the frequency can be related to the field as follows:
f = ( 2 / 3 π ) ( 2 μ ) 1 / 2 ( 1 / e F ) .
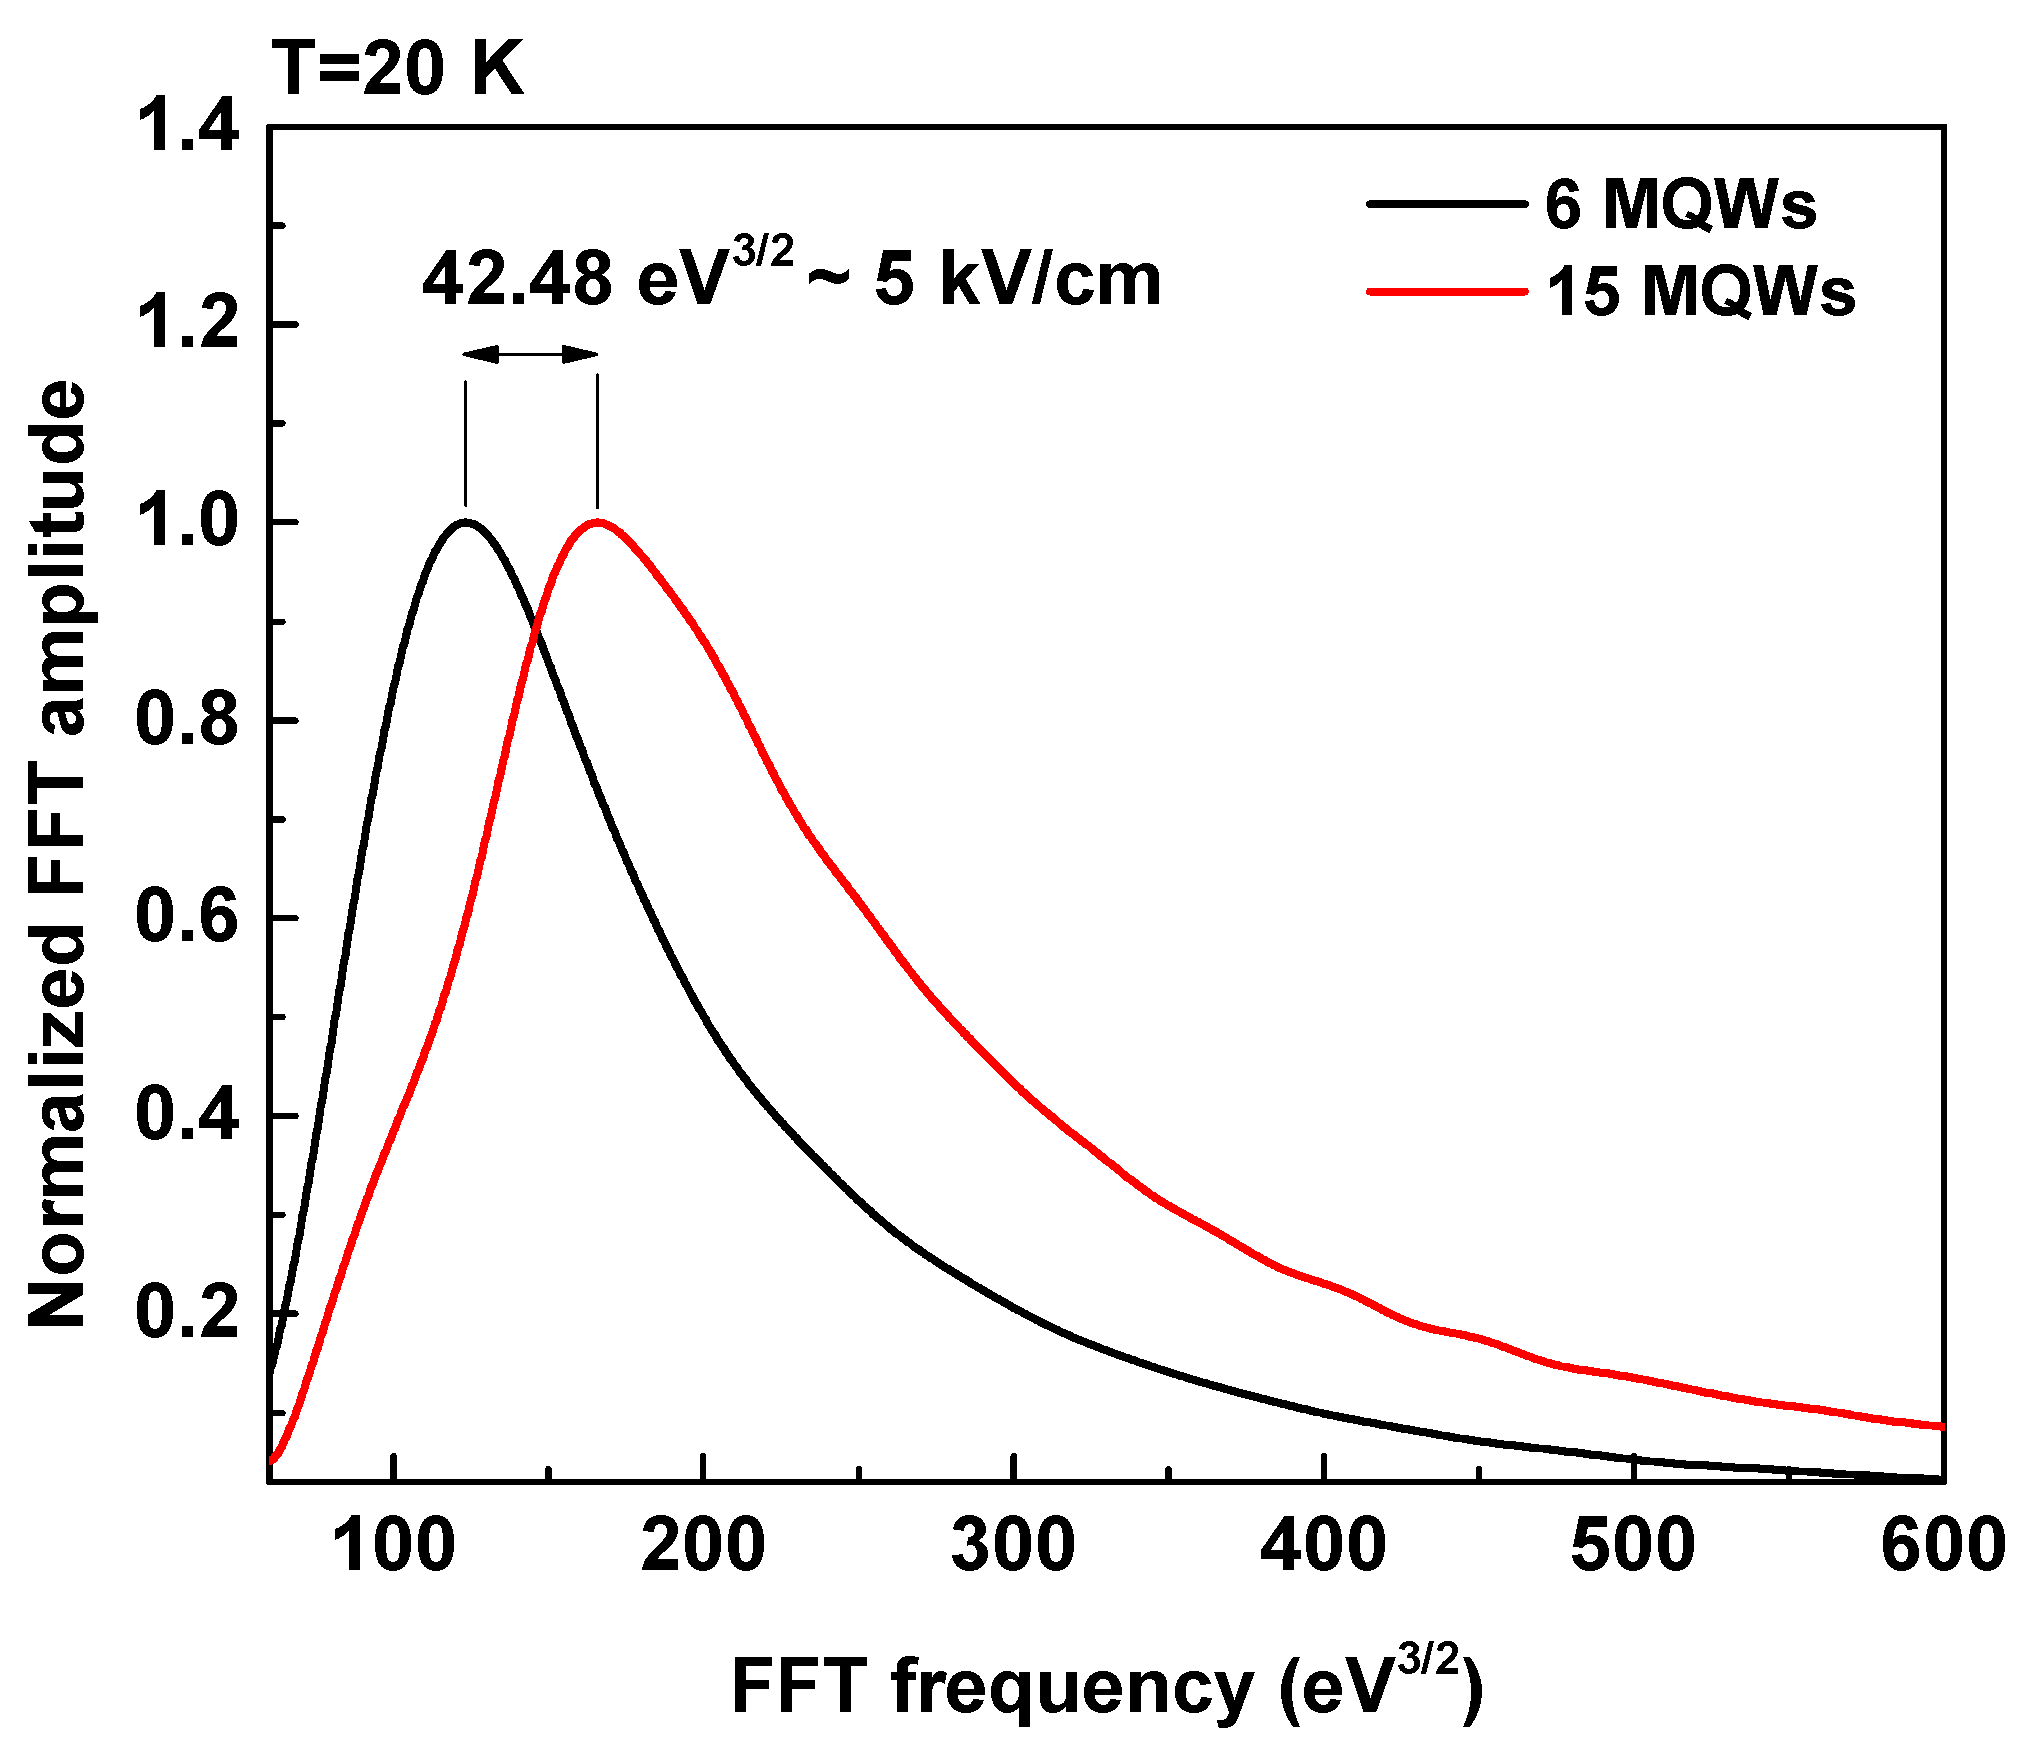
Therefore, with knowledge of the reduced mass and the frequency of the FFT, one can calculate the electric field in the junction. In this study, the InAsP resulting junction with the p-type top layer is assumed to be the depletion region in this structure. The reduced mass for InAsP with A s = 0.63 , calculated using the combination of material specifications [17], is found to be μ = 0.0535 m 0 . As a first step, we applied the FFT to the spectra of Figure 2b and presented the normalized results in Figure 3. As shown in the figure, for both spectra, there is a relatively broad FFT that reveals the incorporation of different frequencies in the PR spectra. However, one dominant frequency appears for both 6 and 15 MQWs near 123.3 and 165.7 eV−3/2, respectively. Using Equation (2), the electric fields for 6 and 15 MQWs are calculated to be 20.4 and 15.2 kV/cm, respectively. This primary result indicates that increasing the number of QWs from 6 to 15 leads to displacing FFT peak points that decrease field strength by 5 kV/cm for T = 20 K and I = 45 mW/cm2. To support this main result, we need to establish two points: firstly, the calculated field represents the field in the region, and secondly, the field belongs to a specific depth. For the remainder of this study, we investigate the power and temperature dependency of PR spectra to address these two points.

3.3. Power Dependence PR Spectra

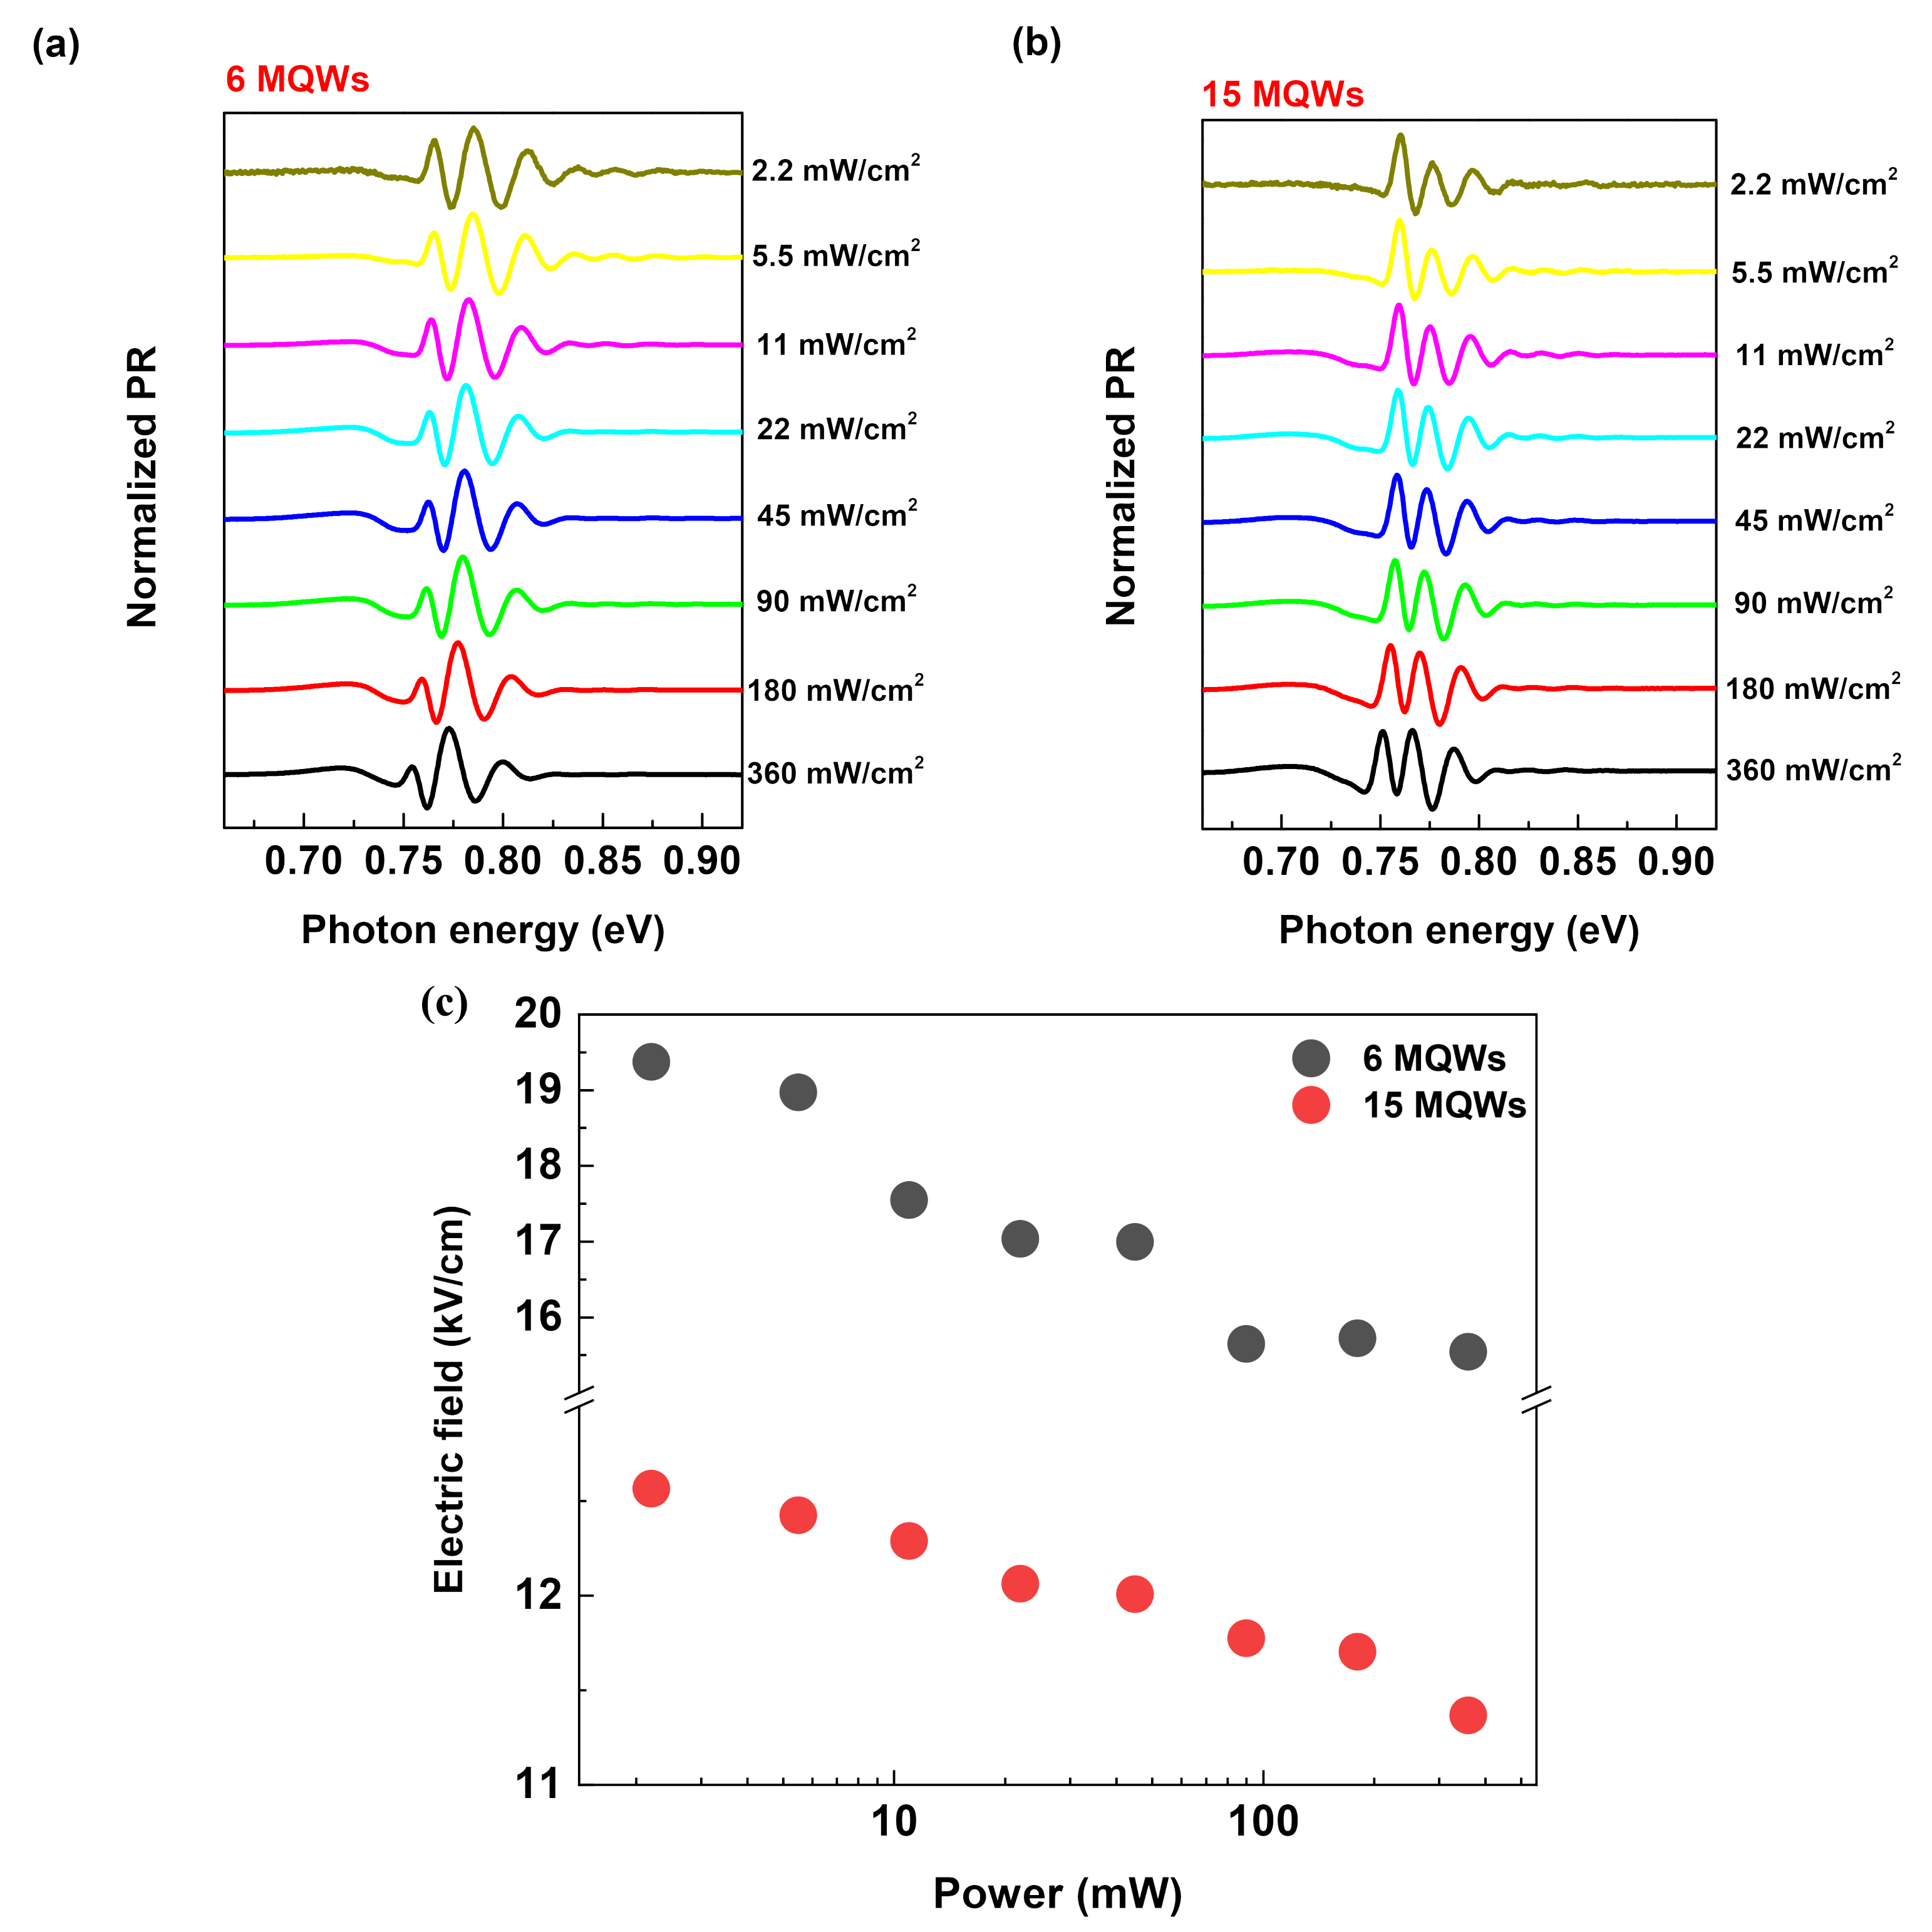
To further investigate the variations in oscillations presented in Figure 2b, we acquired power dependence PR spectra at 20 K for various powers in the range of 2.2–360 mW/cm2. The results, presented in Figure 4a,b, depict normalized spectra to better illustrate the differences between 6 and 15 MQWs. The spectra have changed in both cases: the amplitudes of the prominent three peaks have altered, and their periods could be varied through variations in excitation intensity. To consider these variations in detail, we employed the FFT method to determine the oscillation periods, extract the dominant frequency, and calculate the electric fields (following the procedure outlined in Section 3.2).
The final results of the electric field calculations for different excitation powers are shown in Figure 4c. As the figure shows, the field strength decreases with increasing power. This effect is directly related to the photovoltaic effect within the depletion region [50]. The field extracted from FKO obeys the below relation:
F p = F b i F p h ,
where F p is the field interfered with using FKO, F b i is the built-in electric field, and F p n is the field induced via the photovoltaic effect. Increasing the excitation power enhances the photovoltaic effect, and it, in turn, decreases the field extracted from FKO. Increasing the excitation power could enhance the photovoltaic effect due to a couple of reasons: Higher light intensities result in more photons hitting the material, thereby exciting more electrons and generating additional electron-hole pairs. Additionally, increasing excitation intensity increases the carrier generation rate. The rate at which electron–hole pairs are generated is directly proportional to the excitation power. Quantitatively, both phenomena increase the photocurrent through the junction, leading to a more substantial photovoltaic effect ( F p h ). If we assume that the dominant photocurrent in the junction is due to the drift current in the depletion region, we have [25]
J p = I e x η E ,
where I e x , η , and E represent the light intensity (in this case, the intensity of the pump laser beam), quantum efficiency, and the energy of incident photons, respectively. Suppose the efficiency is fixed for a specific junction; in that case, the photocurrent is proportional to the incident intensity. For a 6 MQW structure, the field strength decreases from approximately 19.3 to 15.5 kV/cm (a 20% reduction), while for a 15 MQW structure, it decreases from 12.5 to 11.3 kV/cm (a 10% reduction).

3.4. Temperature Dependence PR Spectra

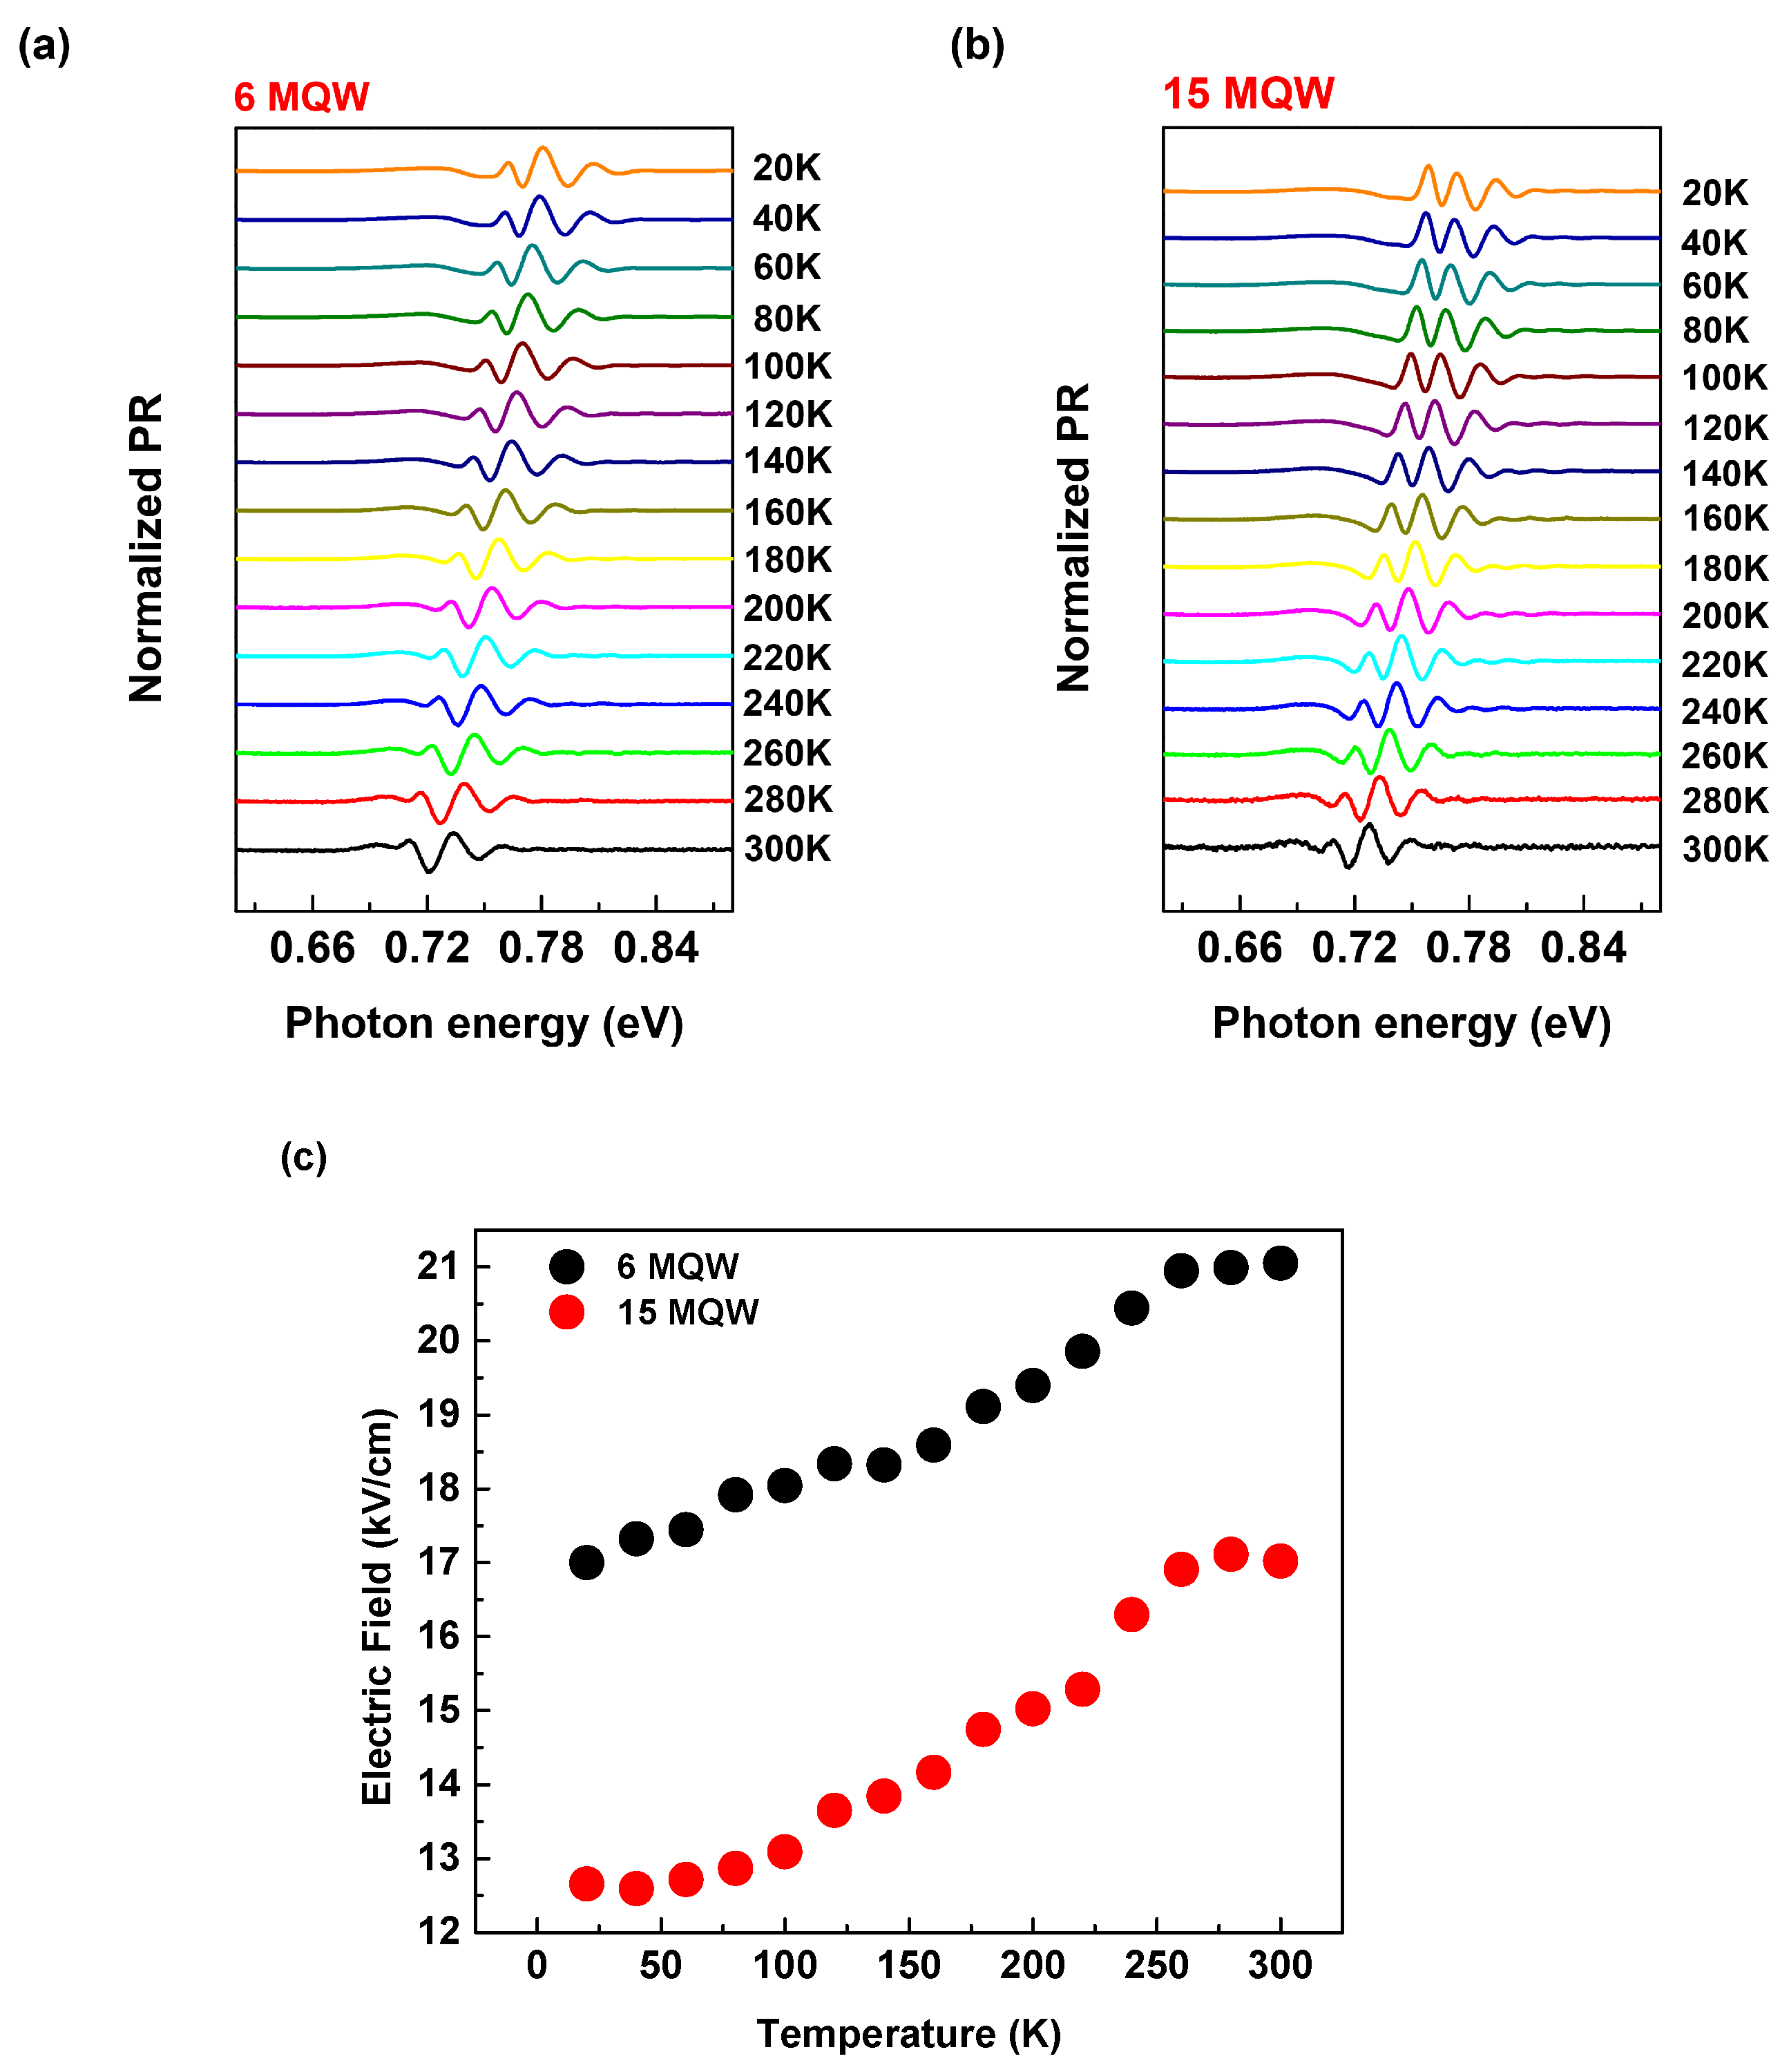
The PR spectra of 6 and 15 MQW structures were measured for temperatures ranging from 20 to 300 K for a specific excitation intensity (45 mW/cm2). The resulting spectra are shown in Figure 5a,b for samples with 6 and 15 MQWs, respectively. We applied the FFT method to all PRs at different temperatures, and the final result of the electric field calculation for the 6 and 15 MQW samples is shown in Figure 5c. This figure shows two primary outcomes: the electric field (derived with FKO oscillations) increases with temperature, and the electric field of the junction with 6 MQWs is higher than the field of the junction with 15 MQWs. The physical reason behind the temperature behavior of the electric field in junctions is well known. The maximum magnitude of the ideal electric field in the junction could described using [51]
F b i = 2 e V b i N a N d ϵ s ( N a + N d ) ,
where e is the elementary charge; V b i is the built-in potential barrier; N a and N d are acceptors and donor concentrations, respectively; and ϵ s is the permittivity. The potential can be described through the explicit formula
V b i = k T e ln ( N a N d n i 2 ) ,
which is proportional to the temperature. In the above equation, n i is the intrinsic carrier density in the material. Therefore, by combining Equations (5) and (6), one can conclude that an increase in temperature could lead to an increase in the electric field within the junctions, which is in good agreement with the experimental data (Figure 5c). For the 6 MQW structure, the electric field increased from approximately 17 kV/cm to 21 kV/cm, representing a 19% increase. Similarly, the 15 MQW structure experienced an increase in the electric field from 13 kV/cm to 17 kV/cm across a temperature range of 20 K up to room temperature, indicating a 23% increase.
We conclude the experimental subsection by highlighting that Figure 4c and Figure 5c validate our approach to determining the electric field using the FFT method. The observed physical trends in field strength across different excitation powers and temperatures align closely with the semiconductor theory discussed in each subsection.

3.5. Electric Field Simulations

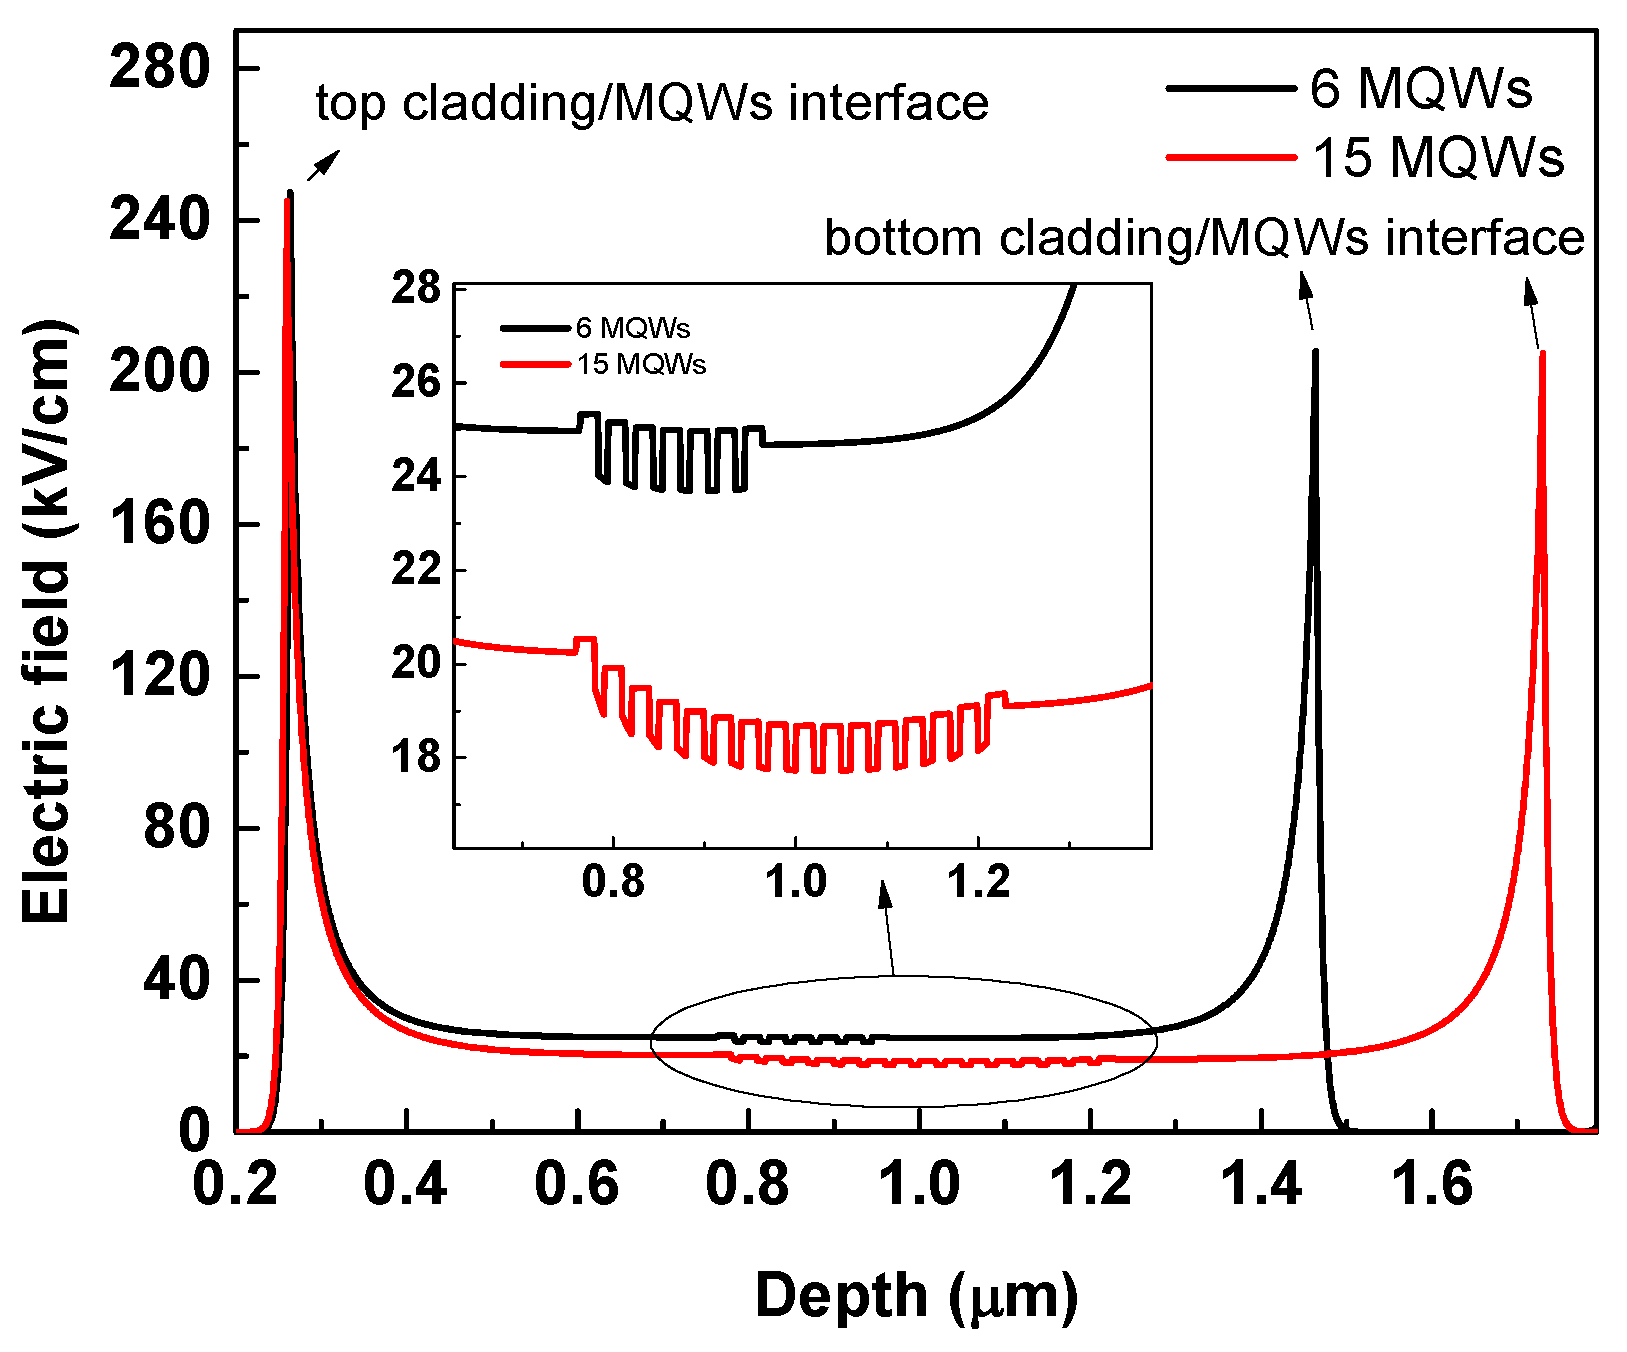
By utilizing the Poisson and continuity equations for charge carriers, it is possible to simulate the electric field strength in the structure [51]. Figure 6 illustrates the overall results of the simulation, depicting the variations in the electric field within the cladding layers and multiple quantum wells (MQWs) for structures with 6 and 15 MQWs. As Figure 6 illustrates, the electric field strength in the junctions of both the top cladding layer (InAsP)/MQWs and the bottom cladding layer (InAsP)/MQWs remains almost the same for both the 6 and 15 MQW structures. This is a physically expected result because the high thickness of InAsP cladding layers could prevent the number of MQWs from affecting the field in those interfaces. The calculated field for the first one is about 206 kV/cm, and for the second interface, it is about 170 kV/cm, both of which are very far from the electric field calculated through the FKO part of the PR. However, the field inside the MQW structures in the 18–26 kV/cm range is near the field extracted from FKOs. As demonstrated in the zoomed-in inset of the electric field distribution for 6 and 15 MQWs in the MQW depth range shown in the inset of Figure 6, the field strength for 15 MQWs is lower than 6 MQWs, which is fully consistent with our PR analysis. The difference between the calculated values and the field extracted from the FKOs can be attributed to the ideal conditions in the calculations.
The result from Figure 6 (inset) indicates that the charge distribution in the MQW region is nonuniform, possibly due to the partial escape of carriers (electrons and/or holes) from the quantum wells. This situation may influence the space charge effect, and insights into it could be gained by examining the charge distribution within the MQW regions. This aspect could be considered a separate investigation exploring the effects of the number of QWs on carrier distributions.
Possible reasons for the effect of the number of QWs on the electric field can be explained as follows. Increased carrier confinement is one possible explanation. With a greater number of periods in the 15 MQW structure, carriers (electrons and holes) are more effectively confined within the QWs. In fact, the relationship between the number of QWs and the confinement strength is not straightforward. The number of wells does not directly affect the size of each well. Thus, adding more wells would not necessarily increase the confinement experienced by a single electron in a single well. Things become interesting when we consider multiple closely spaced wells. Their wavefunctions can overlap, giving rise to coupling, creating minibands-essentially a series of allowed energy levels spread across all of the wells [52]. This confinement reduces the spatial distribution of the charge, leading to a lower average electric field across the entire structure. Another effect that can reduce the field by increasing well/barrier numbers is the screening effect. A greater number of free carriers in the thicker 15 MQW structure can create a screening effect, reducing the overall electric field strength within the active region. This is because the induced charges in the carriers partially oppose the external electric field.

4. Conclusions

Two InAsPSb/InGaAs MQW light-emitting diode structures with different numbers of wells (6 and 15) were characterized using photoreflectance spectroscopy, and the resulting spectra were compared. Notably, oscillations appeared in the spectra, monitored at different excitation powers and temperatures. These variations were identified as Franz-Keldysh oscillations and were used to calculate the electric field. The final result shows that increasing the number of quantum wells in these structures decreases the electric field. This decrease is accompanied by a redshift observed in the photoreflectance spectra of structures with 15 quantum wells relative to those with 6. The simulations also confirm the reduction in the field strength for the 15 MQW structure and demonstrate that the oscillations that appeared in the photoreflectance spectra can be attributed to the field within the multi-quantum well region. The electric field strength plays a crucial role in these types of diodes and may affect their overall performance. However, further measurements and characterizations may be necessary to understand this effect on other characteristics, such as electric properties, especially for devices with specific contacts.

Author Contributions

Writing—original draft, writing—review and editing, investigation, B.Z.F.; software, writing—review and editing, S.B.S.A.; writing—review and editing, T.I.K.; supervision, J.S.K.; resources, P.D.N. and S.J.L. All authors have read and agreed to the published version of the manuscript.

Funding

This research received no external funding.

Institutional Review Board Statement

Not applicable.

Informed Consent Statement

Not applicable.

Data Availability Statement

The original contributions presented in this study are included in the article.

Acknowledgments

This study was supported by grants from the National Research Foundation of Korea (NRF) funded by the Korean government (NRF—2022M3H4A1A0208533912, NRF—2021R1I1A305996311, and RS—2023-00234859).

Conflicts of Interest

The authors declare no conflicts of interest.

References

  1. Repiso, E.; Broderick, C.A.; de la Mata, M.; Arkani, R.; Lu, Q.; Marshall, A.R.J.; Molina, S.I.; O’Reilly, E.P.; Carrington, P.J.; Krier, A. Optical properties of metamorphic typeI InAs1−xSbx/AlyIn1−yAs quantum wells grown on GaAs for the mid-infrared spectral range. J. Phys. D Appl. Phys. 2019, 52, 465102. [Google Scholar] [CrossRef]
  2. Mikhailov, N.N.; Dvoretsky, S.A.; Remesnik, V.G.; Uzhakov, I.N.; Shvets, V.A.; Aleshkin, V.Y. Interband Electron Transitions Energy in Multiple HgCdTe Quantum Wells at Room Temperature. Photonics 2023, 10, 430. [Google Scholar] [CrossRef]
  3. Chen, B.; Chen, Y.; Deng, Z. Recent advances in high speed photodetectors for eSWIR/MWIR/LWIR applications. Photonics 2021, 8, 14. [Google Scholar] [CrossRef]
  4. Popov, A.A.; Sherstnev, V.V.; Yakovlev, Y.P.; Baranov, A.N.; Alibert, C. Powerful mid-infrared light emitting diodes for pollution monitoring. Electron. Lett. 1997, 33, 86–88. [Google Scholar] [CrossRef]
  5. Stephan, S.; Frederic, D.; Markus Christian, A. Novel Inp and GaSb based light sources for the near to far infrared. Semicond. Sci. Technol. 2016, 31, 113005. [Google Scholar] [CrossRef]
  6. Koike, M.; Shibata, N.; Kato, H.; Takahashi, Y. Development of high efficiency GaN-based multiquantum-well light-emitting diodes and their applications. IEEE J. Sel. Top. Quantum Electron. 2002, 8, 271–277. [Google Scholar] [CrossRef]
  7. Wu, S.; Zhang, L.; Wan, R.; Zhou, H.; Lee, K.H.; Chen, Q.; Huang, Y.C.; Gong, X.; Tan, C.S. Ge0.92Sn0.08/Ge multi-quantum-well LEDs operated at 2 μm-wavelength on a 12 inch Si substrate. Photonics Res. 2023, 11, 1606–1612. [Google Scholar] [CrossRef]
  8. Peng, L.; Li, X.; Zheng, J.; Liu, X.; Li, M.; Liu, Z.; Xue, C.; Zuo, Y.; Cheng, B. Room-temperature direct-bandgap electroluminescence from type-I GeSn/SiGeSn multiple quantum wells for 2 μm LEDs. J. Lumin. 2020, 228, 117539. [Google Scholar] [CrossRef]
  9. Hlavatsch, M.; Mizaikoff, B. Advanced mid-infrared lightsources above and beyond lasers and their analytical utility. Anal. Sci. 2022, 38, 1125–1139. [Google Scholar] [CrossRef]
  10. Mensz, P.M.; Dror, B.; Ajay, A.; Bougerol, C.; Monroy, E.; Orenstein, M.; Bahir, G. Design and implementation of bound-to-quasibound GaN/AlGaN photovoltaic quantum well infrared photodetectors operating in the short wavelength infrared range at room temperature. J. Appl. Phys. 2019, 125, 174505. [Google Scholar] [CrossRef]
  11. Seyedein Ardebili, S.B.; Kim, J.S.; Ha, J.; Kang, T.I.; Zeinalvand Farzin, B.; Kim, Y.; Lee, S.J. Band-to-Band Transitions in InAs/GaSb Multi-Quantum-Well Structures Using kp Theory: Effects of Well/Barrier Width and Temperature. Energies 2023, 16, 1162. [Google Scholar] [CrossRef]
  12. Altayar, A.R.; Al-Saymari, F.A.; Repiso, E.; Hanks, L.; Craig, A.P.; Bentley, M.; Delli, E.; Carrington, P.J.; Krier, A.; Marshall, A.R.J. Electroluminescence characterization of mid-infrared InAsSb/AlInAs multi-quantum well light emitting diodes heteroepitaxially integrated on GaAs and silicon wafers. J. Cryst. Growth 2022, 586, 126627. [Google Scholar] [CrossRef]
  13. Krier, A.; Huang, X.L.; Sherstnev, V.V. Mid-infrared electroluminescence in LEDs based on InAs and related alloys. In Mid-Infrared Semiconductor Optoelectronics; Springer: Berlin/Heidelberg, Germany, 2006; pp. 359–394. [Google Scholar]
  14. Delli, E.; Hodgson, P.D.; Bentley, M.; Repiso, E.; Craig, A.P.; Lu, Q.; Beanland, R.; Marshall, A.R.J.; Krier, A.; Carrington, P.J. Mid-infrared type-II InAs/InAsSb quantum wells integrated on silicon. Appl. Phys. Lett. 2020, 117, 131103. [Google Scholar] [CrossRef]
  15. Cheetham, K.J.; Krier, A.; Patel, I.I.; Martin, F.L.; Tzeng, J.S.; Wu, C.J.; Lin, H.H. Raman scattering in InAsxSbyP1−xy alloys grown by gas source MBE. J. Phys. D Appl. Phys. 2011, 44, 085405. [Google Scholar] [CrossRef]
  16. Keen, J.A.; Lane, D.; Kesaria, M.; Marshall, A.R.J.; Krier, A. InAs/InAsSb type-II strained-layer superlattices for mid-infrared LEDs. J. Phys. D Appl. Phys. 2018, 51, 075103. [Google Scholar] [CrossRef]
  17. Vurgaftman, I.; áR Meyer, J.; Ram-Mohan, L.R. Band parameters for III–V compound semiconductors and their alloys. J. Appl. Phys. 2001, 89, 5815–5875. [Google Scholar] [CrossRef]
  18. Park, S.; Nguyen, P.D.; Kim, M.; Jeon, J.; Kim, Y.; Lee, S.J. Monolithic In0.83Ga0.17As multiple quantum well light-emitting diodes using InAsPSb wide bandgap barrier. In Advanced Solid State Lasers; Greater Tacoma Convention Center Tacoma: Washington, DA, USA, 2022; p. JTu6A-1. [Google Scholar]
  19. Park, S.; Jeon, J.; More, V.M.; Lee, R.S.; Seo, Y.; Kim, M.; Nguyen, P.D.; Kim, M.; Kim, J.S.; Kim, Y.; et al. Monolithic two-color short-wavelength InGaAs infrared photodetectors using InAsP metamorphic buffers. Appl. Surf. Sci. 2022, 581, 152421. [Google Scholar] [CrossRef]
  20. Misiewicz, J.; Sitarek, P.; Sek, G.; Kudrawiec, R. Semiconductor heterostructures and device structures investigated by photoreflectance spectroscopy. Mater. Sci. 2003, 21, 263–318. [Google Scholar]
  21. Zhang, B.; Qiu, W.Y.; Chen, P.P.; Wang, X.J. Photoreflectance and photoreflectance excitation study of optical transitions in GaAsBi/GaAs heterostructure. J. Appl. Phys. 2018, 123, 035702. [Google Scholar] [CrossRef]
  22. Vashisht, G.; Porwal, S.; Haldar, S.; Dixit, V.K. Influence of interface states on built-in electric field and diamagnetic-Landau energy shifts in asymmetric modulation-doped InGaAs/GaAs QWs. J. Phys. D Appl. Phys. 2022, 55, 385101. [Google Scholar] [CrossRef]
  23. Zeinalvand Farzin, B.; Lee, D.; Kang, T.I.; Kim, J.S.; Kim, G.H.; Lee, S.J.; Kim, Y. Phase-sensitive analysis of a two-color infrared photodetector using photoreflectance spectroscopy. J. Appl. Phys. 2023, 134, 135305. [Google Scholar] [CrossRef]
  24. Saladukha, D.; Clavel, M.B.; Murphy-Armando, F.; Greene-Diniz, G.; Grüning, M.; Hudait, M.K.; Ochalski, T.J. Direct and indirect band gaps in Ge under biaxial tensile strain investigated by photoluminescence and photoreflectance studies. Phys. Rev. B 2018, 97, 195304. [Google Scholar] [CrossRef]
  25. Zeinalvand Farzin, B.; Lee, D.; Kim, G.H.; Ha, J.; Kim, J.S.; Kim, Y.; Lee, S.J. Correlation between the time constant of a photoreflectance signal and the quantum efficiency of a pn junction. J. Korean Phys. Soc. 2023, 82, 692–698. [Google Scholar] [CrossRef]
  26. Jani, H.; Chen, L.; Duan, L. Pre-emission study of photoelectron dynamics in a GaAs/AlGaAs photocathode. IEEE J. Quantum Electron. 2019, 56, 1–8. [Google Scholar] [CrossRef]
  27. Zhou, R.; Jani, H.; Zhang, Y.; Qian, Y.; Duan, L. Photoelectron transportation dynamics in GaAs photocathodes. J. Appl. Phys. 2021, 130, 113101. [Google Scholar] [CrossRef]
  28. Zhou, R.; Jani, H.; Zhang, Y.; Qian, Y.; Duan, L. Dynamic photoelectron transport in stepwise-doped GaAs photocathodes. Sci. Rep. 2022, 12, 12936. [Google Scholar] [CrossRef] [PubMed]
  29. Komkov, O.S.; Khakhulin, S.A.; Firsov, D.D.; Avdienko, P.S.; Sedova, I.V.; Sorokin, S.V.E. Investigation of built-in electric fields at the GaSe/GaAs interface by photoreflectance spectroscopy. Semiconductors 2020, 54, 1198–1204. [Google Scholar] [CrossRef]
  30. Jin, J.; Tian, D.; Shi, J.; Li, T. Study on the effects of well number on temperature characteristics in 1.3 μm InGaAsP/InP quantum-well lasers. Infrared Phys. Technol. 2004, 45, 209–215. [Google Scholar] [CrossRef]
  31. Goharrizi, A.Z.; Alahyarizadeh, G.; Hassan, Z.; Hassan, H.A. Study on effect of quantum well number on performance characteristics of GaN-based vertical cavity surface emitting laser. Phys. E Low Dimens. Syst. Nanostruct. 2013, 50, 61–66. [Google Scholar] [CrossRef]
  32. Choi, H.S.; Zheng, D.G.; Kim, H.; Shim, J.I.; Shin, D.S. Effects of the number of quantum wells on the performance of near-ultraviolet light-emitting diodes. J. Korean Phys. Soc. 2015, 66, 1554–1558. [Google Scholar] [CrossRef]
  33. Bushnell, D.B.; Tibbits, T.N.D.; Barnham, K.W.J.; Connolly, J.P.; Mazzer, M.; Ekins-Daukes, N.J.; Roberts, J.S.; Hill, G.; Airey, R. Effect of well number on the performance of quantum-well solar cells. J. Appl. Phys. 2005, 97, 124908. [Google Scholar] [CrossRef]
  34. Ganesh, K.S.; Fan, L.; Wang, B.; Jeevan Kumar, P.; Zhu, B. Built-in electric field for efficient charge separation and ionic transport in LiCoO2/SnO2 semiconductor junction fuel cells. ACS Appl. Energy Mater. 2022, 5, 12513–12522. [Google Scholar] [CrossRef]
  35. Su, L.; Yang, W.; Cai, J.; Chen, H.; Fang, X. Self-powered ultraviolet photodetectors driven by built-in electric field. Small 2017, 13, 1701687. [Google Scholar] [CrossRef]
  36. Xu, H.; Li, J.; Chu, X. Interfacial built-in electric-field for boosting energy conversion electrocatalysis. Nanoscale Horiz. 2023, 8, 441–452. [Google Scholar] [CrossRef]
  37. Gladysiewicz, M.; Janicki, L.; Misiewicz, J.; Sobanska, M.; Klosek, K.; Zytkiewicz, Z.R.; Kudrawiec, R. Engineering of electric field distribution in GaN(cap)/AlGaN/GaN heterostructures: Theoretical and experimental studies. J. Phys. D Appl. Phys. 2016, 49, 345106. [Google Scholar] [CrossRef]
  38. Dyakonova, N.; Karandashev, S.A.; Levinshtein, M.E.; Matveev, B.A.; Remennyi, M.A.; Usikova, A.A. Low frequency noise in p-InAsSbP/n-InAs infrared light emitting diode-photodiode pairs. Infrared Phys. Technol. 2021, 117, 103867. [Google Scholar] [CrossRef]
  39. Dyakonova, N.; Karandashev, S.A.; Levinshtein, M.E.; Matveev, B.A.; Remennyi, M.A. Low frequency noise in p-InAsSbP/n-InAs/n-InAsSbP and p-InAsSbP/n-InAsSbP mid-IR light emitting diodes. Infrared Phys. Technol. 2022, 125, 104301. [Google Scholar] [CrossRef]
  40. Harutyunyan, V.G.; Gambaryan, K.M.; Aroutiounian, V.M.; Harutyunyan, I.G. InAsSbP quantum dot mid-IR photodetectors operating at room temperature. Infrared Phys. Technol. 2015, 70, 12–14. [Google Scholar] [CrossRef]
  41. Chakrabarti, P. Numerical modeling of an InAsSb/InAsSbP double heterojunction light emitting diode for mid-infrared (2–5 μm) applications. Infrared Phys. Technol. 2014, 67, 382–386. [Google Scholar]
  42. Brunkov, P.N.; Il’inskaya, N.D.; Karandashev, S.A.; Karpukhina, N.G.; Lavrov, A.A.; Matveev, B.A.; Remennyi, M.A.; Usikova, A.A. Low dark current p-InAsSbP/n-InAs/n-InAsSbP/n+-InAs double heterostructure back-side illuminated photodiodes. Infrared Phys. Technol. 2016, 76, 542–545. [Google Scholar] [CrossRef]
  43. Sukach, G.A.; Bogoslovskaya, A.B.; Oleksenko, P.F. Effect of Auger recombination on thermal processes in InGaAs and InAsSbP IR-emitting diodes. Infrared Phys. Technol. 2000, 41, 299–306. [Google Scholar] [CrossRef]
  44. Krier, A.; Mao, Y. High performance uncooled InAsSbP/InGaAs photodiodes for the 1.8–3.4 μm wavelength range. Infrared Phys. Technol. 1997, 38, 397–403. [Google Scholar] [CrossRef]
  45. Gong, X.Y.; Kan, H.; Makino, T.; Watanabe, K.; Iida, T.; Suzuki, H.; Aoyama, M.; Yamaguchi, T. Light Emitting Diodes Fabricated from Liquid Phase Epitaxial InAs/InAsxP1−xySby/InAsxP1−x′−ySby and InAs/InAs1−xSbx Multi-Layers. Cryst. Res. Technol. 2000, 35, 549–555. [Google Scholar] [CrossRef]
  46. Klem, J.F.; Olesberg, J.T.; Hawkins, S.D.; Weiner, P.H.; Deitz, J.; Kadlec, C.N.; Shaner, E.A.; Coon, W.T. Extended-short-wavelength infrared AlInAsSb and InPAsSb detectors on InAs. Infrared Technol. Appl. XLVII 2021, 11741, 19–27. [Google Scholar]
  47. Shen, H.; Dutta, M. Sweeping photoreflectance spectroscopy of semiconductors. Appl. Phys. Lett. 1990, 57, 587–589. [Google Scholar] [CrossRef]
  48. Majaron, B.; Verkruysse, W.; Tanenbaum, B.S.; Milner, T.E.; Nelson, J.S. Spectral variation of the infrared absorption coefficient in pulsed photothermal profiling of biological samples. Phys. Med. Biol. 2002, 47, 1929. [Google Scholar] [CrossRef] [PubMed]
  49. Wada, M.; Araki, S.; Kudou, T.; Umezawa, T.; Nakajima, S.; Ueda, T. Temperature dependence of the band gap in InAsyP1−y. Appl. Phys. Lett. 2000, 76, 2722–2724. [Google Scholar] [CrossRef]
  50. Yoon, S.; Lee, S.H.; Shin, J.C.; Kim, J.S.; Lee, S.J.; Leem, J.Y.; Krishna, S. Photoreflectance study on the photovoltaic effect in InAs/GaAs quantum dot solar cell. Curr. Appl. Phys. 2018, 18, 667–672. [Google Scholar] [CrossRef]
  51. Neamen, D. Semiconductor Physics and Devices; McGraw-Hill, Inc.: New York, NY, USA, 2002. [Google Scholar]
  52. Tanaka, K.; Fujiwara, M.; Happo, N.; Takahashi, S. Minibands of eigen-state energies of In0.53Ga0.47As multi-quantum wells lattice-matched to InP. Opt. Quantum Electron. 2018, 50, 301. [Google Scholar] [CrossRef]
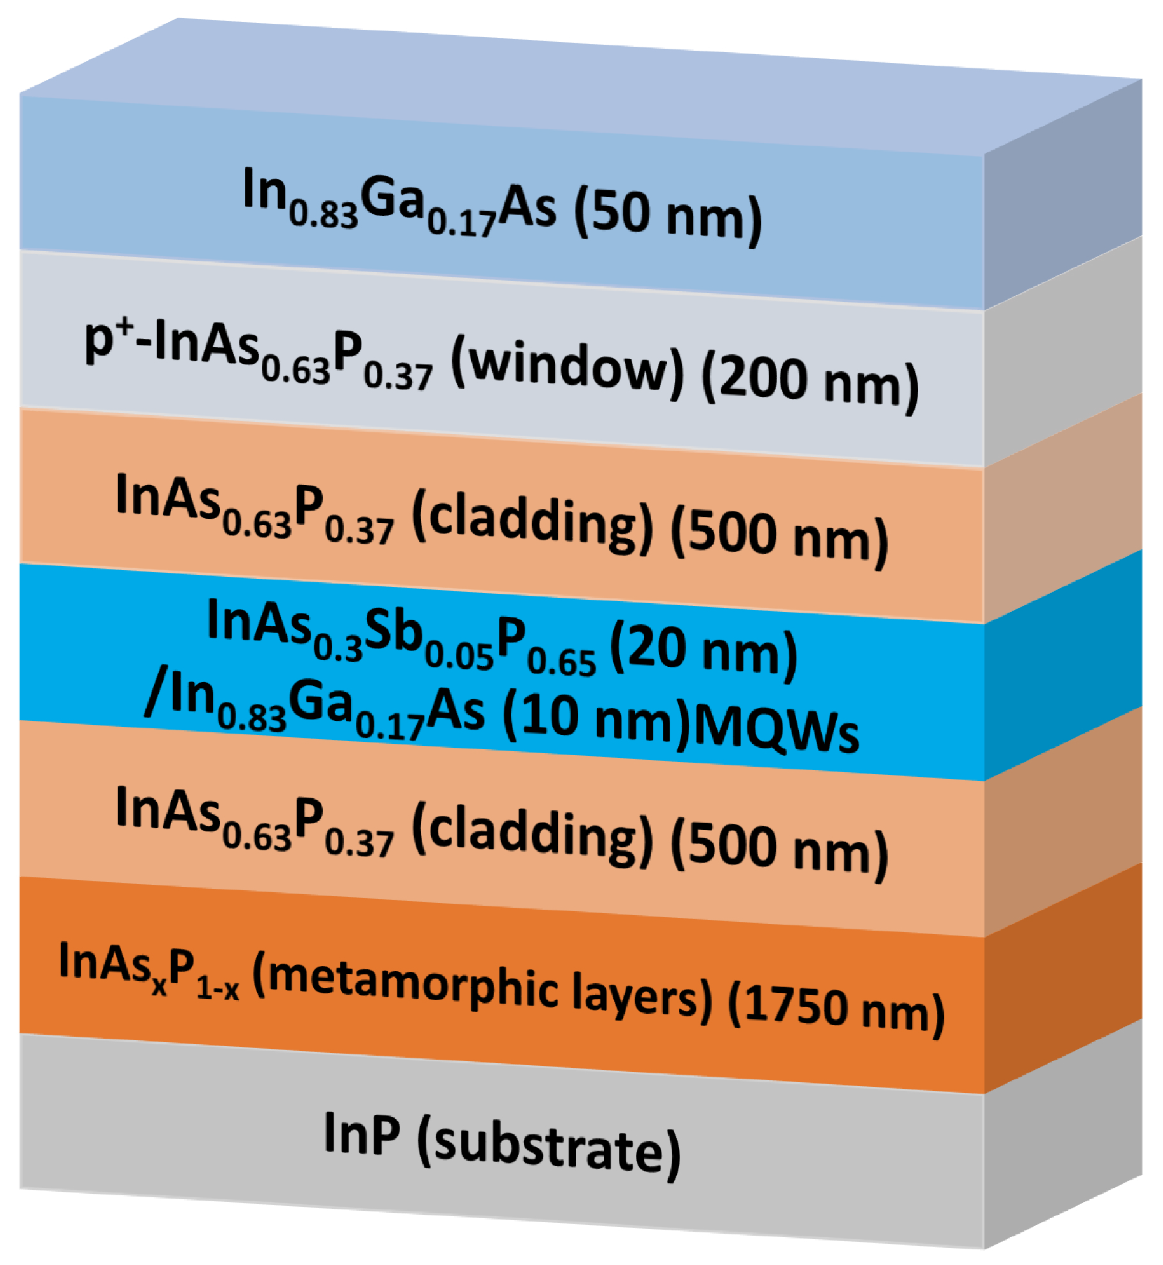
Figure 1. Schematic diagram of InAsSbP/InGaAs MQW LED structures. Samples include those with 6 and 15 MQWs.
Photonics 11 00277 g001
Figure 2. (a) A band diagram of the structure with 6 MQWs, the red and blue lines show the conduction and valence band edges, respectively, (b) the PR spectra for samples with 6 and 15 MQWs at 20 K and an excitation intensity of 45 mW/cm2, and (c) PL spectrum of sample with 15 MQWs at 20 K.
Photonics 11 00277 g002
Figure 3. Fast Fourier transform (FFT) of the PR spectra for 6 and 15 MQW LED structures (Figure 2b).
Photonics 11 00277 g003
Figure 4. The power dependence PR spectra for (a) 6 and (b) 15 MQW InAsSbP/InGaAs LED structures and (c) the variation in the electric field versus various excitation powers.
Photonics 11 00277 g004
Figure 5. The temperature dependence PR spectra for (a) 6 and (b) 15 MQW InAsSbP/InGaAs LED structures and (c) the variation in the electric field based on various temperatures.
Photonics 11 00277 g005
Figure 6. Electric field profile based on the depth of top and bottom cladding/MQW interfaces for structures with 6 and 15 MQWs. The inset shows a close-up view of the MQW depth range.
Photonics 11 00277 g006
Disclaimer/Publisher’s Note: The statements, opinions and data contained in all publications are solely those of the individual author(s) and contributor(s) and not of MDPI and/or the editor(s). MDPI and/or the editor(s) disclaim responsibility for any injury to people or property resulting from any ideas, methods, instructions or products referred to in the content.