Article

Substrate-Assisted Laser-Induced Breakdown Spectroscopy Combined with Variable Selection and Extreme Learning Machine for Quantitative Determination of Fenthion in Soybean Oil

1
Jiangsu Key Laboratory of Big Data Analysis Technology, Nanjing University of Information Science & Technology, Nanjing 210044, China
2
Jiangsu Collaborative Innovation Center on Atmospheric Environment and Equipment Technology, Nanjing University of Information Science & Technology, Nanjing 210044, China
3
Quanzhou University of Information Engineering, Quanzhou 362008, China
*
Author to whom correspondence should be addressed.
Photonics 2024, 11(2), 129; https://doi.org/10.3390/photonics11020129
Submission received: 5 November 2023 / Revised: 23 December 2023 / Accepted: 25 January 2024 / Published: 30 January 2024
(This article belongs to the Special Issue Technologies and Applications of Spectroscopy)

Abstract

:
The quality and safety of edible vegetable oils are closely related to human life and health, meaning it is of great significance to explore the rapid detection methods of pesticide residues in edible vegetable oils. This study explored the applicability potential of substrate-assisted laser-induced breakdown spectroscopy (LIBS) for quantitatively determining fenthion in soybean oils. First, we explored the impact of laser energy, delay time, and average oil film thickness on the spectral signals to identify the best experimental parameters. Afterward, we quantitatively analyzed soybean oil samples using these optimized conditions and developed a full-spectrum extreme learning machine (ELM) model. The model achieved a prediction correlation coefficient (RP2) of 0.8417, a root mean square error of prediction (RMSEP) of 167.2986, and a mean absolute percentage error of prediction (MAPEP) of 26.46%. In order to enhance the prediction performance of the model, a modeling method using the Boruta algorithm combined with the ELM was proposed. The Boruta algorithm was employed to identify the feature variables that exhibit a strong correlation with the fenthion content. These selected variables were utilized as inputs for the ELM model, with the RP2, RMSEP, and MAPEP of Boruta-ELM being 0.9631, 71.4423, and 10.06%, respectively. Then, the genetic algorithm (GA) was used to optimize the parameters of the Boruta-ELM model, with the RP2, RMSEP, and MAPEP of GA-Boruta-ELM being 0.9962, 11.005, and 1.66%, respectively. The findings demonstrate that the GA-Boruta-ELM model exhibits excellent prediction capability and effectively predicts the fenthion contents in soybean oil samples. It will be valuable for the LIBS quantitative detection and analysis of pesticide residues in edible vegetable oils.

1. Introduction

With the accelerated advancement of agricultural technology, the use of pesticides to control crop diseases and pests is becoming more prevalent [1]. Growers depend on organophosphorus pesticides as crucial resources to prevent and control pest and weed invasion in crops, thereby improving crop productivity. Nevertheless, this has also resulted in a worrisome increase in the presence of pesticide residues detected in agricultural commodities [2]. Fenthion, a highly efficient and adaptable organophosphorus insecticide [3], is widely employed to control pests and diseases in oilseed crops. However, the extensive use of fenthion has led to serious pollution in the crop’s surrounding environment. Consequently, there is a risk of elevated levels of fenthion residues in processed vegetable oils, which can pose a danger to human health. Therefore, it is crucial to enhance the detection and analysis of fenthion residues in edible vegetable oils.
Currently, the process of analyzing and identifying organophosphorus pesticides in edible vegetable oils consists of two main steps: extracting the pesticide residues and performing instrumental detection. The gas chromatography (GC) [4,5] and liquid chromatography (LC) [6,7] methods are widely utilized to analyze pesticide residues. These techniques require a complex process to prepare the samples. Prior to the determination of pesticide residues, complicated steps are required to extract and purify the pesticide components from the sample. Current techniques used to extract pesticides from edible vegetable oils involve solid-phase extraction (SPE) [8,9] and liquid–liquid extraction (LLE) [10,11] methods. The process of extracting pesticides from the samples is quite time-consuming because it is challenging to remove fats with high molecular weight. This difficulty leads to the inefficient extraction of pesticides. Additionally, they do not meet the requirement for real-time detection in the practice on-site situation. Laser-induced breakdown spectroscopy (LIBS) is a rapid and efficient method for analyzing the elements present in a sample. It involves using a high-energy pulsed laser to ablate the surface of the sample, creating a high-temperature plasma. Then, the feature spectral lines of the radiated elements from this plasma can be collected for qualitative and quantitative analysis of the sample [12,13,14]. This method features rapid detection, simple sample preparation, real-time online detection of multiple elements, and a small sample size requirement [15,16]. It has been employed extensively in food analysis [17], coal metallurgy [18], environmental monitoring [19], and medical diagnosis [20].
Researchers have employed LIBS technology to conduct a series of studies to address the issue of pesticide residues in agricultural products. Kim et al. [21] rapidly identified pesticide-contaminated spinach using the LIBS technique combined with PLS-DA. It demonstrated that the identification accuracy for clean spinach and pesticide-contaminated spinach were 100% and 98%, respectively. Du et al. [22] used the LIBS technique to detect chlorpyrifos residues on the apples’ surface directly. They discovered P I 253.56 nm and P I 255.33 nm characteristic spectral lines and confirmed the differences in the LIBS spectra signal intensity among different matrices and pesticides. Martino et al. [23] utilized nanometallic particles to improve the LIBS detection signal of chlorpyrifos residues in fruits and vegetables. The technique increased the detection limit of pesticide residues in fruits and vegetables by two orders of magnitude. The ability to directly acquire elemental spectral data from analyzed samples makes LIBS a promising technique for quantitatively detecting pesticide residues in agricultural products. It is anticipated that LIBS will have the capability to conduct real-time quantitative analysis of pesticide residues in edible vegetable oils. Furthermore, the combination of LIBS technology with machine learning models is expected to improve the precision of pesticide residue detection using LIBS. To improve the LIBS detection signal for oil samples, the researchers used a substrate-assisted method [24,25,26]. The substrate was involved in generating a mixed plasma and effectively increased the temperature of the plasma. It changed the oil environment for direct ablation and reduced the breakdown threshold. The detection signal of the elements in the oil was effectively improved. This method is expected to provide conditions for LIBS detection of soybean oil.
In this study, we employed a substrate-assisted [24,25,26] LIBS method to quantitatively determine fenthion contents in soybean oils. Firstly, we explored the effects of laser energy, delay time, and average oil film thickness on the LIBS spectral signals. Secondly, we employed the feature variables selected by the Boruta algorithm as the inputs of the extreme learning machine (ELM) model. Then, we utilized the genetic algorithm (GA) to further optimize the parameters of the Boruta-ELM model. The GA-Boruta-ELM model was constructed to explore its effect on enhancing the precision of quantitative analysis. Finally, we compared the prediction ability of different models for fenthion contents in soybean oils and selected an appropriate quantitative model. This work provides a reference for the application and development of LIBS in the quantitative detection of pesticide residues in edible vegetable oils.

2. Experimental

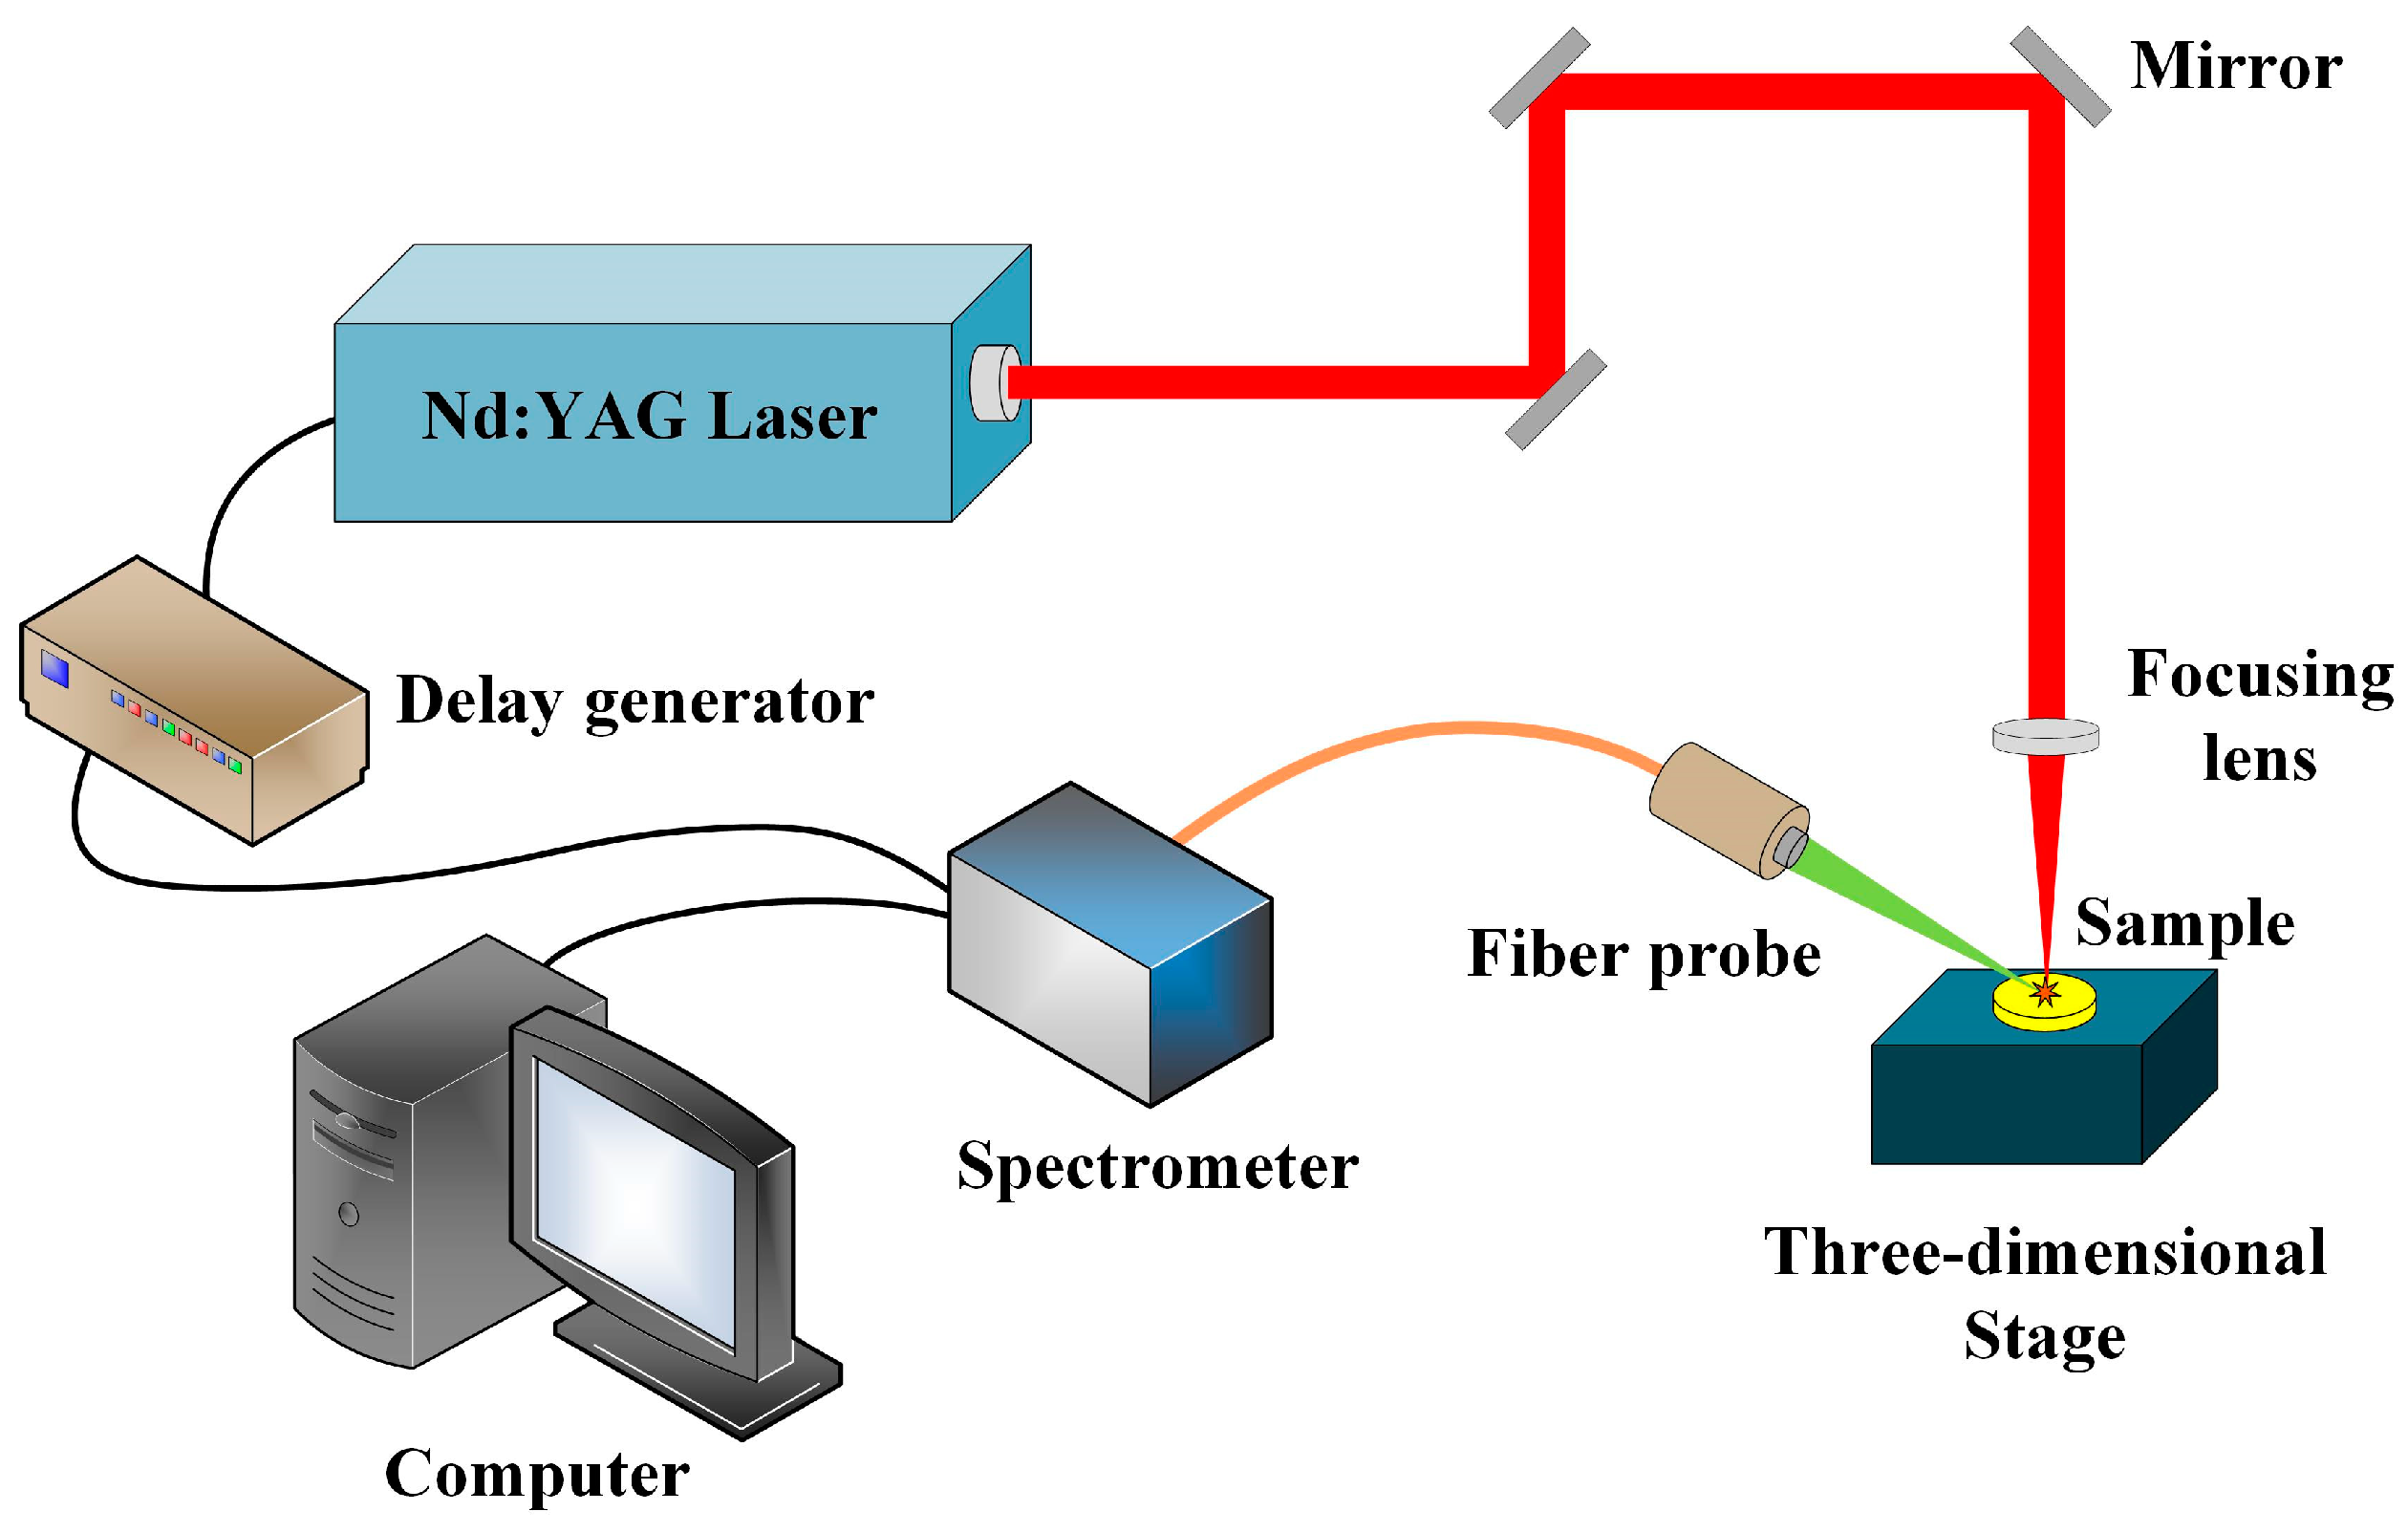
2.1. Experimental Setup

Figure 1 shows the LIBS experimental setup used for this paper. The excitation source is a lamp-pumped electro-optically modulated Q nanosecond laser (Dawa-200, Beamtech, Beijing, China) with a maximal output energy of 200 mJ, a wavelength of 1064 nm, a pulse width of 8 ns, and a constant operating frequency of 1 Hz. The laser’s high-energy pulsed laser is reflected three times by a reflector and then directed vertically into a 100 mm focal length focusing lens. The high-density laser energy is focused onto the sample’s surface through the focusing lens to ablate the sample and generate plasma. The plasma spectral data are collected by a fiber optic instrument and transmitted via fiber optics to the spectrometers (AvaSpec-ULS2048-2-USB2, AvaSpec-ULS4096CL-EVO, Avantes, Beijing, China) for processing. The spectral data from different channels are collected by the two spectrometers. The AvaSpec-ULS2048-2-USB2 is utilized to obtain spectral data in the channel range of 198~425 nm, with an integration time of 1.05 ms and an average resolution of 0.07 nm. On the other hand, the AvaSpec-ULS4096CL-EVO is utilized to obtain spectral data in the channel range of 425~938 nm, with the same integration time of 1.05 ms and an average resolution of 0.14 nm. The target is mounted on a stage with 3D displacement ability. For each excitation of the laser pulse, the stage is moved to ensure a fresh oil layer for the next laser pulse emission. The acquired spectral data are displayed and saved on a computer, with each spectrum containing 8190 data points.

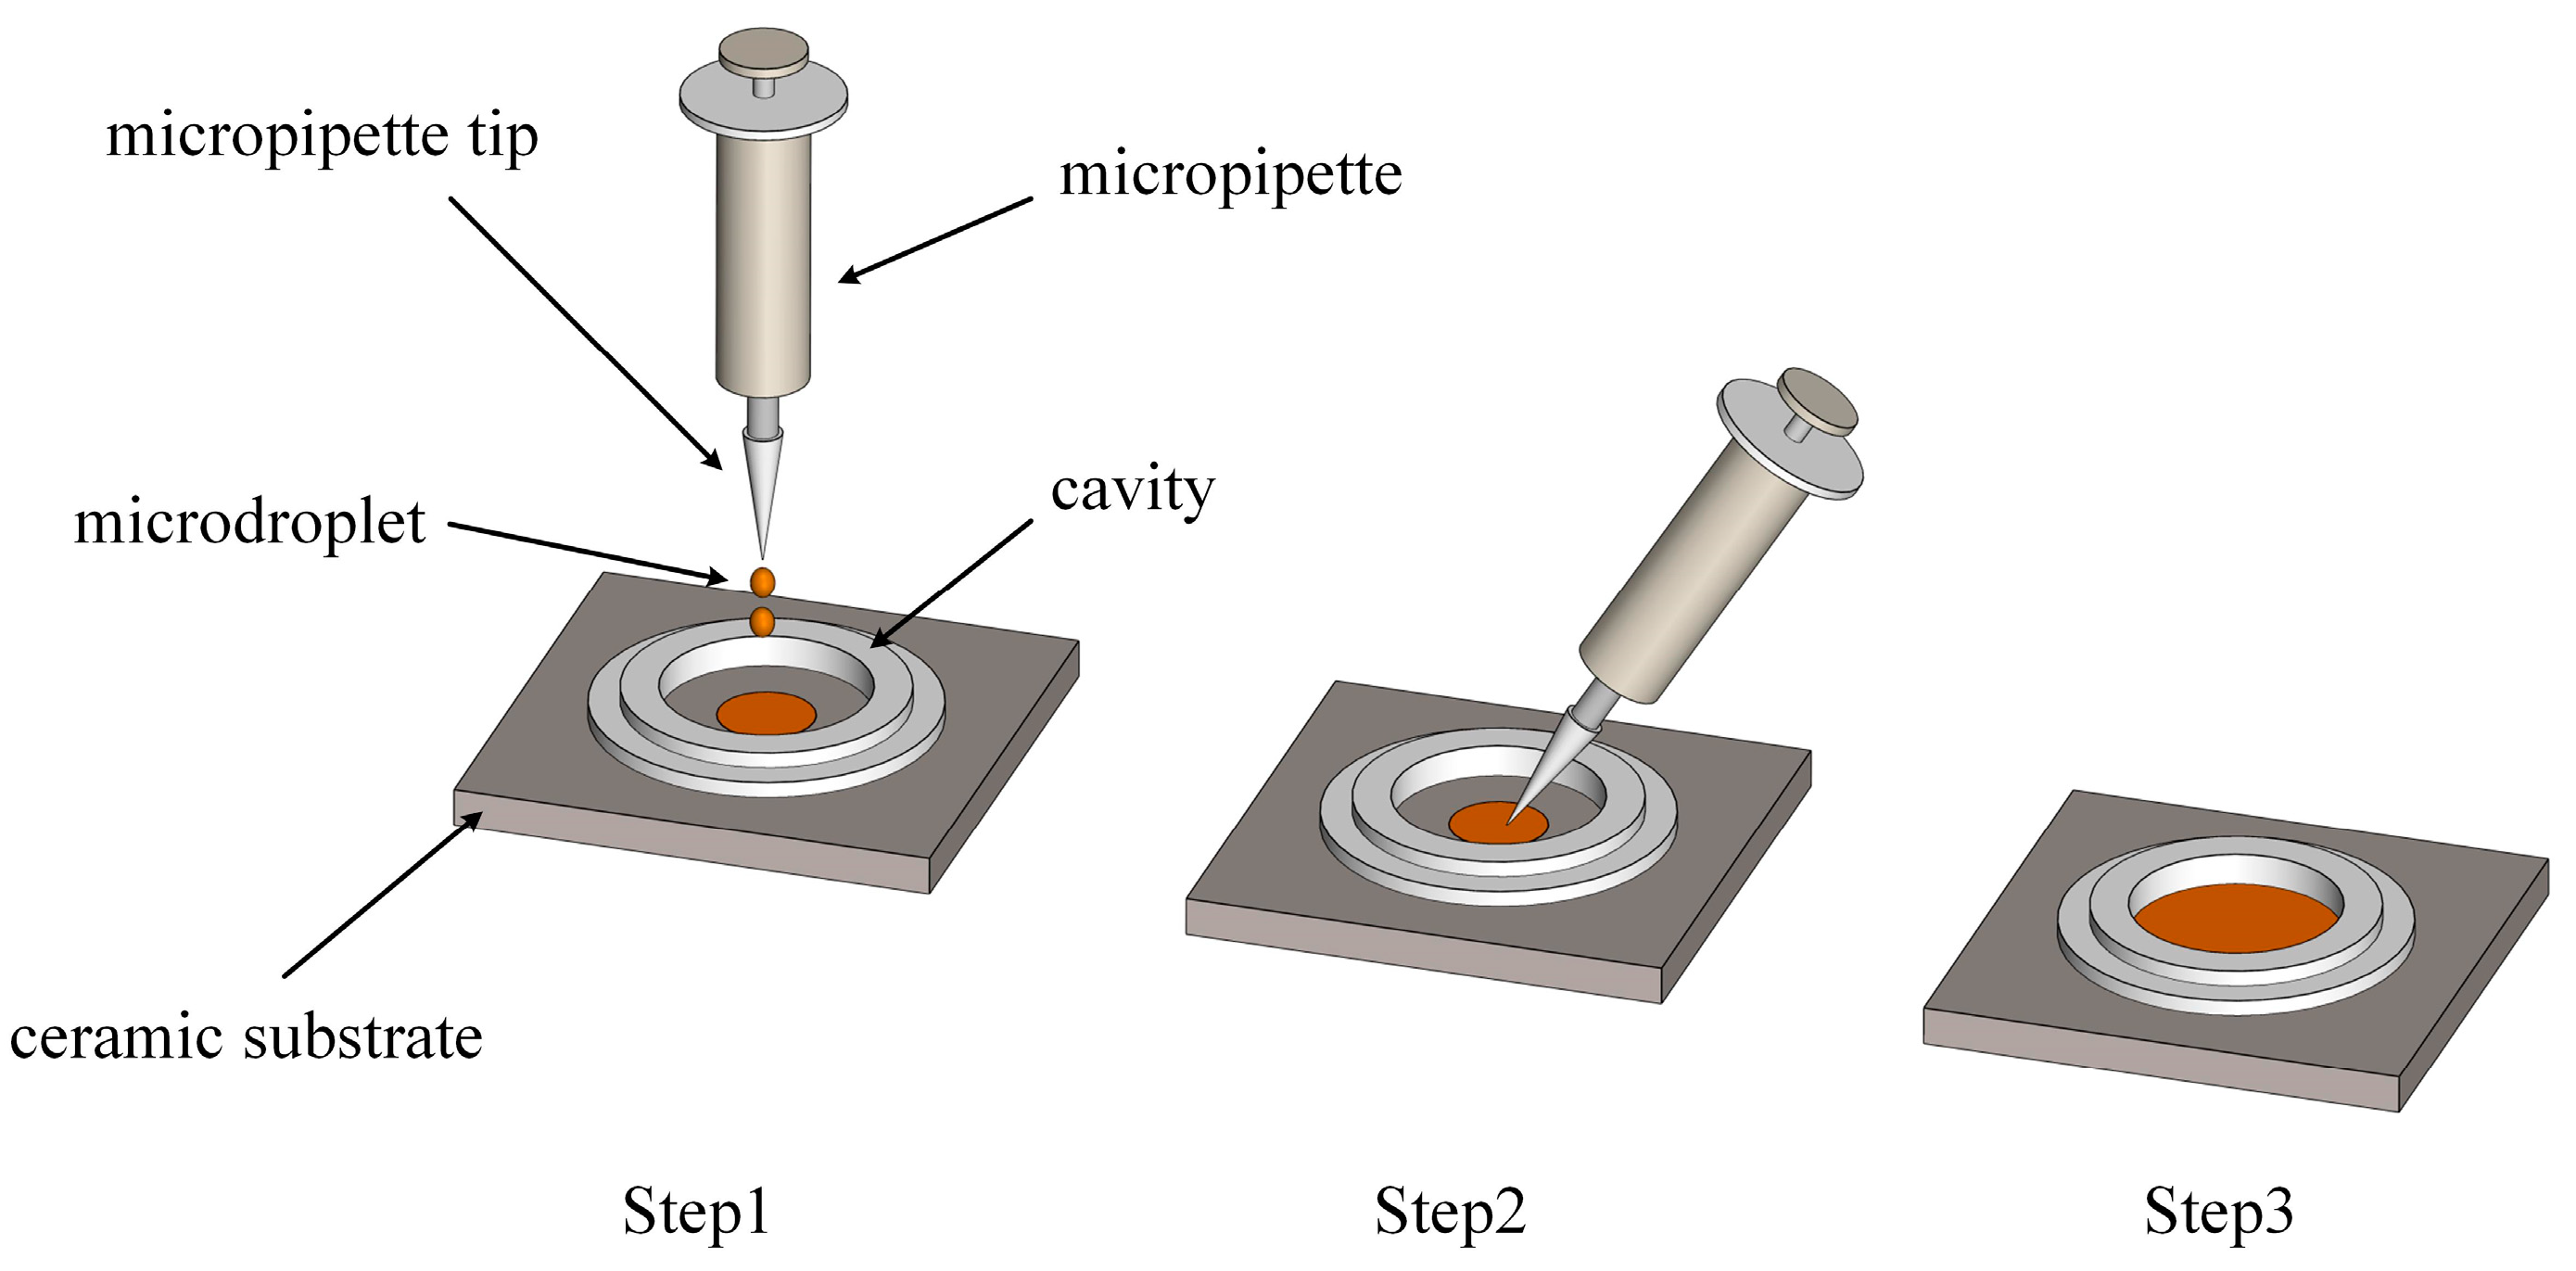
2.2. Sample Preparation

The refined soybean oil used in the experiment was purchased from a supermarket in Nanjing, China, and the emulsifiable fenthion containing 50% active ingredient was obtained from Shanghai, China. If the fenthion is overused, there is a possibility that fenthion may be present in soybean oil. In order to simulate the experimental conditions where the soybean oils are contaminated with fenthion, soybean oil samples were artificially contaminated. First, 1 g of the original soybean oil was weighed with an electronic balance (accuracy 0.001 g) into a 10 mL beaker. Then, a specific amount of fenthion emulsion was added and thoroughly stirred to dissolve it equitably. Finally, 18 soybean oil samples with varying fenthion contents were prepared for subsequent experiments. The training set consisted of 12 samples, while the test set consisted of the remaining six samples. Table 1 shows the fenthion content of each sample.
As the substrate material for the experiment, a smooth alumina ceramic sheet was prepared, and an annular domain-limiting cavity with an inner diameter of 50 mm and a height of 4 mm was printed out using a 3D printer before being adhered to the surface of the ceramic sheet. Using a micropipette, a certain amount of soybean oil sample was sucked, and dispersed drops were deposited in the ring-shaped domain-limiting cavity on the ceramic sheet’s surface. The experimental pretreatment procedure is shown in Figure 2. The micropipette tip was used to guide the oil drops back and forth so that they were evenly dispersed in the domain-limiting cavity to create a stable oil film. The ceramic sheet coated with an oil film was allowed to stand for some time so that the oil film would become more evenly distributed. In the experiment, each spectrum was the acquisition of a single laser pulse. To minimize the error and improve the reproducibility of the experiment, each valid spectrum was the average of 20 spectra, and 20 valid spectra were collected for each sample.

2.3. Methods and Theories

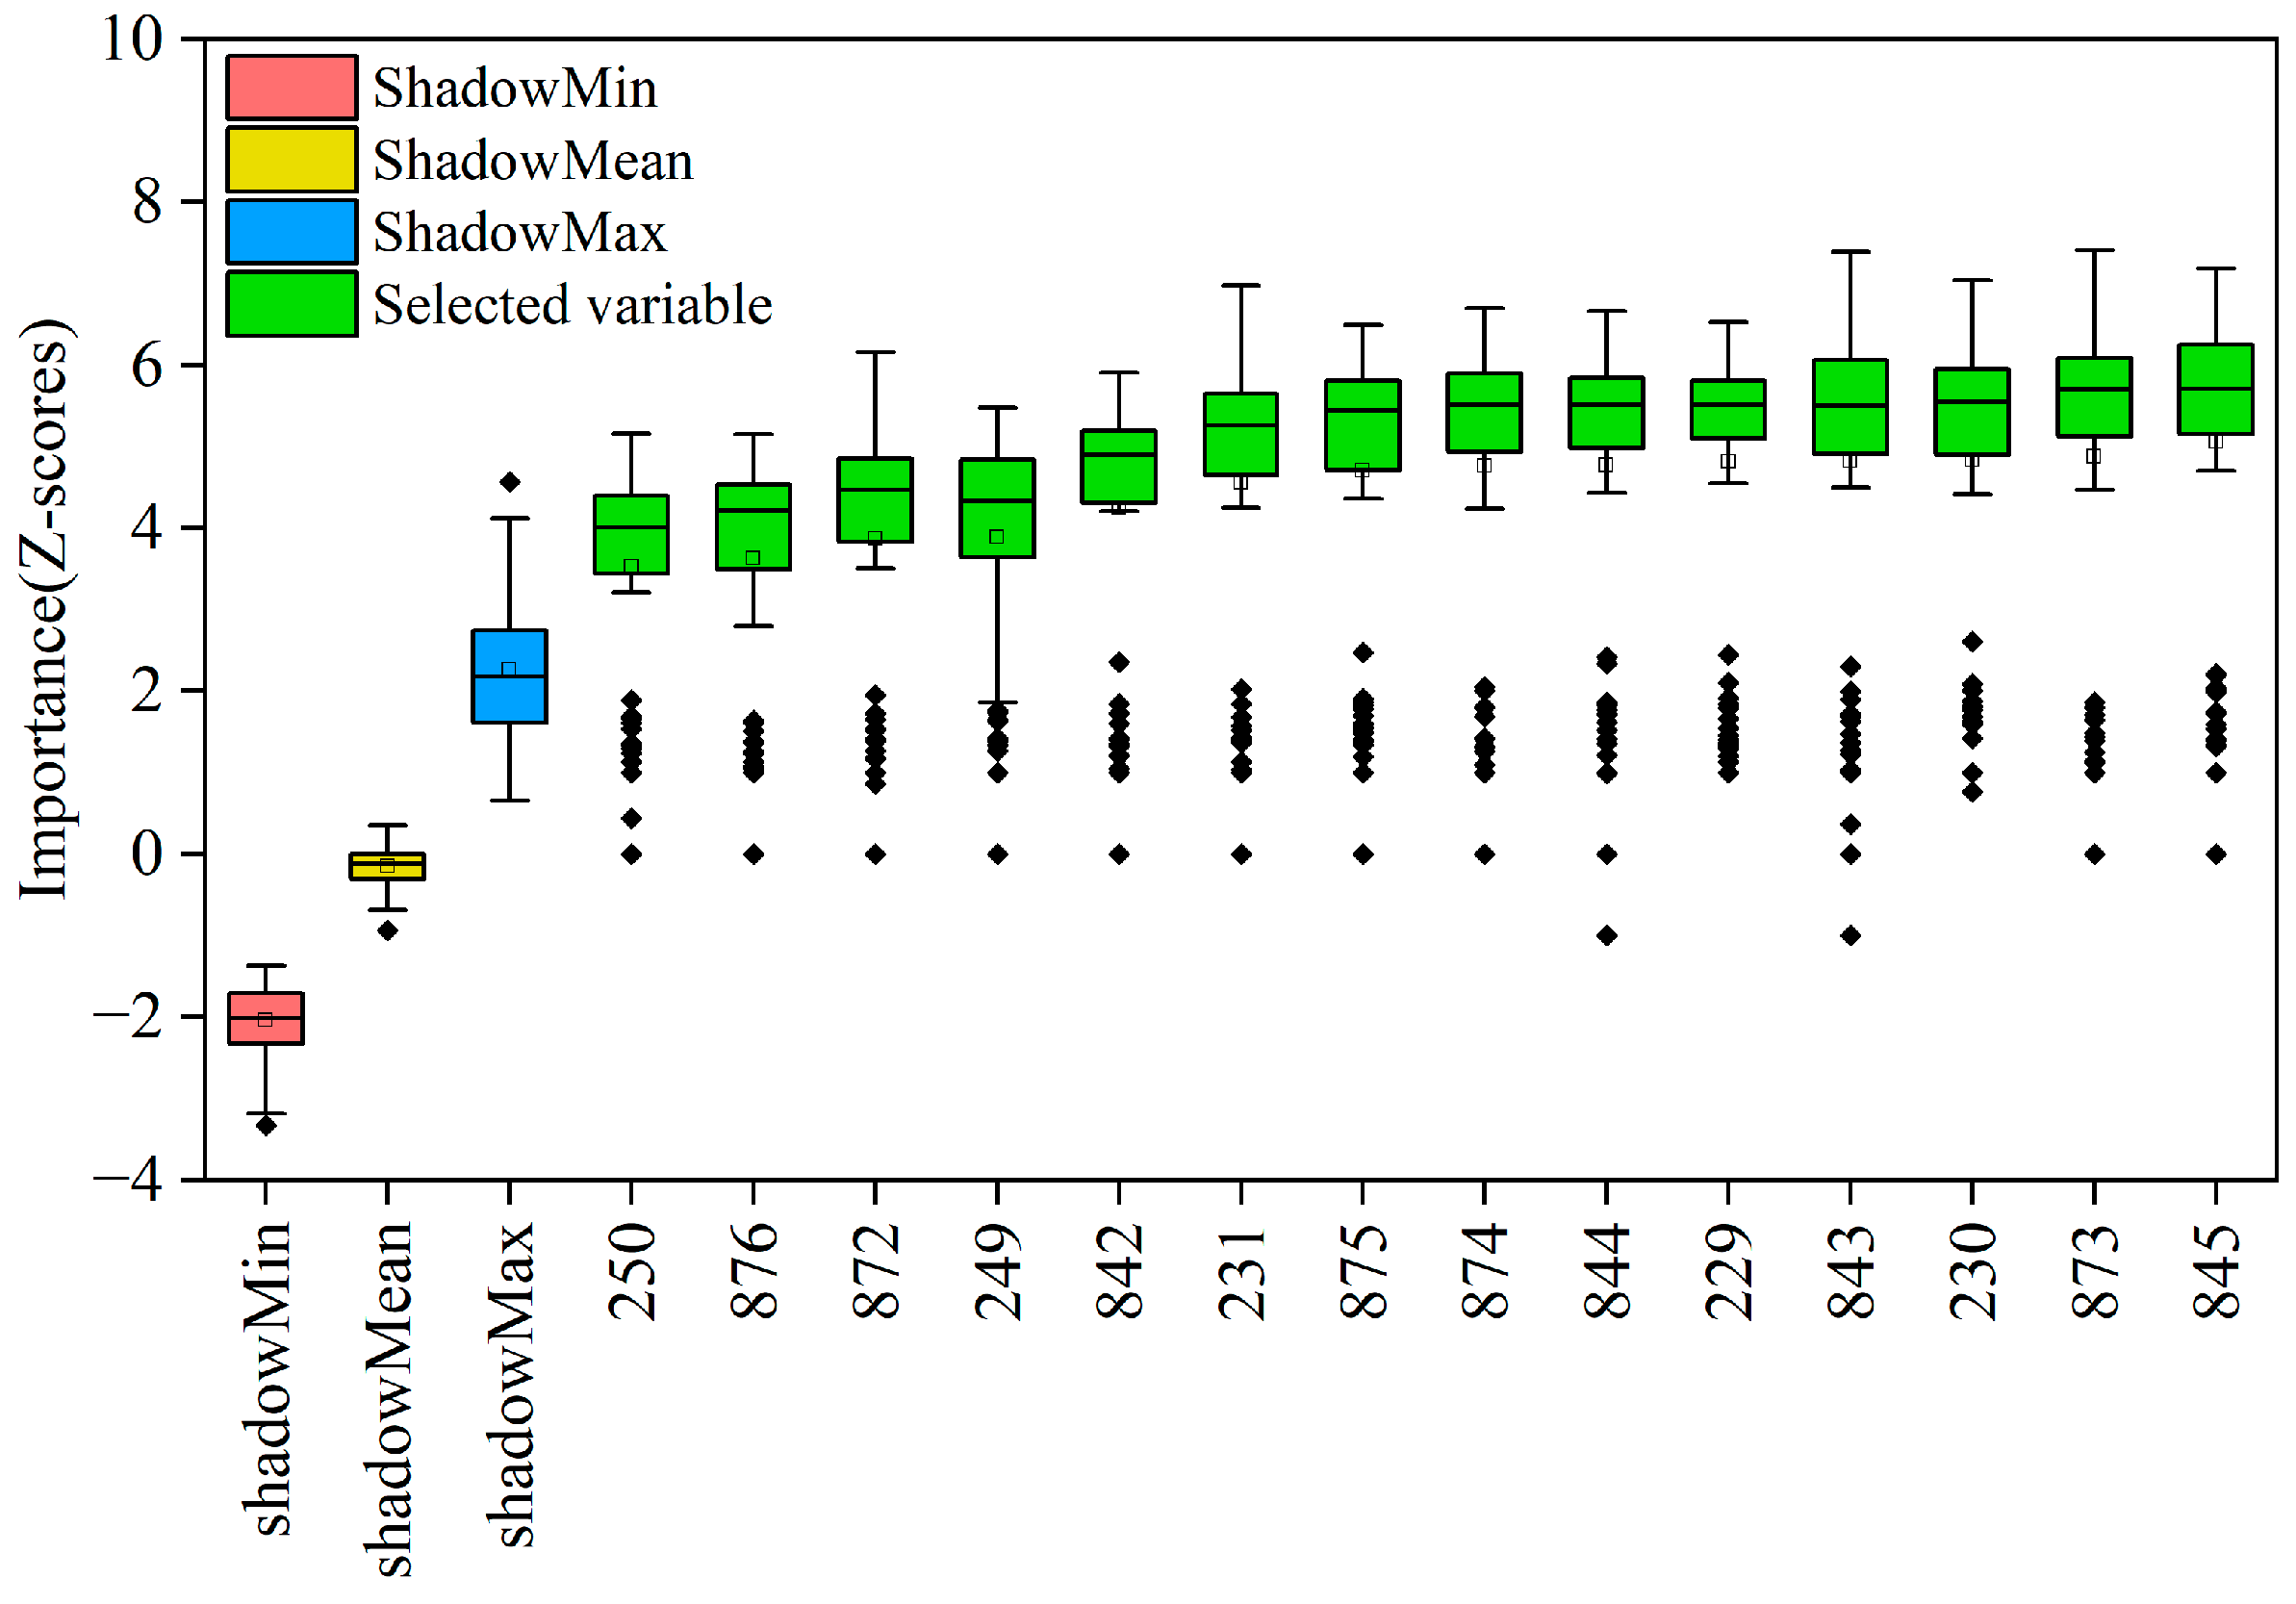
2.3.1. Boruta Algorithm

The Boruta algorithm is a wrapper based on the random forest classification algorithm, which employs the z-scores to determine the importance of feature variables. It iteratively removes feature variables that are determined to be less relevant than random probes by statistical tests [27,28]. The algorithm creates an information system by generating random properties. For each original feature variable, it also generates corresponding disordered shadow feature variables. After combining the original feature variables with the shadow feature variables, a set of new feature variables is generated. The z-scores of both the original feature variables and shadow feature variables are then calculated using the random forest method. The original feature variables with z-scores higher than the maximum value of the z-scores of the shadow feature variables are identified as important and are retained, while the original feature variables with z-scores lower than the maximum value of the z-scores of the shadow feature variables are identified as unimportant and are permanently removed. Afterward, the shadow feature variables are deleted, and the preceding steps are repeated. The Boruta algorithm considers the correlation information between features and avoids the random fluctuation problem caused by the random forest.
The z-score calculation process used in this paper is as follows:
Calculate the feature importance scores I for the random forest.
I = 1 m t r e e × i = 1 m t r e e ( e r r O O B 2 e r r O O B 1 )
where mtree represents the maximum number of decision trees in the random forest algorithm, the out-of-bag sample error for the initial case of mtree decision trees is errOOB1, the out-of-bag sample error of mtree decision trees after adding random noise interference to the same feature for all out-of-bag samples is errOOB2.
z - score = I s t d ( e r r O O B 2 e r r O O B 1 )
where std(errOOB2errOOB1) is the standard deviation of the out-of-bag sample error for different decision trees.

2.3.2. Extreme Learning Machine

Extreme learning machine (ELM) extends the single-hidden-layer feedforward neural networks (SLFN) learning algorithm [29,30]. Input layer (input metrological variables), hidden layer (neurons), and output layer are the basic segments of ELM. The essence is to randomly generate the connection weights of the input and hidden layers as well as the thresholds of the neurons in the hidden layer, and the learning process does not require iterative tuning.
In particular, the ELM is computed as follows:
Randomly set ωi and bj. ωi is the connection weight of the input and hidden layer, and bj is the threshold of the neuron in the hidden layer, with i = 1, …, N and j = 1, …, N ~ .
Calculate the weight matrix β of the hidden and output layer.
H β = T
where T is the sample output matrix, and H is the hidden layer output matrix, which can be expressed as:
T = [ t 1 T t N T ] N × m
H = [ g ( ω 1 x 1 + b 1 ) g ( ω N ~ x 1 + b N ~ ) g ( ω 1 x N + b 1 ) g ( ω N ~ x N + b N ~ ) ] N × N ~
where g(x) is the activation function, and N, N ~ , and m are the number of neurons present in the input layer.
β = H + T
where H+ is the Moore–Penrose generalized inverse of H.

2.3.3. Genetic Algorithm

Genetic algorithm (GA) is a class of self-organizing and adaptive artificial intelligence techniques that simulates the process and mechanism of biological evolution in nature to solve extreme value problems. Its fundamental concept is a process search algorithm for optimal solutions that imitates the genetic mechanism of nature and the theory of biological evolution [31,32]. The algorithm can manage multiple variables simultaneously, providing a global solution for problems with multiple local extrema. The ELM is optimized using GA to resolve the issue that the random selection of initial weights and thresholds may result in poor model stability.
The following are the specific steps for GA optimization of ELM:
(1)
Determining the number of neurons in the input, hidden, and output layers of ELM; setting the maximal evolutionary generation; randomly generating the input weights and hidden layer thresholds of ELM and binary encoding them to generate the initial population.
(2)
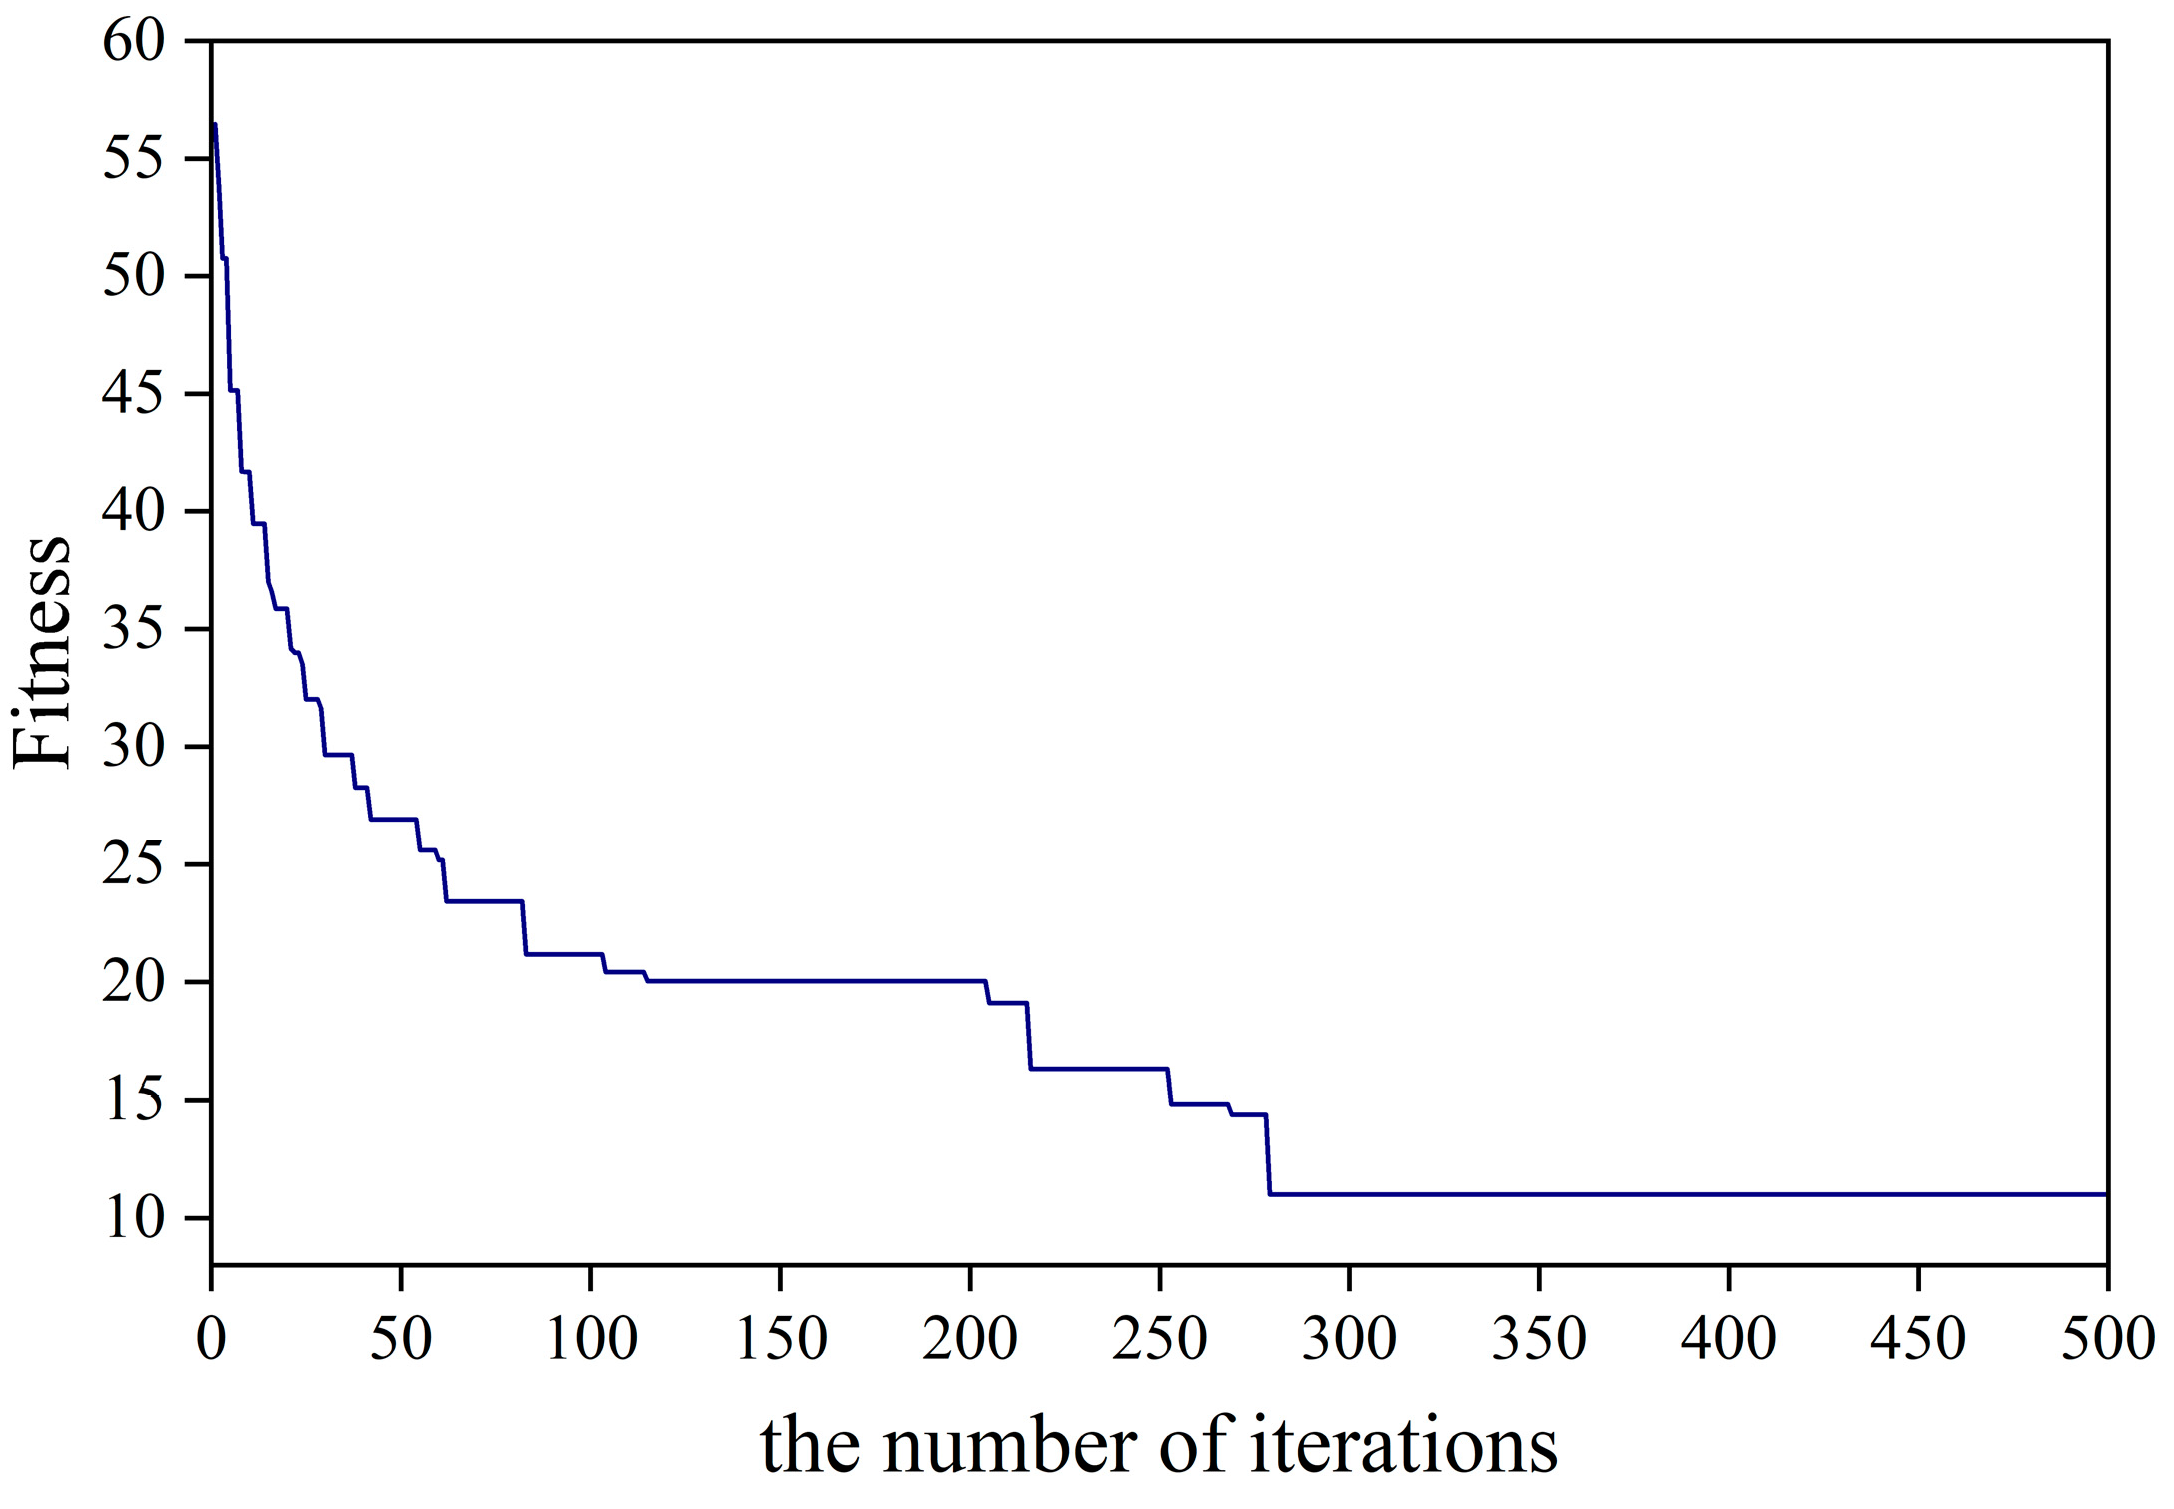
Calculating the fitness function. The fitness function (Fitness) is used to evaluate the degree of merit of the randomly generated initial population. Each individual in the population contains the ELM model’s initial weights and implied layer threshold. The fitness value of each individual within the population is calculated individually. The smaller the fitness value, the better the individual.
(3)
Using selection, crossover, and variation, the superior individuals within a population are optimized, resulting in a new population. Then, verify whether the evolutionary condition is met; if not, return to recalculate; and if met, terminate the operation, select the optimal population individuals, determine them as the optimal initial weights and implied layer thresholds, and complete the optimization of the ELM model.

2.3.4. Model Evaluation Metrics

This paper used the correlation coefficient R2, the root mean square error (RMSE), and the mean absolute percentage error (MAPE) to evaluate the performance and accuracy of the model’s predictions. The specific procedures for calculating R2, RMSE, and MAPE are as follows:
R 2 = 1 i = 1 n ( y i y i ) 2 i = 1 n ( y i y _ ) 2
R M S E = 1 n i = 1 n ( y i y i ) 2
M A P E = 1 n i = 1 n | y i y i y i | × 100 %
yi represents the actual value of the ith sample, y i ^ represents the predicted value of the ith sample, and y represents the mean of the actual values of the n samples.

3. Results and Discussion

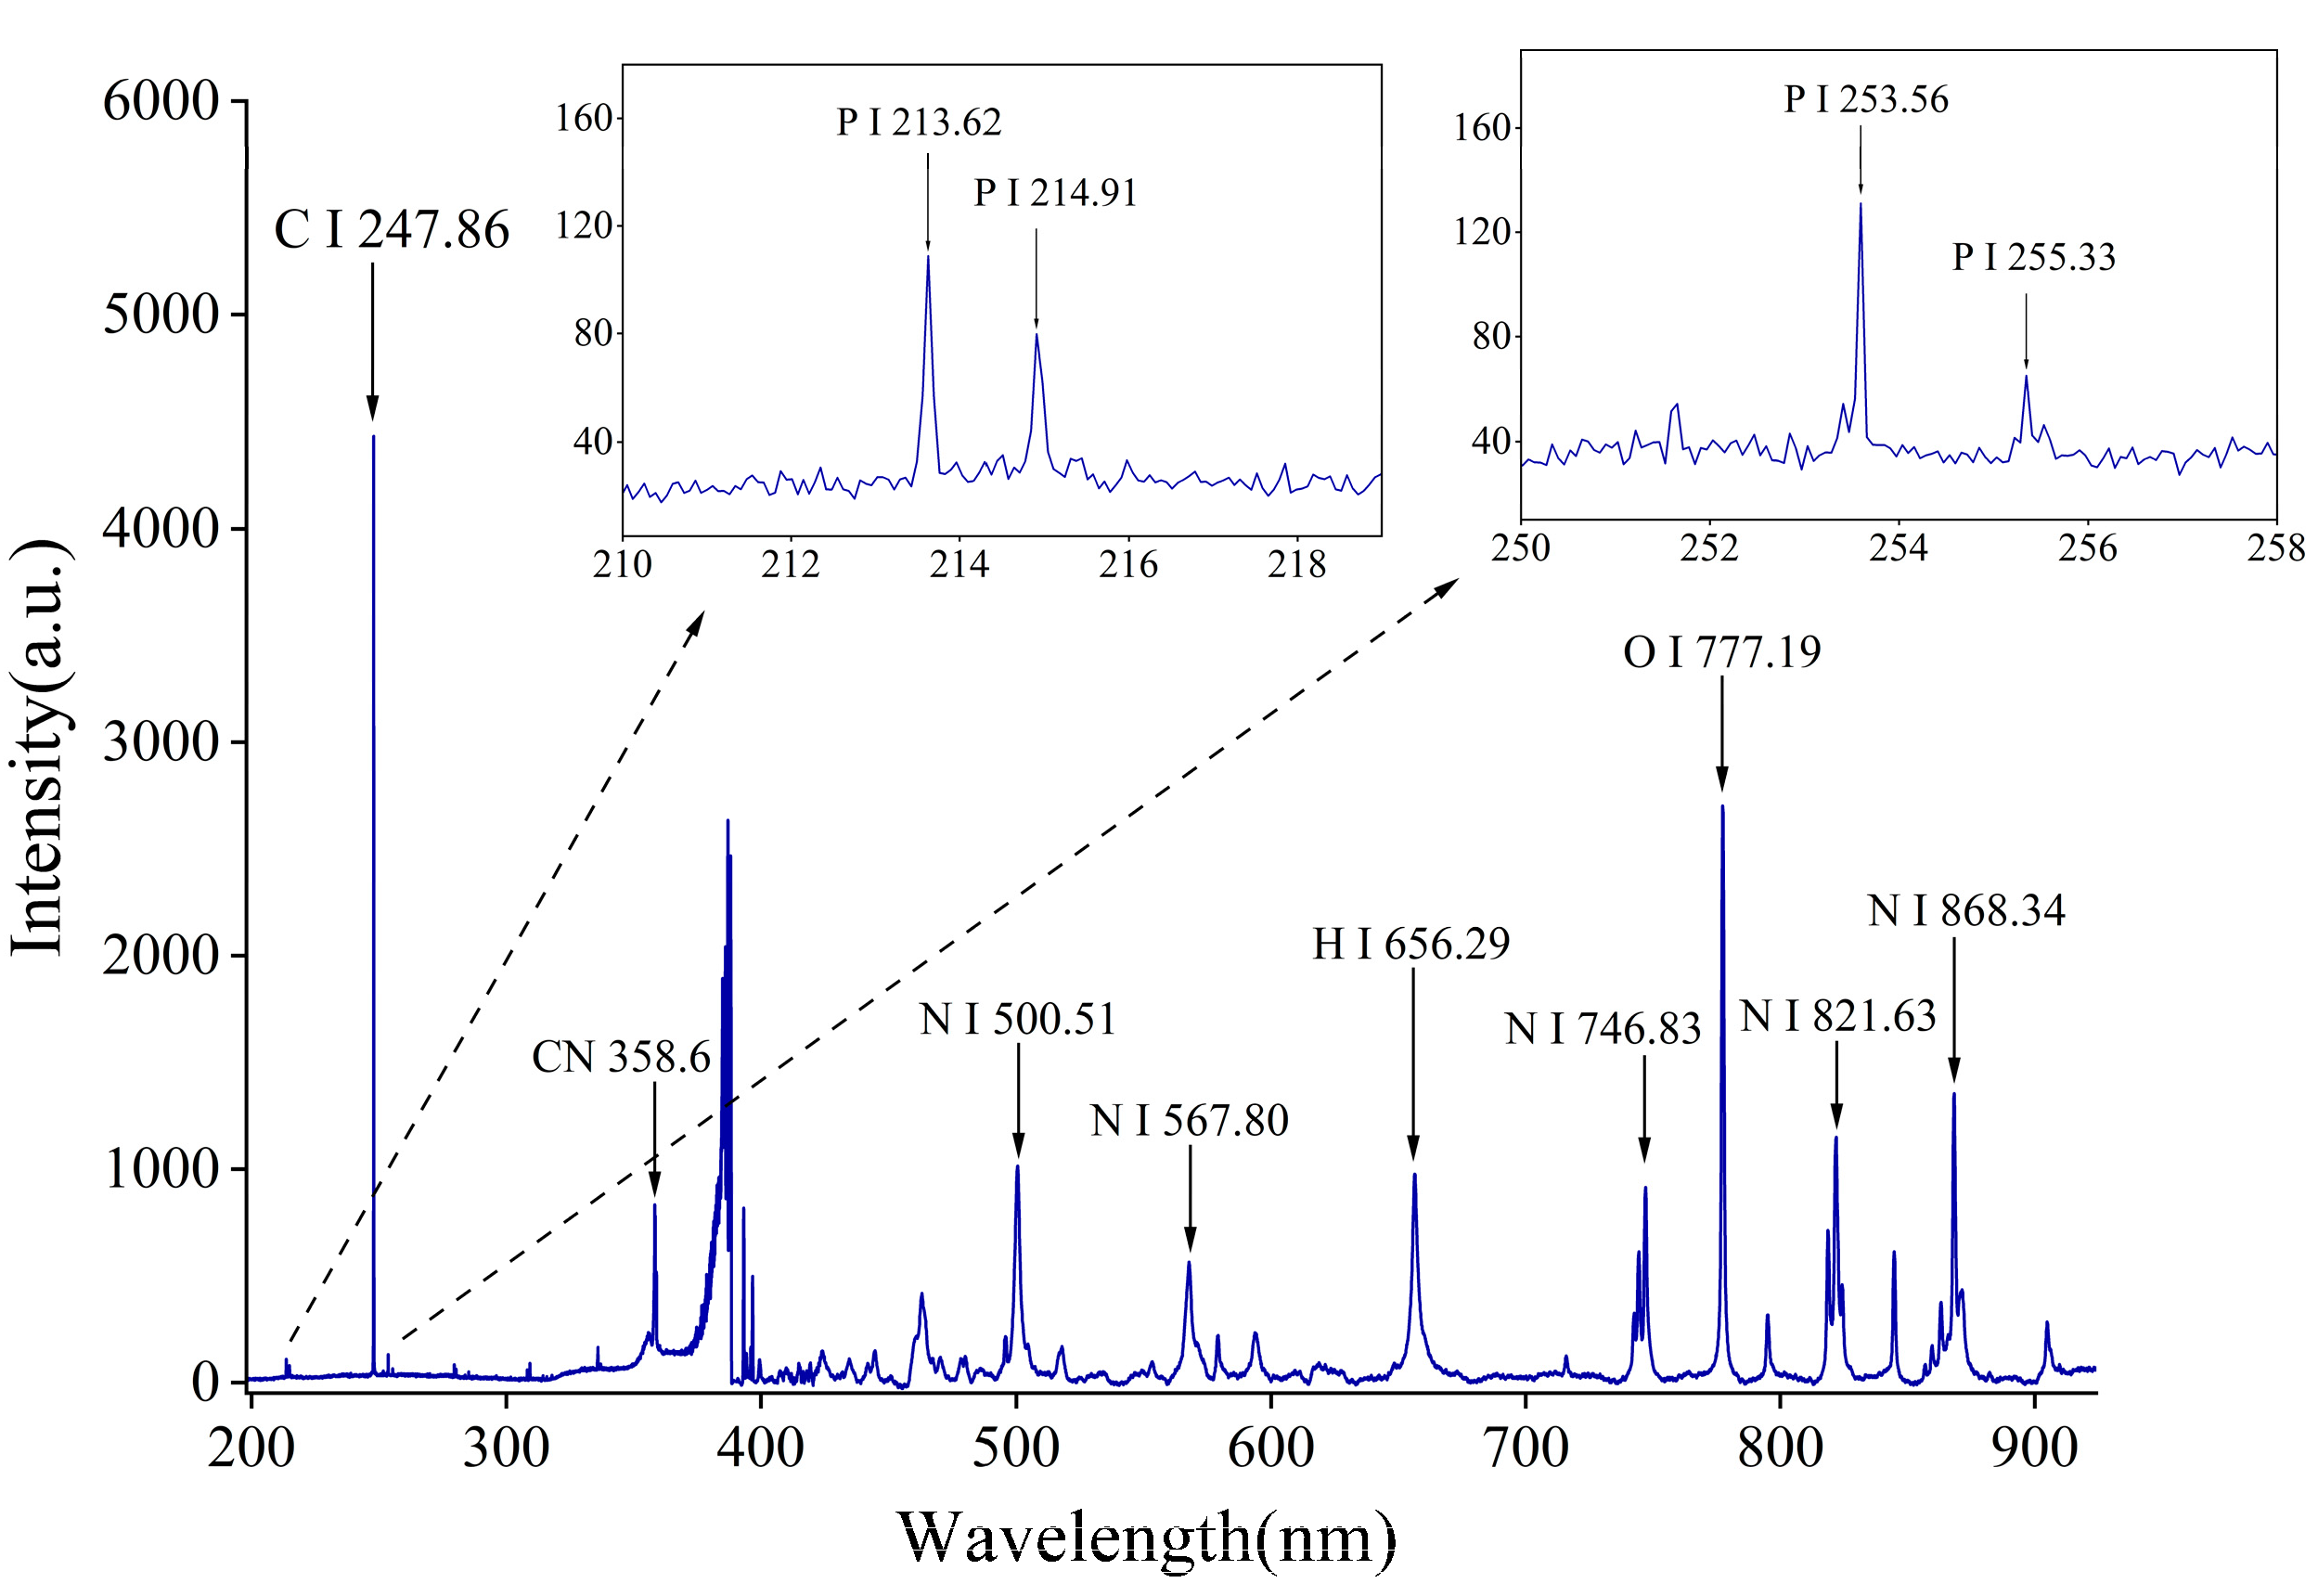
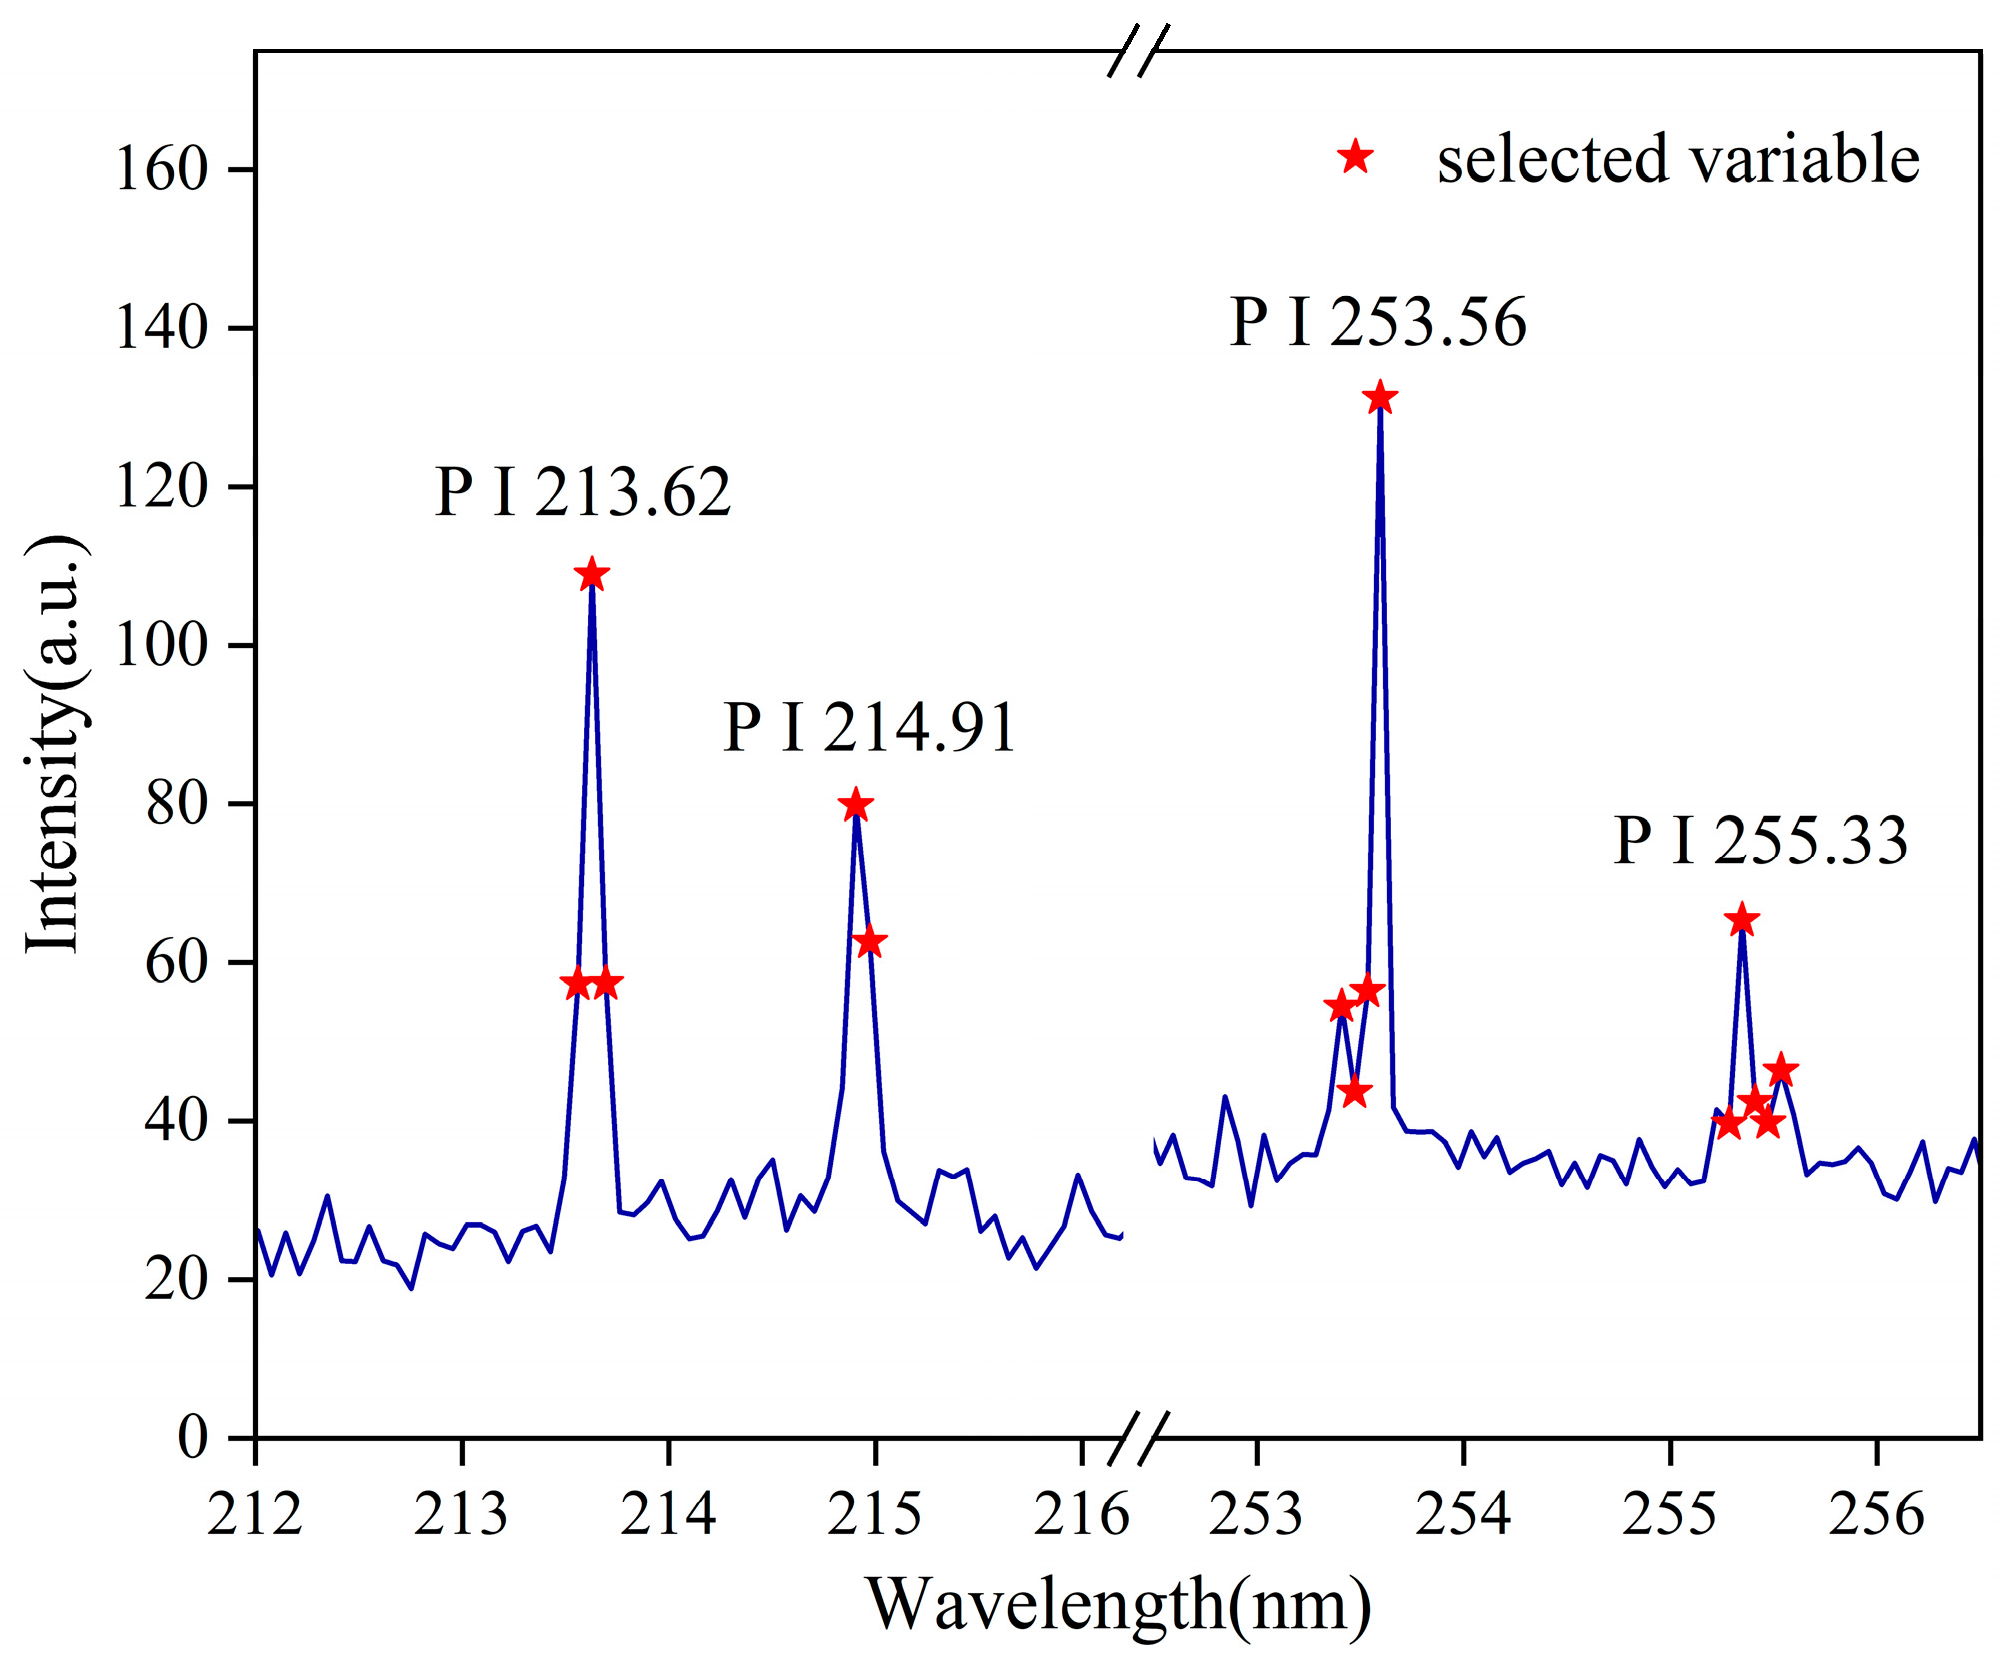
3.1. Analysis of Elemental Spectral Lines by LIBS

The feature wavelength points and their corresponding peaks in the collected LIBS spectral data have a direct connection to the elemental species and their content in the analyzed sample. Figure 3 shows the LIBS spectrum of soybean oil samples with a fenthion content of 629.8 µg/g in the full spectrum, as well as the details of the spectra in the band ranges 210~219 nm and 250~258 nm after amplification. The band ranges 210~219 nm and 250~258 nm exhibit distinct peaks, as shown in Figure 3. P I 213.62 nm, P I 214.91 nm, P I 253.56 nm, and P I 255.33 nm are the four feature spectral lines combined with the NIST atomic spectral database. Since fenthion contains P in its elemental composition, it is essential to analyze the spectral lines related to the P-element. Additionally, the ceramic substrate is devoid of any presence of the P-element, thus ensuring that it does not cause any disruption to the LIBS spectral signal of fenthion. Consequently, the feature spectra obtained by the assisted ablation LIBS method using a ceramic substrate can be utilized for the subsequent quantitative determination of fenthion in soybean oil samples.

3.2. Experimental Parameter Optimization

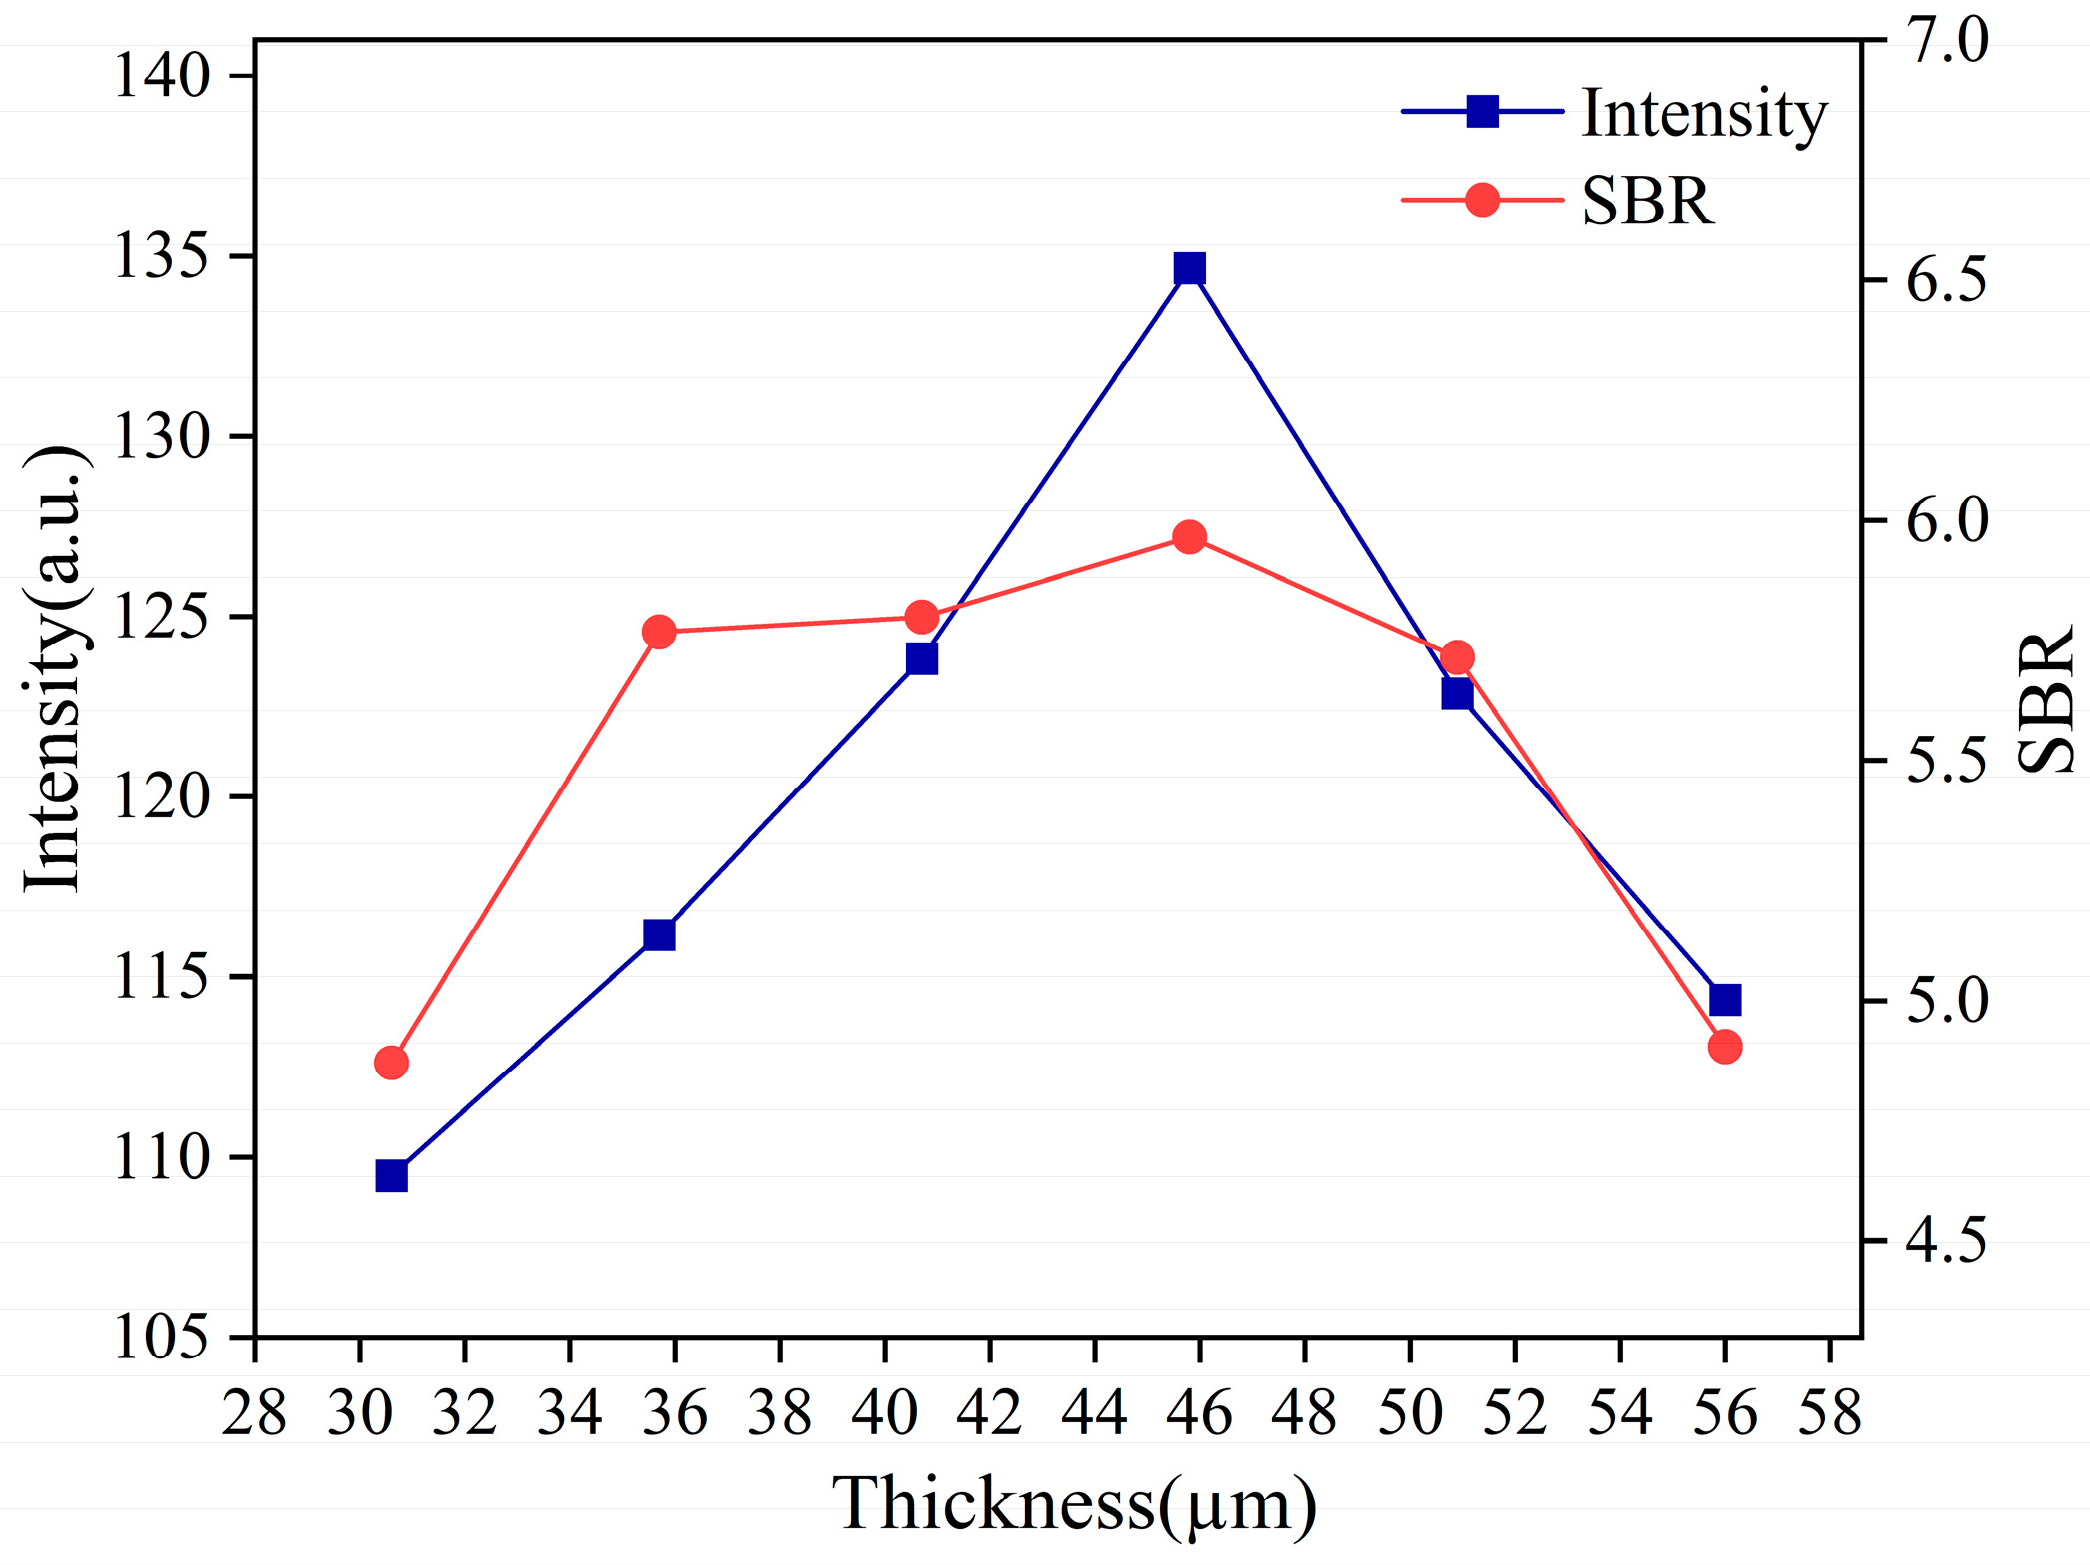
3.2.1. The Average Oil Film Thickness Optimization

The operating frequency of the laser was set to 1 Hz, the laser pulse energy was 170 mJ, and the delay time was 1 µs. In the experiment, the oil film prepared was cylindrical in shape. The micropipette was used to determine the volume of the oil film, and the diameter of the oil film was 50 mm, which was equal to the diameter of the domain-limiting cavity. Thus, the thickness of the oil film can be calculated. Figure 4 shows the variation in spectral intensity and the signal-to-background ratio (SBR) at P I 253.56 nm with oil film thickness. When the oil film thickness is less than 45.8 µm, the spectral intensity at P I 253.56 nm increases as the thickness increases, and the SBR increases accordingly. When the oil film thickness exceeds 45.8 µm, the intensity of the spectral line at P I 253.56 nm progressively decreases as the oil film thickness increases, and the SBR also decreases accordingly. The smaller sampling volume resulted in a lower average thickness of the oil film, which resulted in a less dense oil film surface. Because of the low ablation of the sample, the spectral signals collected were of low intensity. Relatively, when the sampling volume was too large, the average thickness of the oil film increased, and more laser energy was needed to penetrate the oil film, resulting in less energy to excite the substrate. Since the sample was not sufficiently ablated, the final spectral signals collected were also weaker. Furthermore, higher oil film thickness tended to cause oil droplet sputtering, which affected the subsequent experiments. Therefore, 45.8 µm was chosen as the optimal oil film thickness.

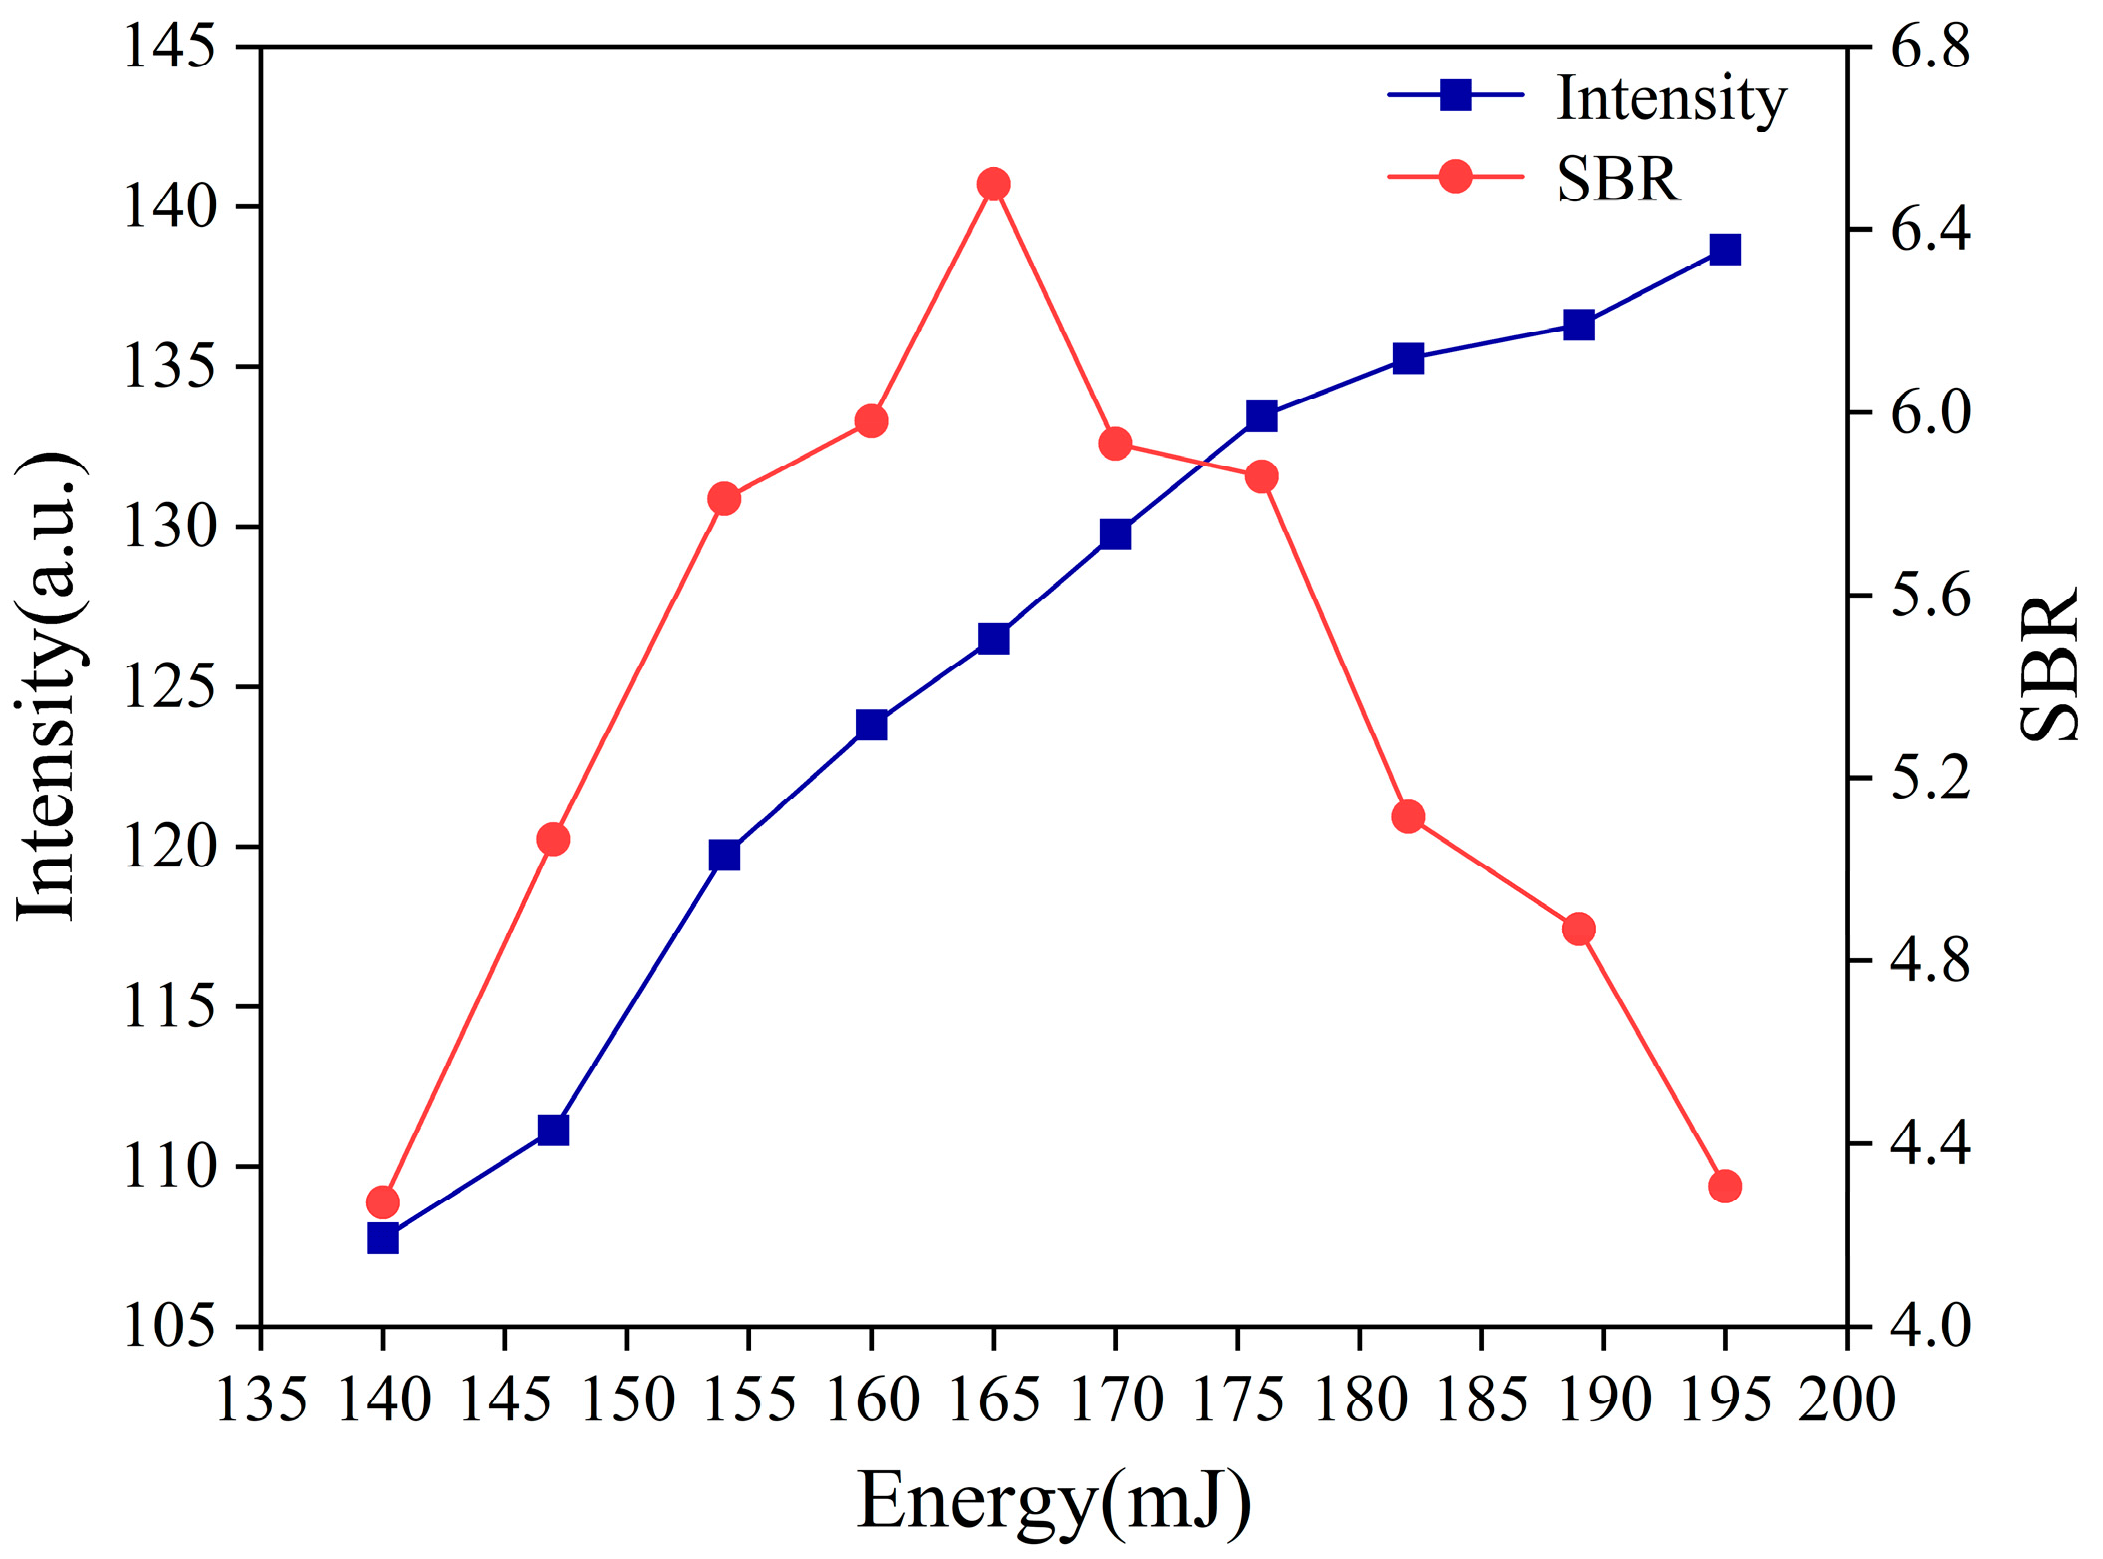
3.2.2. The Laser Energy Optimization

The operating frequency of the laser was fixed at 1 Hz, the delay time was 1 µs, and the average oil film thickness was 45.8 µm. Figure 5 shows the relationship between the spectral intensity at P I 253.56 nm and the SBR as a function of laser energy. As shown in the figure, the intensity of the spectral line at P I 253.56 nm increases progressively with increasing laser energy, while the SBR first increases and then decreases as laser energy increases. With the increase in laser energy, the plasma radiation signal showed an upward trend, at which time the collected spectral signal intensity and SBR were relatively high. However, the background signal enhancement effect became more pronounced, and the SBR decreased when the laser energy was excessively high. To achieve a spectral signal with high spectral intensity and SBR, the optimal laser energy of 175 mJ was selected.

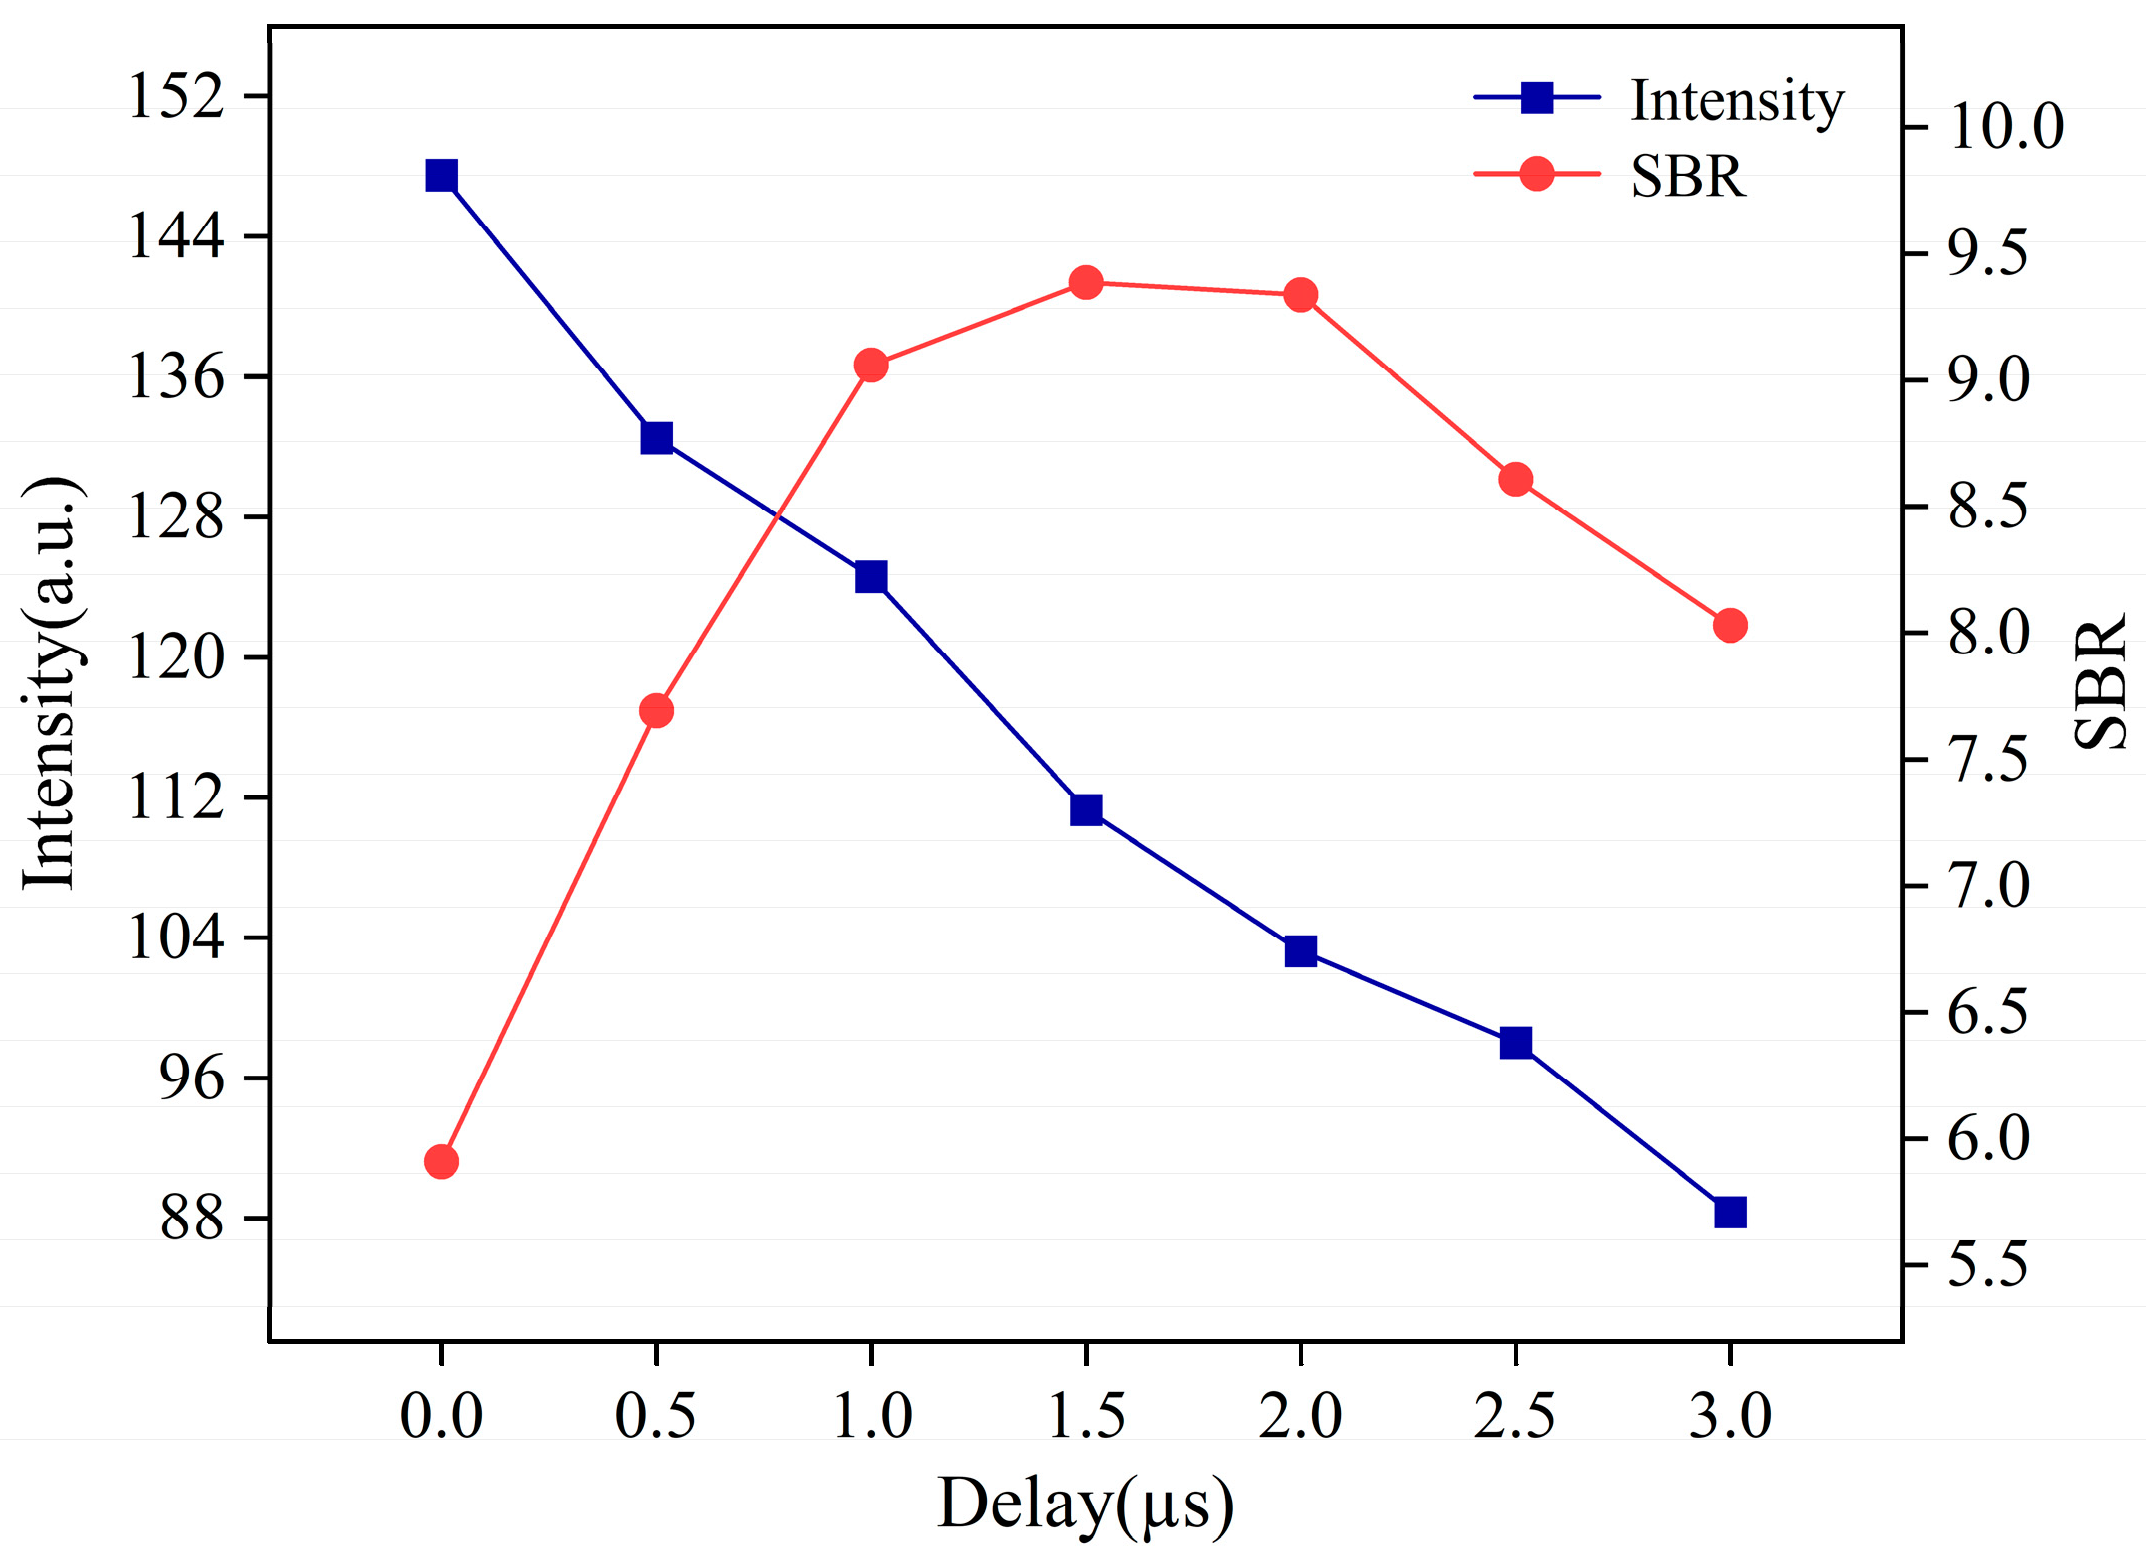
3.2.3. The Delay Time Optimization

The operating frequency of the laser was fixed at 1 Hz, the laser pulse energy was 175 mJ, and the average oil film thickness was 45.8 µm. Figure 6 shows the relationship between the spectral intensity at P I 253.56 nm and SBR with the delay time. As shown in the figure, the intensity of the spectral line at P I 253.56 nm decreases as the delay time increases, and the SBR first increases and then decreases gently as the delay time increases. The plasma bremsstrahlung and complex radiation were relatively severe when the delay time was 0 µs, and the spectral signal was mainly a continuous background signal with a lower SBR at this time. With the increase in delay time, the intensity of both the feature spectral line and the background signal decreased. Still, the background signal decayed more quickly than the feature spectral signal, significantly improving SBR. Due to the progressive decay of the plasma number and the gradual weakening of the feature spectral radiation, the SBR decreased when the delay time was excessively long. Considering the spectral intensity and SBR, the optimal delay time was determined to be 1 µs.

3.3. Quantitative Analysis

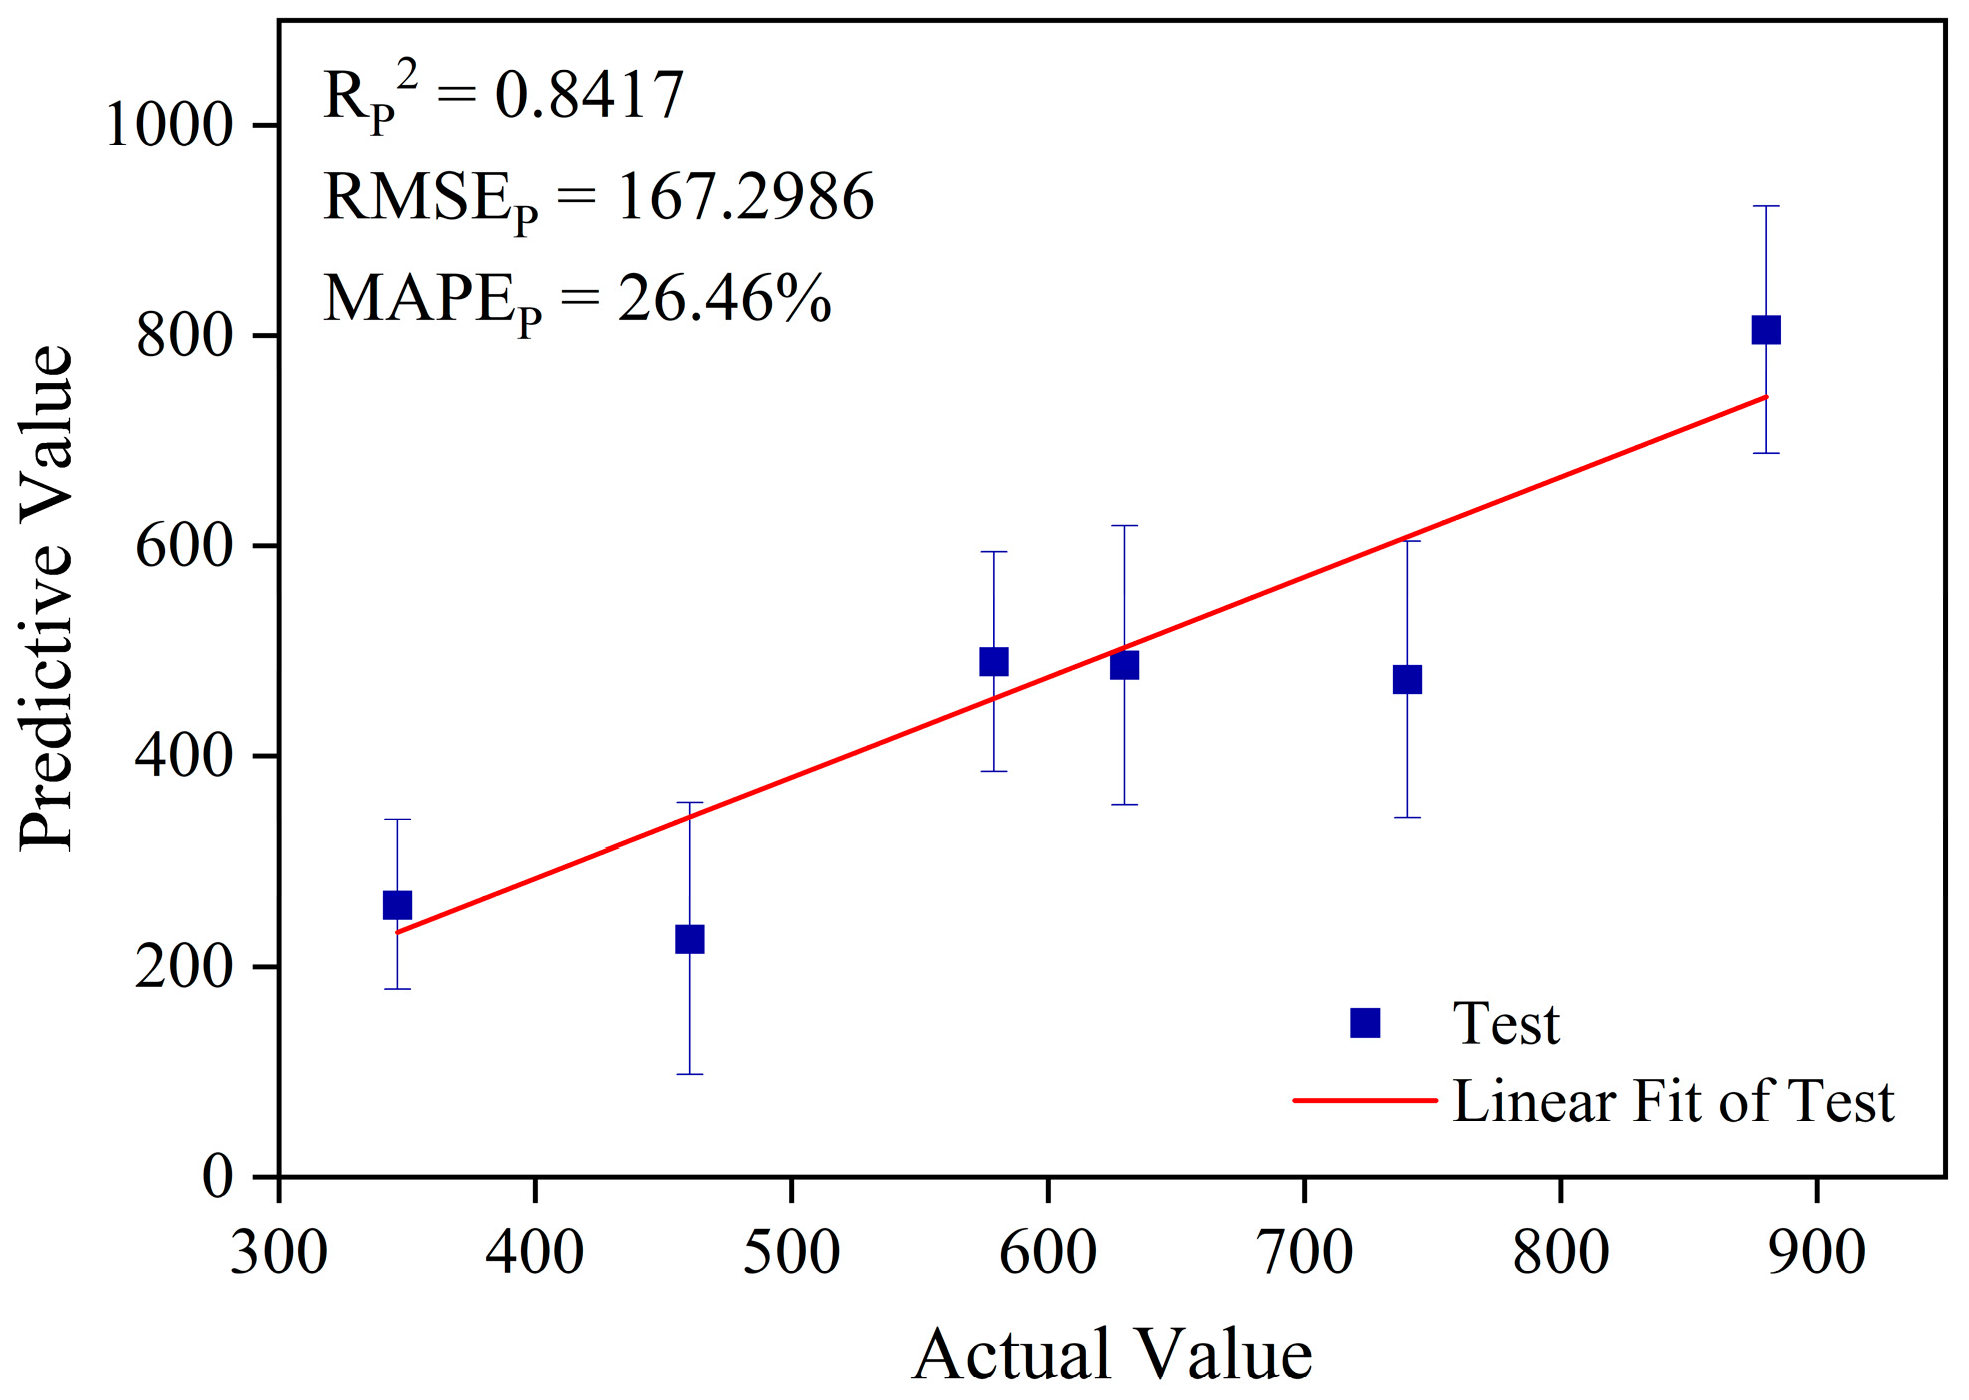
3.3.1. Analysis of Prediction Results Based on the Full-Spectrum ELM Model

The full spectral data were used as input for ELM, and a full-spectrum ELM quantitative model for fenthion contents in soybean oil samples was developed. Figure 7 shows the predicted results for the test set. As shown in the figure, the RP2 is 0.8417, the RMSEP is 167.2986, and the MAPEP is 26.46%. There were large relative errors in the predicted content and a poor correlation between the actual and predicted values in the test set. This is because the original spectral data contain a large quantity of redundant information and background noise, which can interfere with the prediction performance and stability of the model. To improve prediction performance and increase the generalization ability of the model, variable selection must be performed on 8190 feature points in the full spectrum to eliminate invalid information variables.

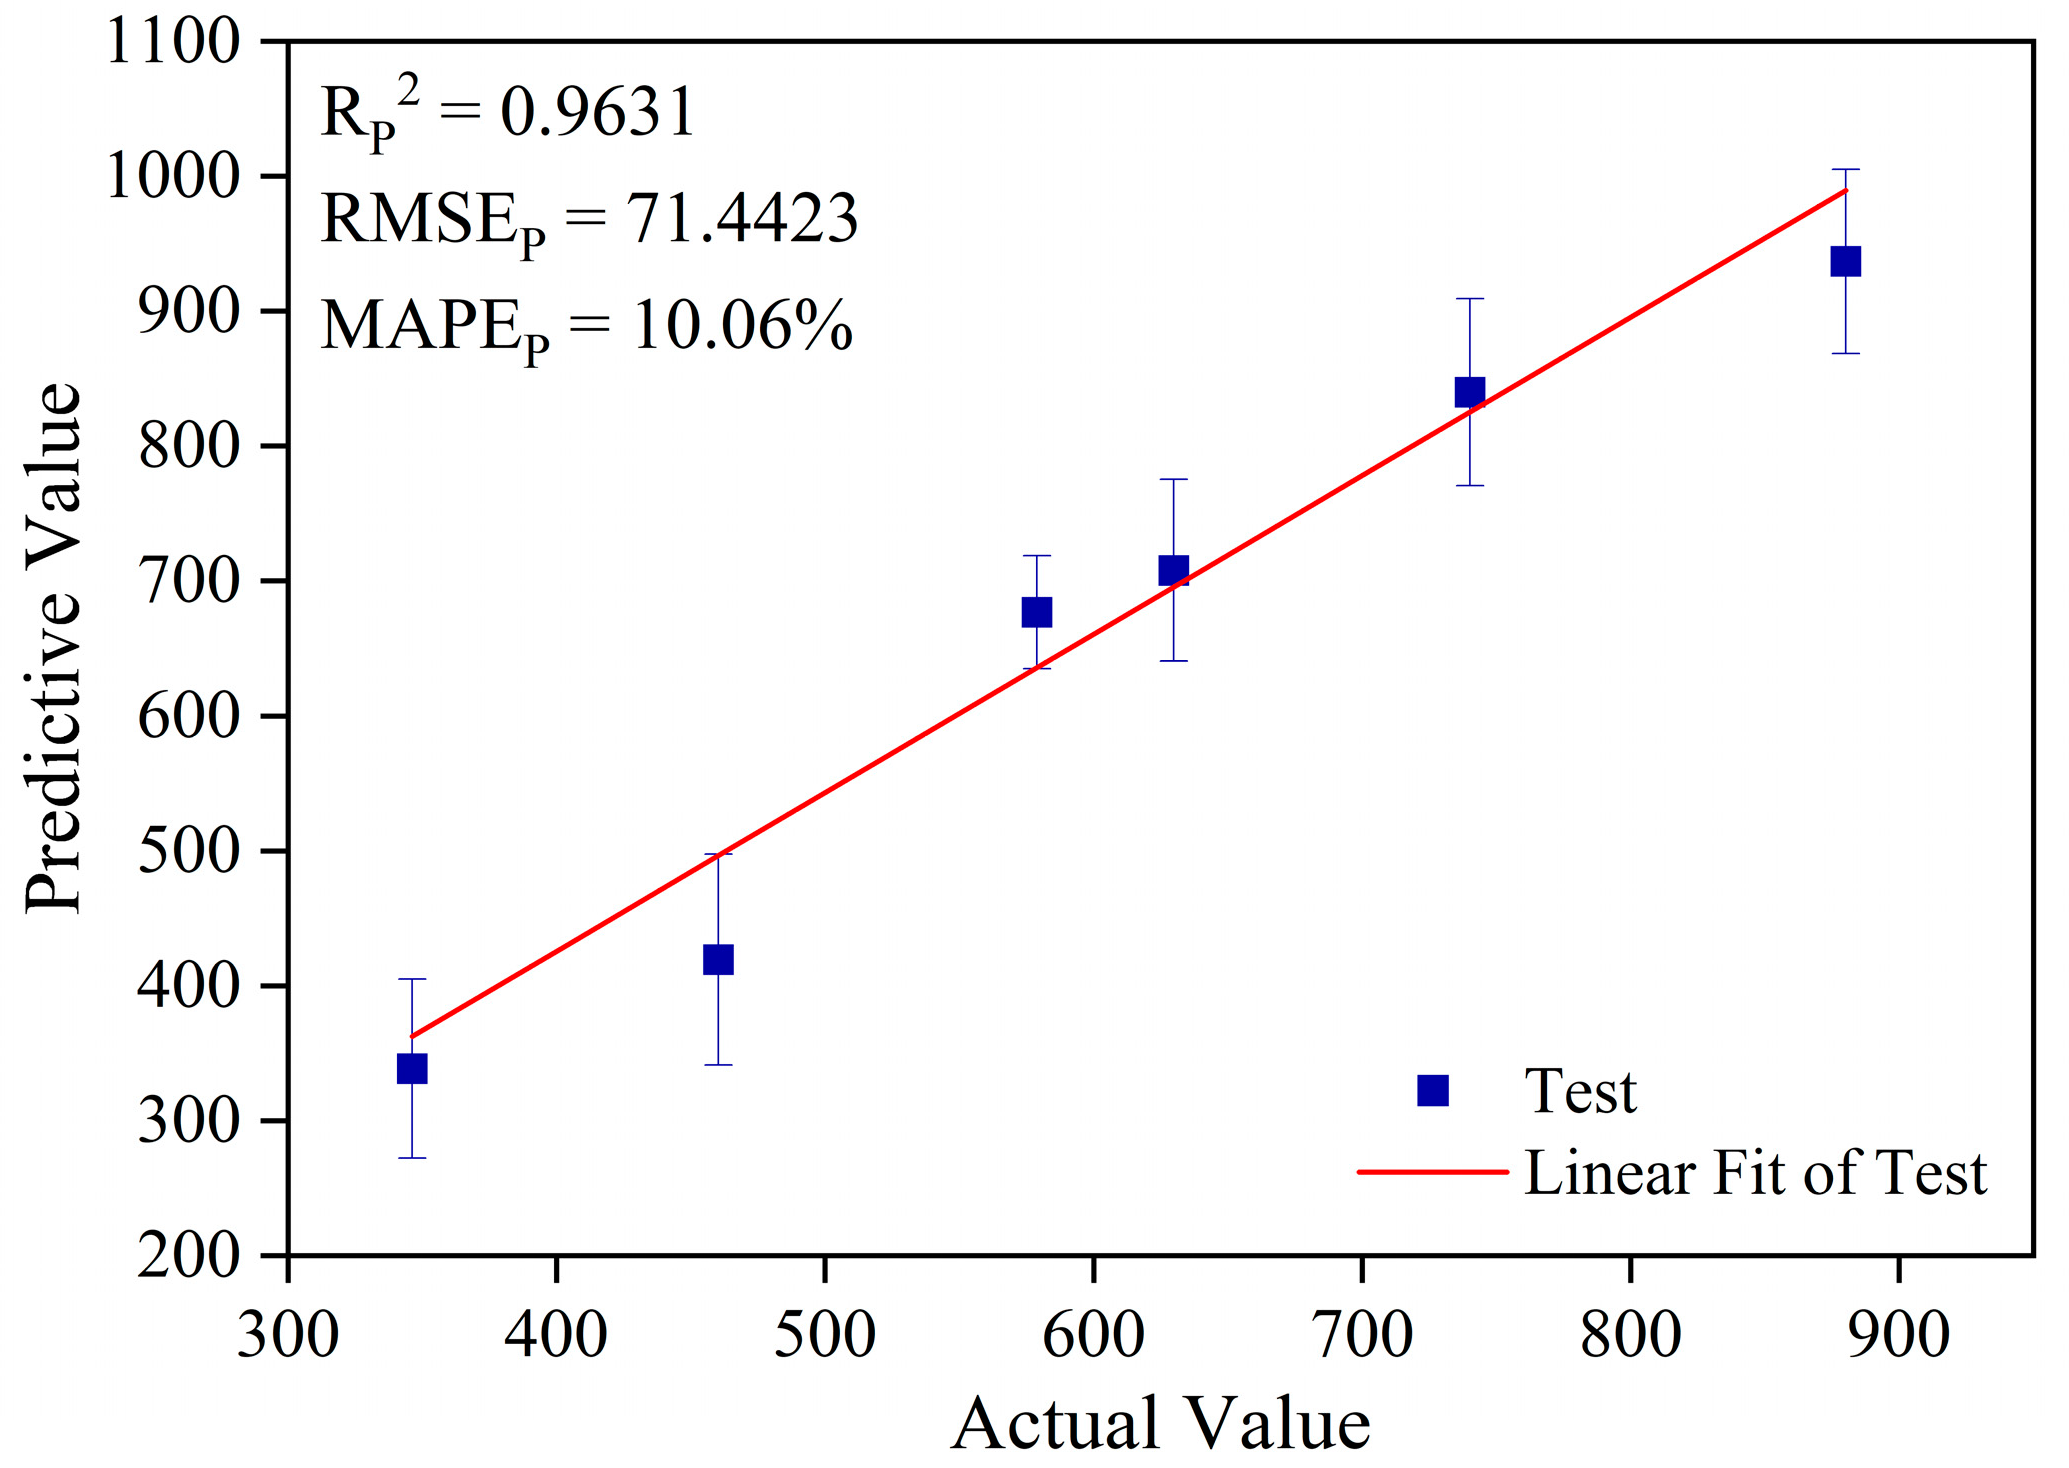
3.3.2. Analysis of Prediction Results Based on the Boruta-ELM Model

In this paper, the Boruta algorithm was utilized for the feature selection of full-spectrum data, and the results are shown in Figure 8. According to the Boruta feature selection method, z-scores are utilized as an assessment indicator for feature importance. Subsequently, the original 8190 feature variables were randomly shuffled to create corresponding shadow feature variables. Meanwhile, the z-scores for both the original feature variables and their corresponding shadow feature variables were calculated. In each iteration, the original feature variables with z-scores higher than the maximum z-scores of the shadow feature variables are identified as important and selected. As shown in the figure, the distributions of the maximum, minimum, and mean z-scores for the shadow feature variables in 100 iterations are represented in blue, yellow, and red box plots, respectively. The green box plots show the z-score distributions for selected feature variables in 100 iterations. The 8190 feature points were arranged in ascending order from 1 to 8190. Among these, the feature variables with ordinal numbers 250, 876, 872, 249, 842, 231, 875, 874, 844, 229, 843, 230, 873, and 845 were identified as important and selected in 100 iterations. The figure shows the presence of outliers with large deviations in z-scores in 100 iterations, represented by the black squares. There is one outlier in each of the maximum, minimum, and mean z-scores of the shadow feature variable in 100 iterations. Additionally, the 14 original feature variables that were selected also exhibit a small number of outliers in 100 iterations. These outliers caused their z-scores to be lower than the maximum z-scores of the shadow feature variables in some iterations. This occurrence can be attributed to the high volatility of results in a single iteration. Therefore, the Boruta algorithm required multiple iterations to identify important feature variables and enhance the stability of the feature selection results.
The spectral data containing 14 selected feature variables were used as the input of ELM to construct the Boruta-ELM model for fenthion content in soybean oil samples, and the test set prediction results are presented in Figure 9. As shown in the figure, the RP2 of the Boruta-ELM model increases from 0.8417 to 0.9631 when compared to the full-spectrum data as input. Meanwhile, the RMSEP decreases from 167.2986 to 71.4423, and the MAPEP decreases from 26.46% to 10.06%. Figure 10 shows the distribution of the 14 spectral feature variables selected by the Boruta algorithm. The figure shows that the selected feature variables consist of the four P-element feature spectral lines presented in Figure 3 and some other adjacent spectral lines. The selected feature spectral lines of P-element are P I 213.62 nm, P I 214.91 nm, P I 253.56 nm, and P I 255.33 nm, respectively, which are highly correlated with fenthion content. The effectiveness of the Boruta algorithm in selecting important feature variables and relevant influence variables has been proven. It is also effective in reducing the impact of redundant features and background noise. As a result, the prediction performance and stability of the model are significantly improved.

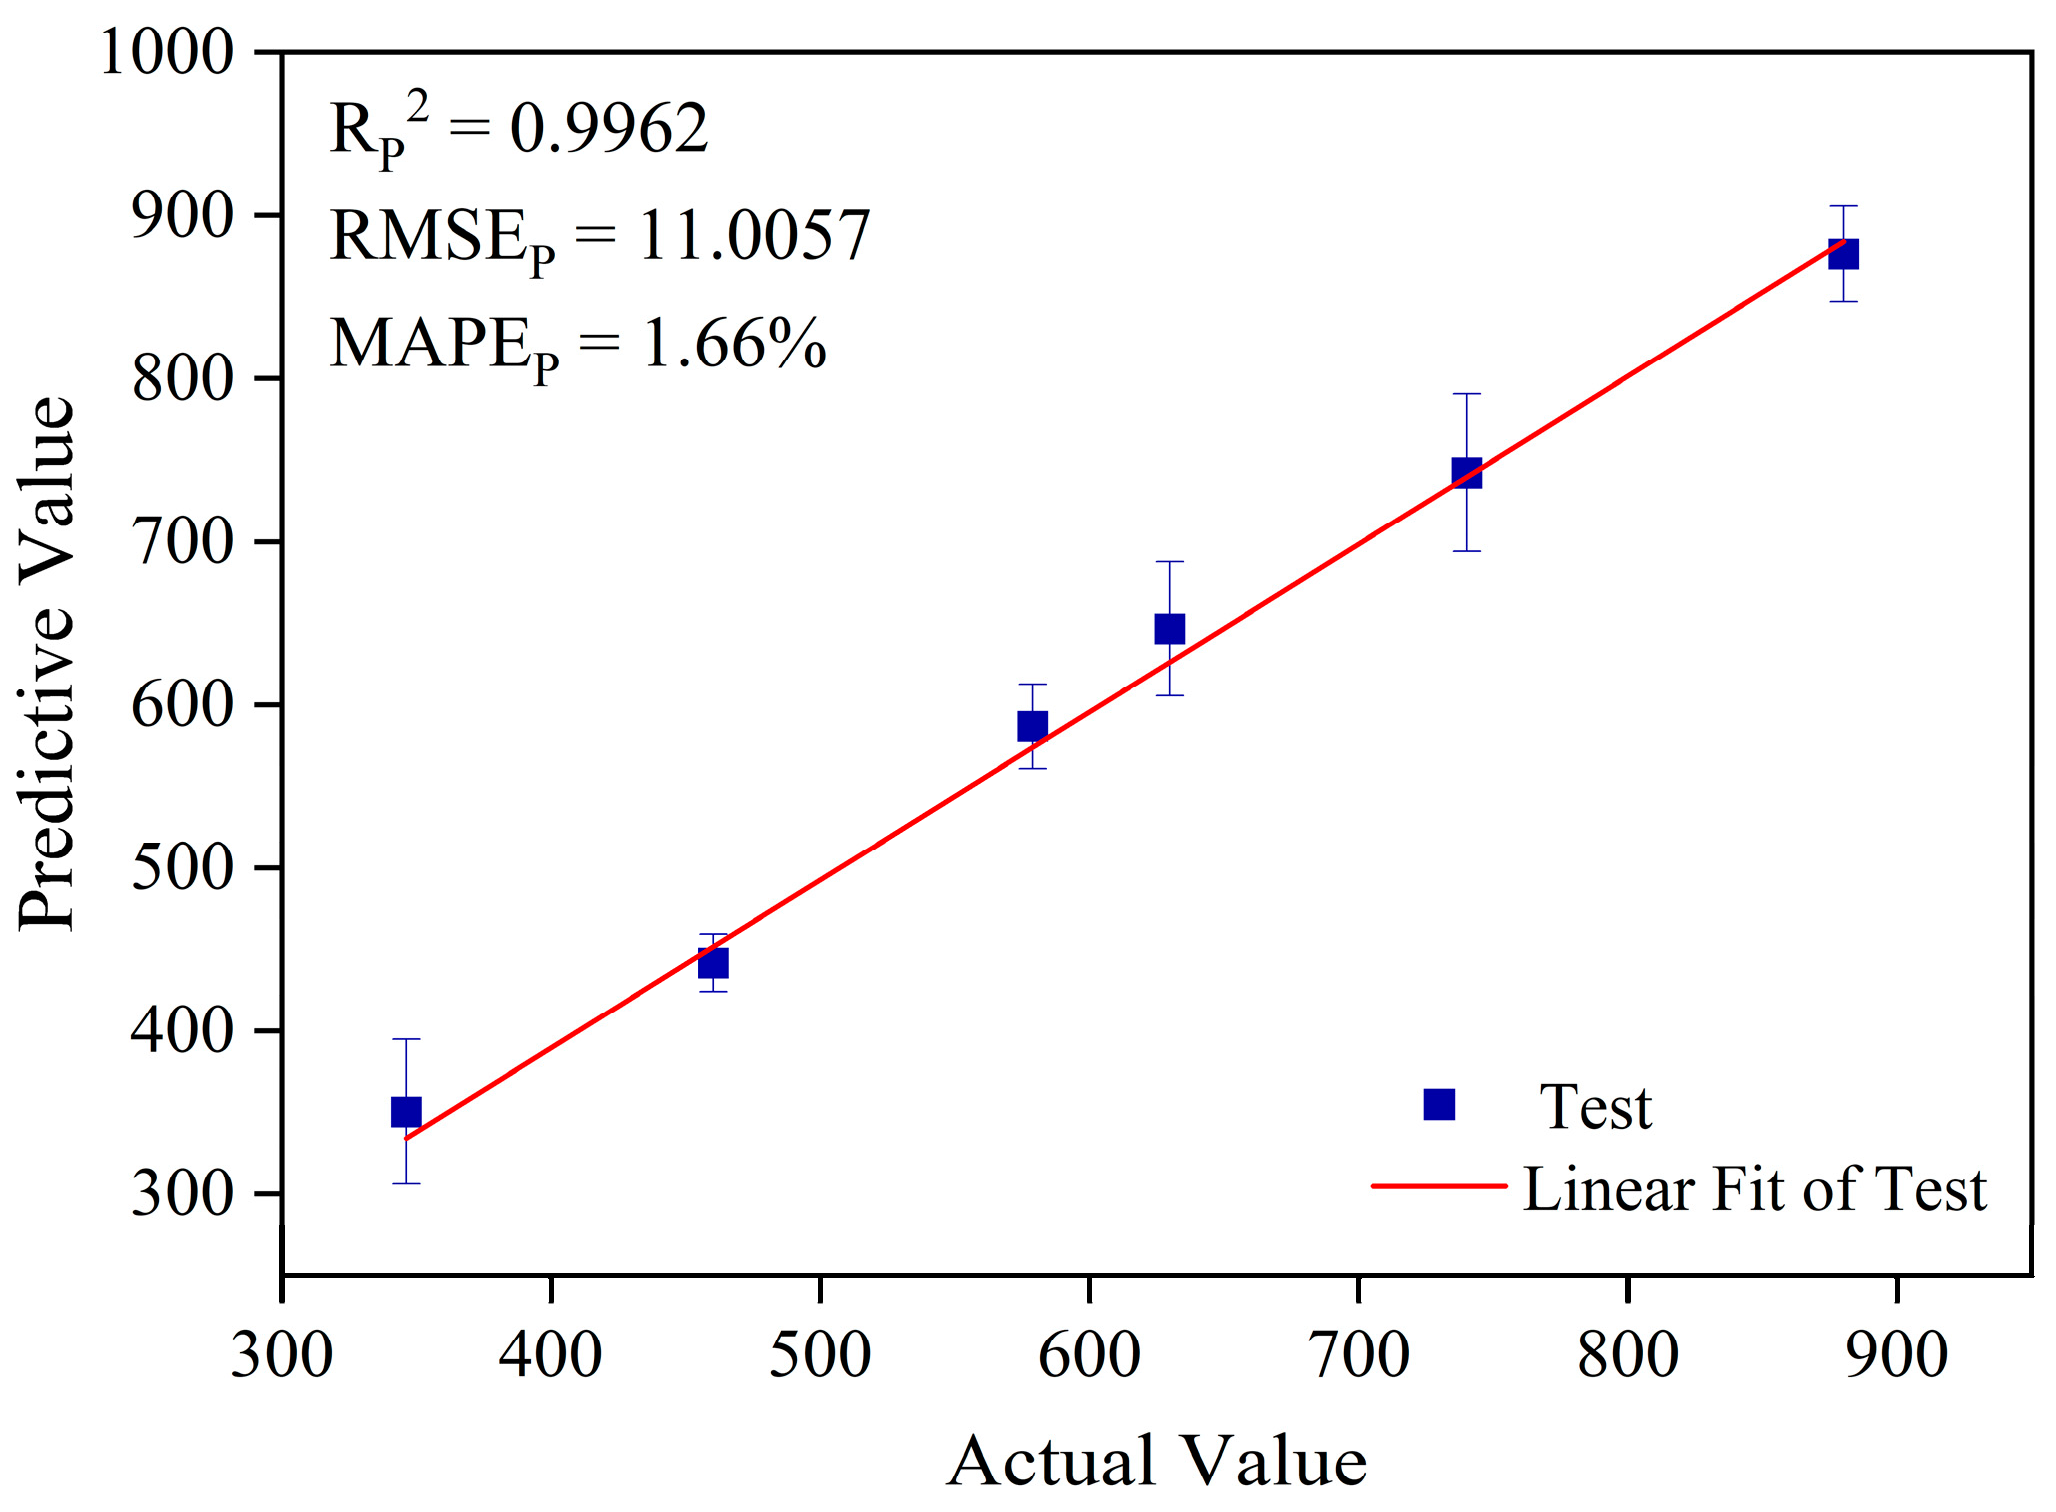
3.3.3. Analysis of Prediction Results Based on the GA-Boruta-ELM Model

This paper used GA to optimize the selection of weights and thresholds of the ELM model to improve the prediction performance of the Boruta-ELM. The GA parameters were set as follows: population size of 20, maximal evolutionary generation of 500, genetic generation gap of 0.95, crossover probability of 0.70, and variation probability of 0.01. Figure 11 shows the evolutionary process of the resulting GA-Boruta-ELM model. As shown in the figure, the individual fitness value has reached its minimum and stabilized at the 279th iteration, with a fitness value of 11.0057. This indicates that it has converged on the optimal weights and thresholds. Figure 12 shows the prediction results of the GA-Boruta-ELM model. Currently, the prediction results of the test set demonstrate a significant correlation between the actual and predicted values. When compared to the predicted results of the Boruta-ELM model, the RP2 increases from 0.9631 to 0.9962. Additionally, RMSEP decreases from 71.4423 to 11.0057, and MAPEP also decreases from 10.06% to 1.6%. This indicates that the combination of the GA and Boruta-ELM can further enhance the prediction performance of the model.

3.3.4. Comparison of the Prediction Performance of Different Models

Table 2 compares the prediction performance of different models for fenthion content in soybean oil samples. The table shows that the worst prediction performance is obtained when the ELM model is constructed using the full spectrum. In contrast, the prediction performance of the Boruta-ELM model is enhanced. Compared to the full-spectrum ELM model, the RP2 of the Boruta-ELM model increases by 14.42%, the RMSEP decreases by 57.30%, and the MAPEP decreases by 61.98%. This indicates that the Boruta algorithm can reduce the interference of redundant information and background noise. It leads to a more concise selection of features for modeling, ultimately enhancing the performance and stability of the prediction model. The GA-Boruta-ELM model improves RP2 by 3.44%, RMSEP by 84.59%, and MAPEP by 83.50% when compared to the Boruta-ELM model. This indicates that by utilizing GA to optimize the weights and thresholds of the Boruta-ELM model, its prediction performance can be improved even further. We also used six-fold cross-validation to evaluate the prediction performance of each model, and the results are shown in Table 3. The prediction results of each model based on the cross-validation are similar to the prediction results of the test set. The results above suggest that the GA-ELM-Boruta model has the best prediction capability and certain advantages for predicting the fenthion contents in soybean oils.

4. Conclusions

In this paper, the substrate-assisted LIBS technique was used to quantitatively determine the fenthion in soybean oils. Using an alumina ceramic sheet as the substrate, the effects of the average oil film thickness, laser energy, and delay time on the spectral signal intensity and SBR were explored. The optimal average oil film thickness was 45.8 µm, the optimal laser energy was 175 mJ, and the optimal delay time was 1 µs. Subsequently, the samples were quantitatively determined under the optimized experimental conditions, and a full-spectrum ELM model was established. The RP2, RMSEP, and MAPEP values for the test set samples were 0.8417, 167.2986, and 26.46%, respectively. Due to the influence of redundant information and background noise in the original spectral data, the full-spectrum ELM model obtained poor prediction results. Then, the Boruta algorithm was utilized to select 14 feature variables with a high correlation to the fenthion content. These variables were used as inputs for the ELM to establish the Boruta-ELM model. The RP2, RMSEP, and MAPEP values for the test set samples were 0.9631, 71.4423, and 10.06%, respectively. The prediction performance of the Boruta-ELM model demonstrated improvement when compared to the full-spectrum ELM model. To further enhance the prediction performance of the model, the use of GA to optimize the weights and thresholds of the Boruta-ELM model and the GA-Boruta-ELM model was developed. For the test set samples, the RP2, RMSEP, and MAPEP values were 0.9962, 11.005, and 1.66%, respectively. The results indicate that the GA-Boruta-ELM model has a superior prediction ability for fenthion content in soybean oil. Combining the substrate-assisted LIBS technique and the GA-Boruta-ELM model has potential applications for quantitatively determining pesticide residues in edible vegetable oils.

Author Contributions

Conceptualization, Y.D. and Y.W.; methodology, Y.D. and Y.W.; data curation, Y.D. and J.C.; formal analysis, Y.W. and W.C.; funding acquisition, Y.S. and M.Z.; investigation, A.H. and Y.S.; project administration, Y.D.; validation, Y.D., Y.W. and J.C.; writing—original draft preparation, Y.D.; writing—review and editing, Y.D. and Y.W. All authors have read and agreed to the published version of the manuscript.

Funding

The research is funded by the National Natural Science Foundation of China (62105160), the National Natural Science Foundation of Fujian (2023J05303), and the open sharing and independent research project for large-scale scientific instruments (TC2023A020).

Institutional Review Board Statement

Not applicable.

Informed Consent Statement

Not applicable.

Data Availability Statement

The data presented in this study are available from the corresponding author.

Conflicts of Interest

The authors declare no conflicts of interest.

References

  1. He, J.; Li, J.; Gao, Y.; He, X.; Hao, G. Nano-based smart formulations: A potential solution to the hazardous effects of pesticide on the environment. J. Hazard. Mater. 2023, 456, 131599. [Google Scholar] [CrossRef]
  2. Yu, Z.; Lu, T.; Qian, H. Pesticide interference and additional effects on plant microbiomes. Sci. Total Environ. 2023, 888, 164149. [Google Scholar] [CrossRef]
  3. Kitamura, S.; Kadota, T.; Yoshida, M.; Jinno, N.; Ohta, S. Whole-body metabolism of the organophosphorus pesticide, fenthion, in goldfish, Carassius auratus. Comp. Biochem. Physiol. Part C Toxicol. Pharmacol. 2000, 126, 259–266. [Google Scholar] [CrossRef]
  4. Doemoetoerova, M.; Matisova, E. Fast gas chromatography for pesticide residues analysis. J. Chromatogr. A 2008, 1207, 1–16. [Google Scholar] [CrossRef]
  5. Presta, M.A.; Kolberg, D.I.S.; Wickert, C.; Pizzutti, I.R.; Adaime, M.B.; Zanella, R. High Resolution Gel Permeation Chromatography Followed by GC-ECD for the Determination of Pesticide Residues in Soybeans. Chromatographia 2009, 69, 237–241. [Google Scholar] [CrossRef]
  6. Li, L.; Zhou, S.; Jin, L.; Zhang, C.; Liu, W. Enantiomeric separation of organophosphorus pesticides by high-performance liquid chromatography, gas chromatography and capillary electrophoresis and their applications to environmental fate and toxicity assays. J. Chromatogr. B Anal. Technol. Biomed. Life Sci. 2010, 878, 1264–1276. [Google Scholar] [CrossRef]
  7. Reyes-Garces, N.; Myers, C. Analysis of the California list of pesticides, mycotoxins, and cannabinoids in chocolate using liquid chromatography and low-pressure gas chromatography-based platforms. J. Sep. Sci. 2021, 44, 2564–2576. [Google Scholar] [CrossRef]
  8. Ali, I.; Suhail, M.; Alharbi, O.M.L.; Hussain, I. Advances in sample preparation in chromatography for organic environmental pollutants analyses. J. Liq. Chromatogr. Relat. Technol. 2019, 42, 137–160. [Google Scholar] [CrossRef]
  9. Castro, R.; Natera, R.; Duran, E.; Garcia-Barroso, C. Application of solid phase extraction techniques to analyse volatile compounds in wines and other enological products. Eur. Food Res. Technol. 2008, 228, 1–18. [Google Scholar] [CrossRef]
  10. Cobzac, S.C.; Gocan, S. Sample preparation for high performance liquid chromatography: Recent progress. J. Liq. Chromatogr. Relat. Technol. 2011, 34, 1157–1267. [Google Scholar] [CrossRef]
  11. Jiang, H.; Yang, S.; Tian, H.; Sun, B. Research progress in the use of liquid-liquid extraction for food flavour analysis. Trends Food Sci. Technol. 2023, 132, 138–149. [Google Scholar] [CrossRef]
  12. Ding, Y.; Zhang, W.; Zhao, X.; Zhang, L.; Yan, F. A hybrid random forest method fusing wavelet transform and variable importance for the quantitative analysis of K in potassic salt ore using laser-induced breakdown spectroscopy. J. Anal. At. Spectrom. 2020, 35, 1131–1138. [Google Scholar] [CrossRef]
  13. Deng, F.; Ding, Y.; Chen, Y.; Zhu, S. Quantitative analysis of the content of nitrogen and sulfur in coal based on laser-induced breakdown spectroscopy: Effects of variable selection. Plasma Sci. Technol. 2020, 22, 074005. [Google Scholar] [CrossRef]
  14. Qiao, S.; Ding, Y.; Tian, D.; Yao, L.; Yang, G. A Review of Laser-Induced Breakdown Spectroscopy for Analysis of Geological Materials. Appl. Spectrosc. Rev. 2015, 50, 1–26. [Google Scholar] [CrossRef]
  15. Fichet, P.; Mauchien, P.; Wagner, J.-F.; Moulin, C. Quantitative elemental determination in water and oil by laser induced breakdown spectroscopy. Anal. Chim. Acta 2001, 429, 269–278. [Google Scholar] [CrossRef]
  16. Yaroshchyk, P.; Morrison, R.J.S.; Body, D.; Chadwick, B.L. Quantitative determination of wear metals in engine oils using laser-induced breakdown spectroscopy: A comparison between liquid jets and static liquids. Spectrochim. Acta Part B 2005, 60, 986–992. [Google Scholar] [CrossRef]
  17. Yang, P.; Zhou, R.; Zhang, W.; Yi, R.; Tang, S.; Guo, L.; Hao, Z.; Li, X.; Lu, Y.; Zeng, X. High-sensitivity determination of cadmium and lead in rice using laser-induced breakdown spectroscopy. Food Chem. 2019, 272, 323–328. [Google Scholar] [CrossRef] [PubMed]
  18. Yao, S.; Lu, J.; Zheng, J.; Dong, M. Analyzing unburned carbon in fly ash using laser-induced breakdown spectroscopy with multivariate calibration method. J. Anal. At. Spectrom. 2012, 27, 473–478. [Google Scholar] [CrossRef]
  19. Nicolodelli, G.; Marangoni, B.S.; Cabral, J.S.; Villas-Boas, P.R.; Senesi, G.S.; dos Santos, C.H.; Romano, R.A.; Segnini, A.; Lucas, Y.; Montes, C.R.; et al. Quantification of total carbon in soil using laser-induced breakdown spectroscopy: A method to correct interference lines. Appl. Opt. 2014, 53, 2170–2176. [Google Scholar] [CrossRef]
  20. Kumari, R.; Kumar, R.; Rai, A.; Rai, A.K. Evaluation of Na and K in anti-diabetic ayurvedic medicine using LIBS. Lasers Med. Sci. 2022, 37, 513–522. [Google Scholar] [CrossRef]
  21. Kim, G.; Kwak, J.; Choi, J.; Park, K. Detection of Nutrient Elements and Contamination by Pesticides in Spinach and Rice Samples Using Laser-Induced Breakdown Spectroscopy (LIBS). J. Agric. Food Chem. 2012, 60, 718–724. [Google Scholar] [CrossRef] [PubMed]
  22. Du, X.; Dong, D.; Zhao, X.; Jiao, L.; Han, P.; Lang, Y. Detection of pesticide residues on fruit surfaces using laser induced breakdown spectroscopy. RSC Adv. 2015, 5, 79956–79963. [Google Scholar] [CrossRef]
  23. Zhao, X.; Zhao, C.; Du, X.; Dong, D. Detecting and Mapping Harmful Chemicals in Fruit and Vegetables Using Nanoparticle-Enhanced Laser-Induced Breakdown Spectroscopy. Sci. Rep. 2019, 9, 906. [Google Scholar] [CrossRef]
  24. Xiu, J.; Motto-Ros, V.; Panczer, G.; Zheng, R.; Yu, J. Feasibility of wear metal analysis in oils with parts per million and sub-parts per million sensitivities using laser-induced breakdown spectroscopy of thin oil layer on metallic target. Spectrochim. Acta Part B 2014, 91, 24–30. [Google Scholar] [CrossRef]
  25. Zheng, L.; Cao, F.; Xiu, J.; Bai, X.; Motto-Ros, V.; Gilon, N.; Zeng, H.; Yu, J. On the performance of laser-induced breakdown spectroscopy for direct determination of trace metals in lubricating oils. Spectrochim. Acta Part B 2014, 99, 1–8. [Google Scholar] [CrossRef]
  26. Ma, S.; Tang, Y.; Ma, Y.; Chu, Y.; Chen, F.; Hu, Z.; Zhu, Z.; Guo, L.; Zeng, X.; Lu, Y. Determination of trace heavy metal elements in aqueous solution using surface-enhanced laser-induced breakdown spectroscopy. Opt. Express 2019, 27, 15091–15099. [Google Scholar] [CrossRef] [PubMed]
  27. Kursa, M.B.; Rudnicki, W.R. Feature Selection with the Boruta Package. J. Stat. Softw. 2010, 36, 1–13. [Google Scholar] [CrossRef]
  28. Agjee, N.e.H.; Ismail, R.; Mutanga, O. Identifying relevant hyperspectral bands using Boruta: A temporal analysis of water hyacinth biocontrol. J. Appl. Remote Sens. 2016, 10, 042002. [Google Scholar] [CrossRef]
  29. Huang, G.-B.; Zhu, Q.-Y.; Siew, C.-K. Extreme learning machine: Theory and applications. Neurocomputing 2006, 70, 489–501. [Google Scholar] [CrossRef]
  30. Ding, S.; Xu, X.; Nie, R. Extreme learning machine and its applications. Neural. Comput. Appl. 2014, 25, 549–556. [Google Scholar] [CrossRef]
  31. Sun, J.; Liu, Q.; Wang, Y.; Wang, L.; Song, X.; Zhao, X. Five-Year Prognosis Model of Esophageal Cancer Based on Genetic Algorithm Improved Deep Neural Network. IRBM 2023, 44, 100748. [Google Scholar] [CrossRef]
  32. Qin, Y.; Song, K.; Zhang, N.; Wang, M.; Zhang, M.; Peng, B. Robust NIR quantitative model using MIC-SPA variable selection and GA-ELM. Infrared Phys. Technol. 2023, 128, 104534. [Google Scholar] [CrossRef]
Figure 1. Schematic illustration of the LIBS experimental setup.
Photonics 11 00129 g001
Figure 2. Schematic of the pretreatment procedure for samples of soybean oil.
Photonics 11 00129 g002
Figure 3. Full LIBS spectrum of sample 8.
Photonics 11 00129 g003
Figure 4. Intensity of P I 253.56 nm spectral line and SBR with the oil film thickness.
Photonics 11 00129 g004
Figure 5. Intensity of P I 253.56 nm spectral line and SBR with the laser energy.
Photonics 11 00129 g005
Figure 6. Intensity of the P I 253.56 nm spectral line and SBR with the delay time.
Photonics 11 00129 g006
Figure 7. Full-spectrum ELM model results for predicting fenthion contents in soybean oil samples.
Photonics 11 00129 g007
Figure 8. The results of feature selection using the Boruta algorithm.
Photonics 11 00129 g008
Figure 9. Boruta-ELM model results for predicting fenthion contents in soybean oil samples.
Photonics 11 00129 g009
Figure 10. Distribution of spectral feature variables selected by the Boruta algorithm.
Photonics 11 00129 g010
Figure 11. The evolutionary process of the GA-Boruta-ELM model.
Photonics 11 00129 g011
Figure 12. GA-Boruta-ELM model results for predicting fenthion contents in soybean oil samples.
Photonics 11 00129 g012
Table 1. Fenthion content in samples of soybean oil.
Sample NumberFenthion
Content/(µg/g)
Sample NumberFenthion
Content/(µg/g)
1307.810674.2
2 #346.211 #740.2
3357.312760.5
4430.513827.6
5 #460.314873.2
6501.215 #880.1
7 #578.816909.1
8627.117942.7
9 #629.818984.4
Note: # denotes test set sample.
Table 2. Comparison of different prediction models.
ModelNumber of VariablesRP2RMSEPMAPEP
Full-spectrum ELM81900.8417167.298626.46%
Boruta-ELM140.963171.442310.06%
GA-Boruta-ELM140.996211.00571.66%
Table 3. Comparison of cross-validation results of different prediction models.
ModelRCV2RMSECVMAPECV
Full-spectrum ELM0.8249184.149628.41%
Boruta-ELM0.971865.72689.16%
GA-Boruta-ELM0.997510.26181.49%
Disclaimer/Publisher’s Note: The statements, opinions and data contained in all publications are solely those of the individual author(s) and contributor(s) and not of MDPI and/or the editor(s). MDPI and/or the editor(s) disclaim responsibility for any injury to people or property resulting from any ideas, methods, instructions or products referred to in the content.

