Article

Color Reproduction of Chinese Painting Under Multi-Angle Light Source Based on BRDF

1
School of Physics and Electronic Information, Yunnan Normal University, Kunming 650500, China
2
Yunnan Provincial Museum, Kunming 650200, China
*
Author to whom correspondence should be addressed.
Photonics 2024, 11(11), 1089; https://doi.org/10.3390/photonics11111089
Submission received: 9 October 2024 / Revised: 11 November 2024 / Accepted: 18 November 2024 / Published: 20 November 2024
(This article belongs to the Special Issue Optical Imaging and Measurements: 2nd Edition)

Abstract

:
It is difficult to achieve high-precision color reproduction using traditional color reproduction methods when the angle is changed, and, for large-sized artefacts, it is also significantly difficult to collect a large amount of data and reproduce the colors. In this paper, we use three Bidirectional Reflectance Distribution Function (BRDF) modeling methods based on spectral imaging techniques, namely, the five-parameter model, the Cook–Torrance model and the segmented linear interpolation model. We investigated the color reproduction of color chips with matte surfaces and Chinese paintings with rough surfaces under unknown illumination angles. Experiments have shown that all three models can effectively perform image reconstruction under small illumination angle intervals. The segmented linear interpolation model exhibits a higher stability and accuracy in color reconstruction under small and large illumination angle intervals; it can not only reconstruct color chips and Chinese painting images under any illumination angle, but also achieve high-quality image color reconstruction standards in terms of objective data and intuitive perception. The best test model (segmented linear interpolation) performs well in reconstruction, reconstructing Chinese paintings at 65° and 125° with an illumination angle interval of 10°. The average RMSE of the selected reference color blocks is 0.0450 and 0.0589, the average CIEDE2000 color difference is 1.07 and 1.50, and the SSIM values are 0.9227 and 0.9736, respectively. This research can provide a theoretical basis and methodological support for accurate color reproduction as well as the large-sized scientific prediction of artifacts at any angle, and has potential applications in cultural relic protection, art reproduction, and other fields.

1. Introduction

As an artistic treasure of Chinese civilization, Chinese paintings have extremely important artistic and historical value. However, due to the texture of Chinese paintings themselves, they may suffer from irreversible man-made and natural damage over time. As a result, the digital preservation and color reproduction of Chinese paintings are of great significance. Traditional color reproduction techniques are based on color modeling and use multispectral cameras or other imaging devices to record the color of objects. At present, many color workers have proposed color replication and reproduction techniques based on spectral reflectance. Employing spectral reflectance as the foundation for color replication effectively resolves the challenges posed by metamerism [1,2,3]. However, spectral reflectance cannot solve the problems of texture, material, and angle changes, so BRDF was introduced. BRDF itself can achieve true color reproduction, while also solving the problems of texture, material, and angle changes. The bi-directional reflectance property of BRDF means that the reflectance of the sample to be measured varies with the angle of incidence of the light source and the viewing angle, which enables it to describe the energy distribution in different directions when the reflection of light goes through the surface. Simple materials such as standard gray scale plates and reflectance standards also require the measurement of BRDF to achieve characterization [4]. BRDF theory has significant applications in many fields, including materials analysis [5], optical remote sensing [6], and environmental monitoring [7]. It has also been extended to cover emerging research areas, such as 3D target reconstruction [8], and virtual reality [9,10]. In recent years, the application of artificial intelligence (AI) and machine learning in BRDF modeling has received increasing attention [11]. These technologies not only improve the realism of modeling, but also have certain advantages in computational efficiency and resource utilization. Although these emerging methods have strong adaptability and advantages, traditional physical models still have high computational stability and interpretability in many application scenarios.
In BRDF numerical simulation, many BRDF modeling methods have been developed presently. Based on the modeling approaches, BRDF can be classified into physical [12], empirical [13,14], and data-driven models [15]. The physical models always satisfy the law of energy conservation and the law of Helmholtz’s reciprocal inverse, whereas they consist of many parameters and are computationally complex. The empirical models are relatively less complex, but the rendered results often do not fully achieve the expected material effects. The data-driven models have the most realistic fitting effect; yet, they require us to collect a large amount of data. Meanwhile, the data transmission and storage consume a lot of computational resources, and the parameters are not easily adjustable for direct use in rendering. The Monte Carlo method [9], discrete quadrature method [16], and spherical harmonic discrete quadrature method [17] are widely used to study targets with a regular structure and known optical parameters. Kalantari et al. [18] proposed a new model for analyzing the reflectance distribution of rough surfaces, successfully predicting the non-specular maximum with an increasing incidence angle by analyzing the angular distribution of reflectance. Lai et al. [19] studied and analyzed the effects of the surface texture and illumination wavelength on BRDF of four different textured fabrics and provided a fast and simple BRDF model with a genetic algorithm to obtain the best model parameters for calculating the BRDF of fabrics.
The current BRDF modeling technology still has limitations in the application of cultural heritage protection. The traditional BRDF measurement method requires a large amount of high-quality data, and the data collection equipment is complex and expensive, which poses a huge challenge to the modeling of cultural heritage. A common technique for obtaining BRDF is the gonioreflectometer, which measures the reflectivity of flat samples [20]. Kim et al. [21] captured 2890 images for BRDF reconstruction using a precise rotary stage, which accurately and efficiently rendered the true appearance of the material on a 3D model. Liu et al. [22] captured 128 multiview images from an unknown environment, and then proposed a neural-rendering-based method called NeRO to reconstruct the geometry and BRDF of the reflecting object. Jianying Hao et al. [23] proposed a method based on Gaussian process regression to model the reflective properties of real materials, and the results show that the proposed method is able to fit the reflective properties of certain materials well and greatly reduce the BRDF measurement time, while ensuring highly realistic rendering.
In recent years, many industries have been increasing their requirements for image realism quality [24,25,26,27]; the real image rendering reproduction based on measurement data is gradually emerging. The present methods that guarantee maximum realism are acquiring dense reflection data and directly using the measured data in a mapping method [28]. However, the disadvantages include the large memory consumption of the measurement data, the bottleneck in computational efficiency, and not being real-time. Most large cultural relics have complex surface structures and are not easy to move, so their color reconstruction faces many challenges. Firstly, the details and textures of large cultural relics are often more complex than standard samples. Secondly, most BRDF data acquisition devices are fixed, and the position and distance of detectors cannot be changed arbitrarily. They are only suitable for collecting small objects and cannot fully collect large objects.
Therefore, in this paper, we build a simple and portable data acquisition platform to measure the optical behavior of visually rich objects using a stationary hyperspectral camera that can take a limited number of images with different illumination directions. We then combine the key advantage where the measured data contain the real reflection information of the object with the BRDF model, which can effectively predict the BRDF from a small number of image samples and reconstruct the RGB image, completing the color reproduction [29] of a large-scale Chinese painting, which saves computational resources while providing the best visual effect.

2. Materials and Methods

2.1. Experimental Setup

The BRDF describes the distribution of incident light reflected from a surface in each direction of emission. As a result, BRDF is used to represent the proportional relationship between reflected and incident light in a specified direction. BRDF measurement is divided into absolute measurement and relative measurement. Absolute BRDF measurement is using the defined formula to achieve the measurement analysis, which is relatively convenient, and requires less amount of data to be measured but prone to large errors. The relative BRDF measurement is based on the sample ratio method of the relative measurement method. The key to this method is to use known reference surfaces as standards. By comparing the reflection characteristics of the target surface with the reference surface, we can obtain information about the target surface. When the measured material is observed at the same plane of incidence and the same detection angle as the standard plate, the BRDF of the measured material can be expressed in terms of the spectral information of the detected sample and the standard plate as well as the reflectance of the standard plate.
In this paper, relative measurement method is used for BRDF measurement; a standard white plate of polytetrafluoroethylene (PTFE) is used as a reference plate with a BRDF value of ρ ( λ ) / π . The reflectance of PTFE can be obtained by metrological calibration or measured with a spectrophotometer. The spectral BRDF equation is as follows:
f r θ i , φ i , θ r , φ r , λ = I s θ i , φ i , θ r , φ r , λ I b θ i , φ i , θ r , φ r , λ ρ λ π ,
where I s is the spectral information obtained by light incident on the sample to be measured along the θ i , φ i direction and out along the θ r , φ r direction. I b is the spectral information obtained from light incident on the standard white plate along the θ r , φ r direction and out along the θ i , φ i direction. ρ ( λ ) is the hemispherical reflectance of a standard whiteboard and λ is the wavelength. Hemispherical reflectance of standard whiteboards was measured directly using an X-Rite 64 spectrophotometer (the spectral range is 400 to 700 nm).
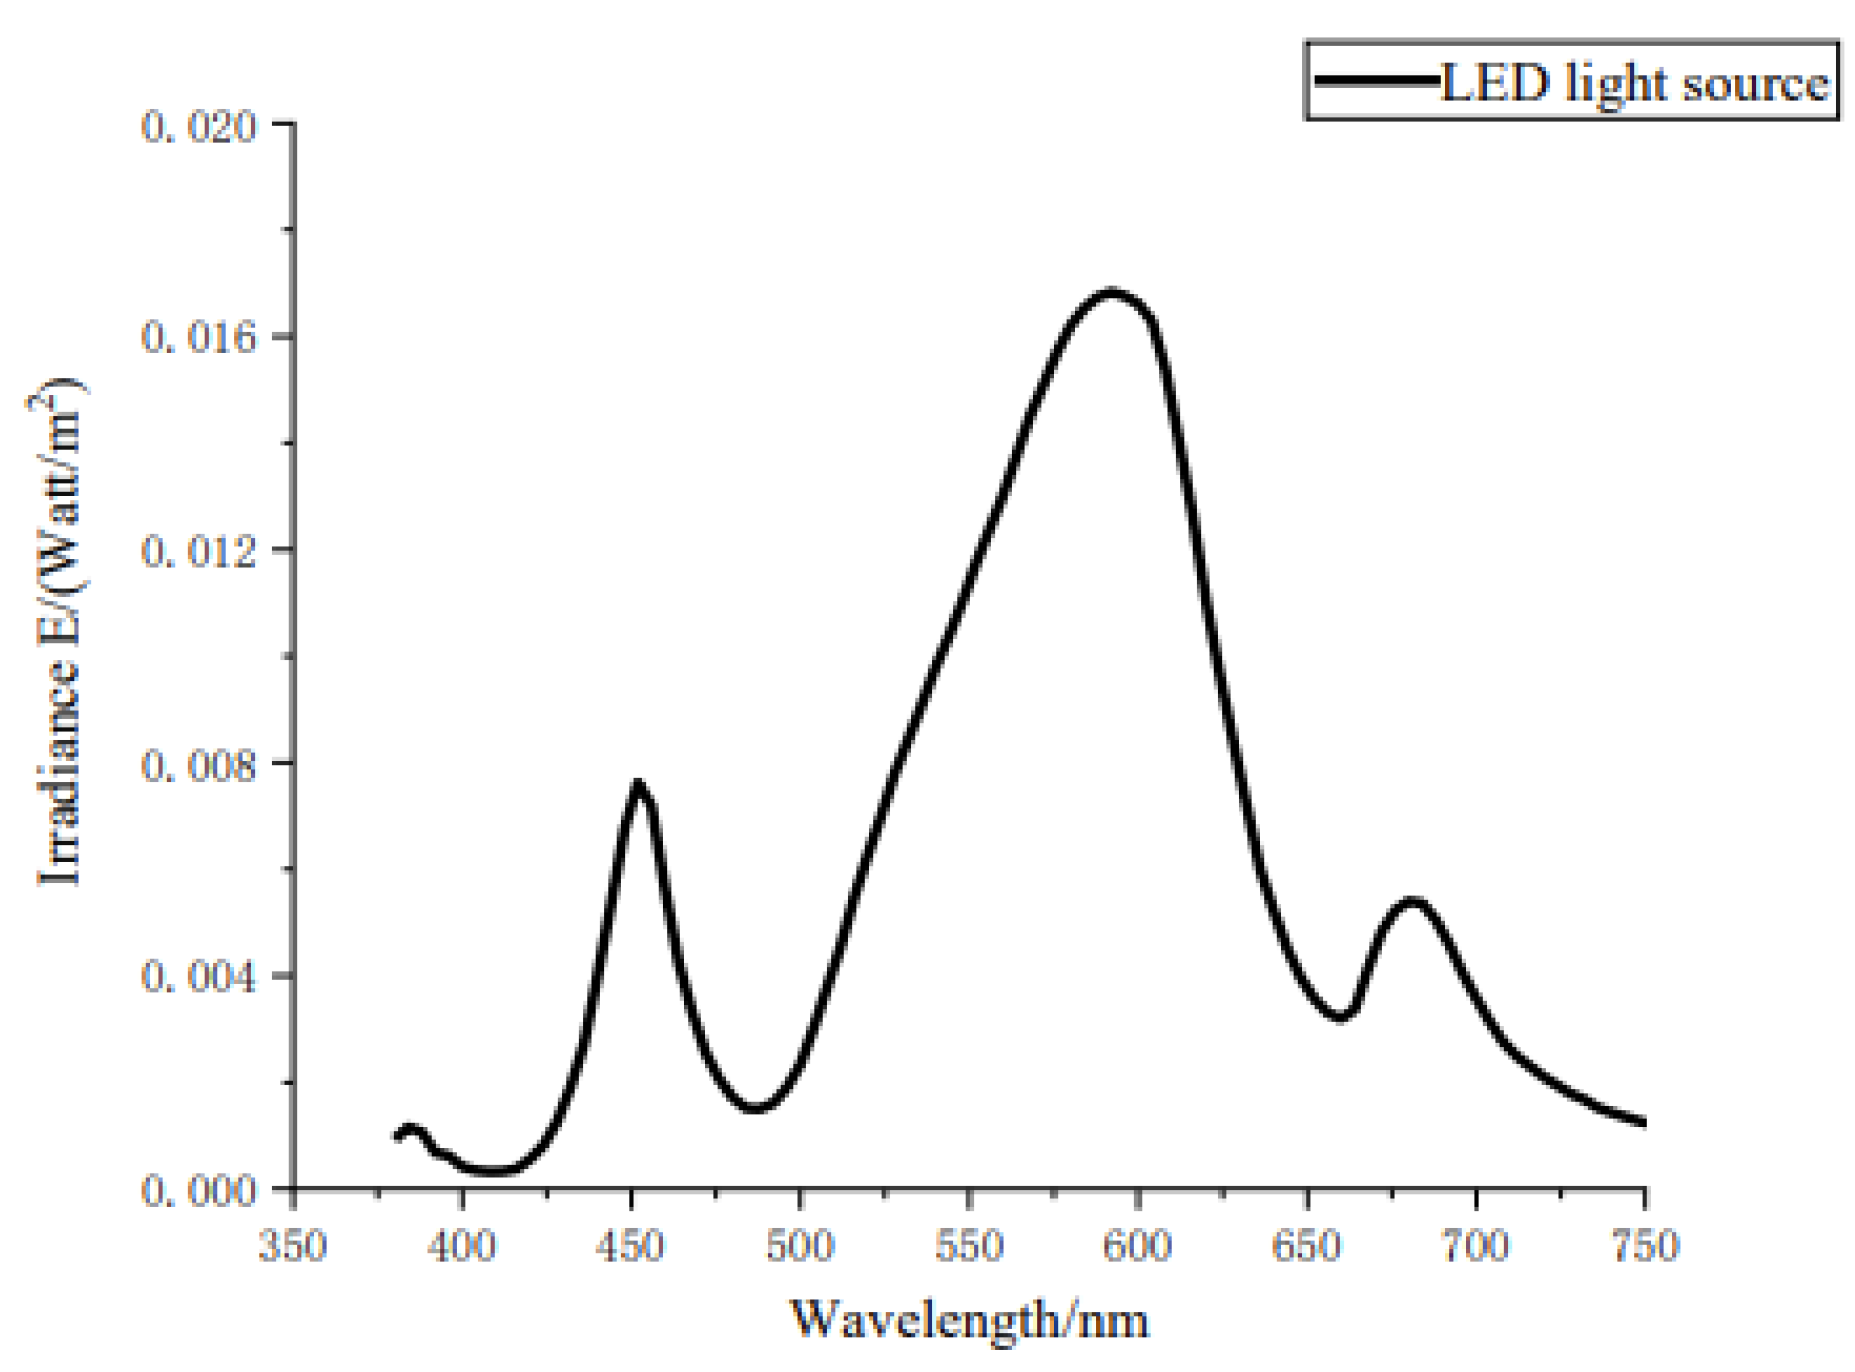
A variety of scenes such as heritage displays, landscape lighting, and indoor lighting are using light-emitting diodes (LEDs) as the lighting source. LED light source has the characteristics of wide spectral range, uniform energy distribution, and stable light output, which can reduce the influence of light source fluctuation on the measurement results during the measurement process again; therefore, we use LED lamp as the light source in this experiment. The irradiance was obtained using a PR-715 spectrophotometer, and the irradiance distribution of this light source is shown in Figure 1. The uniformity of spectral irradiance can ensure consistency in the measurement results of color chips, thereby improving the stability and reliability of BRDF data. Hyperspectral cameras decompose incident light into different wavelengths by means of a spectroscopic element, generating spectral information for each pixel in multiple spectral bands. This technique not only acquires spatial information about the object, but also provides detailed spectral properties, which are suitable for material analysis and reflection property extraction in BRDF measurements. Therefore, the experiment used a hyperspectral imaging system for data acquisition, which consists of a GaiaField-V10E hyperspectral camera, tripod stabilization equipment, and a companion laptop. The hyperspectral camera has a spectral resolution of 2.8 nm, with an exposure time set to 10.6 ms and a gain of 5.
Before applying the color reproduction method in this paper to complex objects such as Chinese paintings, using color chips can help to verify the accuracy and reliability of the color reproduction method. The Munsell book of color classifies colors based on their hue, value, and chroma, with each color having a unique color number. The Munsell color system covers the entire color spectrum from red to purple, as well as different levels from high saturation to low saturation, and from bright to dim. This wide range of colors allows us to test the performance of the methods used in experiments under various colors, making it easier to evaluate the effectiveness of color reproduction techniques. We randomly selected 56 color chips (each color chip has a size of 2.2 cm × 2 cm, with a matte finish; 56 Munsell notations for color chips are listed in Appendix A) from The Munsell Book of Color (Munsell 5th Edition) as the study object.
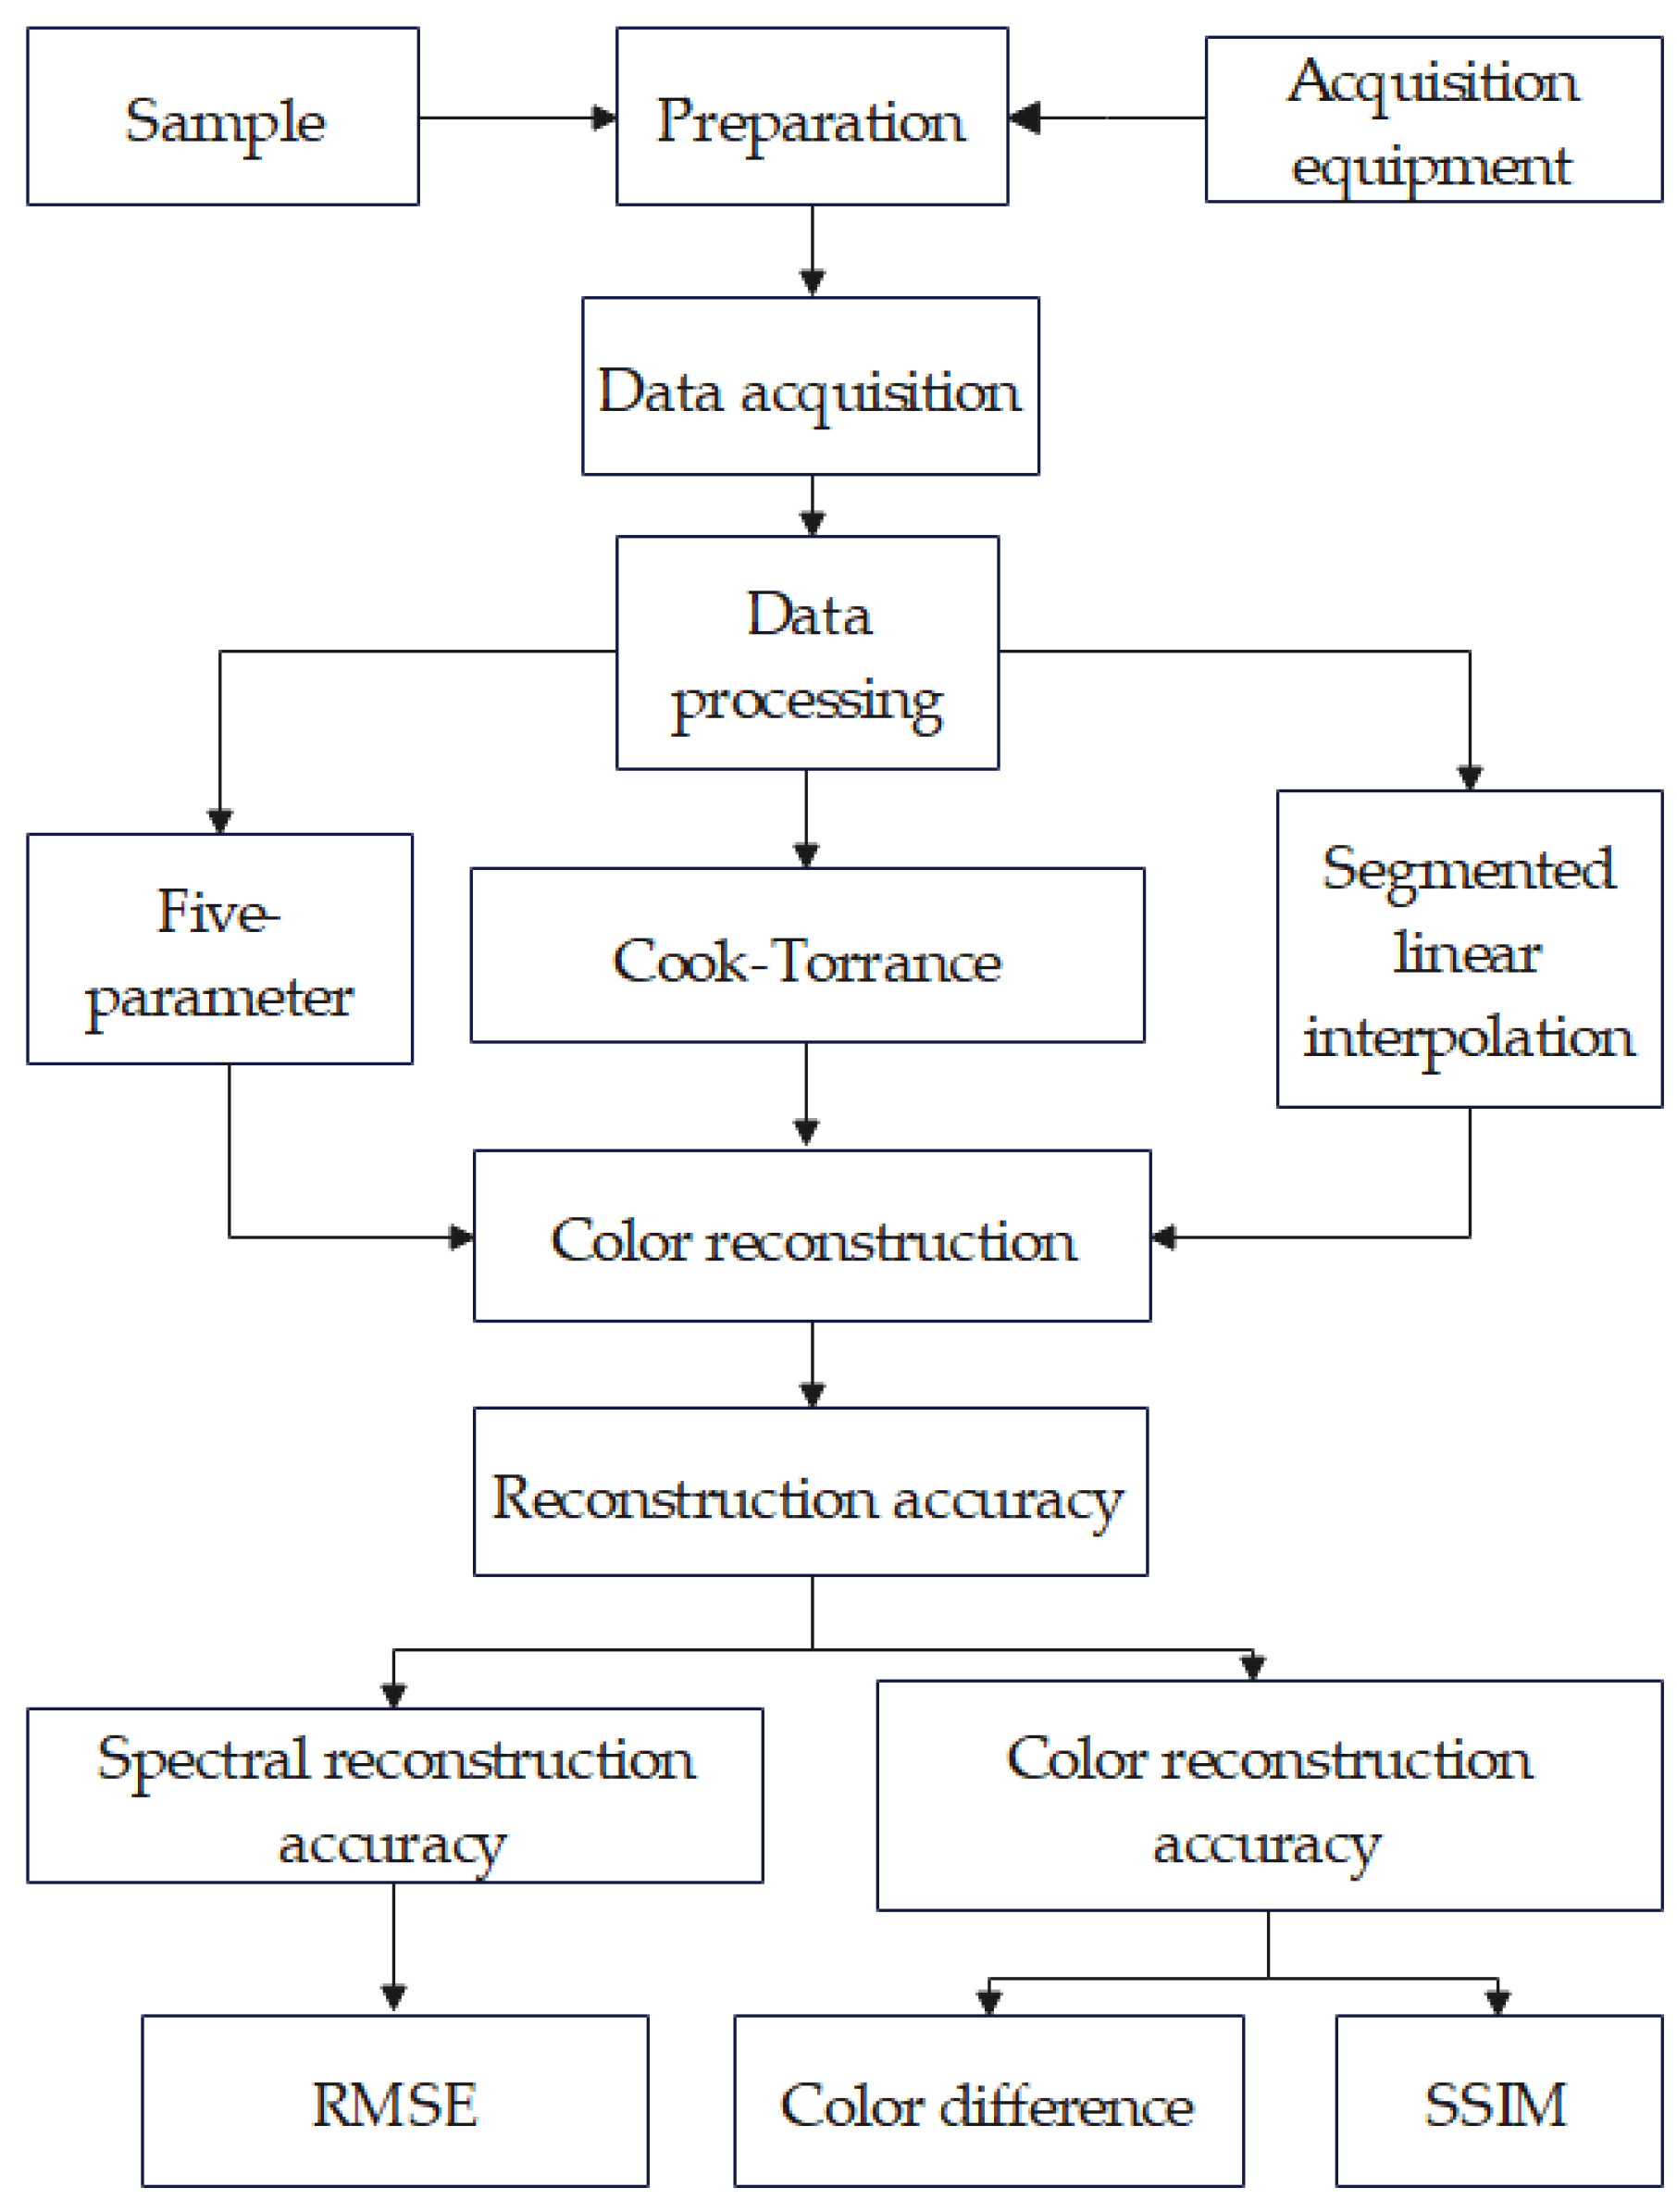
Use a hyperspectral camera to collect data in the 90° direction on the color card and PTFE standard white plate. As shown in Figure 2, the data were sampled at 5°and 10° illumination intervals from 30° to 150° in turn, with a light source illumination radius of 47 cm, the camera data collection radius is 120 cm. The reason for choosing a 5° and 10° interval is to balance data accuracy and data acquisition complexity. A 5° interval can further reveal the impact of subtle illumination changes on the reconstruction results, while a 10° interval can provide an overall trend. Although smaller intervals can provide more details, the difficulty of data collection will increase, and the required time will also increase. Moreover, interval with smaller differences may not significantly improve reconstruction accuracy, and larger intervals may overlook some details and changes. Therefore, we achieved an appropriate balance between data richness and data acquisition complexity by choosing 5° and 10° interval. After data acquisition, the hyperspectral imaging system comes with software Specview for black and white correction to reduce the impact of light scattering, random noise, and other unfavorable factors that may exist in the data acquisition process [30]. Subsequently, we went to the Yunnan Provincial Museum to collect the data of an authentic Chinese painting, which is 2 m × 1 m in size; the painting had slight aging, but, because this authentic painting has not yet been publicly exhibited, we were not allowed to collect the data of the whole painting, and only selected an area of 80 cm × 80 cm for data collection. The data collected and analyzed in this study are based on this specific Chinese painting, and the results do not represent the situation of other paintings. The relevant conclusions are also not applicable for promotion to other paintings. The data were sampled at 10° intervals from 30° to 150° in turn, with a light source illumination radius of 100 cm; the camera data acquisition radius was 150 cm. During the data collection process, fluctuations in device temperature and slight deviations in collection angles may introduce errors. Figure 3 is a flowchart of the experiment, which shows the arrangement of the experimental setup and the processing steps such as the measurement process and data acquisition.

2.2. BRDF Model

BRDF is essentially a parametric modeling of an object’s material and is based on various theoretical and empirical formulae to correctly express the visible results of the material affected by incident light. In most applications, BRDF is usually presented as a mathematical equation. BRDF models, in general, can be divided into three categories: empirical, physical, and data-driven models. In this paper, three models are used for BRDF reconstruction: the five-parameter model in the empirical model, the Cook–Torrance model in the physical model, and segmented linear interpolation belonging to the category of data-driven models.

2.2.1. Five-Parameter Model

The goal of the empirical model is to provide the user with a concise formulation for simulating a specific reflection with relatively low model complexity. The five-parameter model is an empirical model derived from a modification of the Torrance–Sparrow model, which employs simplified parameter settings and is computationally efficient; however, when the model is applied to materials with more complex surfaces, simplification may lead to a risk of decreased accuracy [31]. The model is simple in style and contains five unknown parameters:
f r θ i , θ r , φ i , φ r = k b k r 2 1 + k r 2 1 cos α exp b 1 cos γ a   G θ i , θ r , φ i , φ r cos θ r cos θ i + k d cos θ i ,
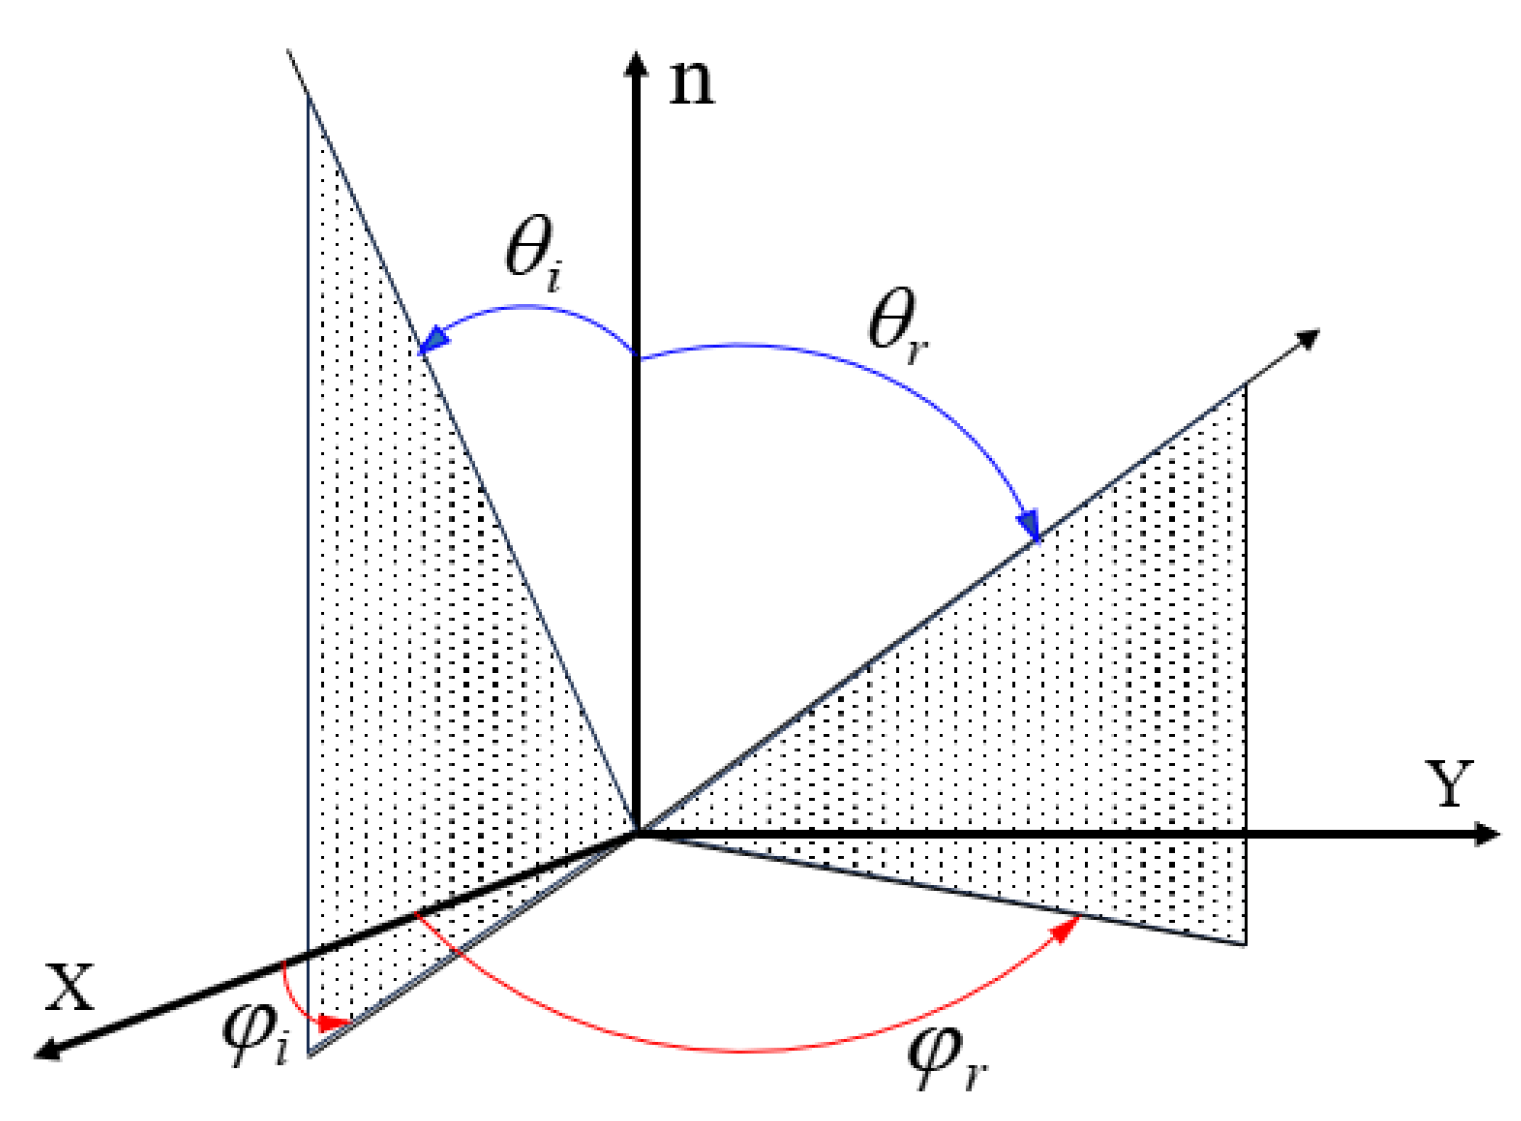
where k b , k r , a , b , and k d are unknown parameters. Concretely, k b is the specular reflection coefficient, k r is the diffuse reflection coefficient, a and b are parameters related to the target surface material, k d is a parameter related to the micro-surface distribution, the geometry function G θ i , θ r , φ i , φ r typically represents shadowing and masking effects, θ i is the incident zenith angle, θ r is the outgoing zenith angle, φ i is the incident azimuth angle, and φ r is the outgoing azimuth angle; the angular relationship is shown in Figure 4. The angle relationship between α and γ is as follows:
cos α = cos θ i + cos θ r 2 cos γ ,
cos 2 γ = 1 2 cos θ i cos θ r + sin θ i sin θ r cos φ r φ i + 1 ,

2.2.2. Cook–Torrance Model

The physical model is built based on scientific knowledge of the interaction of light and approximates real-world materials as accurately as possible by incorporating various geometric–optical properties of the material [32]. Considering that the research object includes color chips with matte surfaces, the Cook–Torrance model can better reflect the specular reflection characteristics when dealing with smooth surfaces, making it suitable for the application scenario of this study. The model improves accuracy through more detailed parameter descriptions and physical modeling, but it has higher parameter sensitivity and computational complexity. The model divides the BRDF into a body diffuse reflection term and a surface reflection term:
f r = k d c π + k s F o , n G i , o , n D n , h 4 i n o n ,
where k d is the ratio of the energy of the refracted part of the incident light, c is the albedo, k s is the ratio of the reflected part, F is the Fresnel reflection term, G is the geometric function, D is the normal distribution function, i is the incident direction of the light, o is the outgoing direction of the light, n represents the normal, and h is a Halfway Vector.

2.2.3. Segmented Linear Interpolation

The data-driven model is a model that uses actual measurement data for fitting. The fitting effect is the most realistic, but requires a large amount of data to implement the model, while the fitting usually requires interpolation and extrapolation of the data to calculate the BRDF data. The advantages of data-driven model include the following: (1) the model is built on the measurement data of real objects, and (2) the rendered reproduction images obtained by the data-driven model are usually more realistic. Segmented linear interpolation is a data-driven interpolation method suitable for continuous function reconstruction using discrete sampling points. This method divides the data into small intervals and uses simple linear equations to estimate the target value within each interval, thereby achieving high computational efficiency and reconstruction accuracy. The advantages of segmented linear interpolation are simple operation, low computational cost, easy implementation, and the fact that the interpolation function is continuous. but there may be insufficient capture of subtle reflection changes when dealing with high complexity surfaces [33].

2.3. BRDF-Based Color Reproduction Method

CIE1931 XYZ color space is a color space independent of device characteristics and is not only often used as a standard color space for color description but also used as an intermediate transition color space [34]. Other color systems between the interconversion are relatively easy to achieve. With the CIE 1931 standard observer [35], any light energy that enters the human eye to produce color perception can be calculated, that is, the CIE chromaticity system tristimulus values X, Y, and Z of the color stimulus function φ λ :
X = λ k φ λ x ¯ λ d λ 400 700 k φ λ x ¯ λ Δ λ ,
Y = λ k φ λ y ¯ λ d λ 400 700 k φ λ y ¯ λ Δ λ ,
Z = λ k φ λ z ¯ λ d λ 400 700 k φ λ z ¯ λ Δ λ ,
where k is called the normalization factor and the purpose is to adjust the Y value of the selected standard illuminant to 100 when targeting non-self-illuminated objects. Therefore, we have
k = 100 λ S λ y ¯ λ Δ λ
If the measured object is a reflector, φ λ is the color stimulus function:
φ λ = ρ λ S λ ,
where ρ λ is the spectral reflectance of the object and S λ is the spectral power distribution of the illumination source.
The bidirectional reflection coefficient (BRF) is the ratio of the reflected flux from the surface of the target object to be measured to the reflected flux from an ideal Lambertian body under the same incident and reflected conditions. The relationship between BRF and BRDF is described as follows:
β θ i , φ i , θ r , φ r = π f r θ i , φ i , θ r , φ r ,
BRF is equivalent to the reflectance factor in chromaticity, and it can effectively combine chromaticity theory and light scattering theory. The experiment can be calculated using the bidirectional reflection coefficient β θ i , φ i , θ r , φ r instead of ρ λ .
Combining Equations (6)–(11), it can be seen that, as long as the BRDF of the target object is obtained, the color tristimulus value X, Y, and Z of the target object can be reconstructed, and with a result that the color-matching ratio of the three primary colors of the sample can be calculated to achieve the true reproduction of the color of the target area.

2.4. Accuracy Evaluation

To further quantify the model reconstruction results and evaluate the reconstruction accuracy, the root mean square error (RMSE) was used to evaluate the spectral reconstruction accuracy; the CIEDE2000 color difference formula and Structural Similarity Index measure (SSIM) are used to evaluate the color reconstruction accuracy.
The RMSE not only avoids the problem that positive and negative errors cannot be summed up but also squares the errors, increasing the role of errors with large values in the index and improving the sensitivity. The RMSE is used to measure the deviation between the estimated reconstructed spectral data and the actual value. The smaller the value, the higher the accuracy of the estimation [36].
CIEDE2000 color difference is a unified indicator used to measure the color difference and quantify visual differences between colors [37]. The smaller the color difference value, the higher the matching degree between the reconstructed color and the target color, usually indicating a more accurate color restoration effect.
SSIM is widely used in the field of image processing, especially in areas such as image compression, image restoration, and image quality evaluation. SSIM considers the perceptual features of images by humans and can more comprehensively reflect the image quality perceived by the human eye. The calculation of SSIM is based on three aspects of information: luminance similarity, contrast similarity, and structure similarity. The range of SSIM calculation results is −1 to 1, and the closer the value is to 1, the higher the similarity is between the two image structures and the better the quality; the closer the value is to −1, the lower the structural similarity is and the poorer the quality.

3. Results and Analysis

3.1. Analysis of Reflectance and BRDF Characteristics

The reflectance and BRDF of the color chips were both measured using a hyperspectral camera. The color chips No. 1 (red), No. 26 (green), and No. 31 (blue) were selected for the study at a 90° observation angle and 135° light source irradiation angle; the band range studied was 413~700 nm. The variation curves of the reflectance and BRDF with the wavelength are shown in Figure 5.
From the three color chip curves shown in Figure 5a–c, it is clear that the trend of the BRDF values of color chips with the wavelength in the specified direction is the same as the trend of the spectral reflectance. To measure the trend similarity and spectral consistency between BRDF and reflectance, we calculated the correlation coefficient. The specific correlation coefficients of the three color chips are 0.9897, 0.9880, and 0.9974, respectively, which indicate that the two have the same trend, and also show that the BRDF measured by the relative measurement method retains the information about the surface characteristics of the object well, and can achieve consistent color transmission.
BRDF enables the realistic reproduction of target object colors in every illumination direction and every observation direction in space because it contains the incident and reflected information in each direction.
As shown in Figure 6, the BRDF values of red, green, and blue color chips at a viewing angle of 90° vary with the wavelength and light source irradiation angle. Since the surface of the color chip is smooth and produces specular reflections, it can be seen from the figure that the BRDF values on the surface of the color chip change as the illumination angle changes. As the illumination angle is close to 90°, the BRDF value has an obvious peak value in each band and decreases in both directions with 90° as the center, indicating that the BRDF contains the observed directional information and that it can reflect the reflection characteristics of the object surface at any observation angle under various incident conditions and accurately accomplish the color reproduction according to the reflection characteristics of the object. The comprehensive analysis shows that the color realistic reproduction based on BRDF is highly feasible.

3.2. Modeling Results and Analysis of Color Chip Data Based on 5° Illumination Interval Sampling

3.2.1. Analysis of Spectral Reconstruction Results with an Illumination Interval of 5°

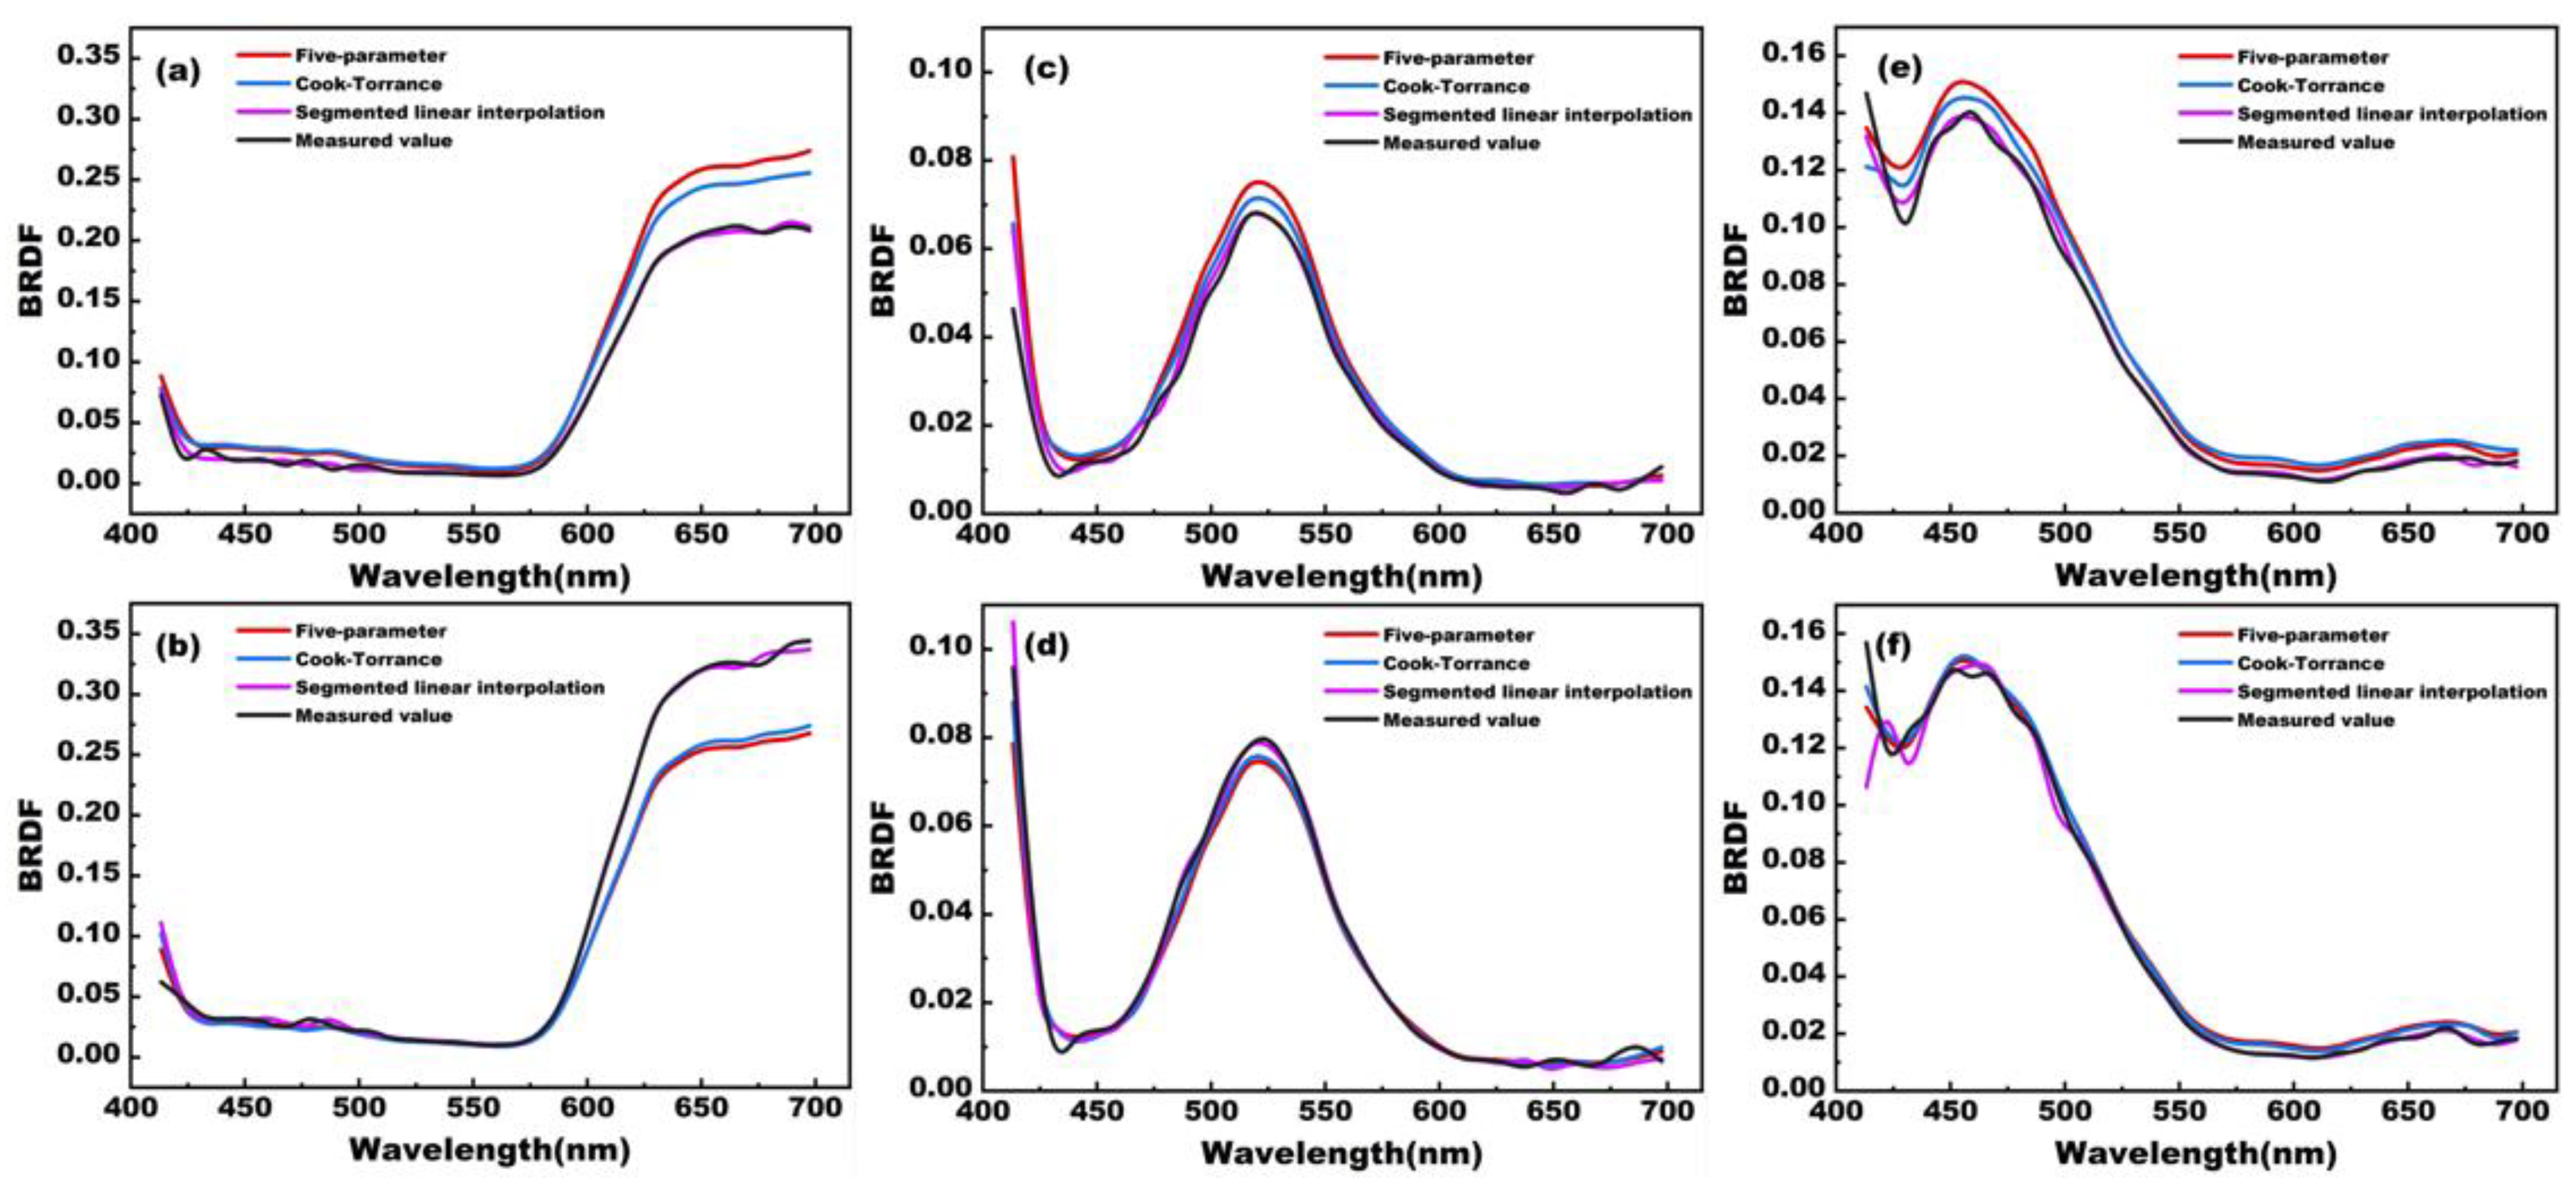
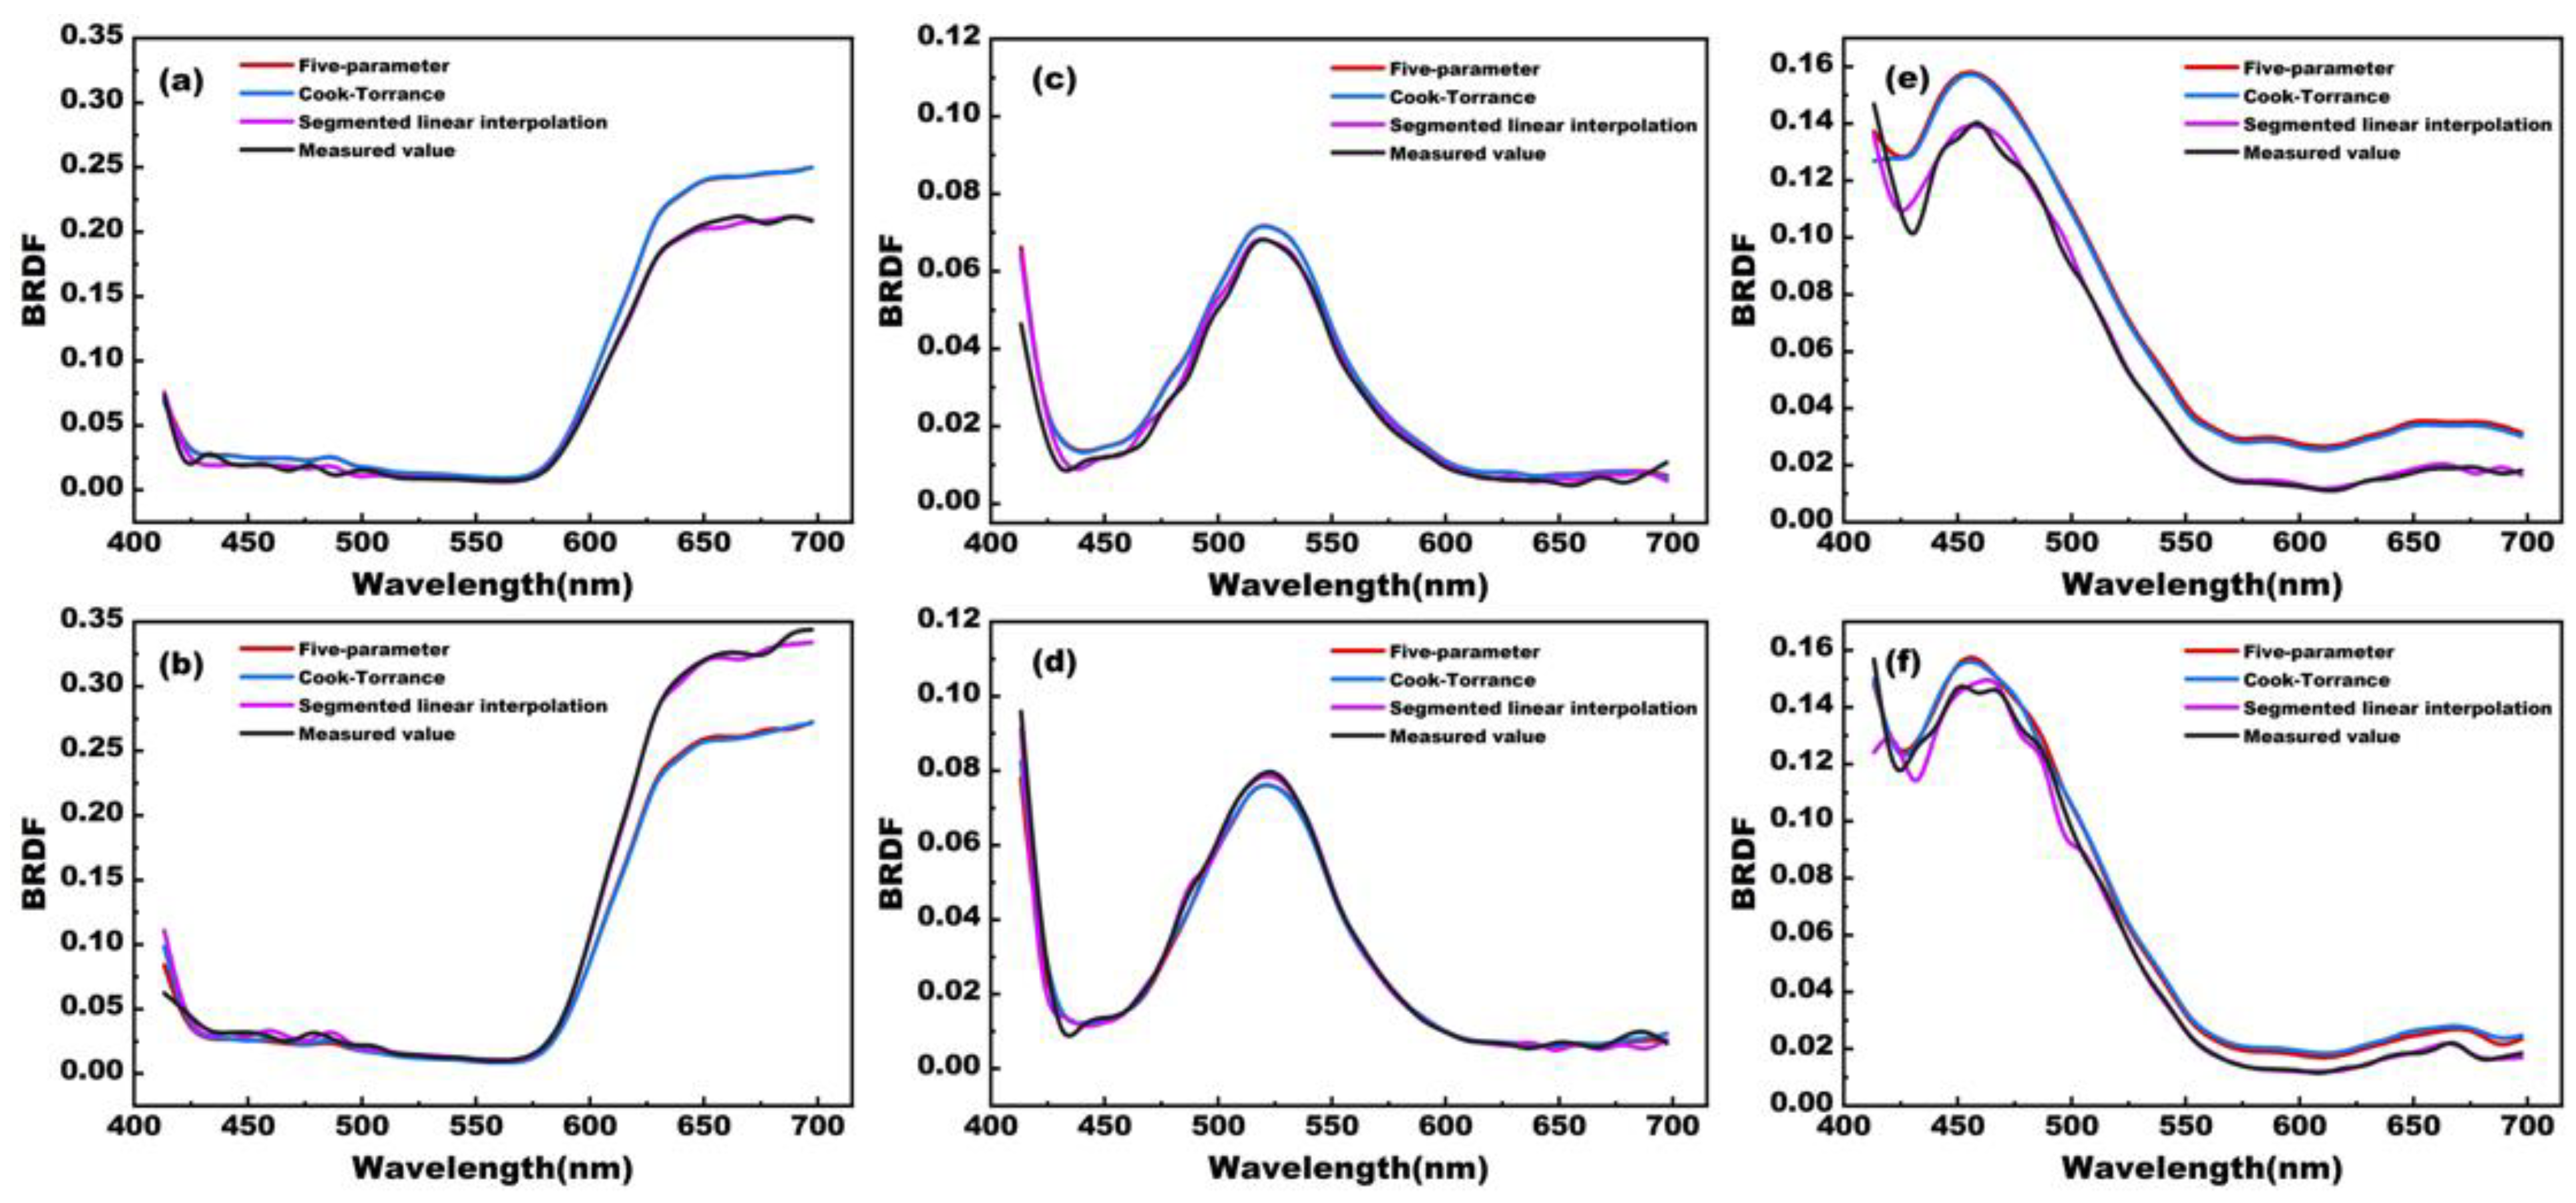
The color chip data collected at an illumination angle interval of 5° were used as modeling data and analyzed from the spectral reconstruction dimension. The five-parameter model, Cook–Torrance model, and segmented linear interpolation were used, respectively, combined with the actual measurement data for BRDF modeling, and then the BRDF values for illumination angles of 68° and 128° were predicted by the model. We randomly selected color chips 1, 26, and 31 as the research subjects. The obtained results are shown in Figure 7a–f (the actual measurement values of these two angles were not used in the modeling process; they were only used to compare with the predicted values to verify the accuracy of the model).
From the figure, we can see that the BRDF modeling prediction results of the above three models are basically the same as the actual measured BRDF curve trend, especially color chip 26 and color chip 31, for which the curve overlap between all three modeling results and the actual measured values is relatively high. The gap between the results predicted by both the five-parameter model and Cook–Torrance model and the actual measured values became larger after 600 nm for color chip No. 1. A common phenomenon can be found in these six images; the BRDF prediction result curve of segmented linear interpolation basically overlaps exactly with the actual measured BRDF curve.
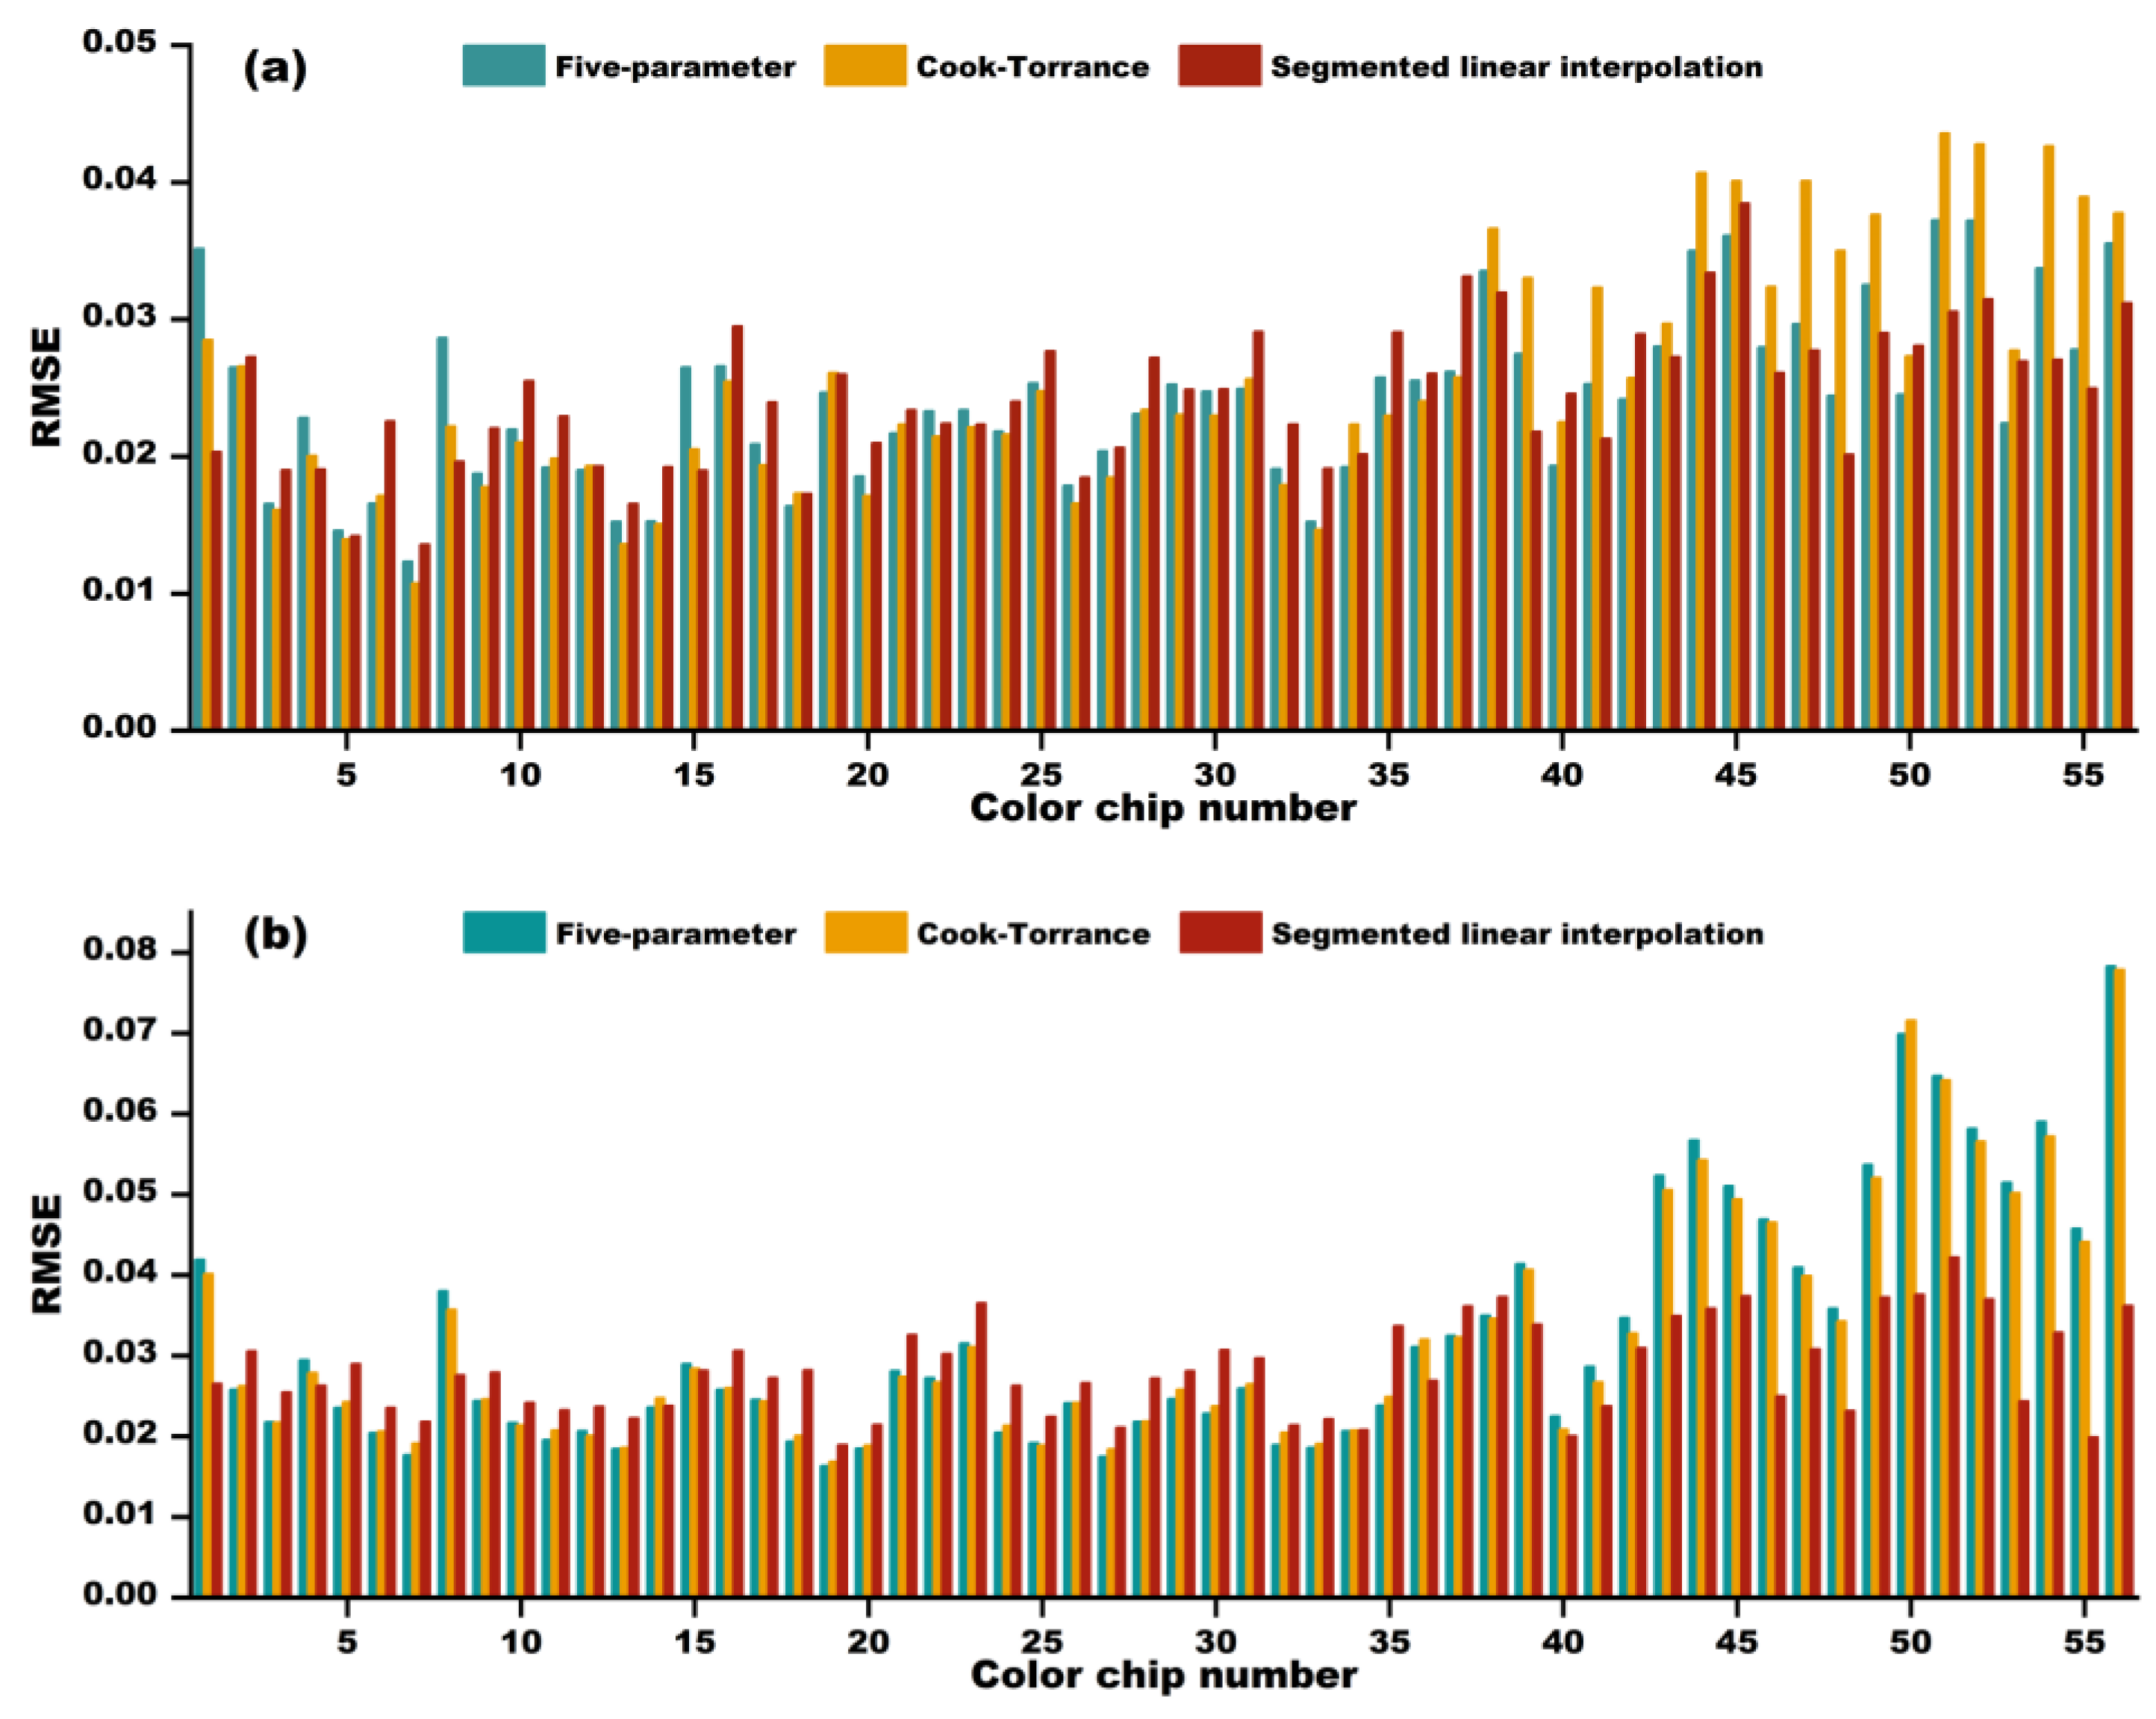
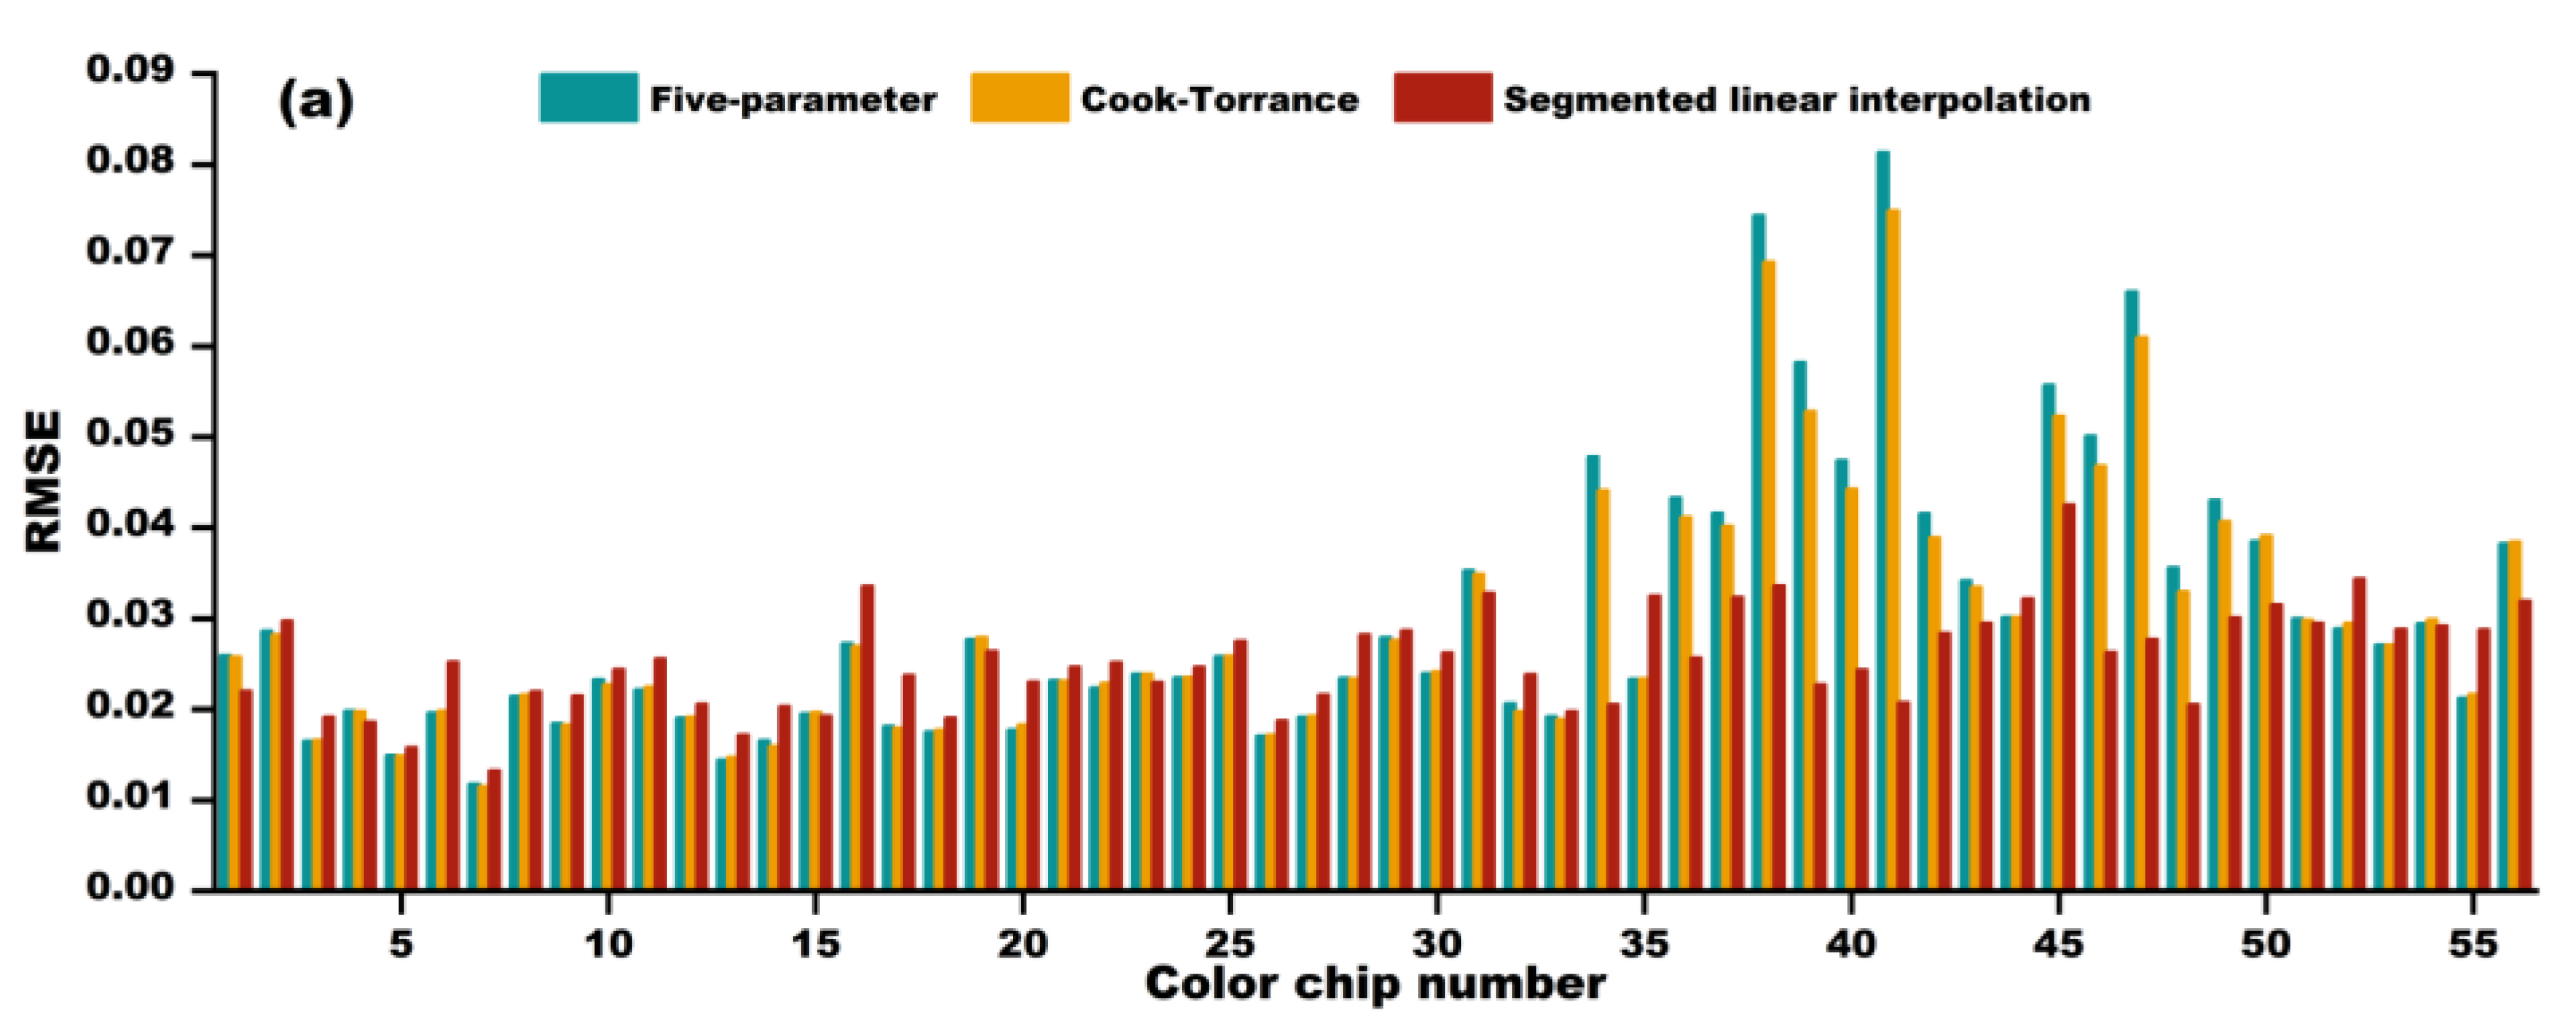
In order to quantify the prediction accuracy of the models, we calculated the RMSE of each model. For the BRDF reconstruction at the 68° and 128° illumination angles, the RMSE statistics for the 56 color chips are shown in Table 1. In order to further visualize these data and to clearly demonstrate the difference in the performance of the three models in terms of reconstruction accuracy, we plotted the bar charts shown in Figure 8, which allow us to efficiently distinguish and compare the different models in terms of reconstruction accuracy.
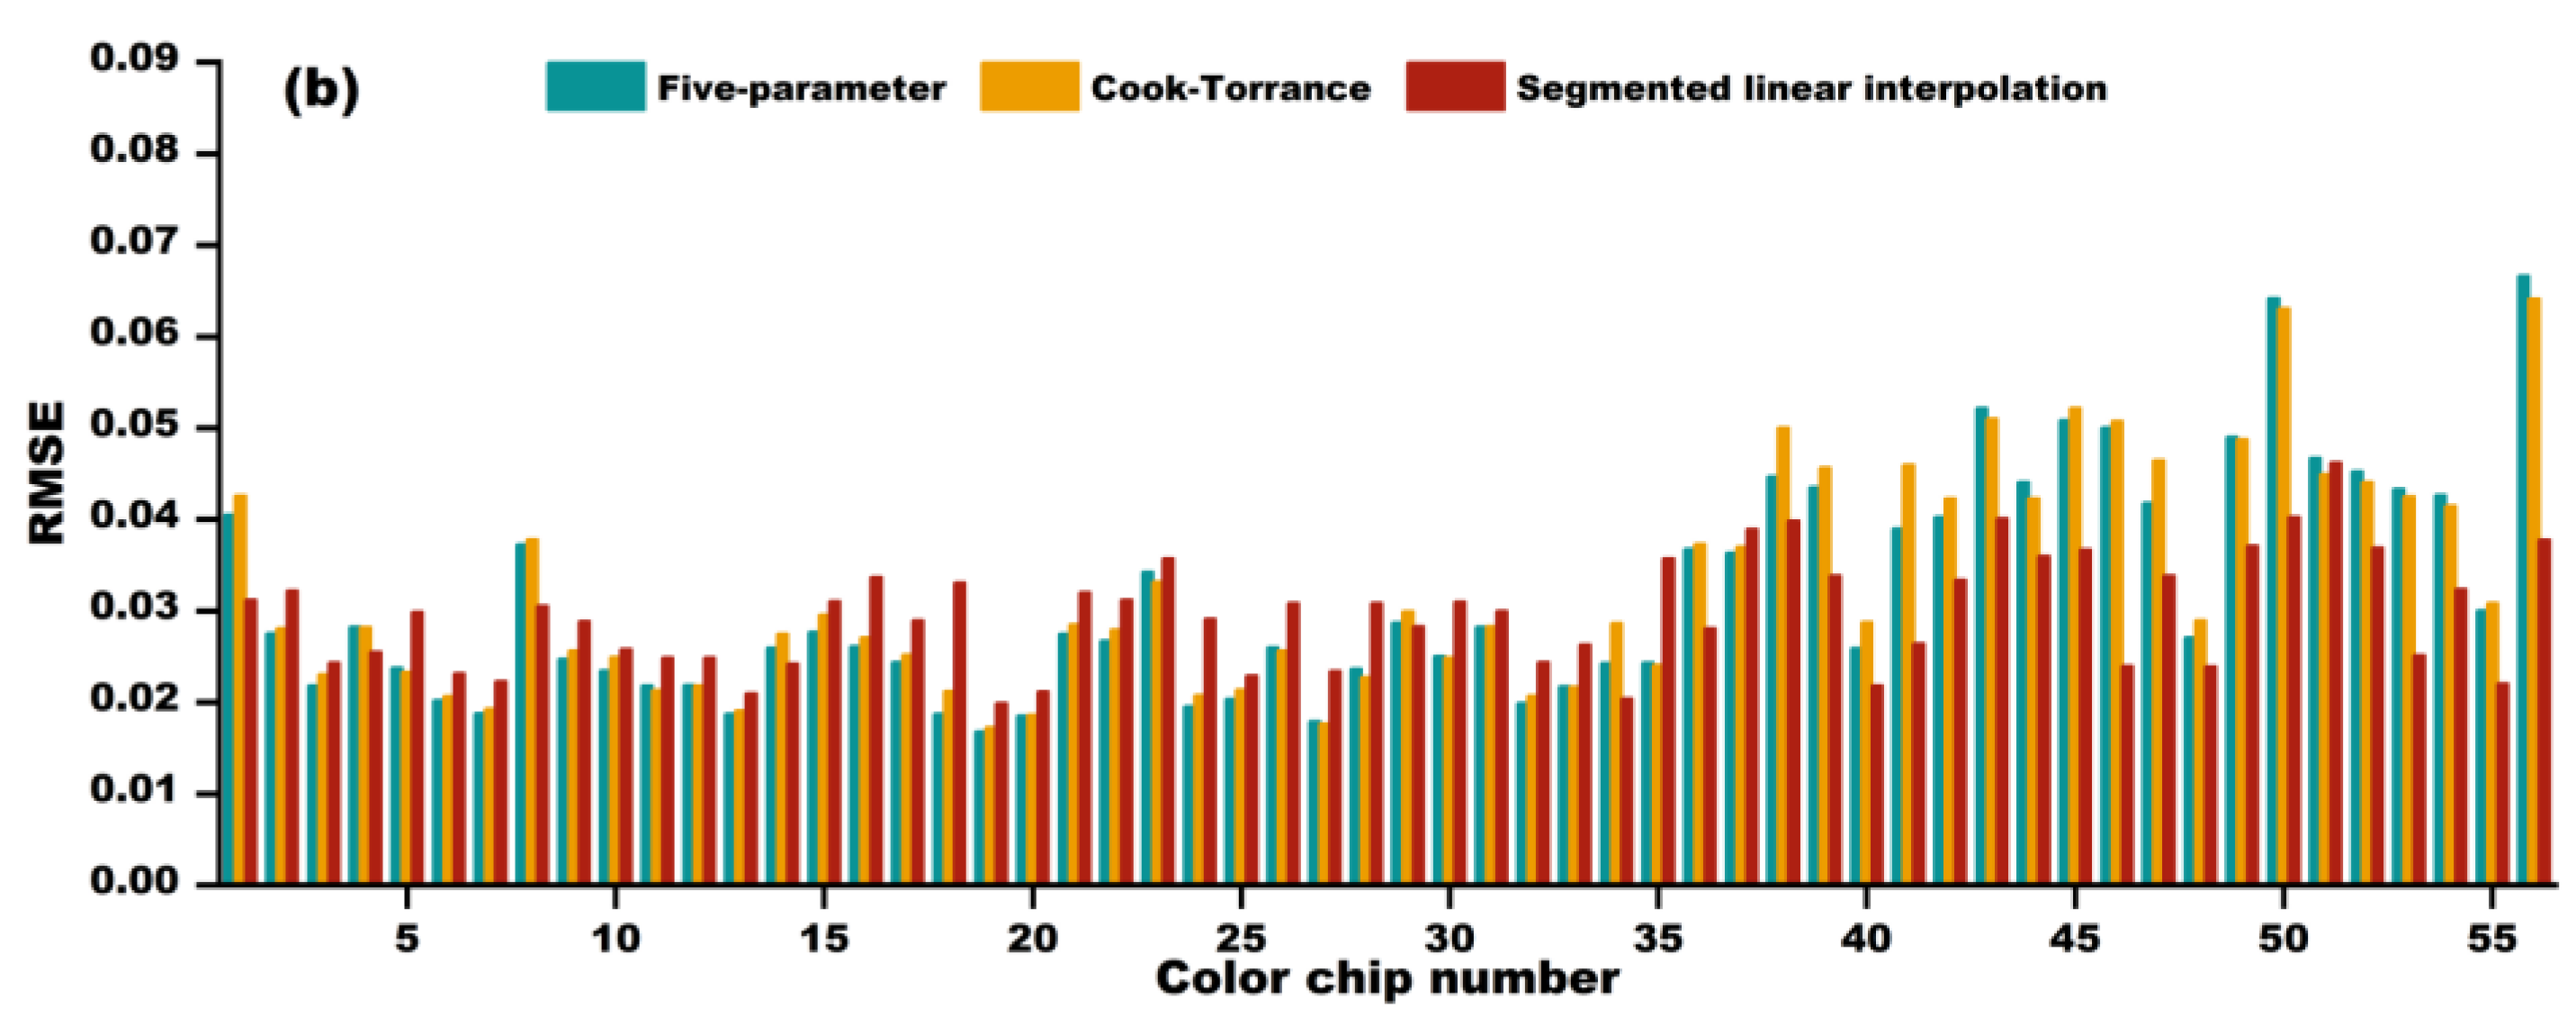
For the BRDF reconstruction at a 68° illumination angle, the average value of RMSE of all three models is less than 0.04, indicating the high reconstruction accuracy. Although the differences in the RMSEs are all small, the segmented linear interpolation model has a slight advantage in terms of the minimum RMSE value of 0.0136. For the BRDF reconstruction at a 128° illumination angle, the RMSE of all three models is less than 0.08, which indicates that the reconstruction results of all models are within acceptable limits. The average RMSE of the segmented linear interpolation model is 0.0283, which is slightly lower than that of the five-parameter model and the Cook–Torrance model, which are 0.0325 and 0.0322, respectively. Although the average RMSEs of the three models are relatively close to each other, the reconstruction error fluctuates less in the segmented linear interpolation model, which shows a stabler reconstruction capability.

3.2.2. Analysis of Color Reconstruction Results with an Illumination Interval of 5°

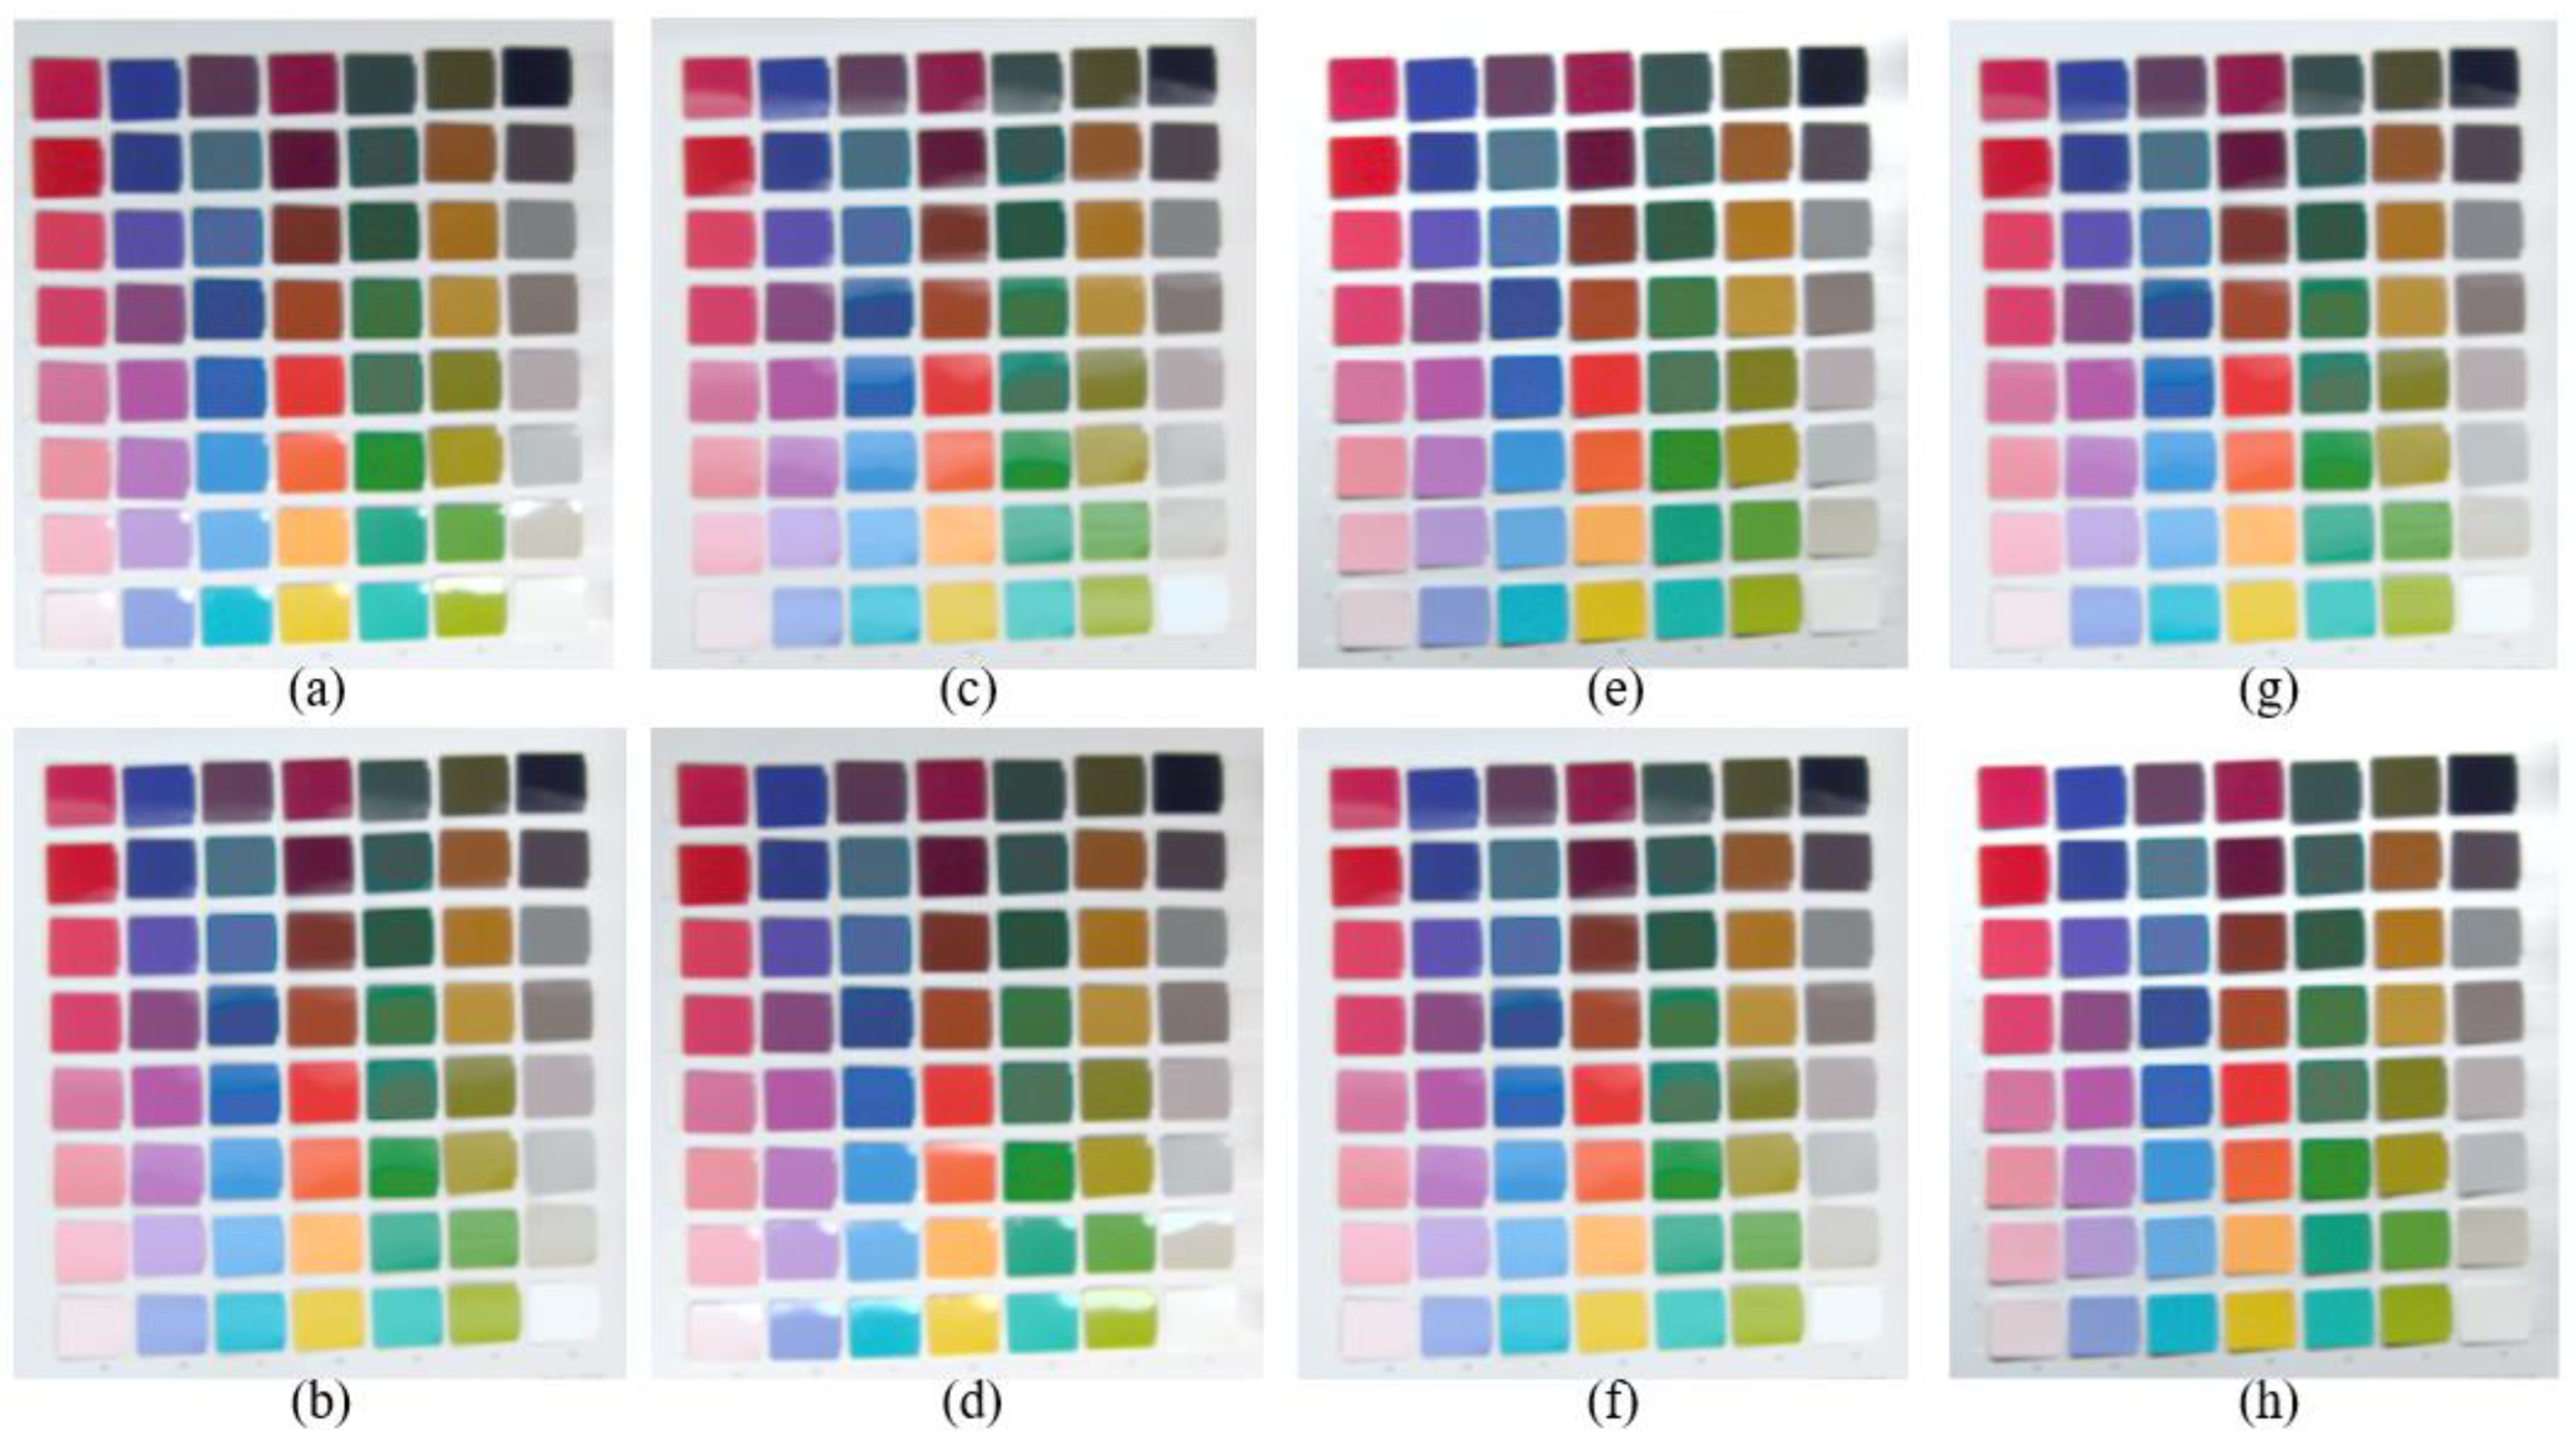
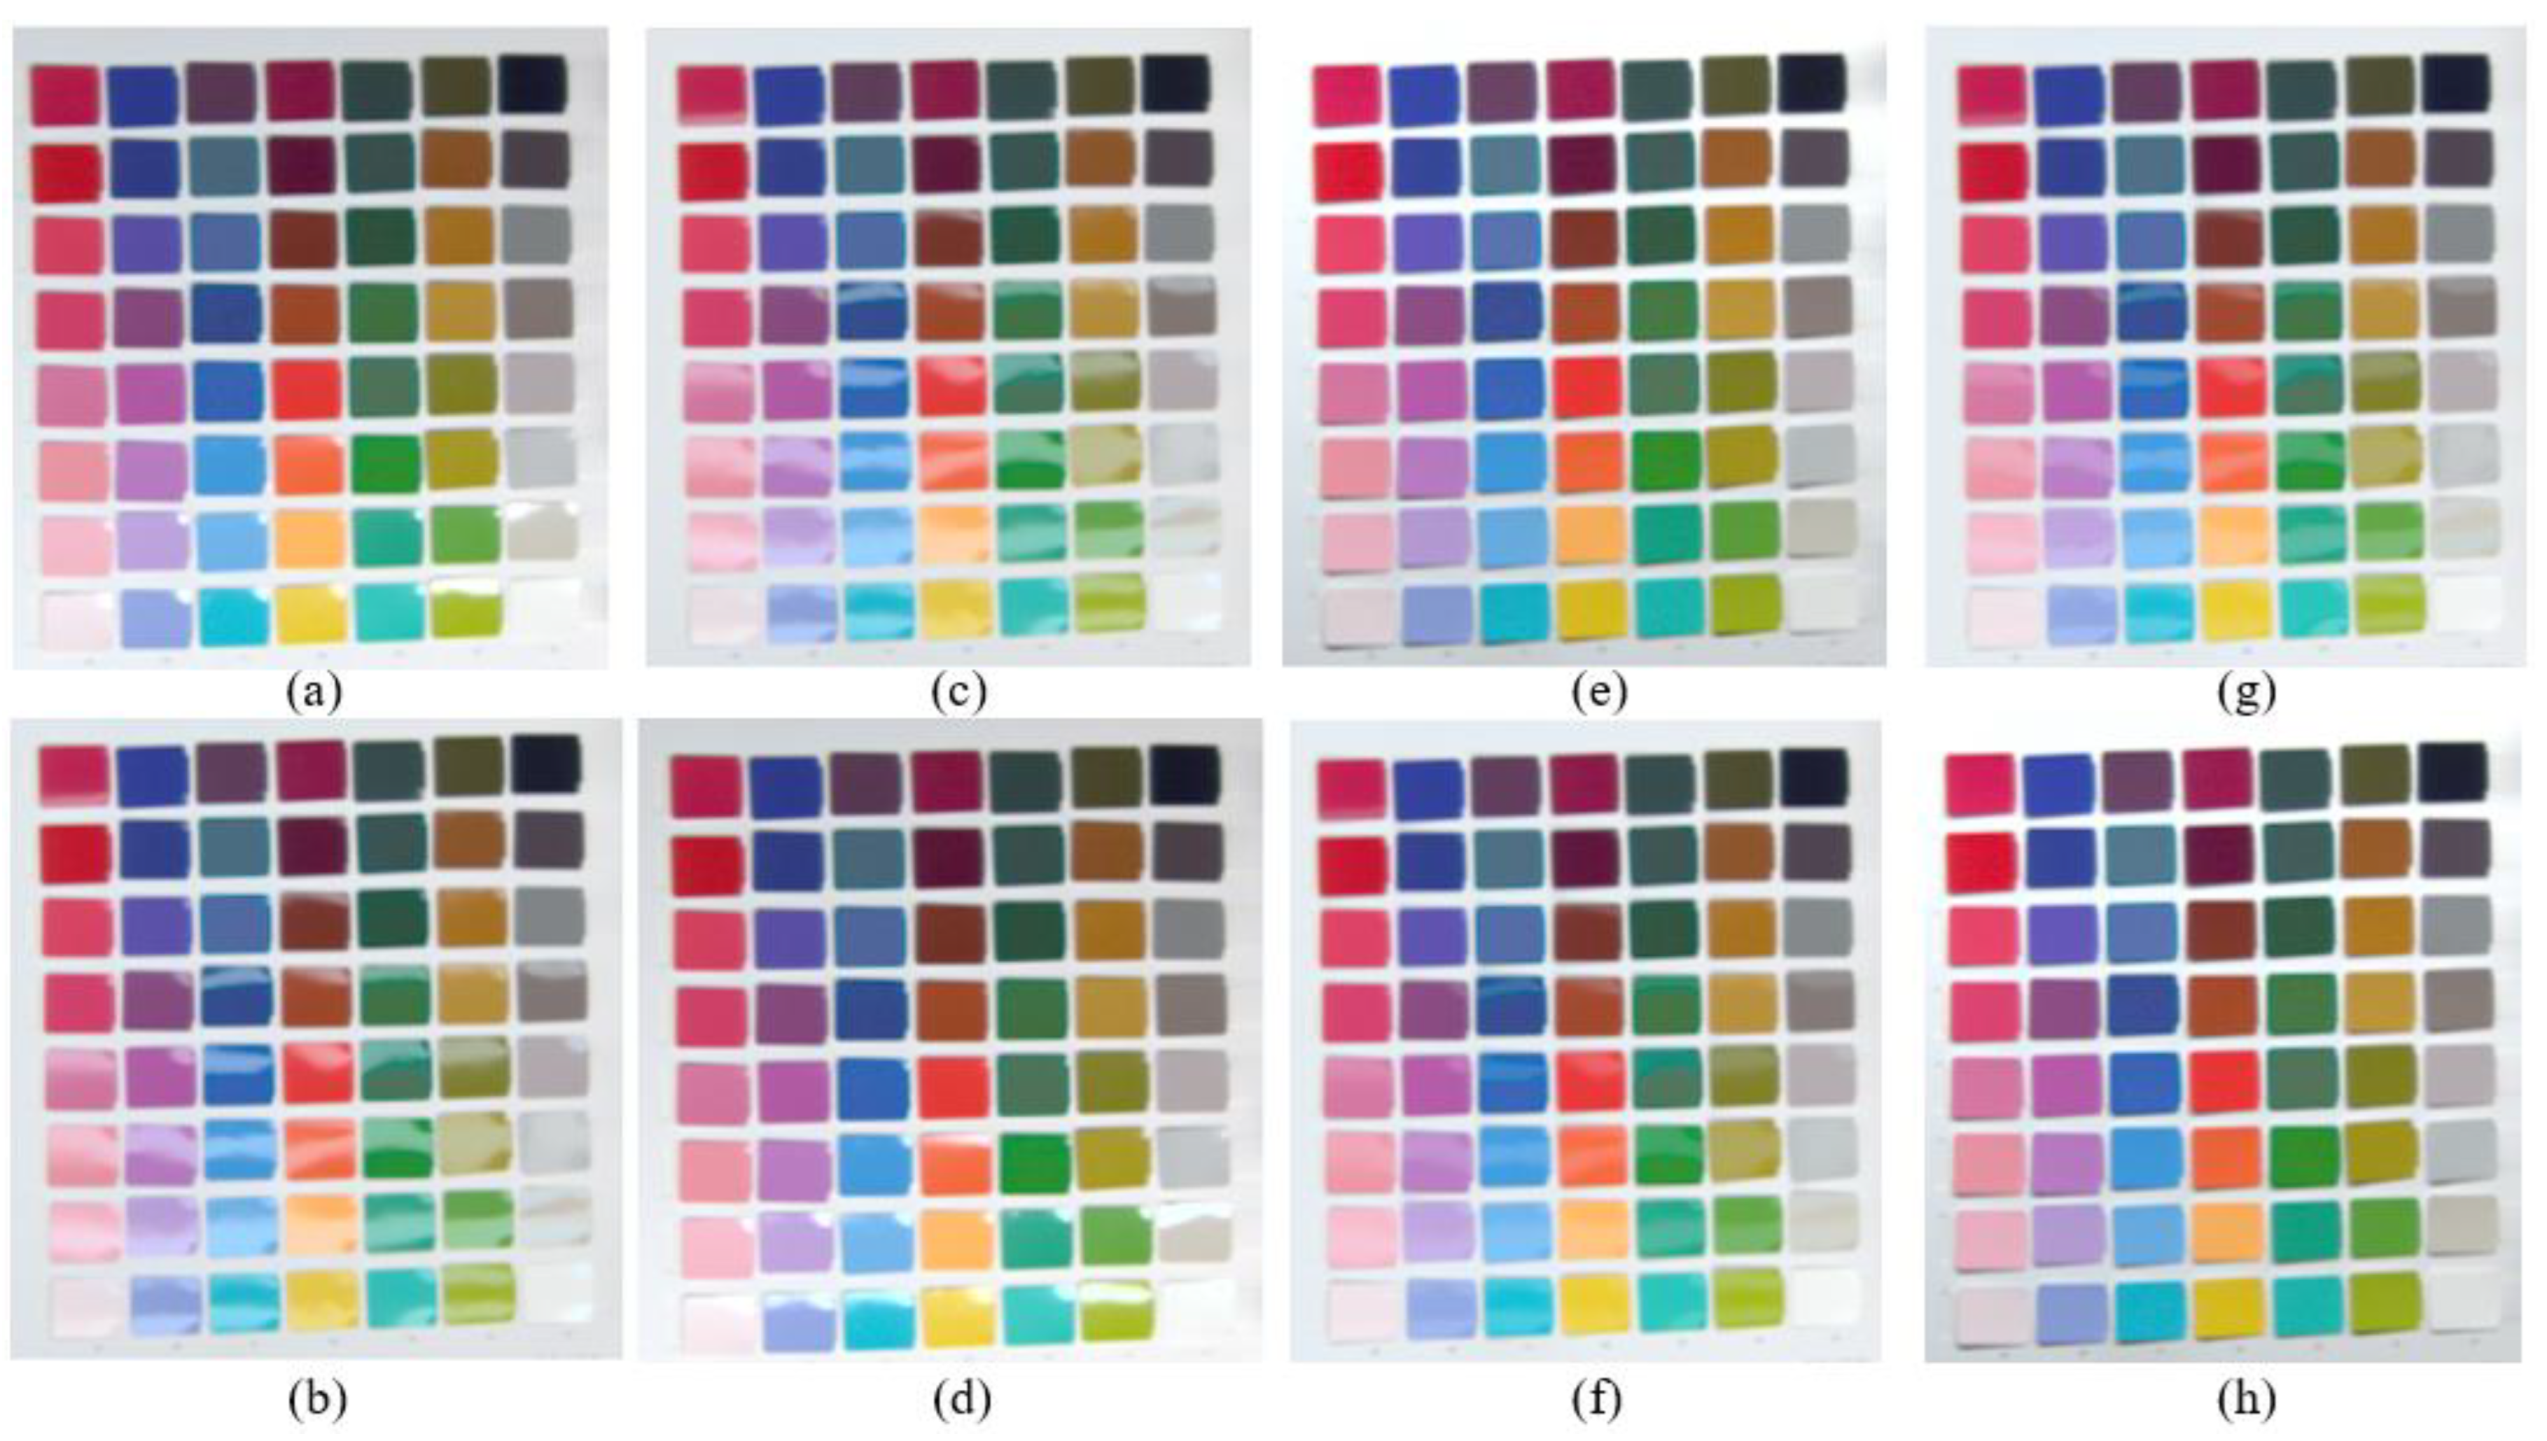
After obtaining the reconstructed BRDF values, the CIE 1931 color-matching function was first used to convert the BRDF to the device-independent CIE XYZ color space, obtaining the color stimulus values X, Y, and Z. These X, Y, and Z values were then converted to the sRGB color space. Through this process, a color image was generated with an illumination angle interval of 10°, as shown in Figure 9. Figure 9 shows the color images reconstructed by three models under unknown illumination angles of 68° and 128°. From the overall effect, the images reconstructed by the three models are closer in color to the directly measured images, indicating that they have a certain effect on color reproduction. However, in terms of detail processing, each model shows significant differences.
At the illumination angle of 68°, there is a slight specular reflection in color chips 38, 39, and 43 to 56 in the image. Although the five-parameter model and Cook–Torrance model can restore the overall color, there are certain limitations in reconstructing the specular reflection details. On the contrary, the segmented linear interpolation model can more accurately reproduce these specular reflection effects, indicating its advantage in handling highly reflective surfaces. This feature is particularly important for complex textured surfaces, such as some glossy artifacts, as it can more accurately reproduce the real visual effects.
At the illumination angle of 128°, a slight shadow appeared below the color chip. In the reconstruction results of the five-parameter model and Cook–Torrance model, the shadow details are almost missing, which may lead to color reproduction bias in scenes with rich shadows. In contrast, the segmented linear interpolation model can accurately capture and restore shadow details, thereby improving the visual realism of reconstructed images.
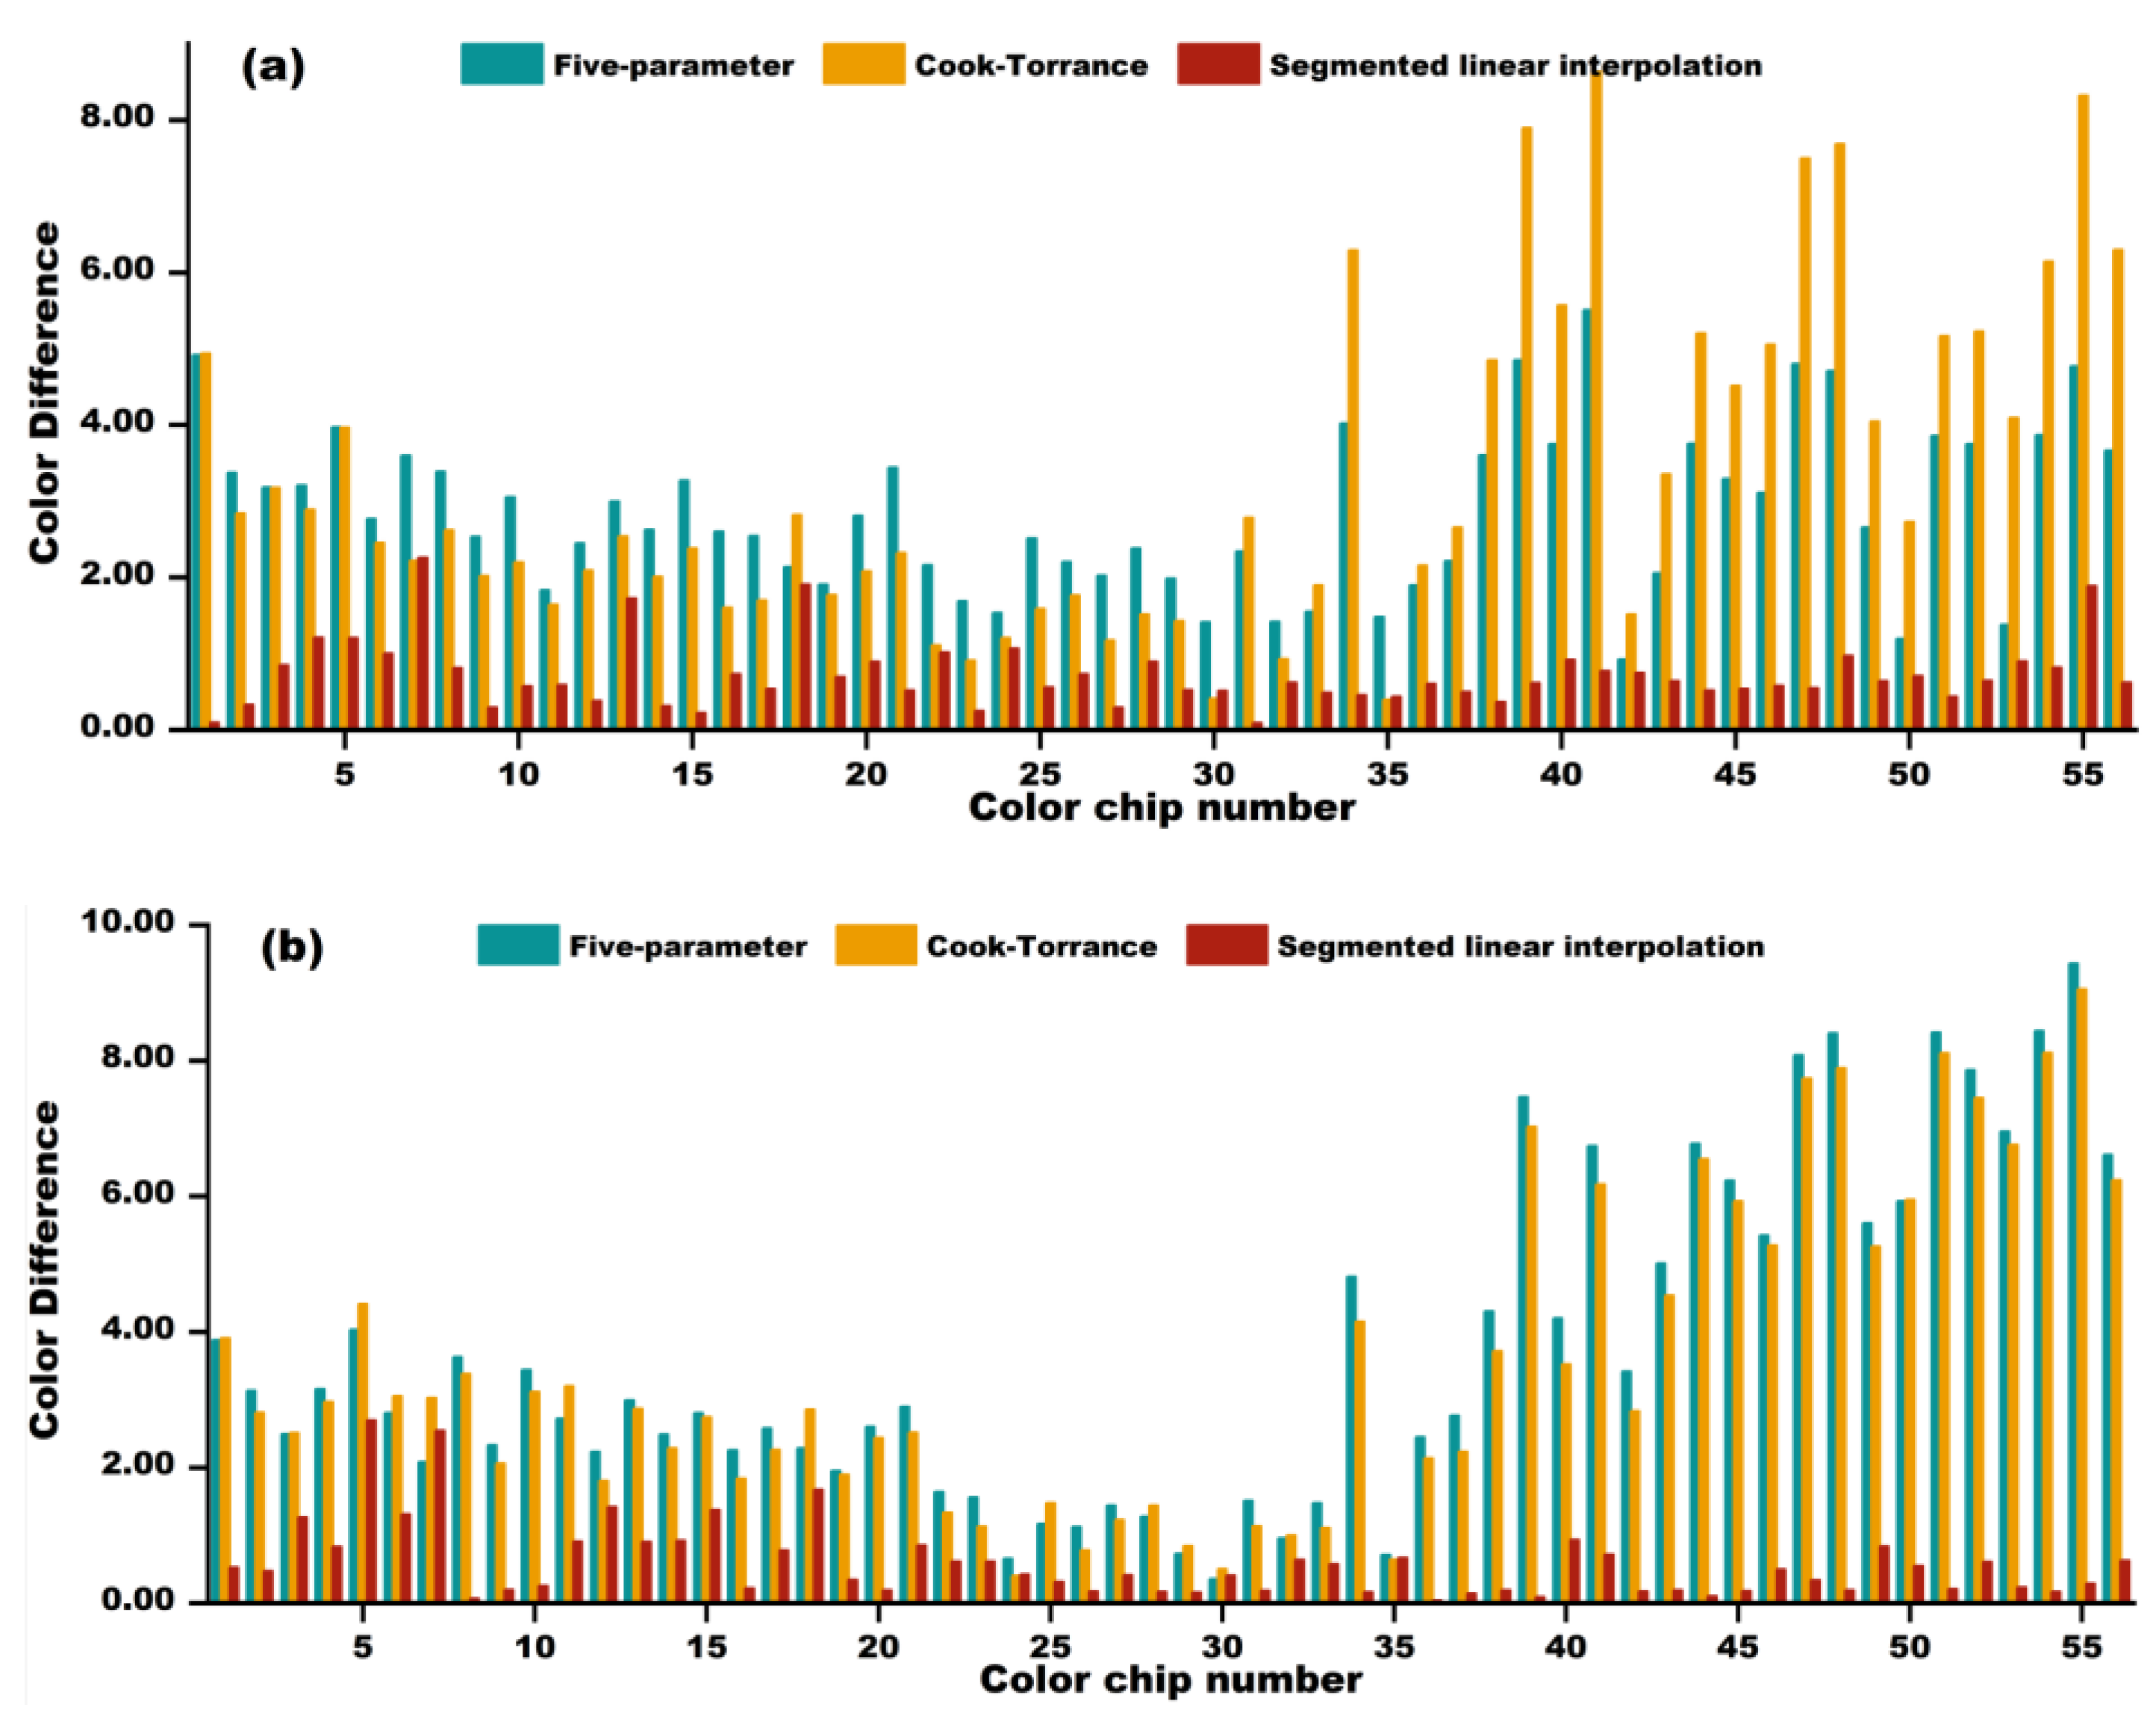
To further quantify the accuracy of the model in color reconstruction, we calculated the CIEDE2000 color differences of 56 color chips. For color reconstruction at illumination angles of 68° and 128°, the color difference statistics for color chips are shown in Table 2. In order to further visualize these data and clearly demonstrate the performance differences of the three models in terms of color reconstruction accuracy, we have drawn a bar chart as shown in Figure 10, which can effectively distinguish and compare the reconstruction accuracy of different models.
From Table 2 and Figure 10, it can be seen that, for the color reconstruction at 68°, the segmented linear interpolation model performs the best, with a minimum color difference of 0.09, a maximum value of 2.26, and an average color difference of only 0.72. In contrast, the five-parameter model and the Cook–Torrance model has a wider range of color differences. Although the RMSE of the three models in spectral reconstruction is similar, the segmented linear interpolation model shows significant advantages in color difference indicators, indicating that this model can better simulate the color difference perceived by the human eye during the reconstruction process. For color reconstruction at an illumination angle of 128°, the segmented linear interpolation model once again demonstrated its advantages, with a maximum color difference of 2.70, much lower than the 9.43 of the five-parameter model and the 9.06 of the Cook–Torrance model. This means that, even under larger illumination angles, the segmented linear interpolation model can still better simulate color perception differences.
Putting Figure 7 and Figure 9 together for analysis, it can be seen that the five-parameter model, Cook–Torrance model, and segmented linear interpolation can all effectively reconstruct the image under the unknown illumination angle, the error reconstructed with segmented linear reconstruction is smaller, and the reconstructed image is more similar to the measured image.
When using the color chip data collected at an illumination angle interval of 5° as the modeling data, the accuracy of modeling using the five-parameter model, Cook–Torrance model, and segmented linear interpolation was very high from the modeling results for unknown light angles of 68° and 128°, with segmented linear interpolation being the most effective.

3.3. Modeling Results and Analysis of Color Chip Data Based on 10° Illumination Interval Sampling

3.3.1. Analysis of Spectral Reconstruction Results with an Illumination Interval of 10°

The amount of data collection should be minimized in practical applications to achieve color reproduction in a convenient, and easy-to-use manner. Figure 11a–f show the results of BRDF modeling at an illumination interval of 10°. Overall, the modeling results are consistent with the actual measured BRDF curves, particularly the segmented linear interpolation method, where the BRDF curves for each color chip almost perfectly match the measured values. However, compared to the 5° illumination interval, the 10° interval slightly lacks precision in certain high-reflection and low-reflection bands.
We calculated the RMSE of the reconstructed BRDF for each model and plotted the bar charts in Figure 12, and Table 3 shows the RMSE statistics. For the reconstruction at an illumination angle of 68°, the RMSE averages of the three models show that the BRDF reconstruction results of the models are all reasonable, with the segmented linear interpolation method having a slightly higher reconstruction accuracy. For the reconstruction at an illumination angle of 128°, the modeling results of the five-parameter model show that 91% of the color chips have an RMSE ≤ 0.05, while the Cook–Torrance model shows 89% of the color chips have an RMS ≤ 0.05. The RMSE of the segmented linear interpolation is less than 0.05, and the RMS of all segmented linear interpolation is less than 0.05.

3.3.2. Analysis of Color Reconstruction Results with an Illumination Interval of 10°

Figure 13 shows the RGB images reconstructed using three models at unknown illumination angles of 68° and 128°. From the figure, it can be seen that the images reconstructed by the five-parameter model and Cook–Torrance model have greater differences from the measured images. Segmented linear interpolation modeling accurately reconstructed the highlight and shadow details in the image, which are more similar to the measured images.
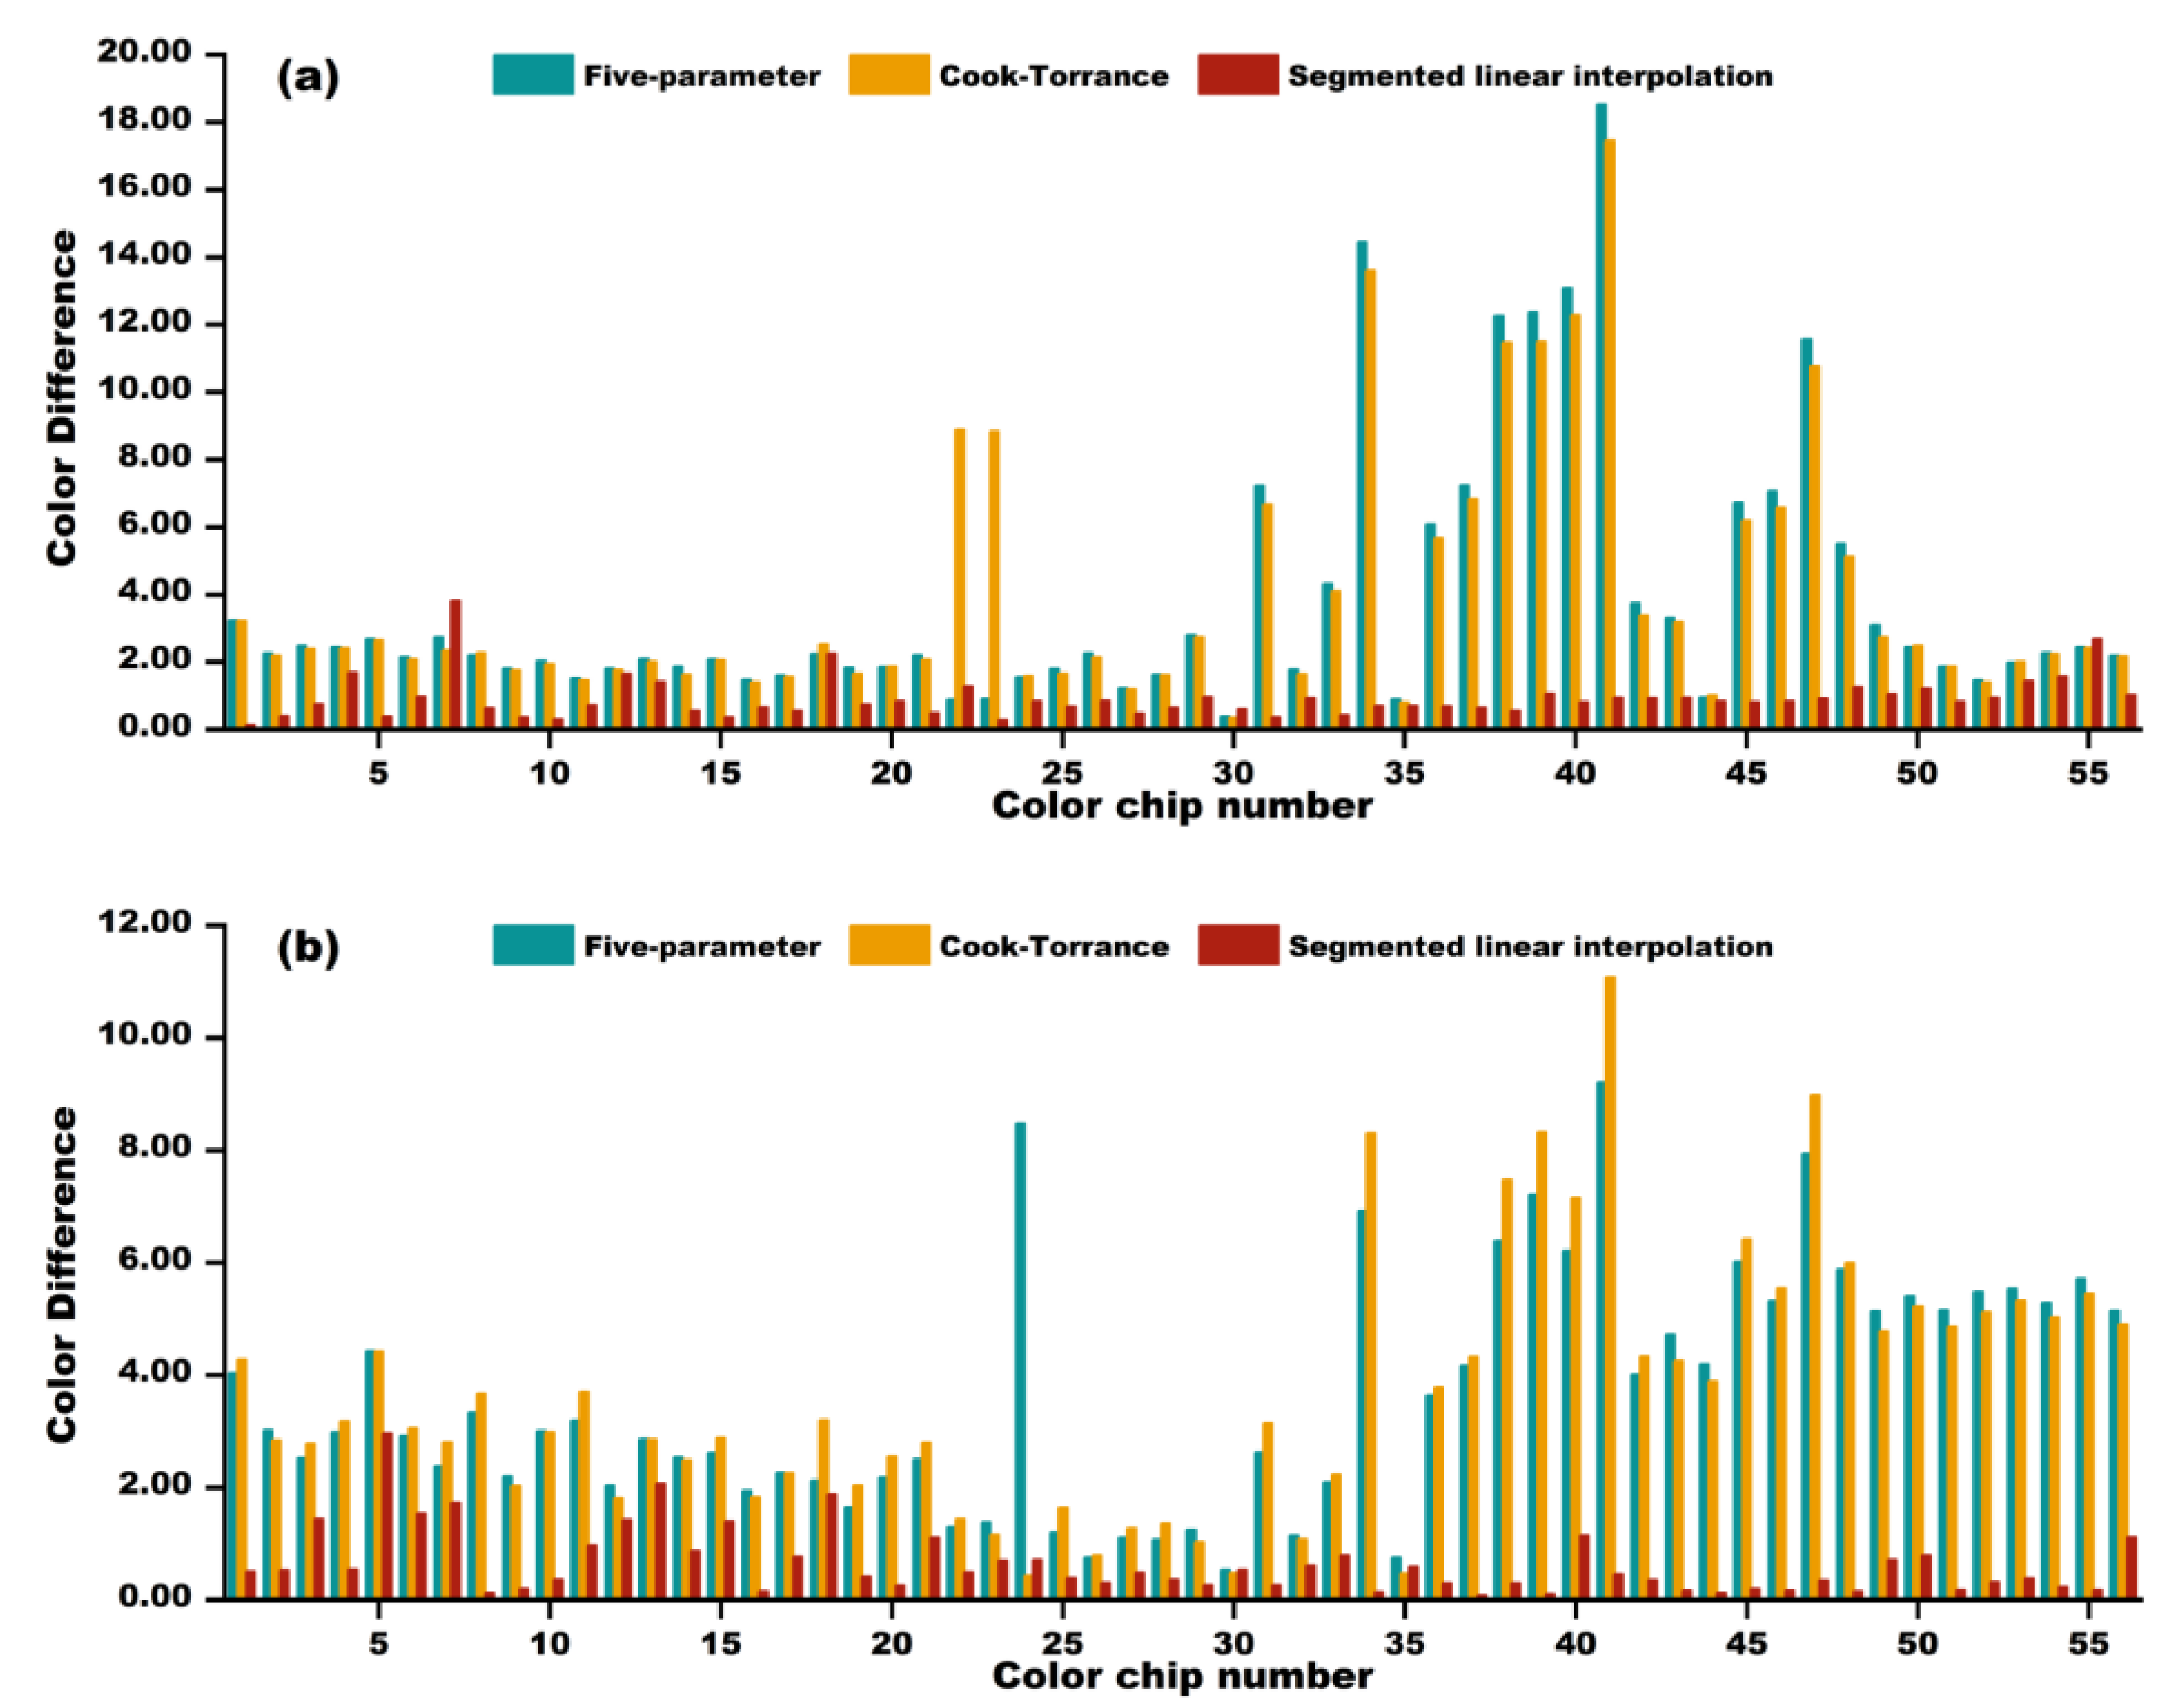
Table 4 and Figure 14 show the CIEDE2000 color differences at illumination angle intervals of 10°. For the reconstruction of the 68° illumination angle, the modeling results of the five-parameter model show that 70% of the color chips have a color difference of ≤3; 68% of the color chips in the Cook–Torrance model have a color difference of ≤3; 98% of color chips with segmented linear interpolation have a color difference ≤3; and the average color difference is only 0.92. This indicates that the segmented linear interpolation model has a higher color reproduction accuracy and stabler performance in practical applications. For the 128° reconstruction, the modeling results of the five-parameter model show that 52% of the color chips have a color difference of ≤3; 46% of the color chips in the Cook–Torrance model have a color difference of ≤3; segmented linear interpolation has an average color difference of only 0.64 for all color chips with a color difference ≤3, which is significantly lower than the other two models, indicating that it performs the best in color reconstruction.

3.3.3. SSIM Analysis of Color Chips

SSIM can comprehensively evaluate the structural similarity and visual quality of images. Therefore, we further use SSIM to evaluate the performance of different models in image reconstruction, Table 5 shows the SSIM accuracy evaluation results of different models in the reconstruction of the entire image. For the 68° reconstruction, the accuracy of SSIM with 5° illumination angle intervals is higher, probably because the reflective properties of the object surface are stabler at smaller angles (e.g., 68°). The 5° illumination angle intervals are able to capture the subtle light variations, which helps to improve the reconstruction accuracy. Especially for the five-parameter model and Cook–Torrance model, which are more dependent on the illumination angle, a smaller interval can provide richer light details, so these two models perform more accurately in the 68° reconstruction. For the reconstruction of the 128° angle, the SSIM accuracy is better with a 10° illumination interval, which may be due to the more pronounced shadow changes on the color chip surface at larger angles (e.g., 128°), larger changes in illumination angles, and more complex reflection characteristics. At this point, the sampling density provided by the 10° lighting interval is sufficient to capture the main reflective characteristics, while avoiding the redundancy of information that would result from too frequent data collection. At such large angles, the segmented linear interpolation model is particularly advantageous because it can effectively reproduce the changes in the shadow region by sampling at larger intervals, thus achieving a higher reconstruction accuracy at 128°.
From the perspectives of spectral reconstruction and chromaticity reconstruction, although the five-parameter model and Cook–Torrance model perform better in spectral reconstruction, their performance in chromaticity reconstruction is relatively poor. In particular, the Cook–Torrance model even reaches a color difference of 11.07 on some color chips, indicating that the model may not be stable enough in certain specific situations. Overall, the segmented linear interpolation model performs well in chromaticity reconstruction while maintaining the accuracy of spectral reconstruction, making it particularly suitable for applications that require a high color accuracy.
Unlike color chips with uniform colors, artifacts with complex textures may exhibit significant changes in BRDF characteristics from different perspectives, and surface textures and reflection characteristics may be more prone to artifacts or color differences. Therefore, we will further test artifacts with surfaces with more complex textures in future research and evaluate the impact of observation angles on BRDF reconstruction results to further improve the applicability and accuracy of the model.

3.4. Chinese Painting Modeling Results and Analysis

Analysis of Modeling Results

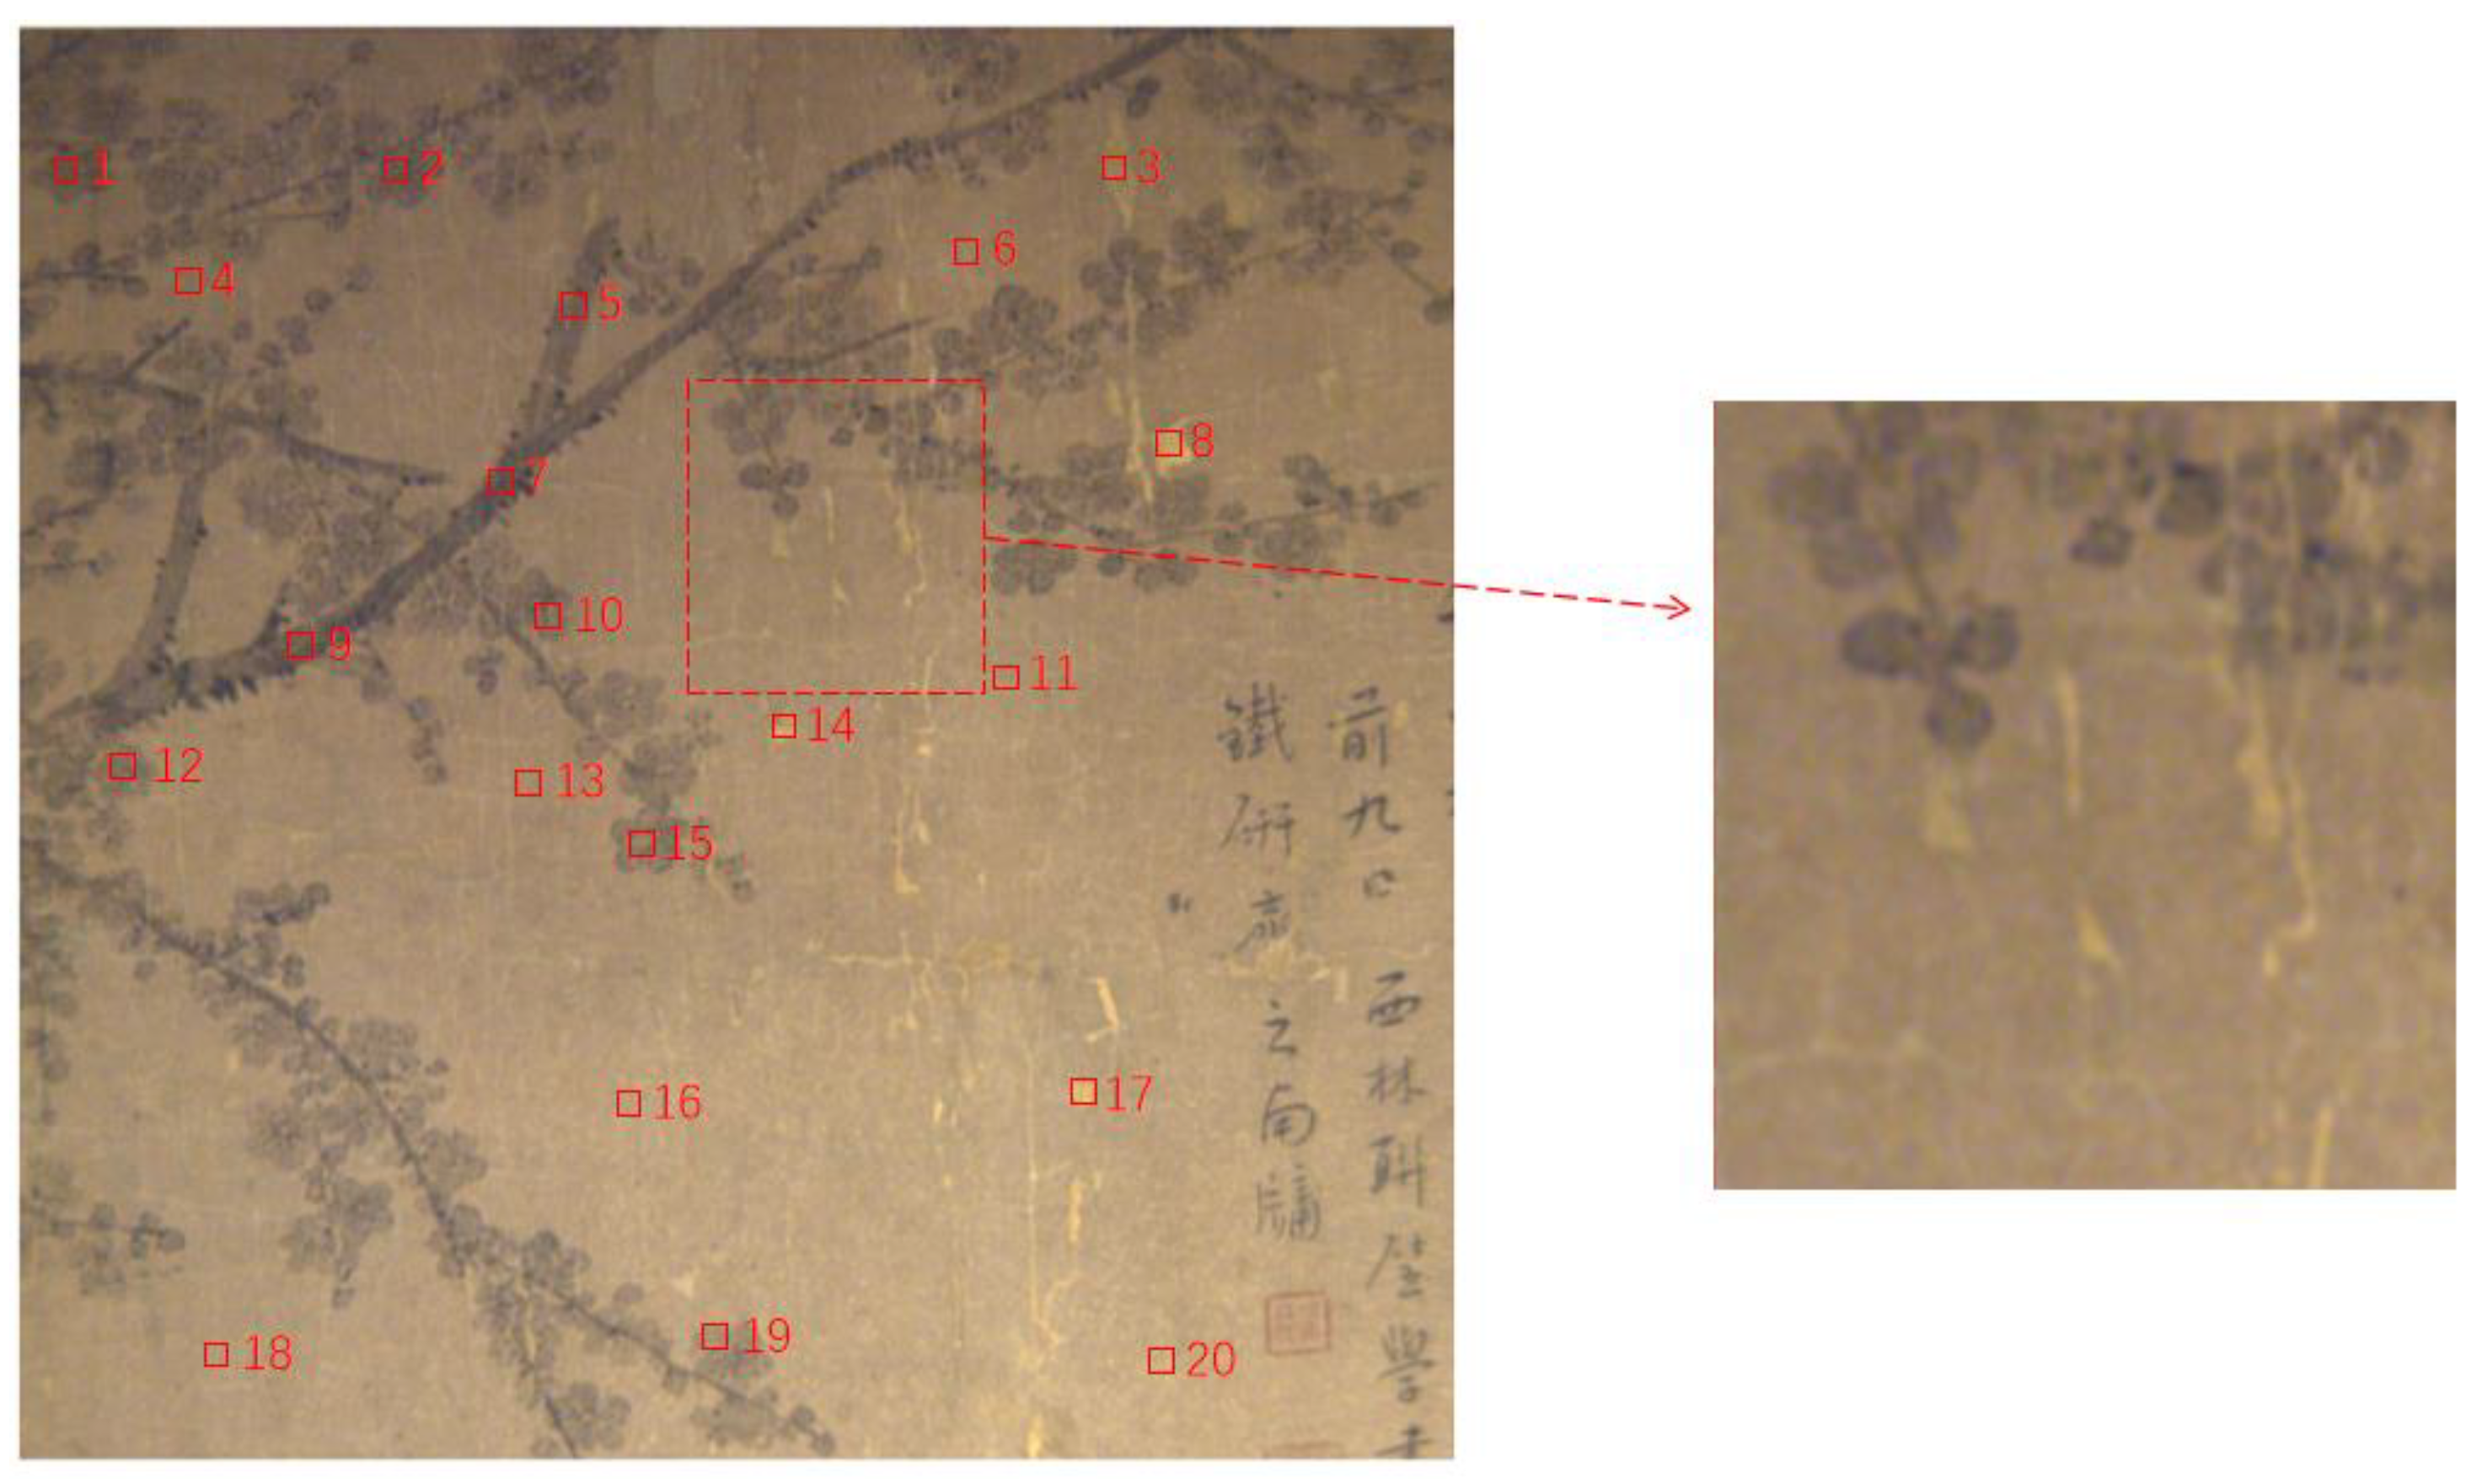
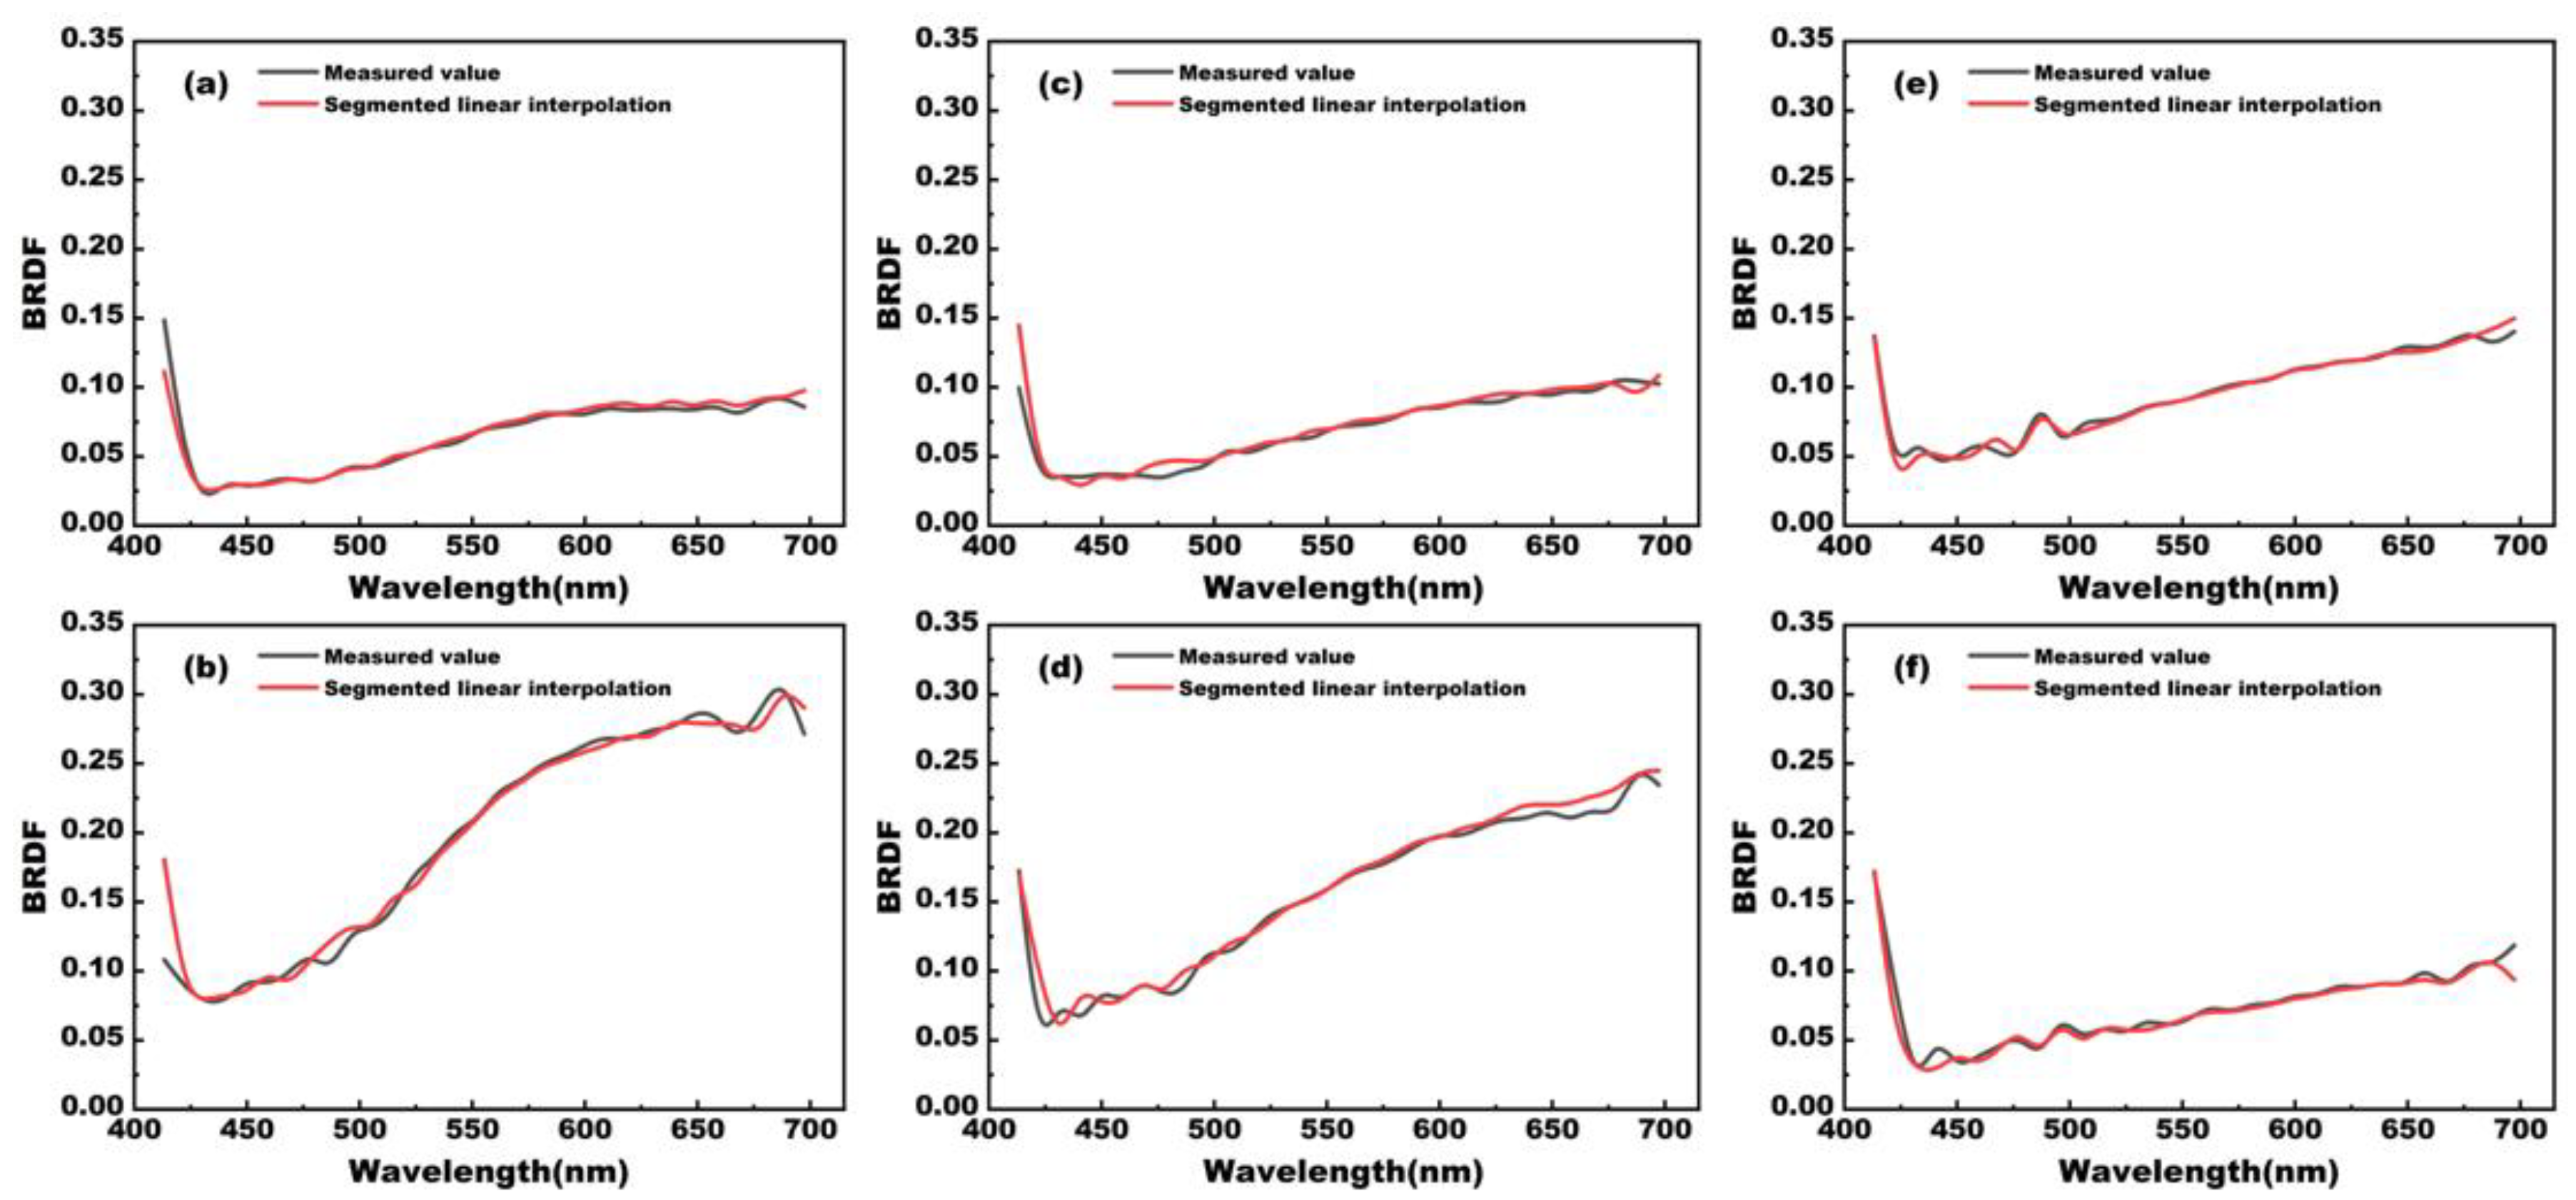
From the model reconstruction results of the color chip, the accuracy of reconstruction using segmented linear interpolation is higher regardless of whether the illumination angle interval is 5° or 10° at the time of data acquisition, so segmented linear interpolation is used for Chinese painting reconstruction. The BRDF values at 65° and 125° were reconstructed by using the Chinese painting data collected at the illumination angle interval of 10° as the modeling data, and 20 color blocks were selected as the reference color blocks from the figure, as shown in Figure 15; the positional information of the 20 color blocks is marked in the Figure 15, and the numbers in the figure are used to label these 20 color blocks for subsequent analysis. The BRDF modeling results of block 4, block 8, and block 19 were randomly selected from these 20 blocks. Figure 16a–f show the modeling results of these three blocks. It can be seen from the figure that the modeling results and the actual measured BRDF curves all overlap relatively well, with only slightly larger differences at the beginning and end of the curves in Figure 16b,d,f. The results show that the accurate prediction of the BRDF of the state painting can be achieved from the spectral reconstruction point of view using segmented linear interpolation at 10° intervals of the illumination angle.
Using segmented linear interpolation for the BRDF reconstruction of Chinese painting, Table 6 and Figure 17 show the accuracy evaluation results of 20 selected reference color blocks after spectral reconstruction. For the spectral reconstruction at 65°, the RMSE of all reference color blocks is less than 0.06. For the spectral reconstruction at 125°, the RMSE of all 20 color blocks is less than 0.08. The results indicate that the reconstructed model performs consistently well on different color blocks, with a relatively small range of color difference fluctuations, and is able to consistently provide highly accurate spectral reconstruction.
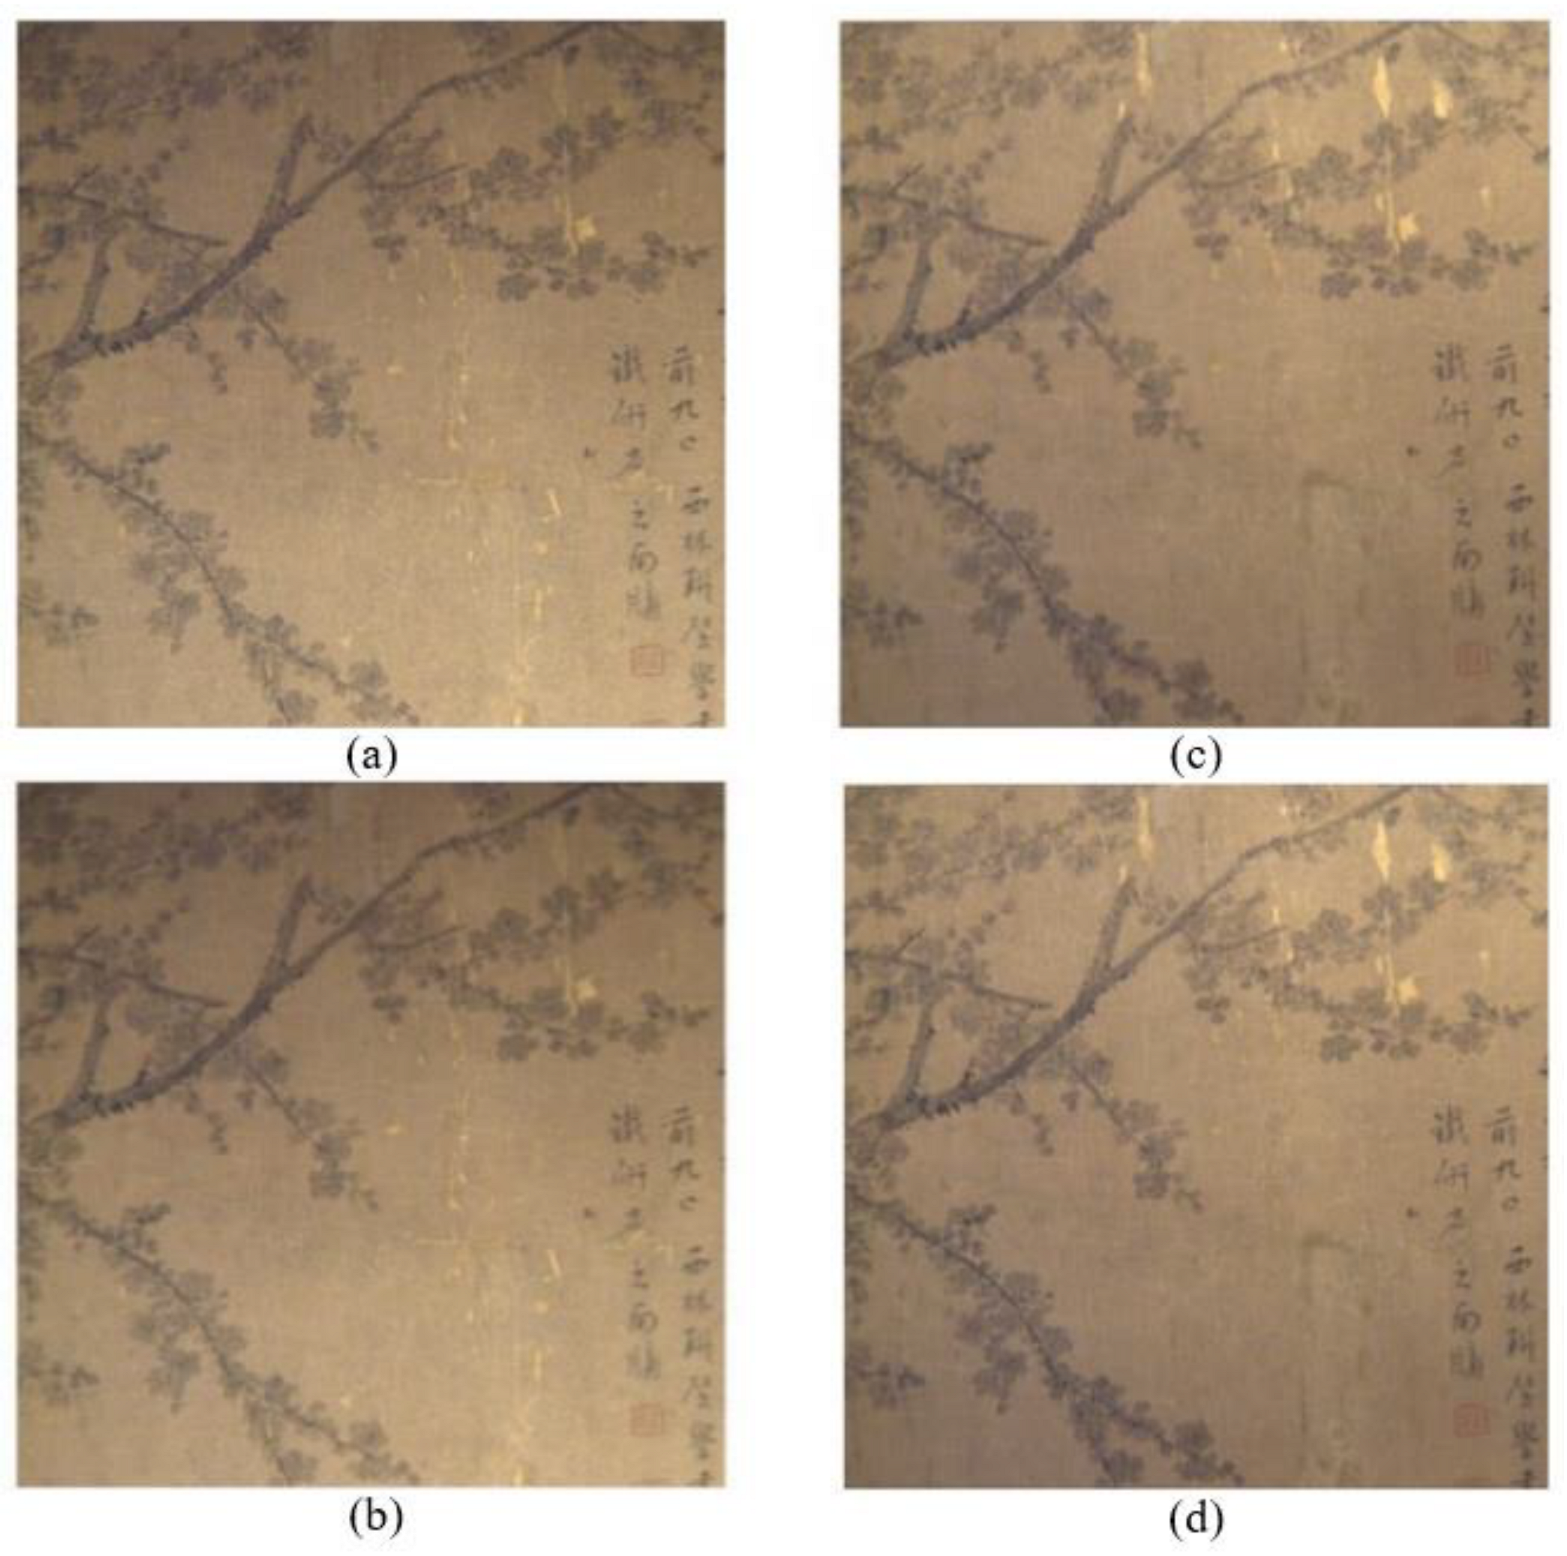
Figure 18 shows the reconstructed images of the Chinese paintings at unknown illumination angles of 65° and 125° using segmented linear interpolation. From the figure, it can be visualized that the segmented linear interpolation modeling accurately reconstructs the details of the highlight changes in the figure with a high similarity to the measured images, and there is almost no difference through the naked eye viewing. The results show that the BRDF modeling using segmented linear interpolation can achieve a consistent color transfer and color true reproduction of the Chinese painting from the color reconstruction point of view.
Table 7 and Figure 19 show the accuracy evaluation results of the 20 selected reference color blocks after color reconstruction. For color reconstruction at 65°, 95% of the color blocks have a CIEDE2000 color difference of less than 3, demonstrating a good consistency in color reconstruction. For the 125° color reconstruction, the average color difference values are 1.50. Although the overall performance is good, there are still some color blocks that exhibit high reconstruction errors. Specifically, high color difference values are concentrated in individual color blocks, indicating that these areas may have more complex surface material properties or greater lighting variations.
Table 8 shows the SSIM results of the reconstruction of Chinese paintings using segmented linear interpolation, from which it can be seen that, when the illumination angle is 65°, the reconstructed SSIM value is 0.9227, and, when the illumination angle is 125°, the SSIM value is improved to 0.9736. This indicates that the model can effectively maintain high SSIM values under different illumination angles, which proves the effectiveness and superior performance of the segmented linear interpolation model in the color reconstruction of Chinese paintings.
From the perspectives of spectral reconstruction and color reconstruction in Chinese painting, using segmented linear interpolation for modeling not only achieves high-precision color reconstruction with limited data, but also demonstrates an extremely high stability in spectral reconstruction accuracy.
In order to compare and evaluate the performance of various models in the color chip and Chinese painting test scenarios, we have summarized the performance indicators of the three models at different illumination angles and sampling intervals in Table 9. From the data in the table, it can be seen that different BRDF models have their own advantages and disadvantages. The five-parameter model performs well in the overall structural reconstruction, especially with a high SSIM of 0.9455 under a 10° illumination interval. However, the accuracy of color reproduction is poor, and the CIEDE2000 color difference is high (e.g., 3.80 at 68°), which cannot accurately reproduce specular reflections and detailed colors. The Cook–Torrance model performs well in structural similarity, achieving an SSIM of 0.9482 for the 68° reconstruction at a 5° illumination interval, with a relatively low RMSE and high color difference, especially at a 10° illumination interval, indicating poor accuracy in color reconstruction. In contrast, the segmented linear interpolation model performs well in color reproduction, with the lowest color difference (0.64 at 128°), and can better reconstruct specular reflection details. It is also excellent in the application of reconstructing complex textures such as Chinese paintings, with a balanced RMSE and color difference performance (for example, at a reconstruction angle of 65°, the RMSE is 0.0450 and color difference is 1.07). Overall, the segmented linear interpolation model is suitable for applications that require a high color accuracy and detail preservation.

4. Discussion

In this paper, we explore the combination of realistically sampled BRDF data with a five-parameter model, the Cook–Torrance model, and a segmented linear interpolation method for BRDF reconstruction. The experimental results show that the segmented linear interpolation method exhibits excellent performance under multi-angle illumination conditions, especially in reproducing highlights and shadow details more accurately. This result not only proves the feasibility of the model in theory, but also demonstrates its powerful performance in practical applications. In contrast, the five-parameter model and Cook–Torrance model did not perform as expected at larger sampling intervals, resulting in a decrease in reconstruction accuracy. The advantage of the segmented linear interpolation method is that it can still provide high-precision reconstruction results even with a small amount of data, which is of great significance for the digital preservation of cultural heritage.
Although this study shows that the segmented linear interpolation model outperforms other models in testing scenarios of color chips and Chinese paintings, its applicability may be limited in cultural relics with larger sizes or more complex surface features. For example, the surface of three-dimensional objects such as sculptures or ceramics may have richer textures and surface shapes, and the performance of segmented linear interpolation models in handling these complex structures needs further exploration. In addition, the current experimental design mainly focuses on two-dimensional flat cultural relics, and future research can evaluate their applicability more comprehensively by testing the reconstruction performance of various models on different types of three-dimensional cultural relics. We suggest expanding the experimental design in future research by adding more diverse types of cultural relics and surface features to further test the generality and robustness of the model. On this basis, future research can also consider combining with emerging technologies such as AI-assisted color reproduction. AI technology, especially deep learning and neural networks, has made significant progress in the fields of color reconstruction and image restoration. Therefore, future research can consider combining BRDF with AI to leverage their respective advantages and promote the digital development of cultural heritage protection.
However, the framework proposed in this study provides an efficient and reliable solution for the color reconstruction of large-scale artworks, especially in the field of the digital preservation and display of Chinese painting, which has broad application prospects. The application of this method is not limited to Chinese painting, but can also be extended to other types of cultural heritage, 3D specimens, and objects with complex material surfaces, making it an important means of future digital preservation work.

5. Conclusions

This study combined the actual sampled BRDF data with the five-parameter model, Cook–Torrance model, and segmented linear interpolation method for BRDF reconstruction, and compared and analyzed the reconstructed BRDF values under unknown illumination angles with actual measurement values. The results show the following:
When modeling using color chip BRDF data with a sampling interval of 5°, all three modeling methods can accurately reproduce image colors under unknown illumination angles, with the segmented linear interpolation method showing the highest color reproduction accuracy. When modeling using color patch BRDF data with a sampling interval of 10°, the modeling performance of the five-parameter model and Cook–Torrance model is poor, while the segmented linear interpolation method has a very high spectral reconstruction accuracy, very small color reproduction differences, and can accurately predict highlights and shadow details in human visual perception.
Among the three models, the segmented linear interpolation method performed the best and was used to model large Chinese paintings. For the reconstruction predictions of 65° and 125°, the average RMSE of the selected reference color blocks is 0.0450 and 0.0589, and the average CIEDE2000 color difference is 1.07 and 1.50. From the perspective of human visual perception, the difference between the reconstructed images and measured images is minimal, and it can truly record and reproduce the colors of Chinese paintings. The overall research shows that combining a small amount of BRDF sampling data with segmented linear interpolation models can achieve simple and high-precision color reproduction at any lighting angle, providing a new method for the external reconstruction of cultural relics based on BRDF. Future research can further expand the scope of experiments, and explore the modeling performance of different materials and 3D artifacts, to test the universality of this method and further promote digital innovation in cultural heritage protection.
Author Contributions

Conceptualization, X.L. and J.F.; methodology, X.L.; software, X.L.; validation, X.L., J.F. and J.L.; formal analysis, X.L.; investigation, X.L.; resources, X.L., J.F. and J.L.; data curation, X.L. and J.F.; writing—original draft preparation, X.L.; writing—review and editing, X.L., J.F. and J.L.; visualization, X.L.; supervision, J.F. and J.L.; project administration, J.F.; funding acquisition, X.L. and J.F. All authors have read and agreed to the published version of the manuscript.

Funding

This research was funded by the Research Innovation Fund for Graduate Students of Yunnan Normal University, grant number YJSJJ22-A18; Yunnan Expert Workstation, grant number 202305AF150012; and Reform of University Physics Experimental Courses in Frontier Higher Education Institutions in the Context of New Engineering Disciplines, grant number DWJZW202142xn.

Institutional Review Board Statement

Not applicable.

Informed Consent Statement

Not applicable.

Data Availability Statement

The data underlying the results presented in this paper are not publicly available at this time, as the authentic Chinese paintings in the museum have not yet been made public, but may be obtained from the authors upon reasonable request.

Conflicts of Interest

The authors declare no conflicts of interest.

Appendix A. Munsell Notations of 56 Chips

Chip NumberMunsell NotationsChip NumberMunsell NotationsChip NumberMunsell NotationsChip NumberMunsell Notations
12.5R 4/14152.5R 5/14295RP 6/10437.5RP 8/6
27.5PB 3/121610PB 4/123010P 5/12445P 7/8
32.5RP 3/4177.5B 4/10313.75PB 4/12452.5PB 7/8
410RP 3/10182.5YR 3/8327.5R 5/16467.5YR 8/10
57.5G 3/2195G 3/8337.5G 4/10477.5G 6/8
610Y 3/42010YR 5/103410Y 5/8487.5GY 6/10
7N 0.75/21N 5.5/3510RP 7/1495Y 8/1
87.5R 4/162210RP 5/143610RP 7/8502.5R 9/2
97.5PB 3/102310P 4/8377.5P 6/10517.5PB 7/8
1010BG 4/8242.5PB 3/10382.5PB 6/10522.5B 7/8
112.5R 2/8252.5YR 4/103910R 6/14535Y 8/12
122.5RG 3/8262.5G 4/104010GY 5/12545BG 7/8
137.5YR 4/8272.5Y 6/8417.5Y 6/10552.5GY 7/12
145RP 3/1285YR 5/142N 7.75/56N 9.5/

References

  1. Peng, X.; Shimozato, Y.; Ito, Y.; Tahara, T.; Kakue, T.; Awatsuji, Y.; Nishio, K.; Ura, S.; Kubota, T.; Matoba, O. Improvement of color reproduction in color digital holography by using spectral estimation technique. Appl. Opt. 2011, 50, 177–182. [Google Scholar]
  2. Inoue, K.; Hara, K.; Urahama, K. Spectral Reflectance Estimation and Color Reproduction Based on Sparse Neugebauer Model. Adv. Sci. Technol. Eng. Syst. J. 2017, 2, 958–966. [Google Scholar] [CrossRef]
  3. Maali Amiri, M.; Fairchild, M.D. A strategy toward spectral and colorimetric color reproduction using ordinary digital cameras. Color Res. Appl. 2018, 43, 675–684. [Google Scholar] [CrossRef]
  4. Ferrero, A.; Bernad, B.; Campos, J.; Richard, N.; Fernández-Maloigne, C.; Melgosa, M. Goniochromatic assessment of gray scales for color change. J. Opt. Soc. Am. A 2020, 37, 1266–1275. [Google Scholar] [CrossRef]
  5. He, S.; Ren, Y.; Liu, H.; Liang, B.; Du, G. A novel tunnel lighting method aided by highly diffuse reflective materials on the sidewall: Theory and practice. Tunn. Undergr. Space Technol. 2022, 122, 104336. [Google Scholar] [CrossRef]
  6. Gatebe, C.K.; King, M.D. Airborne spectral BRDF of various surface types (ocean, vegetation, snow, desert, wetlands, cloud decks, smoke layers) for remote sensing applications. Remote Sens. Environ. 2016, 179, 131–148. [Google Scholar] [CrossRef]
  7. Zbigniew Otremba, J.P. Modelling the bidirectional reflectance distribution function (BRDF) of seawater polluted by an oil film. Opt. Express 2004, 8, 1671–1676. [Google Scholar] [CrossRef]
  8. Cheng, Z.; Li, H.; Hartley, R.; Zheng, Y.; Sato, I. Diffeomorphic Neural Surface Parameterization for 3D and Reflectance Acquisition. In Proceedings of the Special Interest Group on Computer Graphics and Interactive Techniques Conference Proceedings, Vancouver, BC, Canada, 7–11 August 2022; pp. 1–10. [Google Scholar]
  9. Li, D.; Li, G.; Hong, D.; Li, P.; Ji, W.; Yi, Z. Improved Monte Carlo method for radiative heat transfer in semitransparent media with BRDF surface. Int. J. Therm. Sci. 2023, 187, 108152. [Google Scholar] [CrossRef]
  10. Ramella-Roman, J.C.; Prahl, S.A.; Jacques, S.L. Three Monte Carlo programs of polarized light transport into scattering media: Part II. Opt. Express 2005, 13, 10392–10405. [Google Scholar] [CrossRef]
  11. Hu, B.; Guo, J.; Chen, Y.; Li, M.; Guo, Y. DeepBRDF: A Deep Representation for Manipulating Measured BRDF. Comput. Graph. Forum 2020, 39, 157–166. [Google Scholar] [CrossRef]
  12. Rhee, C.-H.; Lee, C.H. Estimating Physically-Based Reflectance Parameters From a Single Image With GAN-Guided CNN. IEEE Access 2022, 10, 13259–13269. [Google Scholar] [CrossRef]
  13. Wang, Q.; Zhao, J.; Gong, Y.; Hao, Q.; Peng, Z. Hybrid artificial bee colony algorithm for parameter optimization of five-parameter bidirectional reflectance distribution function model. Appl. Opt. 2017, 56, 9165–9170. [Google Scholar] [CrossRef] [PubMed]
  14. Tian, S.Z.; Shuai, Y.; Guo, Y.M.; Jiang, B.S.; Zhang, G.H.; Tan, H.P. Simple and fast approach to exploit the spectral reflection properties of liquid media. Appl. Opt. 2018, 57, 9046–9052. [Google Scholar] [CrossRef]
  15. Tongbuasirilai, T.; Unger, J.; Kronander, J.; Kurt, M. Compact and intuitive data-driven BRDF models. Vis. Comput. 2019, 36, 855–872. [Google Scholar] [CrossRef]
  16. Cohen, D.; Stamnes, S.; Tanikawa, T.; Sommersten, E.R.; Stamnes, J.J.; Lotsberg, J.K.; Stamnes, K. Comparison of discrete ordinate and Monte Carlo simulations of polarized radiative transfer in two coupled slabs with different refractive indices. Opt. Express 2013, 21, 9592–9614. [Google Scholar] [CrossRef] [PubMed]
  17. Ge, W.; Modest, M.F.; Roy, S.P. Development of high-order PN models for radiative heat transfer in special geometries and boundary conditions. J. Quant. Spectrosc. Radiat. Transf. 2016, 172, 98–109. [Google Scholar] [CrossRef]
  18. Kalantari, E.; Molan, Y.E. Analytical BRDF model for rough surfaces. Optik 2016, 127, 1049–1055. [Google Scholar] [CrossRef]
  19. Lai, Q.; Liu, B.; Zhao, J.; Zhao, Z.; Tan, J. BRDF characteristics of different textured fabrics in visible and near-infrared band. Opt. Express 2020, 28, 3561–3575. [Google Scholar] [CrossRef]
  20. Guarnera, D.; Guarnera, G.C.; Ghosh, A.; Denk, C.; Glencross, M. BRDF Representation and Acquisition. Comput. Graph. Forum 2016, 35, 625–650. [Google Scholar] [CrossRef]
  21. Kim, D.B.; Jang, I.Y.; Choi, H.K.; Lee, K.H. Recovery and representation of spectral bidirectional reflectance distribution function from an image-based measurement system. Color Res. Appl. 2015, 41, 358–371. [Google Scholar] [CrossRef]
  22. Liu, Y.; Wang, P.; Lin, C.; Long, X.; Wang, J.; Liu, L.; Komura, T.; Wang, W. NeRO: Neural Geometry and BRDF Reconstruction of Reflective Objects from Multiview Images. ACM Trans. Graph. 2023, 42, 1–22. [Google Scholar] [CrossRef]
  23. Hao, J.; Liu, Y.; Weng, D. A BRDF Representing Method Based on Gaussian Process. In Proceedings of Computer Vision—ACCV 2014 Workshops; Springer: Cham, Switzerland, 2015; pp. 542–553. [Google Scholar]
  24. Cao, J.; Hu, X.; Cui, H.; Liang, Y.; Chen, Z. A generative adversarial network model fused with a self-attention mechanism for the super-resolution reconstruction of ancient murals. IET Image Process. 2023, 17, 2336–2349. [Google Scholar] [CrossRef]
  25. Sztrajman, A.; Rainer, G.; Ritschel, T.; Weyrich, T. Neural BRDF Representation and Importance Sampling. Comput. Graph. Forum 2021, 40, 332–346. [Google Scholar] [CrossRef]
  26. Sang, L.; Häfner, B.; Zuo, X.; Cremers, D. High-Quality RGB-D Reconstruction via Multi-View Uncalibrated Photometric Stereo and Gradient-SDF. In Proceedings of the IEEE/CVF Winter Conference on Applications of Computer Vision (WACV), Waikoloa, HI, USA, 3–7 January 2023; pp. 3106–3115. [Google Scholar]
  27. Bousefsaf, F.; Tamaazousti, M.; Said, S.H.; Michel, R. Image completion using multispectral imaging. IET Image Process. 2018, 12, 1164–1174. [Google Scholar] [CrossRef]
  28. Cheng, Z.; Li, H.; Asano, Y.; Zheng, Y.; Sato, I. Multi-view 3D Reconstruction of a Texture-less Smooth Surface of Unknown Generic Reflectance. In Proceedings of the IEEE/CVF Conference on Computer Vision and Pattern Recognition (CVPR), Nashville, TN, USA, 20–25 June 2021; pp. 16226–16235. [Google Scholar]
  29. Machikhin, A.; Beliaeva, A.; Romanova, G.; Ershov, E. Color Reproduction by Multi-Wavelength Bragg Diffraction of White Light. Materials 2023, 16, 4382. [Google Scholar] [CrossRef]
  30. Martinez-Domingo, M.A.; Melgosa, M.; Okajima, K.; Medina, V.J.; Collado-Montero, F.J. Spectral Image Processing for Museum Lighting Using CIE LED Illuminants. Sensors 2019, 19, 5400. [Google Scholar] [CrossRef]
  31. Liu, C.; Li, Z.; Xu, C.; Tian, Q. A BRDF statistical model applying to space target materials modeling. In Proceedings of the SPIE, AOPC 2017: Space Optics and Earth Imaging and Space Navigation, Beijing, China, 4–6 June 2017; p. 104630X. [Google Scholar]
  32. Ďurikovič, R.; Mihálik, A. Modeling the BRDF from spectral reflectance measurements of metallic surfaces. Appl. Surf. Sci. 2014, 312, 87–90. [Google Scholar] [CrossRef]
  33. Omer, K.; Kupinski, M. Compression, interpolation, and importance sampling for polarized BRDF models. Opt. Express 2022, 30, 25734–25752. [Google Scholar] [CrossRef]
  34. Melgosa, M. Some recent advances in color science. J. Phys. Conf. Ser. 2022, 2407, 012030. [Google Scholar] [CrossRef]
  35. Durmus, D. CIELAB color space boundaries under theoretical spectra and 99 test color samples. Color Res. Appl. 2020, 45, 796–802. [Google Scholar] [CrossRef]
  36. Hu, Z.; Gao, J.; Zhang, N.; Yang, Y.; Liu, X.; Zheng, H.; Liang, D. An improved statistical iterative algorithm for sparse-view and limited-angle CT image reconstruction. Sci. Rep. 2017, 7, 10747. [Google Scholar] [CrossRef] [PubMed]
  37. Johnson, G.M.; Fairchild, M.D. A top down description of S-CIELAB and CIEDE2000. Color Res. Appl. 2003, 28, 425–435. [Google Scholar] [CrossRef]
Figure 1. Irradiance of the LED light source.
Photonics 11 01089 g001
Figure 2. Data acquisition schematic.
Photonics 11 01089 g002
Figure 3. Experimental flow chart.
Photonics 11 01089 g003
Figure 4. Angle relationship schematic.
Photonics 11 01089 g004
Figure 5. Reflectance and BRDF curves: (a) No. 1; (b) No. 26; and (c) No. 31.
Photonics 11 01089 g005
Figure 6. The variation of BRDF value with wavelength and light source irradiation angle at a 90° viewing angle: (a) red color chip; (b) green color chip; and (c) blue color chip.
Photonics 11 01089 g006
Figure 7. Modeling results: (a) No. 1 at 68°; (b) No. 1 at 128°; (c) No. 26 at 68°; (d) No. 26 at 128°; (e) No. 31 at 68°; and (f) No. 31 at 128°.
Photonics 11 01089 g007
Figure 8. RMSE of model reconstruction at 5° illumination angle intervals: (a) 68°; and (b) 128°.
Photonics 11 01089 g008
Figure 9. RGB spatial modeling results: (a) the original direct measurement at 68°; (b) the reconstruction result of the five-parameter model at 68°; (c) the reconstruction result of the Cook–Torrance model at 68°; (d) the reconstruction result of the segmented linear interpolation at 68°; (e) the original direct measurement at 128°; (f) the reconstruction result of the five-parameter model at 128°; (g) the reconstruction result of the Cook–Torrance model at 128° Cook–Torrance model reconstruction results; and (h) segmented linear interpolation reconstruction results at 128°.
Photonics 11 01089 g009
Figure 10. CIEDE2000 color difference of model reconstruction at 5° illumination angle intervals: (a) 68°; and (b) 128°.
Photonics 11 01089 g010
Figure 11. Modeling results: (a) No. 1 at 68°; (b) No. 1 at 128°; (c) No. 26 at 68°; (d) No. 26 at 128°; (e) No. 31 at 68°; and (f) No. 31 at 128°.
Photonics 11 01089 g011
Figure 12. RMSE of model reconstruction at 5° illumination angle intervals: (a) 68°; and (b) 128°.
Photonics 11 01089 g012aPhotonics 11 01089 g012b
Figure 13. RGB spatial modeling results: (a) the original direct measurement at 68°; (b) the reconstruction result of the five-parameter model at 68°; (c) the reconstruction result of the Cook–Torrance model at 68°; (d) the reconstruction result of the segmented linear interpolation at 68°; (e) the original direct measurement at 128°; (f) the reconstruction result of the five-parameter model at 128°; (g) the reconstruction result of the Cook–Torrance model at 128° Cook–Torrance model reconstruction results; and (h) segmented linear interpolation reconstruction results at 128°.
Photonics 11 01089 g013
Figure 14. CIEDE2000 color difference of model reconstruction at 10° illumination angle intervals: (a) 68°; and (b) 128°.
Photonics 11 01089 g014
Figure 15. Chinese painting with marked color block position information.
Photonics 11 01089 g015
Figure 16. Modeling results from a 90° viewing angle: (a) No. 4 at 65°; (b) No. 4 at 125°; (c) No. 8 at 65°; (d) No. 8 at 125°; (e) No. 19 at 65°; and (f) No. 19 at 125°.
Photonics 11 01089 g016
Figure 17. RMSE for spectral reconstruction of Chinese paintings: (a) 65°; and (b) 125°.
Photonics 11 01089 g017
Figure 18. Chinese painting modeling results: (a) the original image of direct measurement at 65°; (b) the reconstruction result of segmented linear interpolation at 65°; (c) the original image of direct measurement at 125°; and (d) the reconstruction result of segmented linear interpolation at 125°.
Photonics 11 01089 g018
Figure 19. CIEDE2000 color difference for color reconstruction of Chinese paintings: (a) 65°; and (b) 125°.
Photonics 11 01089 g019
Table 1. RMSE statistics for model reconstruction at 5° illumination angle intervals.
RMSE StatisticFive-ParameterCook–TorranceSegmented Linear Interpolation
68°128°68°128°68°128°
Minimum0.01240.01630.01070.01690.01360.019
Maximum0.03720.07830.04360.07790.03850.0422
Average0.02430.03250.02540.03220.02440.0283
Table 2. CIEDE2000 color difference statistics for model reconstruction at 5° illumination angle intervals.
Color Difference StatisticFive-ParameterCook–TorranceSegmented Linear Interpolation
68°128°68°128°68°128°
Minimum0.930.360.40.40.090.04
Maximum5.519.438.639.062.262.7
Average2.883.733.293.530.720.58
Table 3. RMSE statistics for model reconstruction at 10° illumination angle intervals.
RMSE Statistic Five-ParameterCook–TorranceSegmented Linear Interpolation
68°128°68°128°68°128°
Minimum0.01180.01680.01160.01730.01330.0199
Maximum0.08130.06660.07490.06410.04260.0462
Average0.03030.03170.02940.03250.02560.0297
Table 4. CIEDE2000 color difference statistics for model reconstruction at 10° illumination angle intervals.
RMSE StatisticFive-ParameterCook–TorranceSegmented Linear Interpolation
68°128°68°128°68°128°
Minimum0.390.540.360.430.140.08
Maximum18.539.2117.4611.073.822.97
Average3.83.673.893.710.920.64
Table 5. SSIM for reconstructing the entire color chip image.
ModelIllumination Interval 5°Illumination Interval 10°
Reconstruction 68°Reconstruction 128°Reconstruction 68°Reconstruction 128°
Five-parameter0.95730.9120.87170.9455
Cook–Torrance0.94820.86930.85650.8912
Segmented linear interpolation0.94270.95950.93480.9801
Table 6. RMSE statistics for segmented linear interpolation reconstruction for Chinese paintings.
RMSE Statistic65°125°
Minimum0.03310.0503
Maximum0.05780.0725
Average0.04500.0589
Table 7. CIEDE2000 color difference statistics for segmented linear interpolation reconstruction for Chinese paintings.
RMSE Statistic65°125°
Minimum0.260.40
Maximum3.243.71
Average1.071050
Table 8. SSIM for segmented linear interpolation reconstruction of Chinese paintings.
Illumination Angle for ReconstructionSSIM
65°0.9227
125°0.9736
Table 9. Performance metrics of three models.
Test ScenariosIllumination IntervalModelReconstruct AngleRMSECIEDE2000 Color DifferenceSSIM
Color chipFive-parameter68°0.02432.880.9573
128°0.03253.730.9120
Cook–Torrance68°0.02543.300.9482
128°0.03223.530.8693
Segmented linear interpolation68°0.02440.720.9427
128°0.02830.580.9595
10°Five-parameter68°0.03033.800.8717
128°0.03173.670.9455
Cook–Torrance68°0.02943.900.8565
128°0.03253.710.8912
Segmented linear interpolation68°0.02560.920.9348
128°0.02970.640.9801
Chinese painting10°Segmented linear interpolation65°0.04501.070.9227
125°0.05891.500.9736
Disclaimer/Publisher’s Note: The statements, opinions and data contained in all publications are solely those of the individual author(s) and contributor(s) and not of MDPI and/or the editor(s). MDPI and/or the editor(s) disclaim responsibility for any injury to people or property resulting from any ideas, methods, instructions or products referred to in the content.