Article

Influence of Optical Fiber Parameters on the Speckle Pattern and Spectral Observation in Astronomy

1
Key Laboratory of In-Fiber Integrated Optics of Ministry of Education, College of Physics and Optoelectronic Engineering, Harbin Engineering University, Harbin 150001, China
2
Key Laboratory of Photonic Materials and Devices Physics for Oceanic Applications, Ministry of Industry and Information Technology of China, College of Physics and Optoelectronic Engineering, Harbin Engineering University, Harbin 150001, China
3
Yantai Research Institute and Graduate School, Harbin Engineering University, Yantai 264000, China
4
Qingdao Innovation and Development Center, Harbin Engineering University, Qingdao 266000, China
5
China Aerodynamics Research and Development Center, State Key Laboratory of Aerodynamics, Mianyang 621000, China
*
Author to whom correspondence should be addressed.
Photonics 2024, 11(11), 1056; https://doi.org/10.3390/photonics11111056
Submission received: 13 October 2024 / Revised: 1 November 2024 / Accepted: 7 November 2024 / Published: 11 November 2024
(This article belongs to the Special Issue Advances in Optical Fiber Sensing Technology)

Abstract

:
Optical fibers serve as a bridge to transmit starlight into the spectrograph in fiber spectral surveys. Due to the interference between multiple modes supported within the fiber, a granular speckle pattern appears on the end of the fiber and leads to an uneven and random energy distribution in the spectrum. This effect is called mode noise, which reduces the accuracy of high-resolution spectral detection. This work investigates the influence of transmitted mode numbers on speckle patterns by using fibers with different core diameters and numerical apertures. A reciprocating mechanical scrambler is proposed for suppressing near-field speckles with negligible focal ratio degradation. We use centroid offset and radial power spectrum to quantitatively evaluate the characteristics of the speckles with and without scrambling. Experimental results show that more modes in a fiber with a larger core diameter reduce the centroid offset of the speckle and make the energy distribution more uniform. The mechanical mode scrambler significantly reduces the random centroid deviation caused by speckles, which is more obvious for large-core fibers. The standard deviation of centroid offset in 1000-cycle tests for the 160 µm core fiber is only 0.043 µm, which is one-tenth of that for the 16 µm core fiber. However, in solar spectrum measurement using these fibers, small-core fibers can more easily achieve higher spectral resolution and capture more spectral information. Therefore, large-core fibers are suitable for tasks requiring high accuracy, while fibers with a smaller core diameter should be applied for high-precision spectral measurement.

1. Introduction

Optical fibers are widely used in astronomical observation due to their advantages including flexibility, low loss, large information capacity, and long-distance propagation. The selection of fiber parameters such as core diameter, numerical aperture, and wavelength band is related to the brightness of the target star, the concerned wavelength band, the telescopic system, and the seeing conditions of the observation environment. The fiber parameters used in different astronomical observation projects are shown in Table 1. To realize a higher spectral signal-noise ratio (SNR), multi-mode fibers (MMFs) with large cores are more commonly applied in astronomical observations due to their strong light-collecting ability [1]. In addition, a larger core not only reduces the difficulty of coupling an enlarged star image caused by atmosphere turbulence into a fiber but also improves the stability of the spectra. MMFs have played a vital role in sky survey projects including MEGARA [2], LAMOST [3], DESI [4], solar magnetic field measurement [5,6], radial velocity measurement [7,8], etc.
However, MMFs also have shortcomings. In terms of wave optics, light propagates in different modes along the fiber. These modes are discontinuous field solutions of Maxwell’s equations under specific boundary conditions. For a certain wavelength, the number of modes supported by the fiber is positively correlated with the core diameter and numerical aperture. Therefore, dozens, hundreds, thousands, and even more modes will be supported by an MMF. When the bandwidth of the incident light is narrow, the modes propagating in an MMF finally form a granular speckle pattern due to mode interference [12]. The uneven random distribution of energy caused by the speckle is called mode noise as reported in [13,14,15,16]. However, when broadband light is injected into an MMF, there is no speckle at the output end [17,18]. In the fiber-fed spectrograph, different wavelength information of the incident signal is mapped to different spatial positions by the dispersion element [19,20,21]. The spectrum on the detector is the superposition of the convolution image formed by the speckle at different wavelengths and the point spread function (PSF) of the optical system. When the line dispersion is large, the corresponding bandwidth of each pixel is narrow, which leads to the speckle energy at each wavelength being uneven. The speckle causes the centroid offset of the spot. Mode noise caused by speckles results in the non-uniform energy distribution of the spectral image and limits the photometric accuracy of the spectrograph, especially in high-precision spectral measurements. The number and size of the speckle particles formed by the MMF with different core diameters and numerical apertures are also diverse. This means that both the core diameter and the numerical aperture affect the accuracy and precision of spectral measurement. To homogenize speckles, a variety of methods have been proposed, such as the mechanical disturbance method [22,23], polygonal fiber [24,25,26], and fiber double scrambler [27,28].
Compared with MMFs, single-mode fibers (SMFs), which have a small core diameter, exhibit attractive advantages in terms of achieving higher spectral resolution and spatial filtering. Only one mode transmits along an SMF and forms a spot with Gaussian-like energy distribution on the output end. Thus, SMFs have the ability to avoid mode noise. However, the core diameter of SMFs is so small (4–6 µm for visible light; 8–10 µm for short-wave infrared (SWIR) light) that it is difficult to couple the stars into fibers with a high injection efficiency. Although the development of adaptive optical (AO) technology improves the injection efficiency of SMFs as reported in [10,11,29], the complex and expensive AO system makes SMFs unsuitable for wide use.
In 2022, Wang et al. reported a fan-shaped integral field unit with 1346 fibers, which is developed and assembled in the first generation of the fiber array solar optical telescope (FASOT-1) [30]. FASOT measures the Stokes spectral data of multiple magneto-sensitive lines over a two-dimensional (2D) field of view [9]. MMFs with a core diameter of 35 µm and an N . A . of 0.12 feed a spectrograph and achieve high-precision spectral imaging polarimetry measurement. The phenomenon of uneven energy distribution caused by the mode noise effect is also observed in the fiber spectra.
Since fibers with different parameters are used in astronomical observation, the influence of speckles under different fiber parameters on spectral measurement accuracy and precision is studied in this paper. The causes of uneven energy distribution in dispersive spectral images are investigated and confirmed by the simulation based on the Eigenmode expansion method (EEM). The speckle patterns of the fiber with different parameters are experimentally characterized under the condition of unscrambled and scrambled. Then, these fibers are applied to obtain unscrambled and scrambled solar spectra.

2. Mode Noise in the Fiber Spectrum

2.1. Formation of the Modal Noise in FASOT Fiber

For monochromatic light, the number of the modes (M) supported in a step-index MMF is
M = 1 2 2 a π N . A . λ 2
where a and N . A . are the diameter of the fiber core and the numerical aperture, and λ is the wavelength. These modes have different effective indexes. They interfere with each other to form the speckle on the output end of the fiber. Therefore, the speckle pattern is sensitive to a variety of parameters. The contrast of the speckle is usually determined by the bandwidth of the light source. The narrower the bandwidth of the light source, the stronger the contrast of the speckle pattern. On the contrary, speckles with different patterns generated by different wavelength components are superimposed. As a result, the speckle pattern obtained by injecting a broadband light tends to be more uniform. In the fiber-fed spectrograph, the high-resolution dispersion element and the small core diameter of the fiber reduce the overlap between the fiber speckle images on the detector. In each pixel of the detector, the wavelength range decreases, and the details of the speckle are obvious.
In the fiber-fed spectrograph of FASOT-1, the band of priority concern is 516.5–523.5 nm. Therefore, the wavelength for the test was chosen to be 520 nm. When the wavelength is 520 nm, 1286 modes propagate in the fiber which has a core diameter of 35 µm and a N . A . of 0.12. The image magnification of the spectrograph is 0.957. Considering aberration and diffraction effects, the diameter of the fiber-end image on the detector is about 35 µm. The pixel size of the detector is 3.76 µm. So, one fiber-end image covers about 9 pixels at each wavelength. The line dispersion of the spectrograph is obtained from Equation (2):
d l d λ = m f d cos θ
where m is the diffraction order, f is the focal length of the imaging system, d is the grating constant, and θ is the diffraction angle. In the spectrograph of FASOT-1, m is 2, f is 642.84 mm, d is 1/830 mm, and θ is 37.44°. According to Equation (2), we calculate the line dispersion of the FASOT spectrograph as 1.344 mm/nm, and the wavelength range corresponding to each fiber-end image is 26.0 pm. This means that the wavelength range in one pixel of the camera is 2.8 pm. Therefore, obvious mode noise will appear in the spectrum. Therefore, the wavelength range of each pixel of the detector is the criterion for the existence of mode noise in the spectrum.

2.2. Simulation of the FASOT-Fiber Speckle and Spectrum

The EEM is used to simulate the near-field speckle pattern of the step-index fiber used in FASOT [31]. The field at each point in the speckle is the sum of the contributions of several individual fields, as shown in Equation (3):
E x , y , λ , L = m A m ψ m x , y , λ exp j β m ( λ ) L
where A m , ψ m , and β m are the amplitude, the spatial field, and the propagation constant of the mth-guided mode. λ is the wavelength of incident light and L is the propagation distance. The near-field intensity of the speckle is obtained from Equation (4):
I o u t = E x , y , λ , L 2
The incident field energy is set to Gaussian distribution, as shown in Equation (5):
E i n x , y = A 0 exp x 2 + y 2 2 σ 2
where σ refers to the width of the incident field. σ is selected as 5, without displacement in the direction and angle. The grid sampling point is set to 251 and the total length is 55 µm. The simulated and measured near-field speckle patterns with the 35 µm fiber at 520 nm are shown in Figure 1. The high-intensity speckles refer to the constructive interference points. Otherwise, destructive interference occurs. It is seen that the speckle pattern obtained by simulation agrees well with the experimental results. The two speckles have particles of similar number, size, and brightness, as well as dark areas with similar patterns.
Here, the radial power spectrum is used to verify the similarity between the simulated speckle and the experimental speckle, which can be used to characterize the energy distribution of the low-frequency component and high-frequency component in the image. As shown in Figure 2, the power spectral densities of the two coincide at low frequencies. Therefore, it can be shown that the simulated speckle and the experimental speckle have good similarities.
Whether it is destructive interference or constructive interference, their occurrence is determined by the transmission constant of the mode in the fiber, namely, β m , which is written as
β m = 2 π n e f f λ
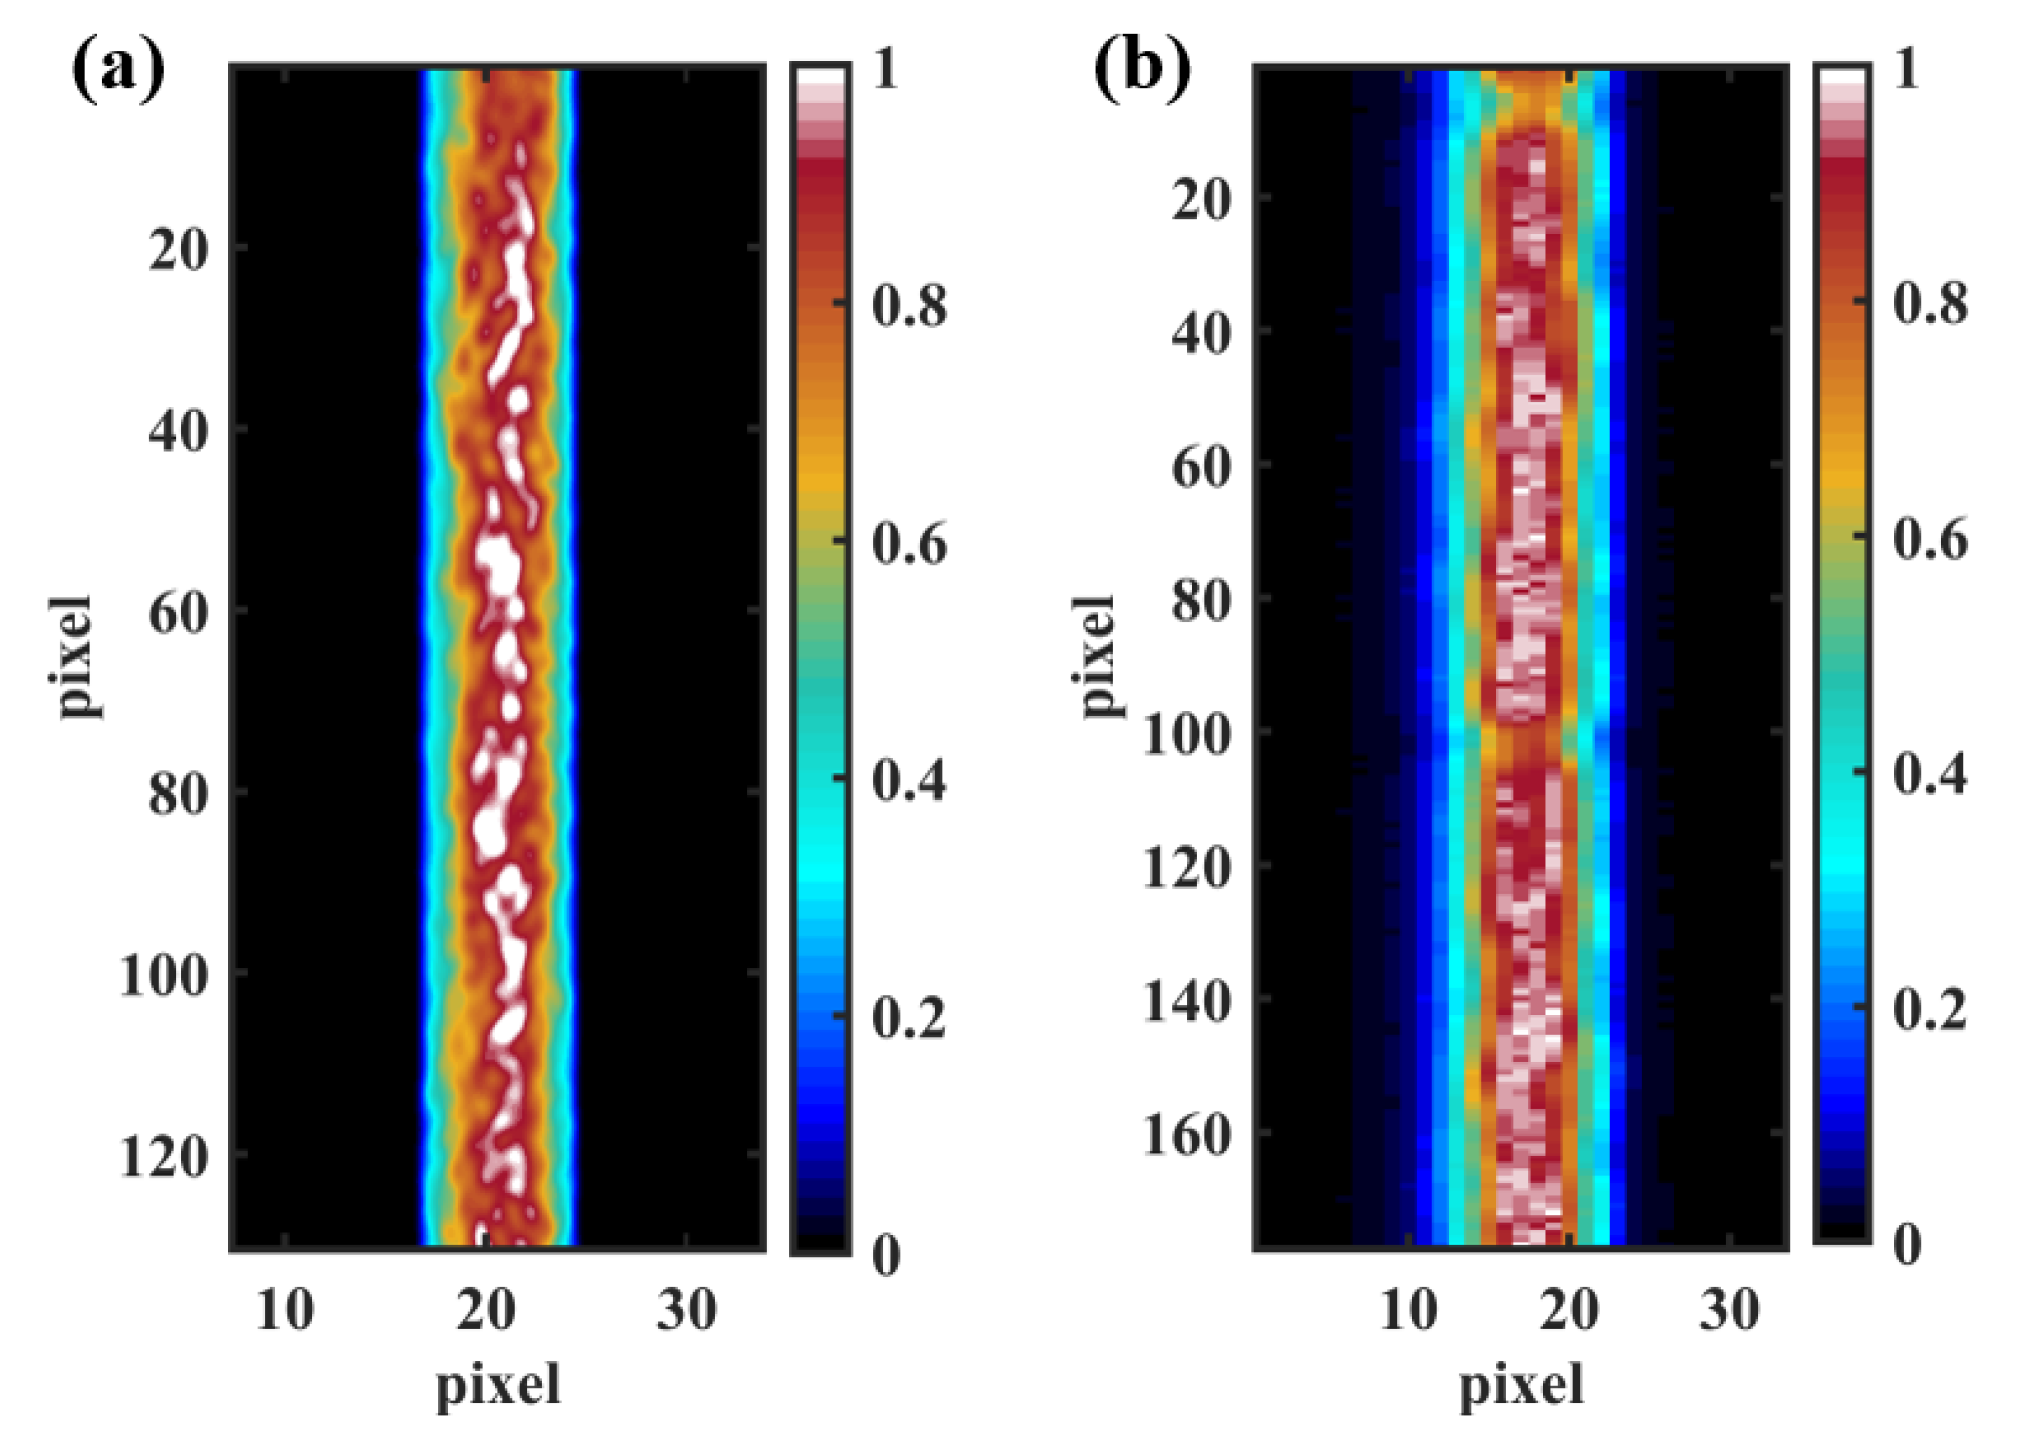
where n e f f represents the effective refractive index. According to Equation (6), different incident wavelengths form different speckle patterns. Thus, the spectral image is simulated by superposing the PSF-convolved speckles at each wavelength. The simulated and measured spectra of FASOT-1 near 520 nm are shown in Figure 3. The horizontal and vertical coordinates represent the detector space dimension and spectral dimension, respectively. The color bar represents the relative energy intensity of the spectrum.
In Figure 3, both the simulated and measured spectra have a non-uniform energy distribution in the spatial direction, which indicates that there is a good similarity between the two. It confirms that the fiber speckle is the cause of disturbing the energy distribution in the spectral image of FASOT. Therefore, there will also be an uneven distribution of energy in the spectral dispersion direction, which will lead to a decrease in the resolution of spectral extraction.

3. Experiments and Results

3.1. Fiber Speckle Test

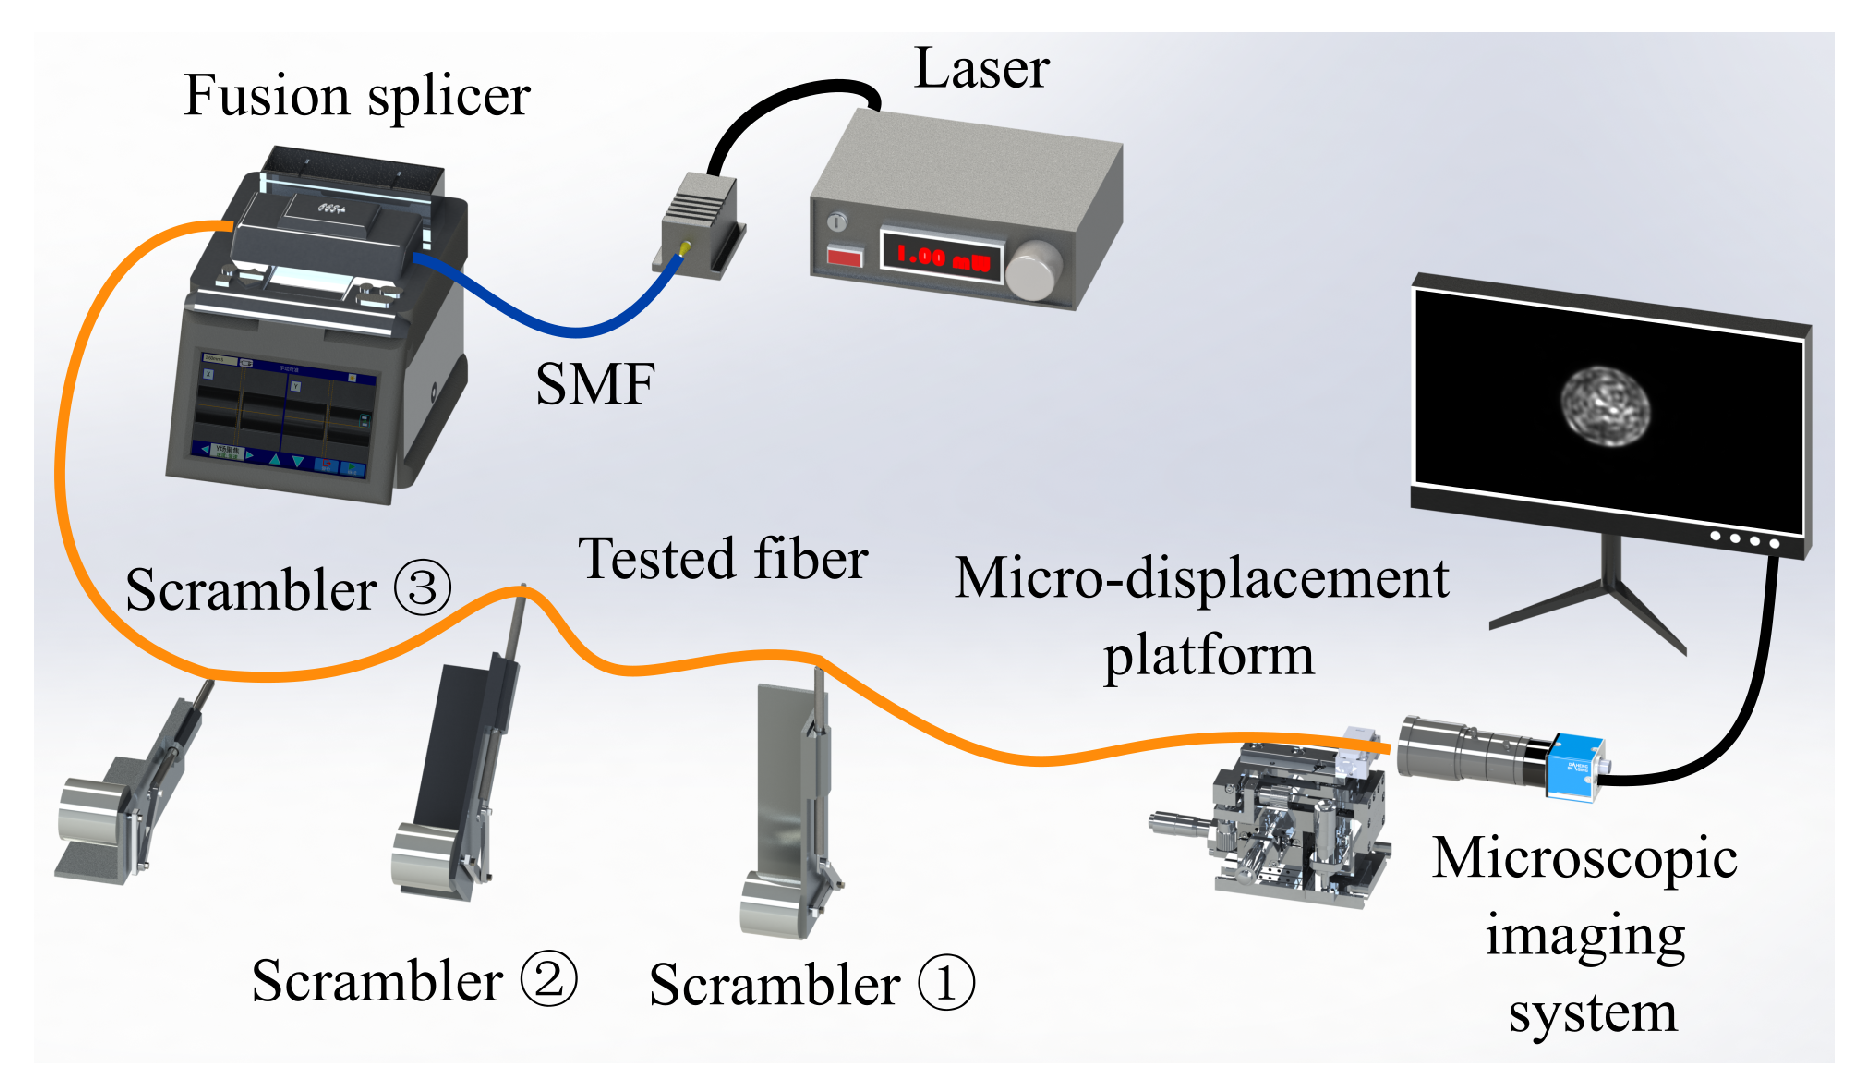
The experimental setup for obtaining the fiber speckle is shown in Figure 4. The light source is a 520 nm semiconductor laser with a single-mode tail fiber (the core diameter is 4 µm). The fiber under test and the tail fiber are well aligned by a commercially available fusion splicer (66 S+, Fujikura Co., Ltd., JPN) [32].
There are four kinds of tested fibers whose parameters are shown in Table 2. The tested fiber is disturbed by a mechanical mode scrambler which is composed of three reciprocating machines mounted at different angles relative to the horizon direction. The position of the tested fiber output end is adjusted by a micro-displacement platform. A microscopic imaging system consisting of an objective lens (with a magnification of 40× and a numerical aperture of 0.4) and a CCD (with a resolution of 4096 × 4504 and a pixel pitch of 2.4 µm (ME2P-1840-21U3M, DaHeng Optics Co., Ltd., CHN)) are applied to capture the speckle.
The fibers are tested under two conditions: unscrambled and scrambled. Under the unscrambled situation, the tested fiber is disturbed artificially to simulate the fiber in different stationary states. In the case of the scrambled fiber, the mechanical scrambler is used to agitate the fiber to smooth the speckle. The amplitude of the reciprocators is 5 cm. The reciprocating frequency of the three reciprocators is set to 1.4 Hz, 1.5 Hz, and 1.6 Hz, respectively. A total of 1000 speckle patterns are taken for each of the two conditions. The exposure time of the CCD is set to 1 s.
Since the fiber speckle is formed by mode interference, the speckle pattern is related to the phase of each mode. This makes the speckle pattern sensitive to multiple factors, such as fiber shape, force, manufacturing defects, environment temperature, and light source wavelength. Therefore, the speckle pattern not only varies regularly with wavelength but also has some random factors. In the direction of spectral dispersion, the centroid offset of the speckle leads to energy misalignment and reduces the accuracy of spectral extraction.
After the speckle image is obtained, the speckle is preprocessed first, and then the centroid shift of the speckle is calculated. In the pretreatment process, we first determine the core location, that is, the speckle location. In the case of coaxial illumination, the fiber end without laser incidence is imaged in the near-field. The core region of the fiber is fitted by a circle. Since the relative positions of the imaging system and the fiber remained strictly fixed, in the subsequent calculation of the speckle centroid, only the speckle within the fitted circle is paid attention to. The gray value of the pixels in the other areas is set to zero. Next, the dark field under no light source is subtracted from the speckle. Finally, pixels with grayscale values less than 0 or greater than 255 in the picture matrix are set to 0.
The fiber speckle centroid is defined as X c , Y c . The offset of the fiber speckle centroid related to the fiber center is defined as Δ X , Δ Y . The speckle centroid is calculated by Equation (7):
X c , Y c = j i I i , j x i , j , I i , j y i , j j i I i , j
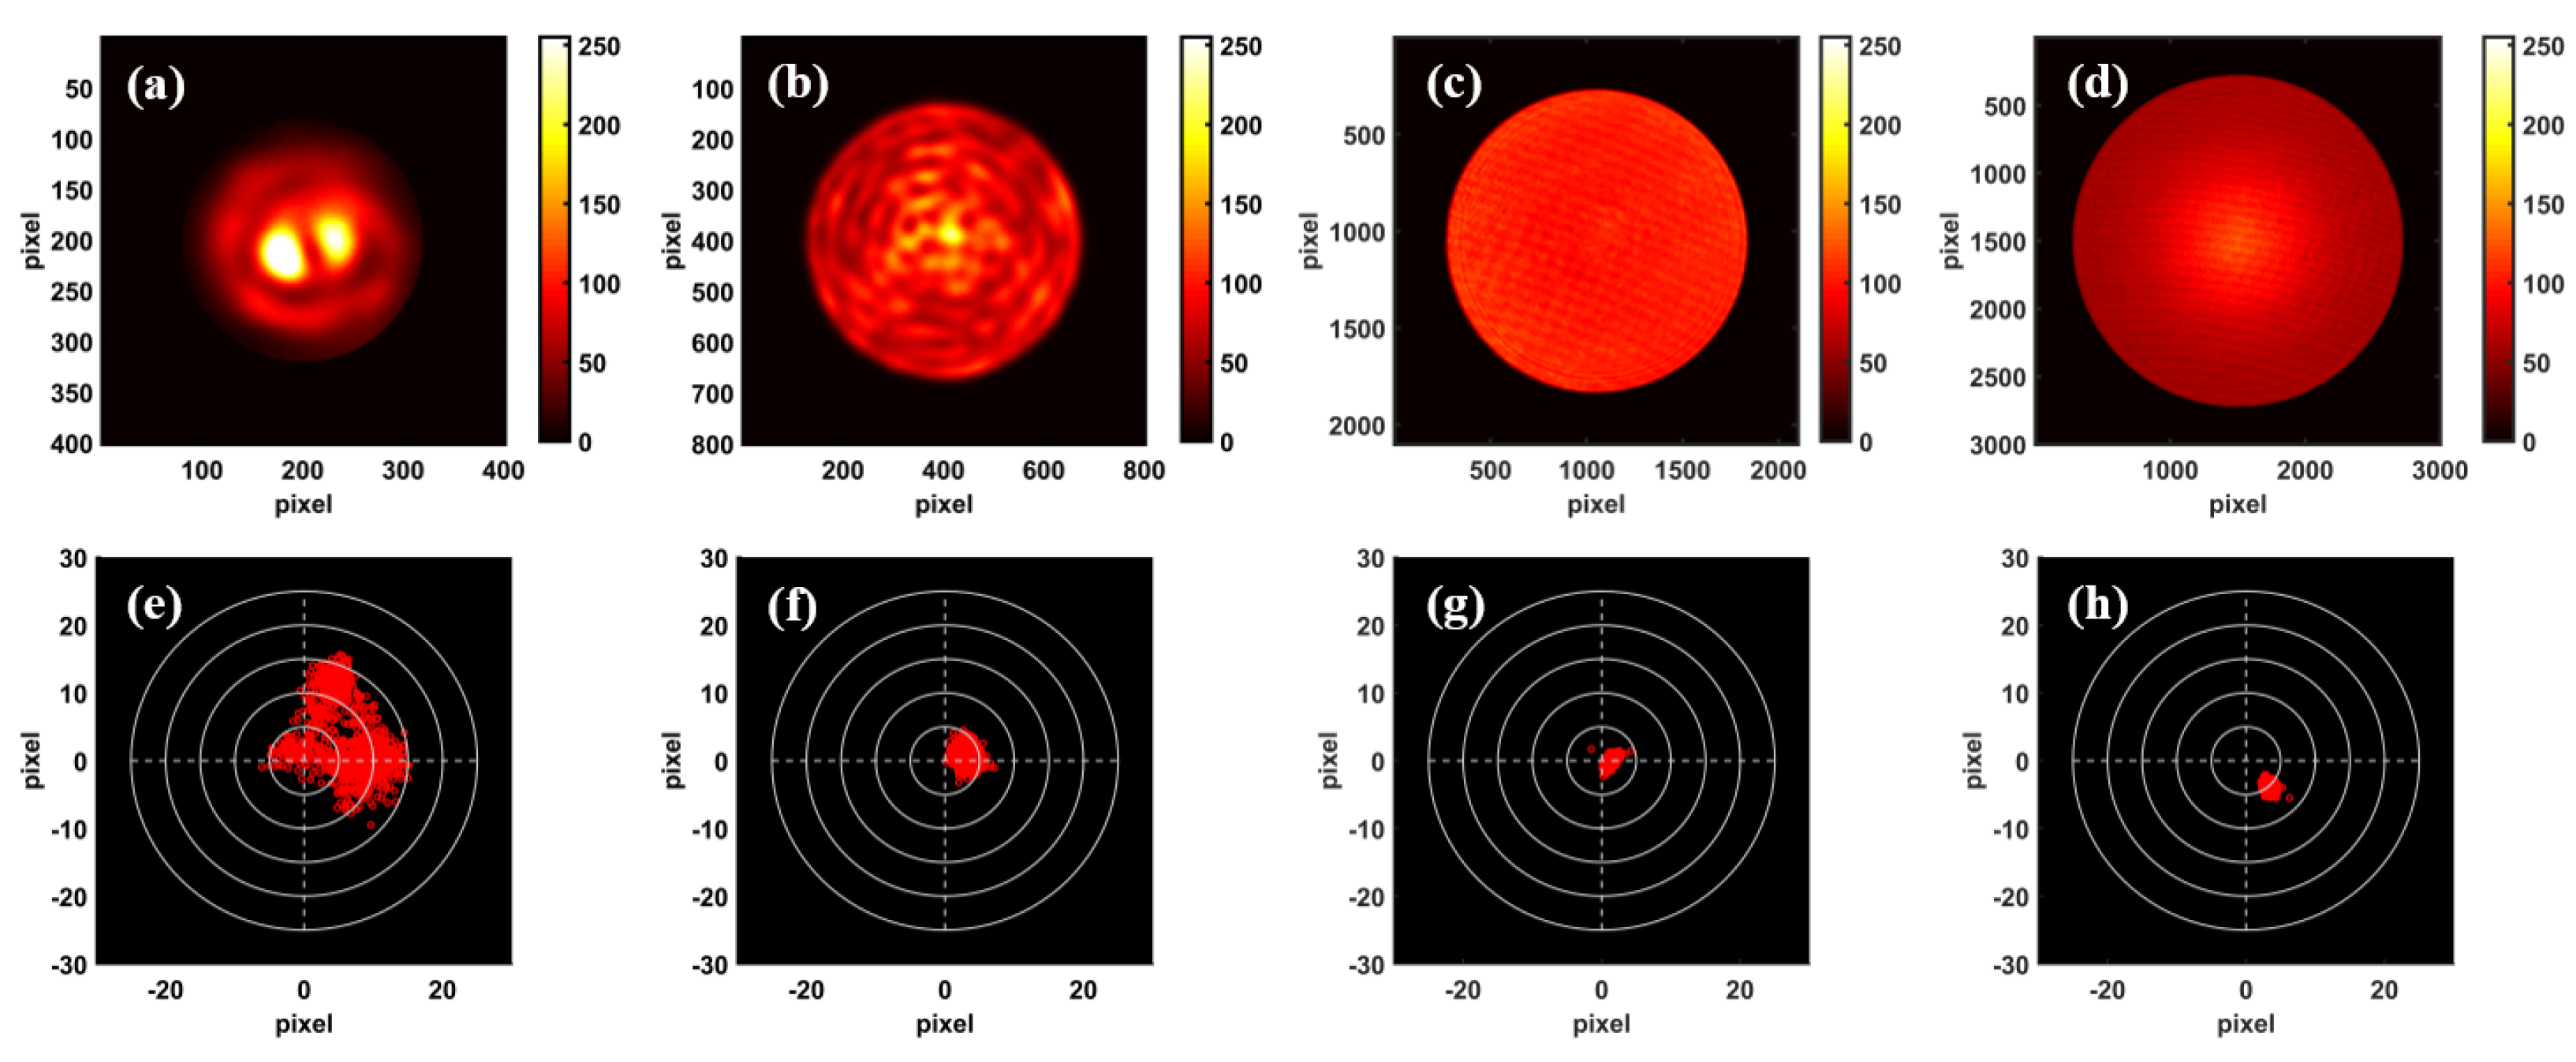
where i and j are the rows and columns of the speckle matrix, and x i , j and y i , j represent the spatial abscissa and ordinate values of pixels in row i and column j. I i , j is the energy intensity of the pixel in row i and column j. The near-field speckles and their offsets Δ X , Δ Y under unscrambled and scrambled conditions are shown in Figure 5 and Figure 6.
In Figure 5 and Figure 6, the number of modes propagating in the test fibers of (a)–(d) gradually increases. As shown in Figure 5a, speckle energy is easier to gather in one region, and the centroid produces a large shift. Figure 5e–h shows 1000 centroid offsets corresponding to each test fiber. In Figure 5e, the maximum offset of the centroid is 24.1 pixels. In Figure 5f–h, the maximum offsets of the centroid are 12.8, 14.4, and 15.2 pixels, respectively. The size of each pixel corresponds to 0.06 µm. According to Equation (1), 268, 1286, 38,912, and 90,358 modes are propagated in the four test fibers, respectively, at 520 nm. When the number of modes propagating in the speckle is small, the energy of the excited low-order modes is large. Lower-order patterns correspond to patterns with less energy segmented. Therefore, the number of particles in the speckle is small, and the area of each particle is large. Under the condition of unscrambled disturbance, the maximum centroid offset error of the four fibers is 1.45 µm, 0.77 µm, 0.86 µm, and 0.91 µm, respectively.
The speckles in Figure 6 are suppressed by the mechanical scrambler. The speckle in Figure 6a–d gradually becomes more uniform. The lower the number of modes in the speckle, the more stable the speckle pattern when the fiber is disturbed. Therefore, the speckle suppression effect of the fiber with more modes is better under the mechanical disturbance system with the same amplitude and frequency. When scrambling the fiber with fewer propagation modes, a larger amplitude and frequency are needed to obtain plenty of speckle patterns for speckle homogenization. In Figure 6e–h, the dispersion of the offset distance of 1000 speckles decreases gradually, and the standard deviation of the centroid of these four kinds of fibers is 6.82, 1.58, 0.80, and 0.71 pixels, respectively. The larger the fiber core diameter, the smaller the standard deviation of the speckle centroid offset. The centroid offset error limits of the four test fibers are 16.5, 7.7, 4.5, and 8.4 pixels, that is, 0.99 µm, 0.46 µm, 0.27 µm, and 0.50 µm. The offset distance is not distributed centered on the origin of the coordinates. The possible reasons are the tilted input and output end of the fiber (cutting error), and the fiber bending.
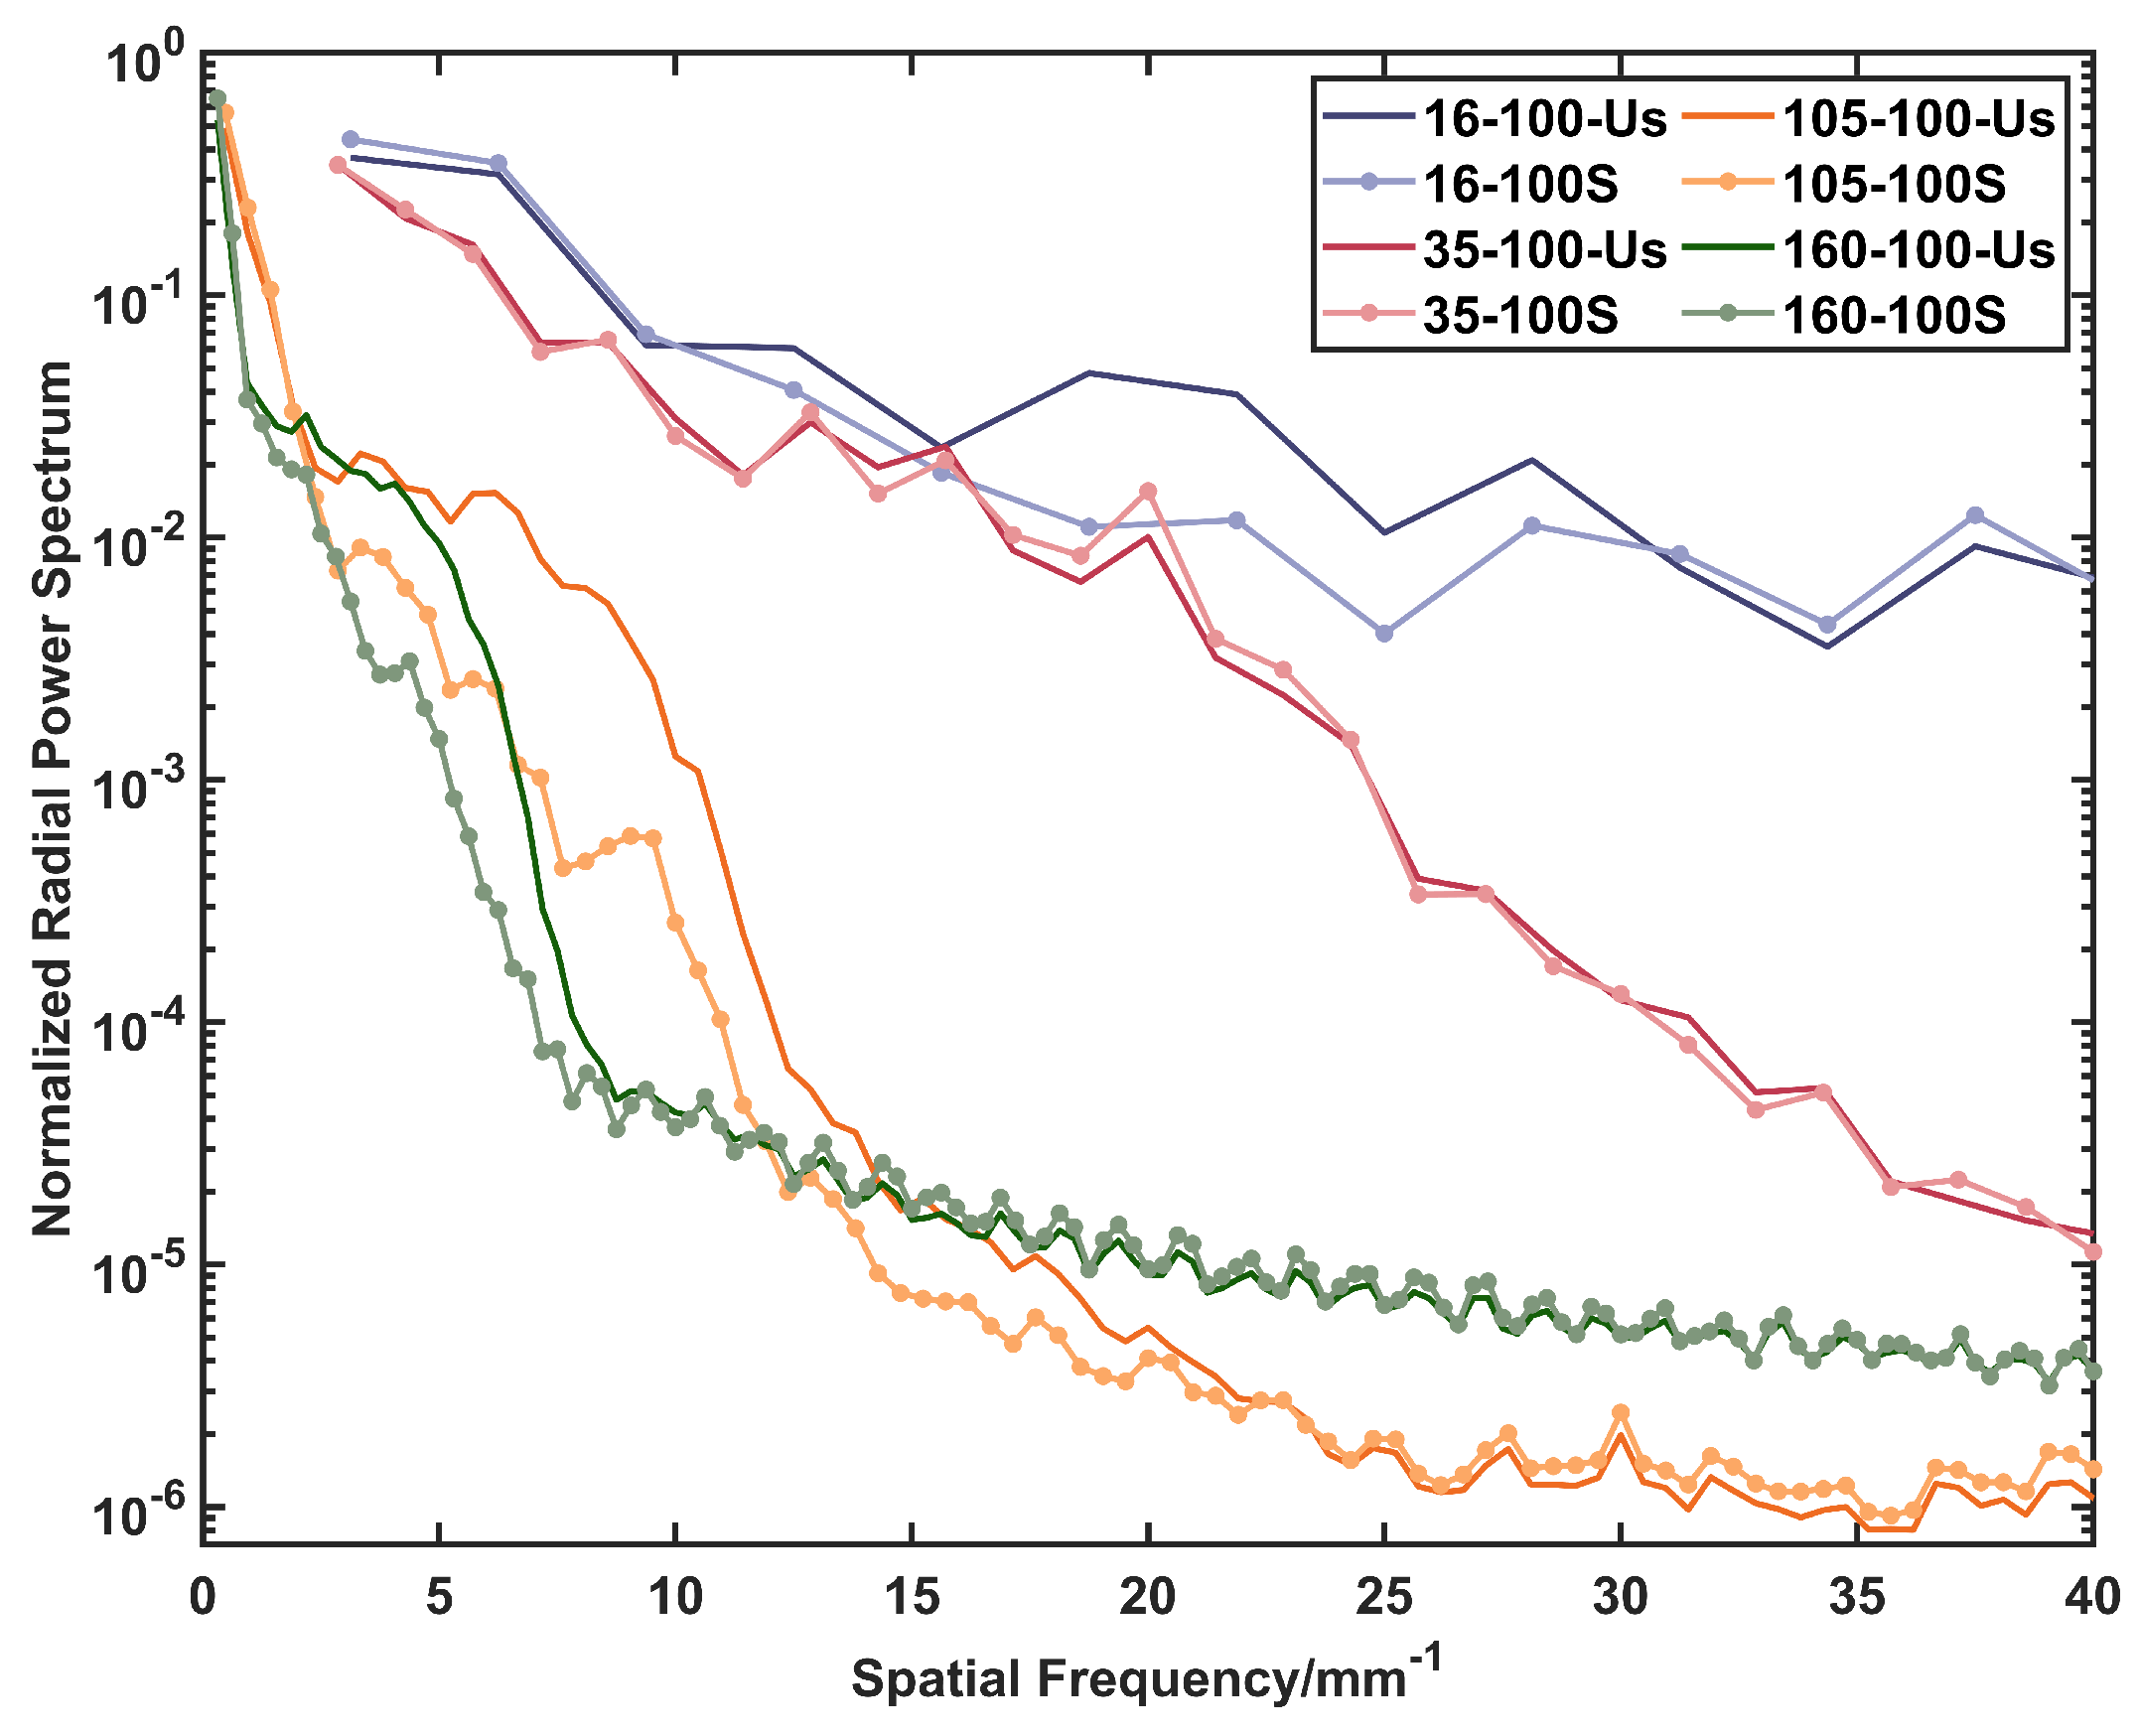
The radial power spectrum is used to describe the effect of speckle suppression. The speckles of four test fibers under an exposure time of 100 s (average gray value of 100 speckles) are shown in Figure 7, and the radial power spectrum of each speckle is shown in Figure 8. The letters Us and S represent the unscrambled and scrambled conditions, respectively. The frequency of an image is an indicator of how drastically the gray value changes. In the radial power spectrum, the smaller the high-frequency component, the less clear the pattern with a drastic change in the speckle gray value, and the better the speckle suppression effect.
In Figure 8, the high-frequency components of the speckle of 16 µm and 35 µm fibers are significantly higher than those of the other two fibers. The mechanical disturbance does not reduce the high-frequency component. The high-frequency component of 105 µm and 160 µm fibers is reduced under mechanical disturbance. At the spatial frequency of 15 mm−1, the high-frequency component of the 105 µm fiber decreases rapidly compared with the 160 µm fiber. According to Figure 7c,d,g,h, this may be due to the uneven energy distribution of the speckle intensity in the 160 µm fiber. This is related to the incident and output end and the bending state of the fiber. When the lower-order mode is excited more, the energy of the speckle is easier to gather in the center of the fiber core. The results show that when the mechanical disturbance system is used, the more the modes propagate in the fiber, and the more likely the speckle is to be suppressed.

3.2. Fiber Focal Ratio Degradation Test

Although the gain in near-field stability obtained from the mode scramblers is satisfactory, it is also important to consider the focal ratio degradation (FRD) of the fiber. This is because that the far-field pattern of the fiber will expand or contract under different levels of stress. The FRD phenomenon is going to decrease the SNR of the spectrograph and increase stray lights.
The CCD method is used to measure the output focal ratio of the tested fiber. The experimental setup is shown in Figure 9. Tungsten–Halogen Light Sources (OSL2, Thorlabs Co., Ltd., USA) with a 35 µm core diameter tail fiber are selected for the broadband illuminator. A 4F system consisting of lenses 1 and 2 (with a focal length of 75 mm) focuses the beam on the input end of the tested fiber. Aperture 1 is used to filter out stray light. The focal ratio of the incident beam into the tested fiber is controlled to F / 5 by changing the diameter of Aperture 2. A CCD with a resolution of 4096 × 4504 and a pixel pitch of 2.4 µm (ME2P-1840-21U3M, Daheng Optics Co., Ltd., CHN.) is applied to photograph the fiber output spot. The forward and backward movement of the CCD is realized by the displacement platform.
In both scrambled and unscrambled conditions, five spot images are recorded by the CCD at five known distances away from the fiber end. The incident focal ratio is set to F / 5 . The energy ratios of 95% (EE95) are selected to calculate the spot diameters at the far field. The test results are shown in Table 3.
Across all tested fibers, the output focal ratio is decreased by less than 0.1 when the fiber is scrambled. Although this does not consider for long-term wear-and-tear effects of agitation on FRD, this result is enough to prove that our scrambled method is gentle enough not to lead to any immediate devastating issues.

3.3. Solar Spectrum Observation

The experimental setup for characterizing the spectral image obtained by different kinds of fibers is shown in Figure 10. A Schmidt–Cassegrain telescope (NexStar 8SE, Celestron Co., Ltd., USA) is used to collect solar light. A 30 m long fiber with a core diameter of 320 µm (YOFC Co., Ltd., CHN) is used to transmit light into the tested fiber. The output light from tested fibers is dispersed by a spectrograph (Omni- λ 750, Zolix Instruments Co., Ltd., CHN) and imaged on the CCD which is mentioned before. A blazed grating with 1200 lines per millimeter is installed in the spectrograph. The dispersion center wavelength is chosen to be 520 nm. Spectra are collected under both unscrambled and scrambled conditions. The exposure time of the CCD is 1 s. The experiments are repeated ten times for each fiber in unscrambled and scrambled conditions. In addition, the solar spectrum is also collected by a 9/125/250 µm fiber (YOFC Co., Ltd., CHN.) with a length of 5 m to provide a calibrated spectrum.
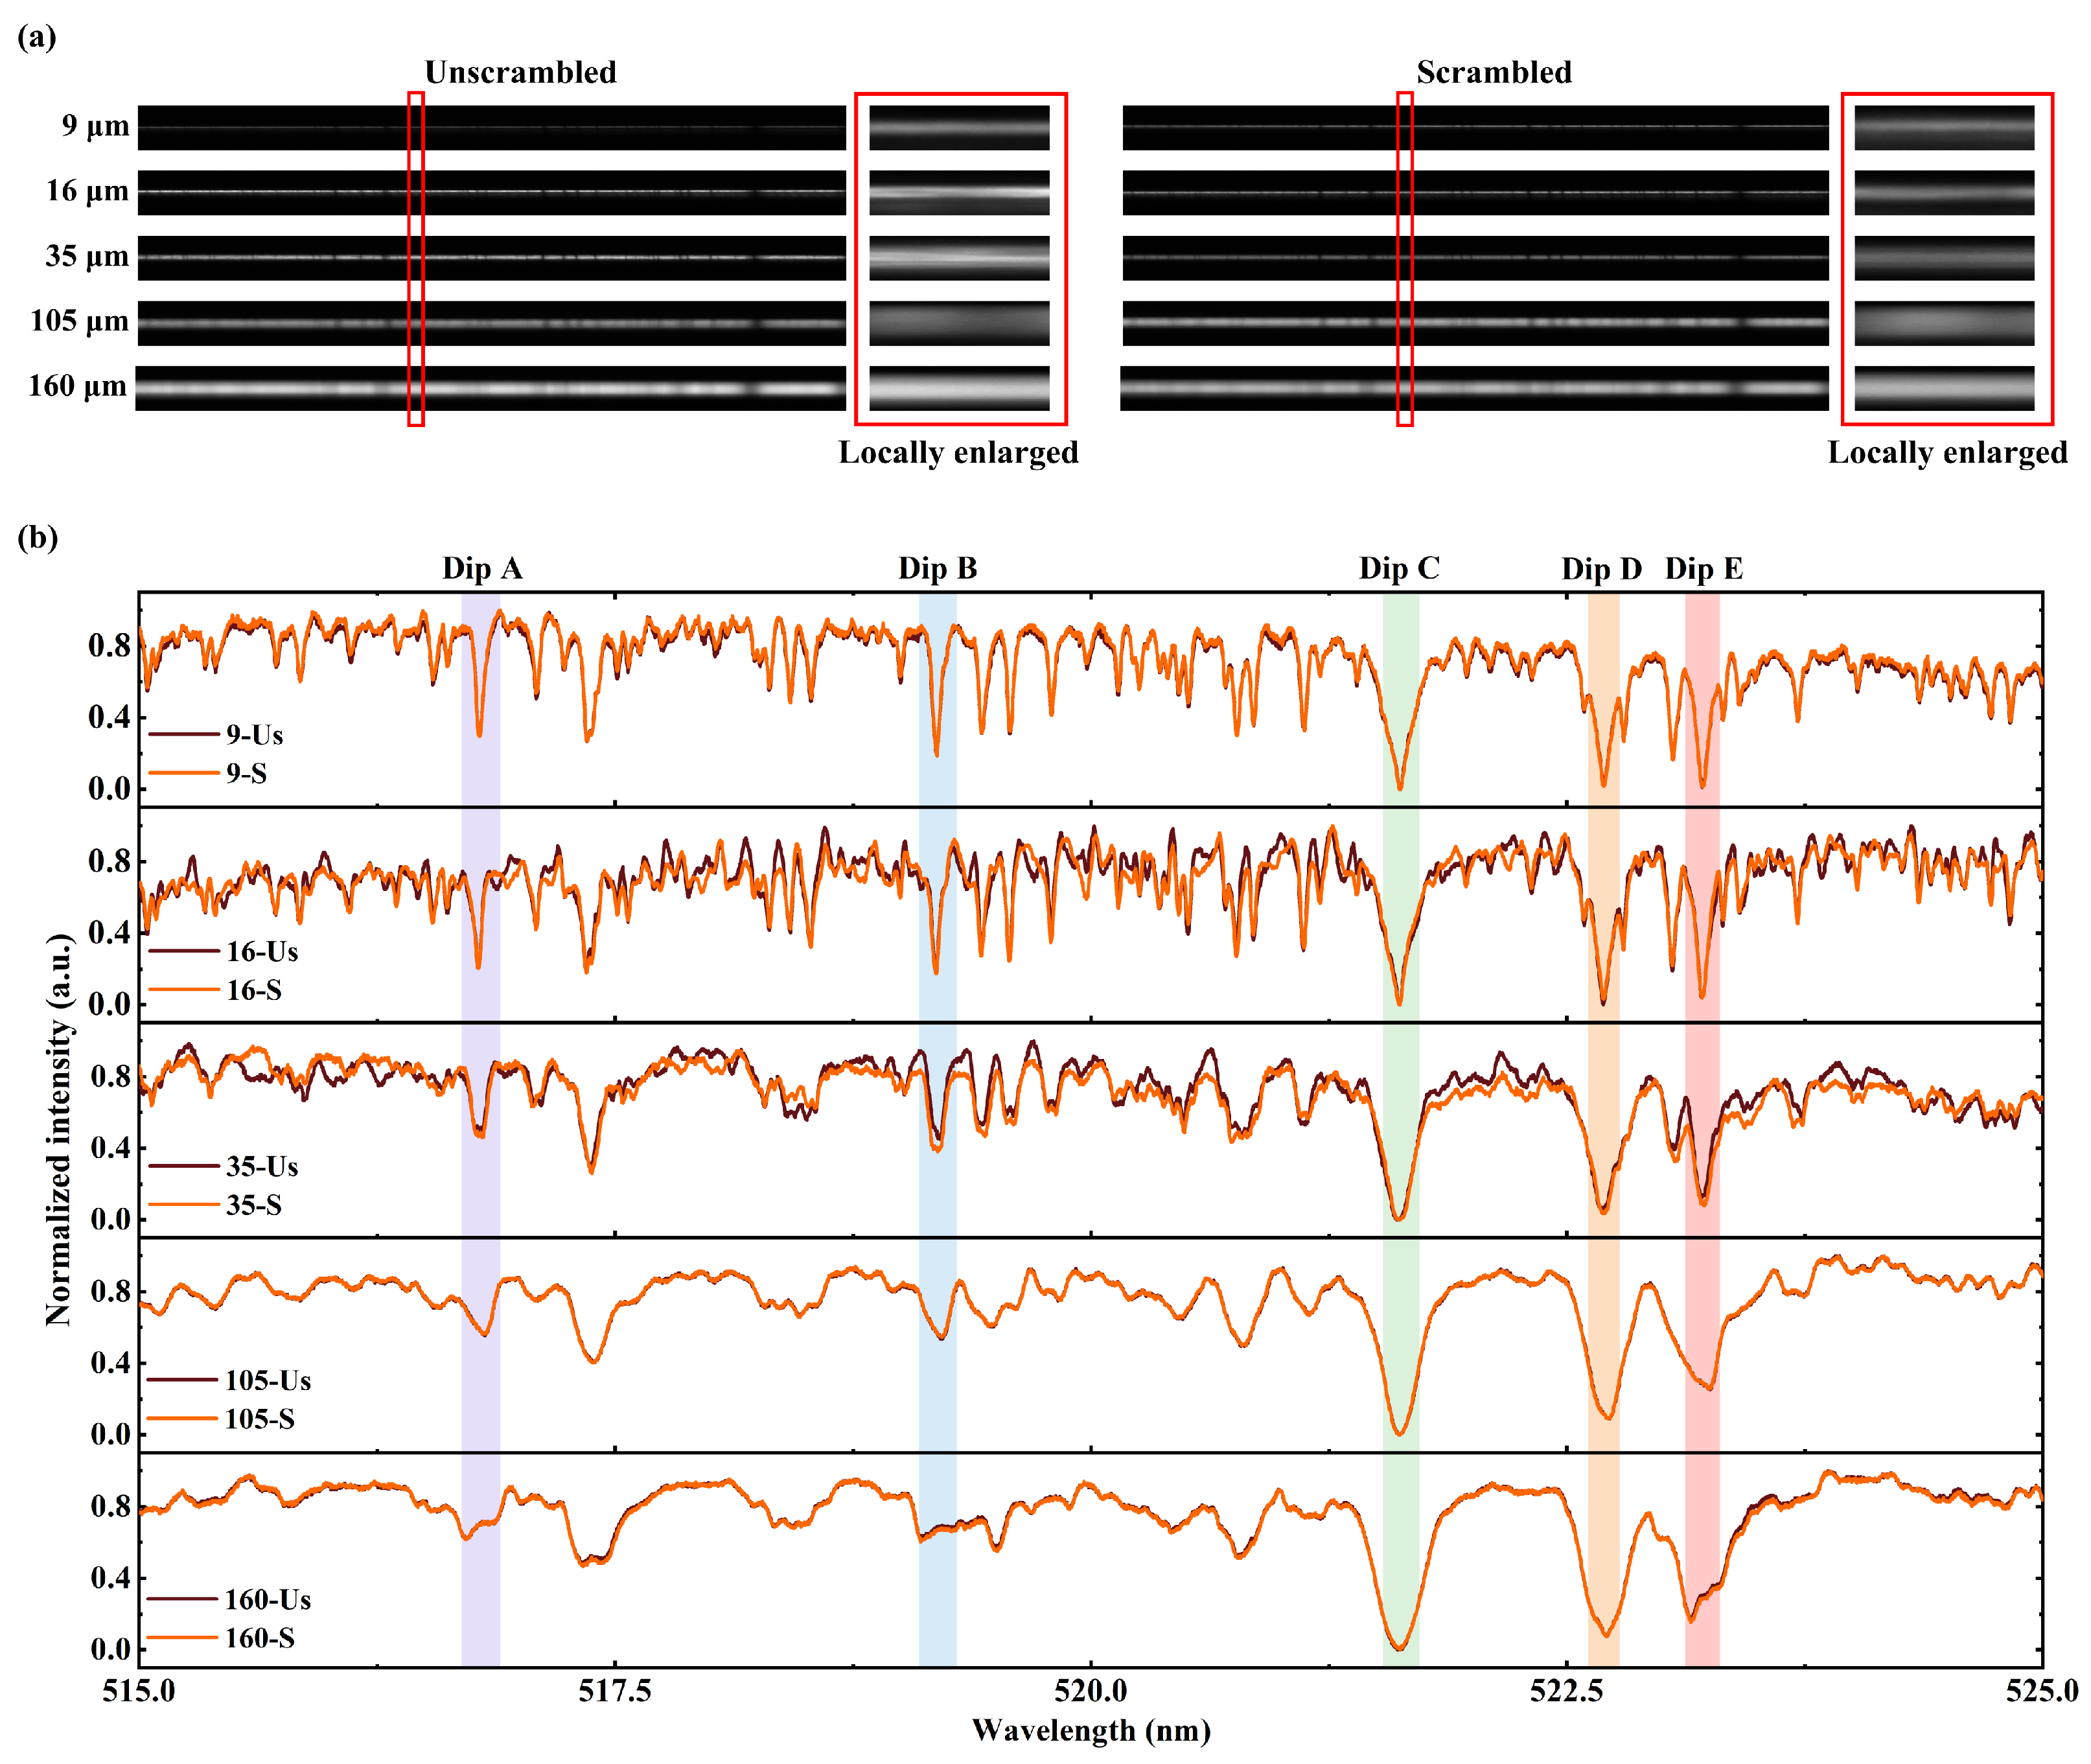
To quantitatively evaluate the influence of speckles on spectral measurement, the four tested fibers and a 9 µm core fiber are used to obtain the solar spectrum under both unscrambled and scrambled conditions. The spectral image and the extracted one-dimensional (1D) spectrum are shown in Figure 11.
Figure 11a indicates that fibers with core diameters of 16 µm and 35 µm exhibit an obviously uneven energy distribution in their spectral images due to the high-contrast speckle pattern. However, for the 9 µm, 105 µm, and 160 µm core fibers, the uneven energy distribution effect is not prominent. The 9 µm core fiber theoretically supports only 85 modes at 520 nm. This means that the speckle-induced centroid offset is difficult to detect. However, for the other two fibers, too many modes are excited. The superposition of a large number of speckle patterns excited by different wavelengths causes the homogenization of the output profile. Thus, these three types of fibers are insensitive to mode noise. Then, the fibers are scrambled. In this case, the uneven energy distribution in the spectra of the 16 µm and 35 µm core fibers is effectively suppressed. The energy distribution perpendicular to the dispersion direction is close to the Gaussian distribution. This proves that the mechanical scrambler does suppress the uneven distribution of energy caused by speckle noise.
We then extract the spectral image to obtain a 1D spectrum in the wavelength range of 515 nm to 525 nm, as shown in Figure 11b. Brown and orange represent the unscrambled and scrambled conditions, respectively. It is obvious that the 9 µm fiber spectrum contains more spectral details. Compared with other fibers, the spectral similarity of the 16 µm and 35 µm fibers before and after disturbance is lower. This indicates that the centroid offset of the speckle formed in these two fibers has a more significant effect on the spectrum. In 105 µm and 160 µm fibers, the dips with low contrast and a narrow full width at half maximum (FWHM) are difficult to recognize accurately.
In the whole band, five dips are selected for the study of wavelength shift. The central wavelength of the dips is determined by the dip-seeking method. Each fiber spectrum is photographed 10 times. The mean and standard deviation of the dips are shown in Figure 12.
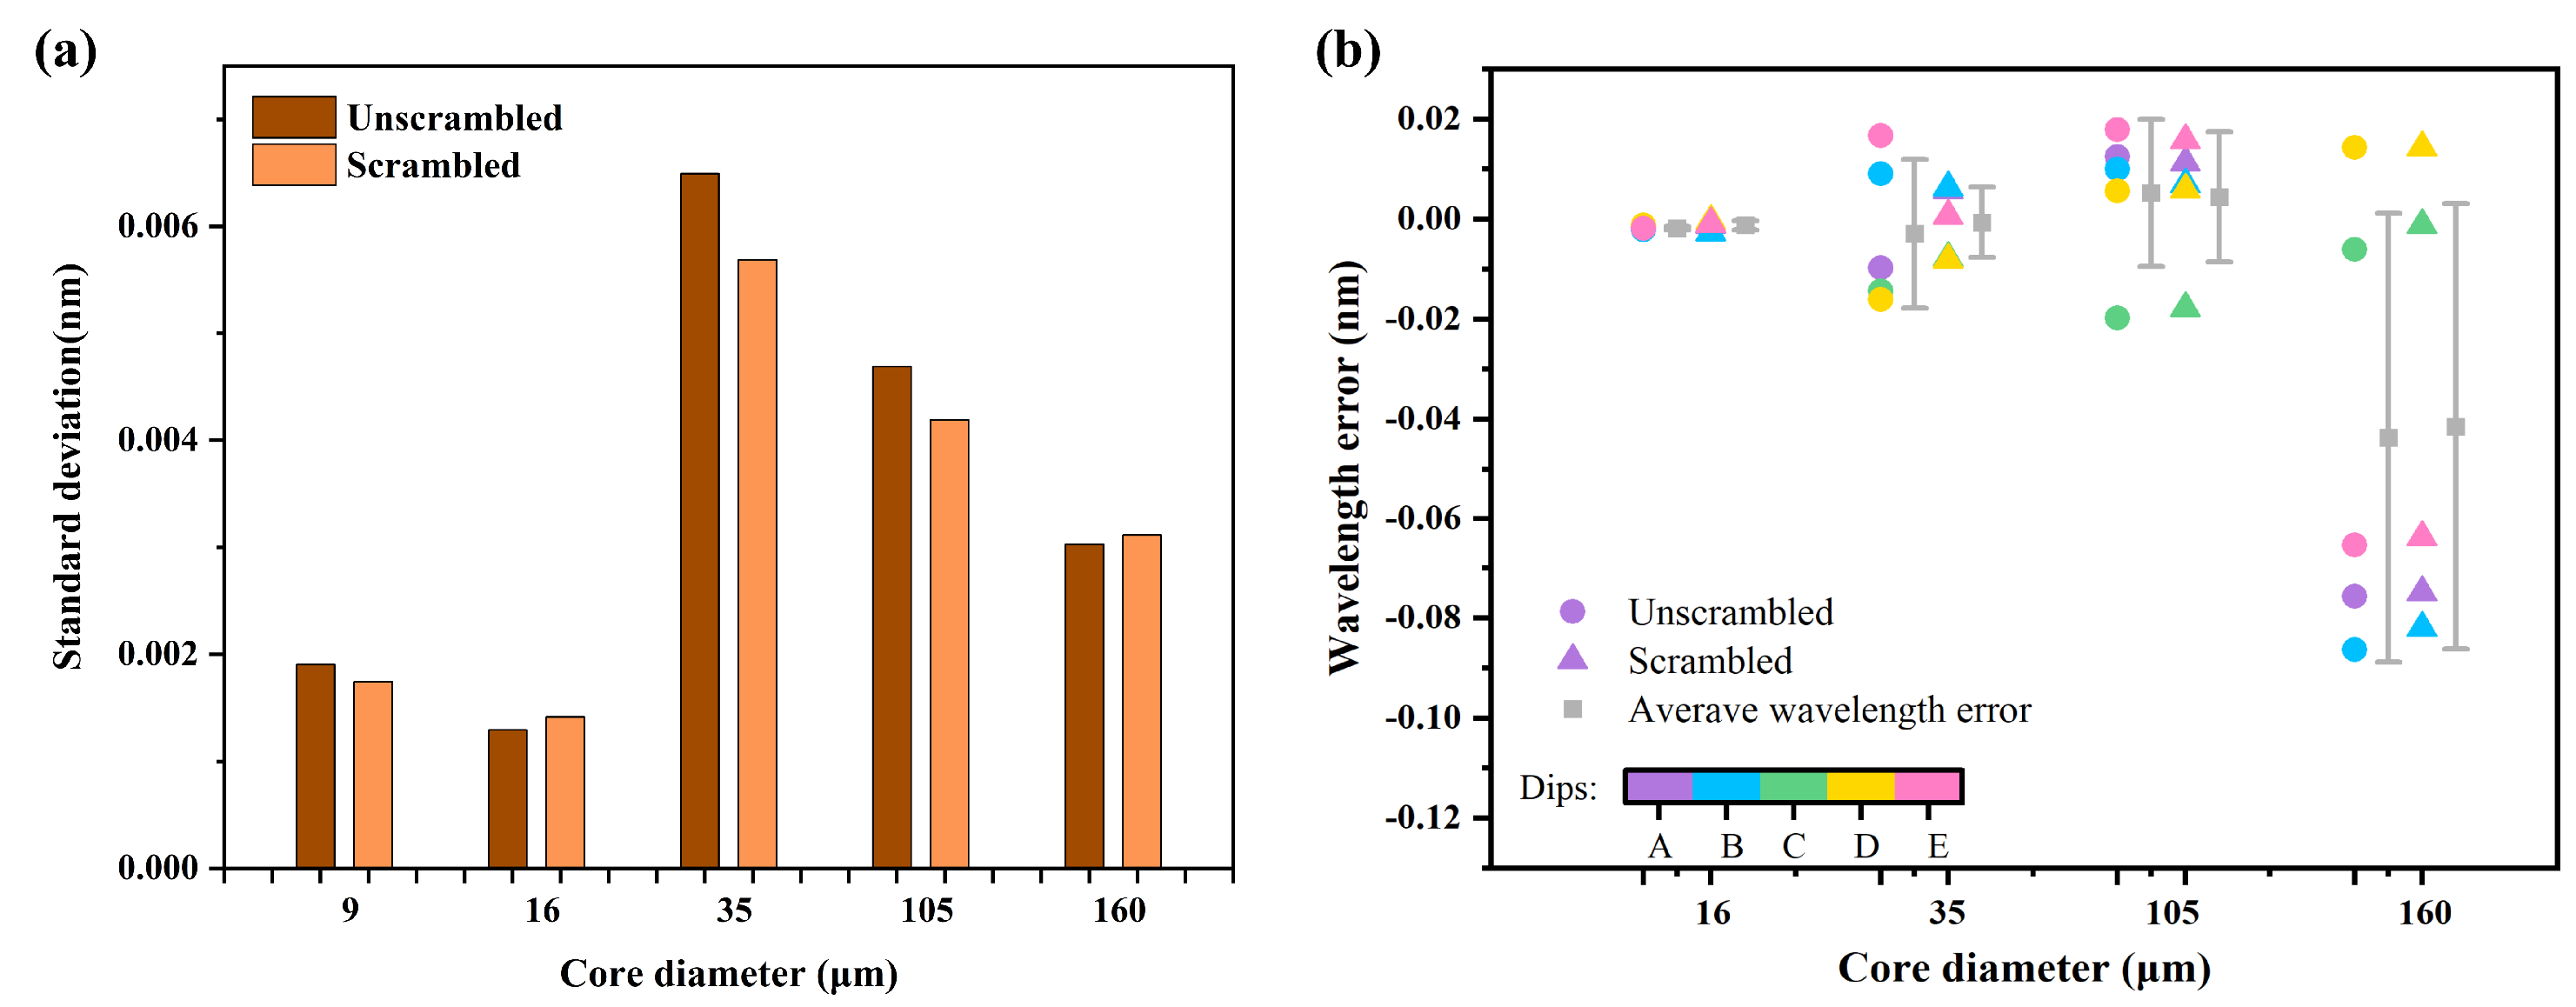
In Figure 12, in most cases, the standard deviation of the dips of the ten spectra is smaller after the disturbance than without the disturbance. This indicates that the mechanical scrambler improves the precision of spectral measurement. It also occurs in cases where the standard deviation before scrambling is smaller than that after scrambling. This may be because the force applied on the fiber is too small under the unscrambled case, resulting in a small offset of the speckle centroid. As shown in Figure 12, the dips of the spectra of the 160 µm fiber and 9 µm fiber differ greatly, such as Dips A, B, and E. As Figure 11 shows, the FWHM of these three dips is smaller than that of Dips C and D. For dips with a narrow FWHM, such as Dip A of the 9 µm fiber, a large-core-diameter fiber will lose spectral details, leading to low spectral resolution.
The standard deviation of the five dips for each fiber is presented in Figure 13a. The average standard deviation of the 35 µm, 105 µm, and 160 µm fibers decreases gradually. This indicates that the fiber with a larger core diameter has higher spectral measurement precision. The reason for the small average standard deviation of the 16 µm fiber may be that the small core diameter and the speckle pattern under this number of propagation modes are less sensitive to the change in external conditions.
To further analyze the drift of each dip of each fiber, the average value of the dip after the disturbance of the 9 µm fiber is used as a reference. The difference between the dip values of the four tested fibers and the reference values is shown in Figure 13b. The five colors represent five dips. Circles and triangles represent the unscrambled and scrambled conditions. As shown in Figure 13b, the difference between the errors of the five dips for the 160 µm fiber is the largest. Combined with Figure 11, the spectrum of the 160 µm fiber is greatly deformed, resulting in a spectral dip shift. Under the unscrambled condition, the shift average values of the five dips of the four tested fibers are −0.0018 nm, −0.0029 nm, 0.0052 nm, and −0.0438 nm. Under the scrambled condition, the shift average values of the five dips are −0.0012 nm, −0.0006 nm, 0.0044 nm, and 0.0415 nm. Small-core-diameter fibers have higher accuracy than large-core-diameter fibers.

4. Discussion

In this paper, based on the phenomenon of non-uniform energy in the FASOT fiber spectrum, the speckles of step fibers with different parameters and their effect on spectral resolution are studied. In the field of astronomy, the influence of “mode noise” on the accuracy of spectral extraction has attracted much attention, which has been reported by U. Lemke [15,33], E. Oliva [16], etc. However, there is no clear explanation for the cause of “mode noise”. Based on the eigenmode expansion method, the fiber speckle and spectrum are simulated, and the simulation results are in good agreement with the test results. It is clear that the fiber speckle is the cause of non-uniform spectral energy distribution, that is, mode noise.
Optical fibers with different parameters are used in different targets for astronomical spectral detection. Petersburg [22], Ishizuka [27], and Raskin [28] have mentioned the behavior of fibers when they are detected in various instruments. The purpose of this paper is to compare the speckles of fibers with different parameters and their characteristics in spectral measurement to provide a reference for the selection of fiber parameters in subsequent fiber spectrum instruments. Fiber speckles are caused by fiber mode interference. Different numbers of propagation modes are generated in multi-mode fibers with different core diameters and numerical apertures. Different modes of propagation correspond to different speckle patterns. When the core diameter and numerical aperture of the fiber are larger, more modes can be propagated in the fiber. Higher-order patterns correspond to more segmented pattern structures, which makes the number of particles in the speckle greater and each particle smaller. When there are few propagation modes in the fiber, the energy is easier to concentrate in one region, which leads to a large centroid offset. And we propose a mechanical scrambler to suppress fiber speckles. It can be seen from the radial power spectrum that the fiber speckle pattern containing fewer modes is not easy to change when the fiber is disturbed by the external environment. The high-frequency component in the radial power spectrum does not decrease after using the mechanical scrambler. In the solar spectrum test, the phenomenon of uneven energy distribution appears in the two-dimensional spectrum of the 16 µm fiber and 35 µm fiber. The speckle of the large particle size makes the phenomenon more obvious. In the extracted one-dimensional spectrum, five dips were selected to analyze the precision and accuracy of the spectrum. Among the four kinds of fiber, the average standard deviation of the dip value of the 35 µm fiber is the largest, and that of the 16 µm fiber is the smallest. The dip value measurement of the 16 µm fiber is also the most accurate. The larger the core diameter, the more obvious the phenomenon of multi-dip fusion, resulting in the decline of measurement accuracy. Therefore, in an instrument such as FASOT used to observe the solar magnetic field, the fiber with a smaller core diameter can be selected, but more attention needs to be paid to the coupling efficiency at the front end of the fiber. In dark astronomical observation, the luminous flux and spectral resolution should be balanced.

5. Conclusions

The parameters of multi-mode optical fibers affect the performance of astronomical fiber instruments, especially for high-resolution spectral instruments. In this paper, four kinds of multi-mode fibers are used to analyze the influence of fiber parameters on speckle and spectral shift. The fiber speckle with a small core diameter and small numerical aperture is more likely to obtain large particles so that the speckle centroid is easy to change. In the large-core fiber speckle, the particle size is smaller and the speckle centroid is more stable. However, the speckle is more sensitive, and it is necessary to pay more attention to the overall deviation of the centroid caused by external conditions such as the uneven end face and bending of the fiber. Then, the mechanical mode scrambler is used to suppress speckles with negligible FRD effects. When the mechanical disturbance method is used, the fiber with a lower transmission mode needs a larger amplitude, higher frequency, and longer exposure time to suppress speckles.
For the fiber spectrum, fibers with different core diameters lead to different overlap areas between fiber-end images of different wavelengths in the spectrograph detector. The spectrum obtained by the fiber with a small core diameter has more details and the spectral dip is identified with high accuracy. The spectrum of fibers with a large core diameter is deformed due to the energy overlap of the fiber-end image, and the spectral resolution is low. However, the measurement precision of the spectrum of large-core-diameter fibers is higher. Therefore, small-core-diameter fibers are suitable for high-accuracy spectral measurements such as material composition measurement. Large-core-diameter fibers are suitable for high-precision spectral measurements such as radial velocity measurement.

Author Contributions

Conceptualization, A.W. and W.S.; methodology, J.W.; software, A.W. and Z.G.; validation, A.W., J.W. and G.Y.; formal analysis, A.W.; investigation, X.C.; resources, Q.Y.; data curation, A.W.; writing—original draft preparation, A.W. and J.W.; writing—review and editing, S.W. and Y.Y.; visualization, A.W. and J.W.; supervision, S.C. and W.S.; project administration, T.G. and W.S.; funding acquisition, Q.Y., T.G. and W.S. All authors have read and agreed to the published version of the manuscript.

Funding

This work was supported by the Joint Research Fund in Astronomy under a cooperative agreement between the National Natural Science Foundation of China (NSFC) and the Chinese Academy of Sciences (CAS) under U2031132 and U1931206; the National Natural Science Foundation of China under 12373088; Shandong Provincial Natural Science Foundation of China under ZR202103070087; and the Fundamental Research Funds for the Central Universities to the Harbin Engineering University under 3072022QBZ2501.

Data Availability Statement

The raw data supporting the conclusions of this article will be made available by the authors on request.

Conflicts of Interest

The authors declare no conflicts of interest.

References

  1. Fang, H.; Xie, Y.; Yuan, Z.; Cai, D.; Zhang, J.; Guo, X.; Tong, L. Parallel fabrication of silica optical microfibers and nanofibers. Light. Adv. Manuf. 2024, 5, 20. [Google Scholar] [CrossRef]
  2. Kronig, L.; Caseiro, S.; Hug, M.; Charif, M.; Bouri, M.; Kneib, J.P. An easily scalable Theta/Phi fiber positioner to reduce risks, lead times and costs for Multi-Object Spectrographs. Adv. Opt. Mech. Technol. Telesc. Instrum. IV 2020, 11451, 1145125. [Google Scholar] [CrossRef]
  3. Yan, H.; Li, H.; Wang, S.; Zong, W.; Yuan, H.; Xiang, M.; Huang, Y.; Xie, J.; Dong, S.; Yuan, H.; et al. Overview of the LAMOST survey in the first decade. Innovation 2022, 3, 100224. [Google Scholar] [CrossRef] [PubMed]
  4. Hahn, C.; Wilson, M.J.; Ruiz-Macias, O.; Cole, S.; Weinberg, D.H.; Moustakas, J.; Kremin, A.; Tinker, J.L.; Smith, A.; Wechsler, R.H.; et al. The DESI Bright Galaxy Survey: Final Target Selection, Design, and Validation. Astron. J. 2023, 165, 253. [Google Scholar] [CrossRef]
  5. Jaeggli, S.A.; Lin, H.; Onaka, P.; Yamada, H.; Anan, T.; Bonnet, M.; Ching, G.; Huang, X.P.; Kramar, M.; McGregor, H.; et al. The Diffraction-Limited Near-Infrared Spectropolarimeter (DL-NIRSP) of the Daniel K. Inouye Solar Telescope (DKIST). Sol. Phys. 2022, 297, 137. [Google Scholar] [CrossRef]
  6. Sun, W.; Chen, X.; Yan, Q.; Geng, T.; Yan, Y.; Wang, S.; Wang, A.; Wang, J.; Jin, X.; Jiang, H.; et al. Fiber Integral Field Unit System for Measurement of Solar Spectrum. Spectrosc. Spectr. Anal. 2023, 43, 1168–1174. [Google Scholar] [CrossRef]
  7. Lee, B.C.; Do, H.; Park, M.; Lim, B.; Choi, Y.; Koo, J.; Bang, T.; Oh, H.; Han, I.; Chang, H. The detection of substellar companions around HD 6860 and HD 112300. Astron. Astrophys. 2023, 678, A106. [Google Scholar] [CrossRef]
  8. McConnachie, A.W.; Hayes, C.R.; Robertson, J.G.; Pazder, J.; Ireland, M.; Burley, G.; Churilov, V.; Lothrop, J.; Zhelem, R.; Kalari, V.; et al. The Science Performance of the Gemini High Resolution Optical Spectrograph. Publ. Astron. Soc. Pac. 2024, 136, 035001. [Google Scholar] [CrossRef]
  9. Qu, Z.Q. A Fiber Arrayed Solar Optical Telescope (FASOT). In Proceedings of the 6th Solar Polarization Workshop, Maui, HI, USA, 30 May–4 June 2010; Astronomical Society of the Pacific Conference Series. Astronomical Society of the Pacific: San Francisco, CA, USA, 2011; Volume 437, pp. 423–432. [Google Scholar]
  10. Bechter, A.; Crass, J.; Ketterer, R.; Crepp, J.R.; Reynolds, R.O.; Bechter, E.; Hinz, P.; Pedichini, F.; Foley, M.; Runburg, E.; et al. On-sky single-mode fiber coupling measurements at the Large Binocular Telescope. In Proceedings of the Adaptive Optics Systems V, Edinburgh, Scotland, 26 June–1 July 2016; Marchetti, E., Close, L.M., Véran, J.P., Eds.; Society of Photo-Optical Instrumentation Engineers (SPIE) Conference Series. SPIE: Bellingham, WA, USA, 2016; Volume 9909, p. 99092X. [Google Scholar] [CrossRef]
  11. Delorme, J.R.; Jovanovic, N.; Echeverri, D.; Mawet, D.; Wallace, J.K.; Bartos, R.D.; Cetre, S.; Wizinowich, P.; Ragland, S.; Lilley, S.; et al. Keck Planet Imager and Characterizer: A dedicated single-mode fiber injection unit for high-resolution exoplanet spectroscopy. J. Astron. Telesc. Instruments Syst. 2021, 7, 035006. [Google Scholar] [CrossRef]
  12. Wang, T.; Li, Y.; Xu, B.; Mao, B.; Qiu, Y.; Meng, Y. High-resolution wavemeter based on polarization modulation of fiber speckles. APL Photonics 2020, 5, 126101. [Google Scholar] [CrossRef]
  13. Takahara, H. Visibility of speckle patterns: Effect of the optical guide length in coherent light. Appl. Opt. 1976, 15, 610. [Google Scholar] [CrossRef] [PubMed]
  14. Baudrand, J.; Walker, G.A.H. Modal noise in high-resolution, fiber-fed spectra: A study and simple cure. Publ. Astron. Soc. Pac. 2001, 113, 851–858. [Google Scholar] [CrossRef]
  15. Lemke, U.; Corbett, J.; Allington-Smith, J.; Murray, G. Modal noise prediction in fibre spectroscopy—I. Visibility and the coherent model. Mon. Not. R. Astron. Soc. 2011, 417, 689–697. [Google Scholar] [CrossRef]
  16. Oliva, E.; Rainer, M.; Tozzi, A.; Sanna, N.; Iuzzolino, M.; Brucalassi, A. Experimental characterization of modal noise in multimode fibers for astronomical spectrometers. Astron. Astrophys. 2019, 632, A21. [Google Scholar] [CrossRef]
  17. Yan, Y.; Yan, Q.; Wang, G.; Sun, W.; Luo, A.; Ma, Z.; Zhang, Q.; Li, J.; Wang, S. DEEM, a versatile platform of FRD measurement for highly multiplexed fibre systems in astronomy. Mon. Not. R. Astron. Soc. 2018, 476, 4279–4314. [Google Scholar] [CrossRef]
  18. Kim, J.; Miller, D.T.; Kim, E.; Oh, S.; Oh, J.; Milner, T.E. Optical coherence tomography speckle reduction by a partially spatially coherent source. J. Biomed. Opt. 2005, 10, 064034. [Google Scholar] [CrossRef]
  19. Redding, B.; Cao, H. Using a multimode fiber as a high-resolution, low-loss spectrometer. Opt. Lett. 2012, 37, 3384–3386. [Google Scholar] [CrossRef]
  20. Zhou, W.; Liu, Z.; Sun, Y.; Teng, H.; Wang, W.; Bayanheshig; Li, W. Bidirectional Littrow double grating interferometry for quadruple optical interpolation. Opt. Laser Technol. 2024, 175, 110751. [Google Scholar] [CrossRef]
  21. Zhang, J.; Jirigalantu; Yu, S.; Wang, Y.; Yu, H.; Li, W. Research on manufacturing technology of nanoimprinted grating. J. Manuf. Process. 2024, 131, 891–909. [Google Scholar] [CrossRef]
  22. Petersburg, R.R.; McCracken, T.M.; Eggerman, D.; Jurgenson, C.A.; Sawyer, D.; Szymkowiak, A.E.; Fischer, D.A. Modal Noise Mitigation through Fiber Agitation for Fiber-fed Radial Velocity Spectrographs. Astrophys. J. 2018, 853, 181. [Google Scholar] [CrossRef]
  23. Sirk, M.M.; Wishnow, E.H.; Weisfeiler, M.; Jhoti, E.; Curtis, J.; Ishikawa, Y.; Finstad, D.; O’Hanlon, T.; Gibson, S.R.; Edelstein, J.; et al. An Optical Fiber Double Scrambler and Mechanical Agitator System for the Keck Planet Finder Spectrograph. In Proceedings of the Conference on Ground-Based and Airborne Instrumentation for Astronomy VII, Austin, TX, USA, 10–15 June 2018; Proceedings of SPIE. SPIE: Bellingham, WA, USA, 2018; Volume 10702, p. 107026. [Google Scholar] [CrossRef]
  24. Sablowski, D.P.; Plüschke, D.; Weber, M.; Strassmeier, K.G.; Järvinen, A. Comparing modal noise and FRD of circular and non-circular cross-section fibres. Astron. Nachrichten 2016, 337, 216–225. [Google Scholar] [CrossRef]
  25. Plavchan, P.P.; Bottom, M.; Gao, P.; Wallace, J.K.; Mennesson, B.; Ciardi, D.; Crawford, S.; Lin, S.; Beichman, C.; Brinkworth, C.; et al. Precision near-infrared radial velocity instrumentation II: Non-Circular Core Fiber Scrambler. Tech. Instrum. Detect. Exopl. VI 2013, 8864, 88640g. [Google Scholar] [CrossRef]
  26. Wang, Y.; Zhong, L.; Lau, K.Y.; Han, X.; Yang, Y.; Hu, J.; Firstov, S.; Chen, Z.; Ma, Z.; Tong, L.; et al. Precise mode control of laser-written waveguides for broadband, low-dispersion 3D integrated optics. Light. Sci. Appl. 2024, 13, 130. [Google Scholar] [CrossRef]
  27. Ishizuka, M.; Kotani, T.; Nishikawa, J.; Kurokawa, T.; Mori, T.; Kokubo, T.; Tamura, M. Fiber Mode Scrambler for the Subaru Infrared Doppler Instrument (IRD). Publ. Astron. Soc. Pac. 2018, 130, 065003. [Google Scholar] [CrossRef]
  28. Raskin, G.; Pember, J.; Rogozin, D.; Schwab, C.; Coutts, D. Fiber modal noise mitigation by a rotating double scrambler. In Proceedings of the Conference on Advances in Optical and Mechanical Technologies for Telescopes and Instrumentation IV, Online, 14–18 December 2020; Society of Photo-Optical Instrumentation Engineers (SPIE) Conference Series. SPIE: Bellingham, WA, USA, 2020; Volume 11451, p. 114516F. [Google Scholar] [CrossRef]
  29. Norris, B.; Betters, C.; Wei, J.; Yerolatsitis, S.; Amezcua-correa, R.; Leon-saval, S. Optimal broadband starlight injection into a single-mode fibre with integrated photonic wavefront sensing. Opt. Express 2022, 30, 34908–34917. [Google Scholar] [CrossRef] [PubMed]
  30. Wang, A.; Wang, J.; Yang, X.; Wang, S.; Yan, Y.; Yan, Q.; Lu, C.; Li, S.; Geng, T.; Sun, W.; et al. A Fast and High-precision Alignment Method for IFU Based on Optical Interferometry and Fresnel Diffraction. Publ. Astron. Soc. Pac. 2022, 134, 104503. [Google Scholar] [CrossRef]
  31. Hernandez, E.; Roth, M.M.; Petermann, K.; Kelz, A.; Moralejo, B.; Madhav, K. Mode expansion theory and application in step-index multimode fibers for astronomical spectroscopy. J. Opt. Soc. Am. B Opt. Phys. 2021, 38, A36–A50. [Google Scholar] [CrossRef]
  32. Shi, B.; Zhang, C.; Kelly, T.; Wei, X.; Ding, M.; Huang, M.; Fu, S.; Poletti, F.; Radan, S. Splicing Hollow-Core Fiber with Standard Glass-Core Fiber with Ultralow Back-Reflection and Low Coupling Loss. ACS Photonics 2024, 11, 3288–3295. [Google Scholar] [CrossRef]
  33. Lemke, U.; Corbett, J.; Allington-Smith, J.; Murray, G. Characterising modal noise in fibre-coupled spectrographs for astronomy. In Proceedings of the Modern Technologies in Space- and Ground-Based Telescopes and Instrumentation, Amsterdam, The Netherlands, 1–6 July 2012; Society of Photo-Optical Instrumentation Engineers (SPIE) Conference Series. SPIE: Bellingham, WA, USA, 2010; Volume 7739, p. 773924. [Google Scholar] [CrossRef]
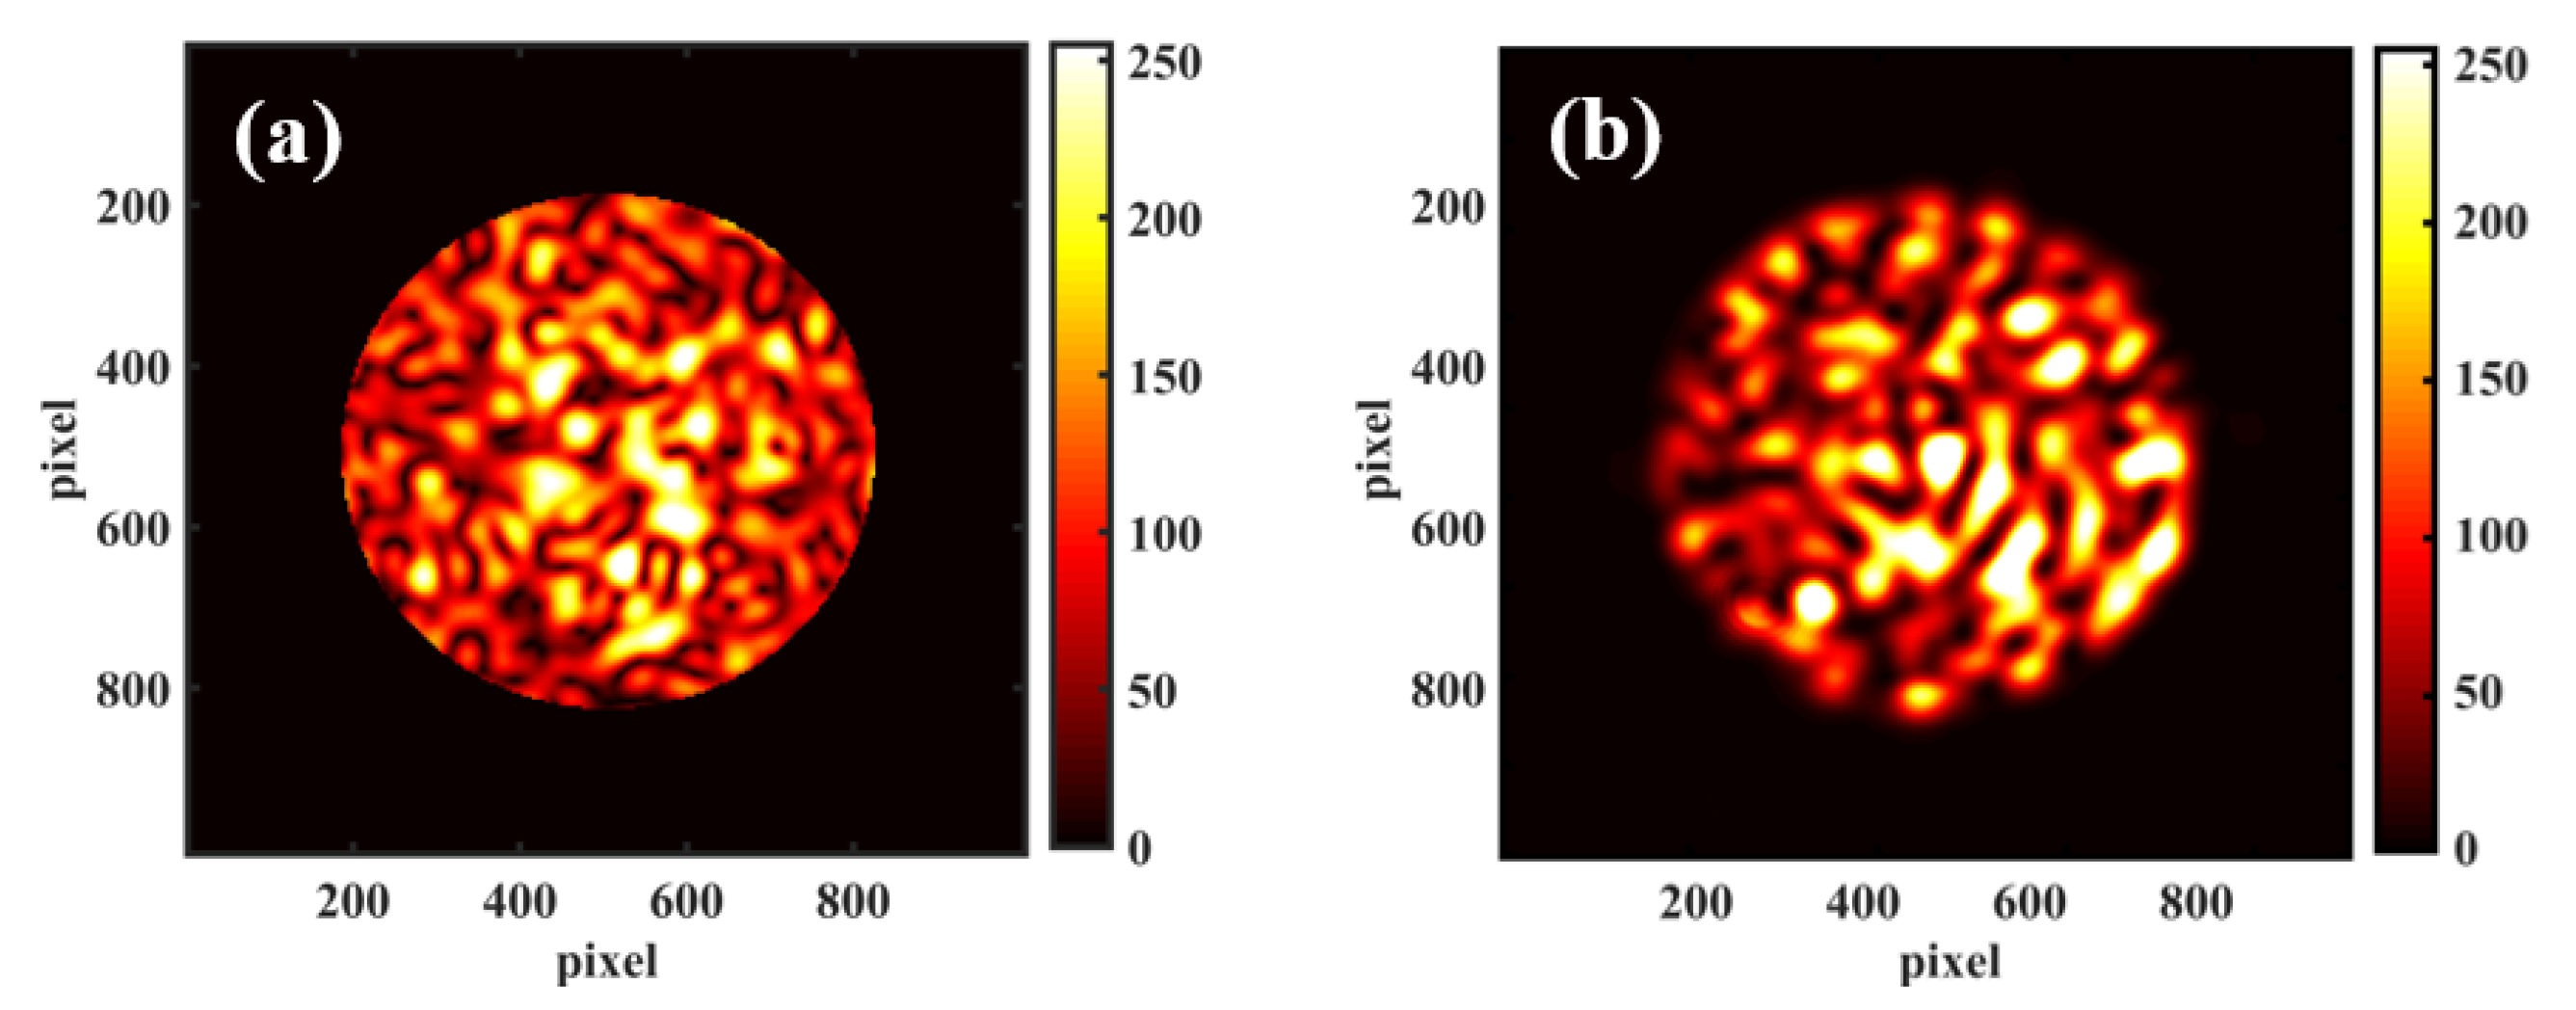
Figure 1. The near-field speckle pattern of a 35 µm fiber at 520 nm wavelength. (a) Fiber speckle simulated by the EEM. (b) Fiber speckle measured by a CCD.
Photonics 11 01056 g001
Figure 2. Radial power spectrum of simulated speckle and experimental speckle.
Photonics 11 01056 g002
Figure 3. The fiber spectrum of the 35 µm fiber near 520 nm. (a) Fiber spectrum simulated by the EEM. (b) Fiber spectrum measured by spectrograph.
Photonics 11 01056 g003
Figure 4. Experimental setup of fiber speckle test.
Photonics 11 01056 g004
Figure 5. The near-field speckles and centroid offsets under unscrambled conditions. (ah) are the near-field speckles and centroid offset of fibers with the core diameter of 16 µm, 35 µm, 105 µm, and 160 µm.
Photonics 11 01056 g005
Figure 6. The near-field speckles and centroid offsets under scrambled conditions. (ah) are the near-field speckles and centroid offsets of fibers with the core diameter of 16 µm, 35 µm, 105 µm, and 160 µm.
Photonics 11 01056 g006
Figure 7. Speckle pattern of tested fibers at 100 s exposure time. (ad) and (eh) are the speckle patterns with core diameters of 16 µm, 35 µm, 105 µm, and 160 µm under unscrambled and scrambled conditions, respectively.
Photonics 11 01056 g007
Figure 8. Radial power spectrum of test fibers under unscrambled and scrambled conditions.
Photonics 11 01056 g008
Figure 9. Experimental setup for FRD test.
Photonics 11 01056 g009
Figure 10. Experimental setup of fiber spectrum test. (a) The telescope for collecting sunlight. (b) Mechanical scrambler. (c) Spectrograph and imaging devices.
Photonics 11 01056 g010
Figure 11. Test results of different fibers on the solar spectrum. (a) Fiber spectral images under unscrambled and scrambled conditions. (b) The 1D spectrum after extraction.
Photonics 11 01056 g011
Figure 12. The mean and standard deviation of the dips.
Photonics 11 01056 g012
Figure 13. Test results of five dips. (a) The average standard deviation of the five dips of the fiber. (b) Wavelength error of four tested fibers with respect to the dip value of the 9 µm core fiber.
Photonics 11 01056 g013
Table 1. The parameters of the fibers used in astronomical projects.
Astronomical ProjectDiameter of FibersNumerical Aperture
MEGERA [2]100 µm0.2 ± 0.02
LAMOST [3]320 µm0.22
DESI [4]107 µm0.22
BiFOIS [5]29 × 5 µm (Rectangular core)0.25
BOES [7]100 µm0.2 ± 0.02
GHOST [8]53 µm0.2 ± 0.02
FASOT [9]35 µm0.12
LBT [10]5.8 µm0.14 ± 0.01
KPIC [11]6.5 µm0.2 ± 0.02
Table 2. Fiber parameters for fiber speckle testing.
No.Core Diameter (µm)Cladding Diameter (µm)Coating Diameter (µm)N.A.Length (m)
1161252450.125
2351101250.125
31051251900.225
41601753000.225
Table 3. FRD of the tested fiber.
Core Diameter16 µm35 µm105 µm160 µm
Unscrambled F / 3.34 F / 4.76 F / 3.65 F / 4.27
Scrambled F / 3.28 F / 4.66 F / 3.62 F / 4.23
Disclaimer/Publisher’s Note: The statements, opinions and data contained in all publications are solely those of the individual author(s) and contributor(s) and not of MDPI and/or the editor(s). MDPI and/or the editor(s) disclaim responsibility for any injury to people or property resulting from any ideas, methods, instructions or products referred to in the content.