1. Introduction
With the development of optical fiber communication technologies, metropolitan area and inter-datacenter optical network traffic keeps growing rapidly [
1,
2]. However, as the available spectrum in the C and L bands will be almost fully utilized, it is difficult to increase the system capacity by increasing the number of multiplexed wavelengths or reducing the channel spacing in wavelength division multiplexing (WDM) systems. FTN coherent optical transmission technology is expected to solve the above problems, in which spectrum efficiency (SE) is improved through tight filtering [
3,
4]. However, the tight filtering introduces inter-symbol interference (ISI) so severe that the carrier phase estimation (CPE) algorithm of the FTN systems is more sensitive to phase noise. Employing distributed feedback (DFB) lasers offers more affordable capital expenditure than external cavity lasers (ECLs) in metropolitan areas and inter-datacenter optical systems. Equalization-enhanced phase noise (EEPN) originates from the interaction between local oscillator (LO) laser phase noise (LPN) and receiver-side electronic chromatic dispersion compensation (CDC) [
5,
6]. The system performance damage caused by EEPN increases with the increase in the LO laser linewidth (LLW), symbol rate, and accumulated chromatic dispersion (CD) [
5,
7]. Especially for the high symbol-rate FTN systems studied, EEPN will lead to system performance degradation. Therefore, a DSP algorithm that compensates for EEPN is necessary in FTN systems.
Several EEPN mitigation algorithms have been reported. A digital coherence enhancement (DCE) technique has been proposed and verified in a single-carrier system, which is able to significantly reduce the phase noise of the transmitter (Tx) or LO lasers by using an interferometer device and corresponding DSP processing [
8]. An algorithm that compensates for EEPN based on a time-varying FIR filter was proposed in [
9]. As part of the EEPN could be coarsely characterized as an additive white Gaussian noise (AWGN) [
10], performing blind phase searching (BPS) on payload signal mitigates a part of the EEPN because block averaging could smooth AWGN [
11]. An algorithm that compensates for EEPN by digital linear interpolation is proposed in [
12]. However, this algorithm needs a low-speed digital coherence enhancement frontend besides the coherent receiver headend, resulting in a higher implementation cost. A dual reference sub-carrier algorithm based on training symbols is proposed in [
13] to estimate Tx and LO LPN separately. Based on the dual reference sub-carrier algorithm, an improved algorithm is proposed in [
14]. It aims to improve the performance of the dual reference sub-carrier algorithm under small EEPN by adding an adjustable coefficient for LPN reconstruction. An interleaved dual pilot tone scheme is introduced in [
15]. This scheme realizes Tx and LO LPN estimation using dual pilot tones and compensates for LO LPN before CDC to mitigate EEPN. Ref. [
16] proposed an aperture-based neural network that could effectively suppress fiber nonlinear effects and tolerate EEPN. However, there are few reports on EEPN inhibition in FTN systems. In the metropolitan area networks and datacenter optical interconnection networks with large linewidth DFB as Tx and LO laser, EEPN will cause a more serious cycle slip of the CPE algorithm, which will significantly degrade the performance of the system. We previously designed a training sequence-based cycle slip suppression carrier phase estimation (TS-CSS) algorithm to solve the serious cycle slip problem caused by serious ISI filtering in FTN systems [
17]. The TS-CSS algorithm first uses the BPS algorithm to estimate the carrier phase of the received signal, and then performs cycle detection and correction according to the symbol of the training sequence. However, the TS-CSS algorithm is difficult to work with in the presence of EEPN. In conclusion, in FTN systems using large linewidth DFB as Tx and LO lasers, it is necessary to design an enhanced carrier recovery algorithm to mitigate EEPN.
In this paper, an enhanced carrier phase recovery using dual pilot tones is proposed to mitigate EEPN while suppressing the cycle slip of CPE. The proposed algorithm aims to effectively mitigate EEPN without sacrificing spectral efficiency or increasing the computational complexity of the receiver DSP algorithm. The remainder of this paper is structured as follows: The enhanced carrier phase recovery based on dual pilot tones is described in
Section 2. In
Section 3, the influences of the key parameters of the proposed algorithm are simulated and discussed. Then, the system performance of FTN systems with the proposed algorithm is verified under optimized parameters. In
Section 4, the computational complexity of the proposed algorithm is analyzed. The proposed algorithm is also verified through experiments in
Section 5. The main conclusion of this paper is finally drawn in
Section 6.
2. Principle of the Proposed Algorithm
Usually, an electronic equalizer is used to compensate for CD in FTN systems to reduce the computational complexity. However, LO LPN does not suffer from any CD distortion but still experiences CDC, thereby resulting in EEPN. Considering those phase noise features of the FTN systems, a separation estimation of Tx and LO LPN with the presence of CD is needed to mitigate EEPN.
The block diagram for FTN systems with the proposed algorithm is depicted in
Figure 1. In the Tx DSP, FTN shaping is realized by root-raised cosine (RRC). In the time domain, the pilot tones are generated and inserted into the FTN signal as shown in
Figure 1a. The pilot tone to signal power ratio (PSR) and pilot tone initial phase are configured by Tx DSP. The proposed algorithm could estimate Tx and LO LPN, respectively, based on dual pilot tones. Considering the low-frequency cut-off characteristics of the actual transmitters and receivers due to the AC coupling design and reducing the effect of pilot tone on payload signals, the low-frequency pilot tone should be inserted at the low frequency of the signal. In order to reduce the impact of the high-frequency pilot tone on the payload signal, the high-frequency pilot tone should be inserted at the roll-off of the signal. Since the pilot tone in the proposed algorithm is inserted after FTN shaping, the ISI caused by FTN shaping is not affected when inserting the pilot tone. And ISI caused by FTN strong filtering is linear damage, no new spectral components are generated in the signal spectrum, and the signal spectrum is not broadened, so the pilot tone is not affected by ISI. Therefore, estimating LPN based on dual pilot tones could avoid the cycle slip problem. At the receiver side, the transmitted signal distorted by CD is converted into a digital signal by the optical coherent receiver. After CDC, not only the transmitting signal and Tx LPN that were damaged by CD were compensated for the CD damage, but also the LO LPN that was not damaged by CD was compensated, thus producing EEPN. Dual pilot tones are located by searching the peak of the spectrum of the received signal and the frequency offset estimation (FOE) is realized based on dual pilot tones. Then, the pilot tones are separated from the payload signal employing bandpass filters with a bandwidth called pilot tone extraction bandwidth in the following sections of the paper. The detailed estimation method based on the dual pilot tones shall be given later in this section, as shown in
Figure 1b. With the estimated Tx and LO LPN from the pilot tones, the interaction between LO LPN and CDC for FTN signal could be handled, thus mitigating EEPN for the FTN systems.
The pilot tones are only inserted in one polarization to complete polarization de-multiplexing; in the frequency domain, the pilot tone signal could be denoted by
, where
is the amplitude of the pilot tone, and
is the frequency of the pilot tone. The transmitted pilot tone and the received pilot tone could be expressed as shown below with the Jones matrix:
denotes the laser phase noise, and
is the Jones matrix in the above equation. Then, the estimated equivalent Jones matrix
could be calculated as shown below:
The affection of polarization rotation could be mitigated by left multiplying the inverse Jones matrix, as introduced in [
18].
The enhanced carrier phase recovery based on the dual pilot tone estimation of the Tx and LO LPN is shown in
Figure 1a. The filtered pilot tones are transformed into the time domain to estimate LPN with N smoothing taps. The CD effect in transmission introduces frequency-dependent time delay as given in Equation (3), where
L represents the transmission length,
is the group velocity dispersion coefficient, and
denotes the frequency interval between spectrum components.
According to Equation (3), the CD-induced time delay between two pilot tones is
, where
represents the frequency interval of the two pilot tones. Since the pilot tones are filtered out from the payload after CDC, the LO LPN on pilot tones is distorted by CD, and the Tx LPN on pilot tones receives no distortion. That means there is a CD-induced phase noise difference between LO LPN on the pilot tone for the two pilot tones, while the Tx LPN for the pilot tones is the same. Considering this feature, the LPN on the two pilot tones could be given by
and
in Equation (4).
In the equation above,
and
are Tx and LO LPN, respectively;
is the symbol period; and
is the sample sequence number. By performing subtraction between
and
,
is canceled, as shown in Equation (5). This allows a separated Tx LPN estimation from the LO LPN.
represents the phase noise difference induced by CD for
. The regeneration of LO LPN could be achieved under the approximation that within
, the LPN could be assumed to change linearly [
13]. Then, the LO LPN change for each symbol period
could be estimated as
, where
is
. The regeneration process is shown in Equation (6).
In Equation (6),
is the constant initial phase which has no impact on the performance of the estimation.
is the regeneration LO LPN. By substituting Equation (6) into Equation (4), the Tx LPN could be estimated as expressed in Equation (7).
where
represents the regeneration Tx LPN. The phase noise of the signal is compensated after the
and
are estimated separately based on two pilot tones. The proposed algorithm compensates for the LO LPN affected by CDC, which is equivalent to avoiding the generation of EEPN, thus solving the problem of the deterioration of system performance due to the introduction of EEPN as an LO LPN with large linewidth DFB under the FTN system.
3. Simulation and Discussions
The proposed algorithm is simulated in three-wavelength 60 GBaud PM-16QAM FTN systems, as shown in
Figure 1. The simulation is based on software-coded DSP algorithms. At a transmitter, FTN shaping is realized by root-raised cosine (RRC) in which the cut-off bandwidth is the product of the acceleration factor and symbol rate, and the roll-off factor is 0.01. Pre-equalization is performed in the electrical domain to compensate for the insufficient frequency response caused by some devices, such as the drivers, digital-to-analog converters (DACs), and so on. After pilot tone insertion, the FTN signal and pilot tones are converted by DACs, and drive the optical I/Q modulator for electrical-to-optical conversion. The linewidth of the lasers used in Tx/LO LLW varies from 500 kHz to 5 MHz in the simulation. Three DFB lasers are used to generate optical carriers with a channel spacing of 60 GHz for three optical IQ modulators. Then, the modulated three optical carriers enter the optical fiber transmission through a multiplexer (MUX), and the optical transmission link consists of multiple fiber spans with a span length of 100 km, reconfigurable optical add-drop multiplexer (ROADM), and erbium-doped optical fiber amplifier (EDFA). Since the typical transmission distance of metropolitan area networks and datacenter optical interconnection networks is 500 km, the maximum span number in the simulation is five. Due to the cascading of varying numbers of ROADM, the filter shape will change. In order to analyze the regularity of each important parameter in the proposed algorithm, the signal passes through the same ROADM after different span number transmissions. The parameters of the ROADM are the −3 dB bandwidth of 46 GHz and the −7 dB bandwidth of 60 GHz. The launch fiber power is set to 4 dBm to avoid the fiber nonlinear effect. At a receiver, a de-multiplexer (DMUX) is used to filter out the desired wavelength signal. After the transmitted signal distorted by chromatic dispersion is converted into a digital signal by the optical coherent receiver and analog-to-digital converters (ADCs), it enters the DSP for processing and restores the original signal. Receiver DSP mainly includes IQ imbalance compensation, chromatic dispersion compensation, FOE based on dual pilot tone, matched filtering, polarization de-multiplexing based on dual pilot tone, the PMD, residual CD, ISI equalization, the enhanced carrier phase recovery based on dual pilot tones, and the Maximum-likelihood-sequence estimation (MLSE) and is measured by the required signal–noise ratio (SNR) to reach a target normalized generalized mutual information (NGMI) of 0.9.
As shown in
Figure 2, when the Tx LLW was 5 MHz, and the LO LLW was 100 KHz, the cycle slip problem occurred five times in the BPS algorithm. Since the LO LLW is 100 KHz, the impact of EEPN is relatively small. The ISI of FTN shaping filtering will introduce additional phase noise, which is the main reason for the cycle slip problem of the BPS algorithm in the FTN system. When the Tx LLW is 100 KHz, and the LO LLW is 5 MHz, the number of cycle slip problems has increased in the BPS algorithm. The serious cycle slip problem is mainly caused by EEPN and additional phase noise introduced by ISI of the FTN shaping filter. Under the condition of the same combined LLW, with the increase in the LO LPN, the EEPN generated by CD compensation without experiencing CD damage will increase. With the increase in EEPN, the BPS algorithm will show more cycle slip problems. Therefore, an enhanced phase estimation algorithm is needed to compensate for the cycle slip problem.
In the FTN system with 60 Gbaud PM-16QAM acceleration factor is 0.9, the PSR of high-frequency and low-frequency pilot tones are −15 dB, and Tx/LO LLW is 5 MHz, respectively.
Figure 3 shows the simulation results; it can be seen that in the same PSR of high-frequency and low-frequency pilot tones, the MSE curve of the high-frequency pilot tone changes faster, and the MSE value is larger. Under the condition of the same smooth block length, the LPN estimation performance is worse for high-frequency pilot tones. For the proposed algorithm to have better performance, the PSR of high-frequency pilot tone should be higher than the PSR of low-frequency pilot tone.
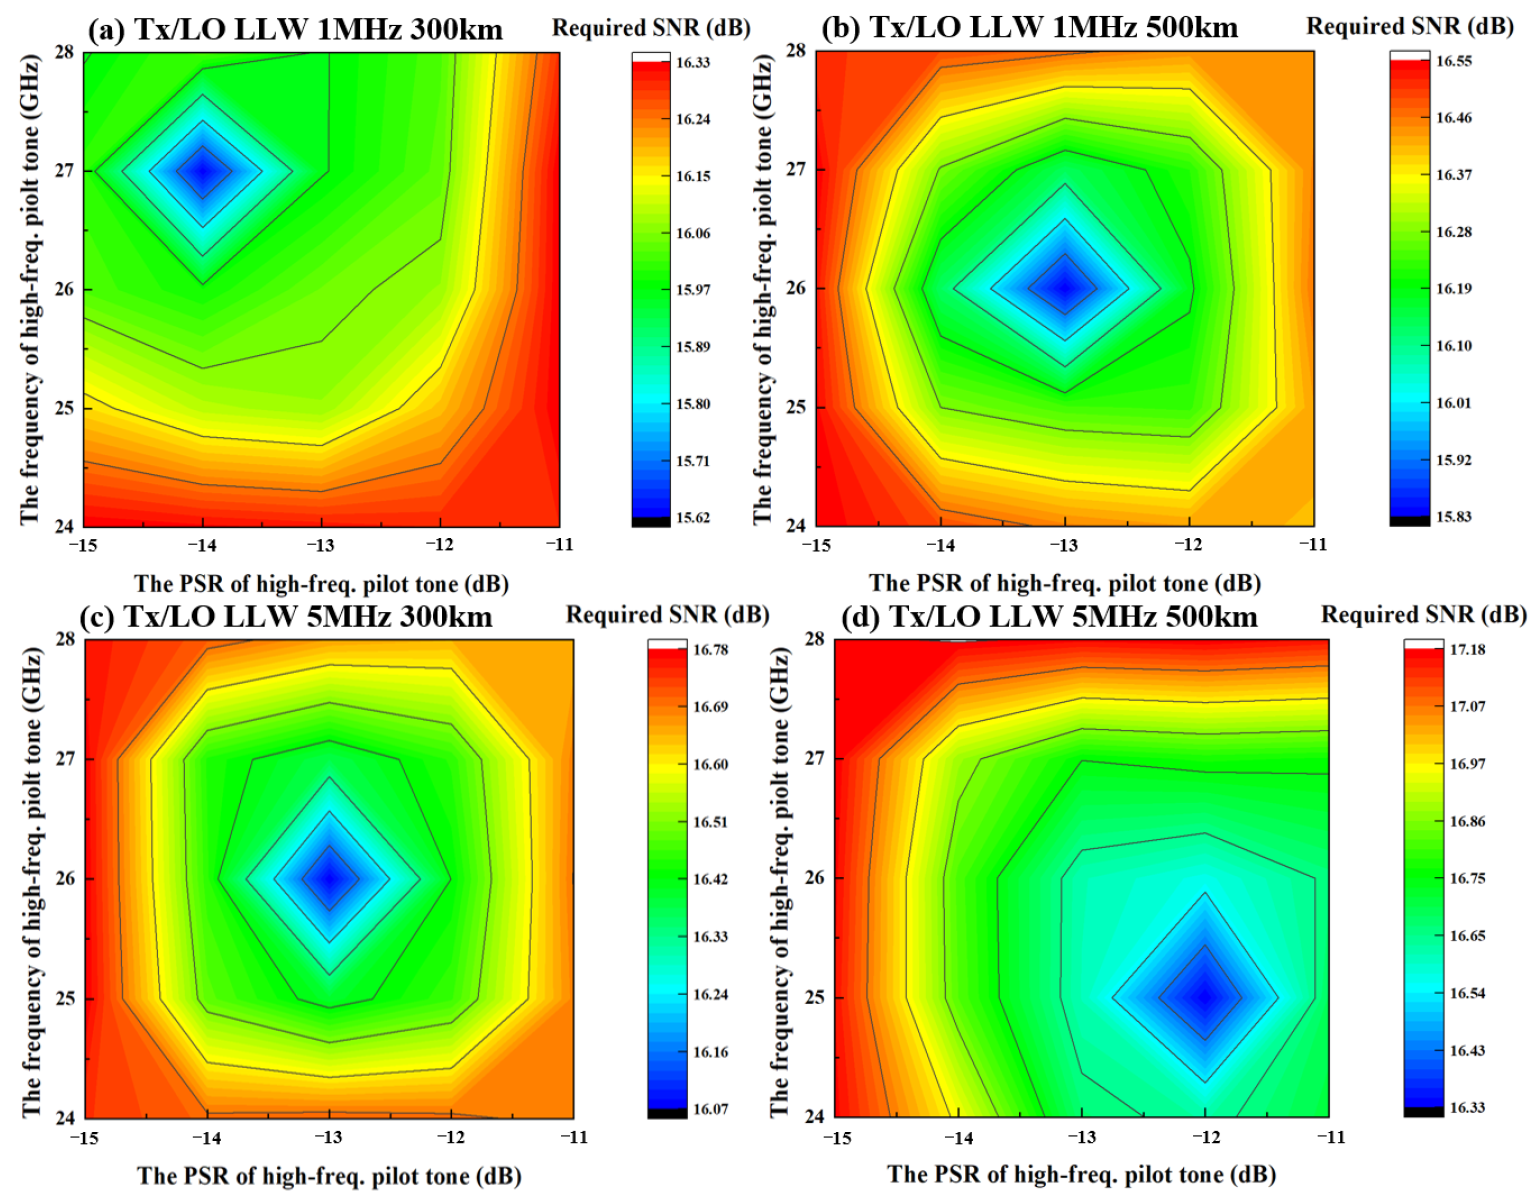
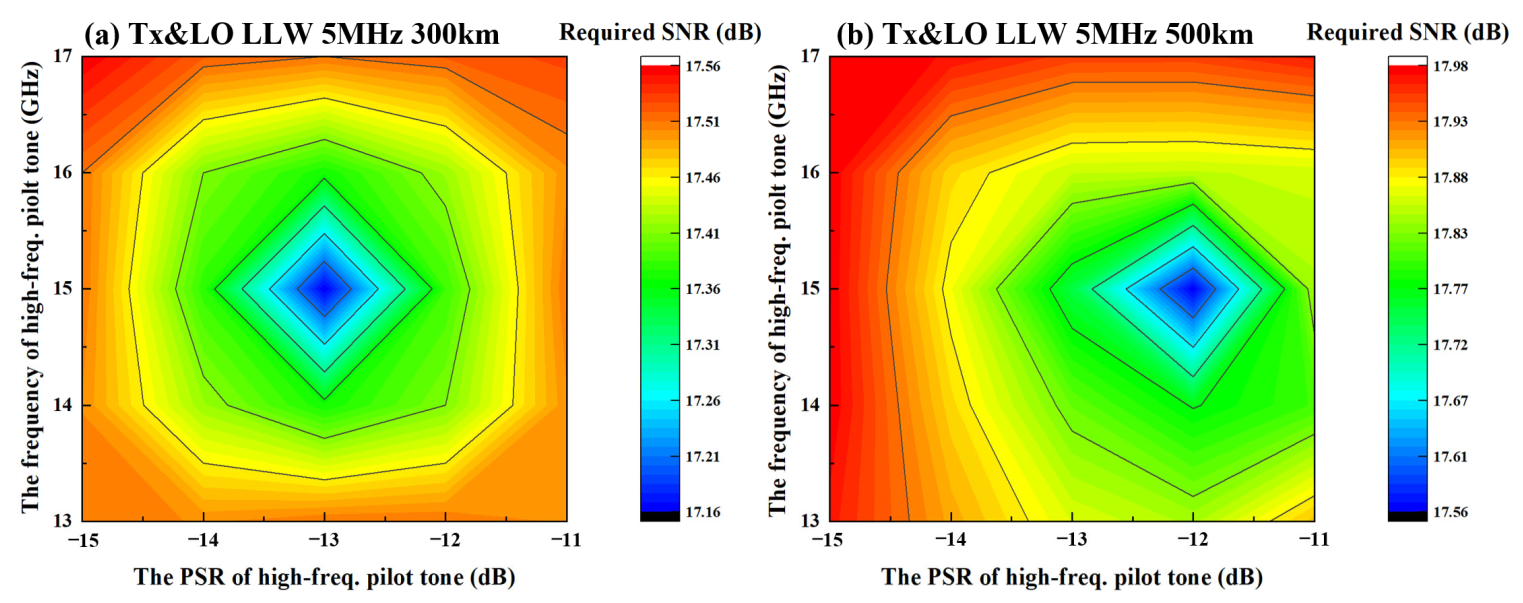
The frequency of higher-frequency pilot tone, the PSR of higher-frequency pilot tone, the PSR of lower-frequency pilot tone, and pilot tone extraction bandwidth are important DSP parameters worth discussing. Due to the impact of the pass-through ROADM, there is a strong correlation between the PSR and the frequency of pilot tone. The relationship between the PSR of lower-frequency pilot tone and the PSR of higher-frequency pilot tone is deterministic. The PSR of the lower-frequency pilot tone equals the difference between the PSR of the higher-frequency pilot tone and the attenuation of the ROADM corresponding to the frequency of the higher-frequency pilot tone. The pilot tone extraction bandwidth could be determined based on empirical values. The PSR of higher-frequency pilot tone and the frequency of higher-frequency pilot tone are affected by laser linewidth and transmission distances. Considering this, the simulation for the PSR of higher-frequency pilot tone and the frequency of high-frequency pilot tone carried out under the Tx/LO LLW is 1 MHz and 5 MHz, respectively, with 300 km and 500 km transmission. The simulation results are shown in
Figure 4.
The optimal PSRs of the high-frequency pilot tone range for 300 km and 500 km transmissions under 1 MHz Tx/LO LLW are −13.7 dB to −14.4 dB and −12.7 dB to −13.3 dB, respectively, and the corresponding optimal frequencies of the high-frequency pilot tone range are about 26.6 GHz to 27.2 GHz and 25.7 GHz to 26.3 GHz. When Tx/LO LLW both increase to 5 MHz, the optimal PSRs of the high-frequency pilot tone range for 300 km and 500 km transmissions are −12.7 dB to −13.2 dB and −11.65 dB to −12.4 dB, respectively, and the corresponding optimal frequencies of high-frequency pilot tone range are about 25.7 GHz to 26.3 GHz and 24.75 GHz to 25.3 GHz.
The simulation result shows the following laws for the optimal PSR of high-frequency pilot tone and frequency of high-frequency pilot tone: (i). As the laser linewidth extends, the optimal PSR of high-frequency pilot tone increases, but the optimal frequency of high-frequency pilot tone moves to the lower frequency. (ii). As the transmission distance extends, the optimal PSR of high-frequency pilot tone increases, but the frequency of high-frequency pilot tone moves to the lower frequency. The analysis is given as follows.
The optimal PSR of a high-frequency pilot tone exists because the SNR of the pilot tone and payload signal needs to be balanced. The optimal frequency of a high-frequency pilot tone exists because the influence of the high-frequency pilot tone on the payload signal and the LPN estimation of the high-frequency pilot tone needs to be balanced. (i). Since the LPN variance is in proportion to laser linewidth, increasing laser linewidth leads to increased LPN variance as well. That means the LPN changes faster within a certain period. From a spectral perspective, it corresponds to a higher frequency and wider bandwidth. The pilot tones broadened by LPN also become wider in this condition, leading to an increased pilot tone extraction bandwidth to meet the requirements of tracking LPN. At the same time, an increased pilot tone extraction bandwidth introduces more ASE and payload signals, which reduces the SNR of the pilot tones. To maintain the SNR of the tones, more power should be allocated to the pilot tones, resulting in an increased PSR. As the ROADM filter is fixed, moving the frequency of the high-frequency pilot tone from high to low frequencies could reduce the filtering loss on the high-frequency pilot tone, thereby satisfying the requirements for LPN tracking. However, shifting the high-frequency pilot tone to a lower frequency alone could increase its impact on the payload signal; similarly, just enhancing the power of the high-frequency pilot tone could lead to excessive noise in the payload signal. Therefore, when enhancing the PSR of the high-frequency pilot tone, it should be moved to a lower frequency, balancing the needs for maintaining the SNR of the payload signal and tracking LPN. (ii). Under the condition of the same transmit power and LLW, when the transmission distance increases, the additive noise in ASE and EEPN will increase, and the SNR of the pilot and payload signals will be reduced. Increasing the PSR of the high-frequency pilot tone or shifting the high-frequency pilot tone to a lower frequency could reduce the impact of ASE and additive noise from EEPN. However, increasing the PSR of the high-frequency pilot tone alone would result in a too-low SNR of the payload signal, and shifting the high-frequency pilot tone to a lower frequency alone could increase its impact on the payload signal. Based on this analysis, as the transmission distance increases, the optimal PSR of high-frequency pilot tone increases, and the frequency of high-frequency pilot tone moves to the lower frequency.
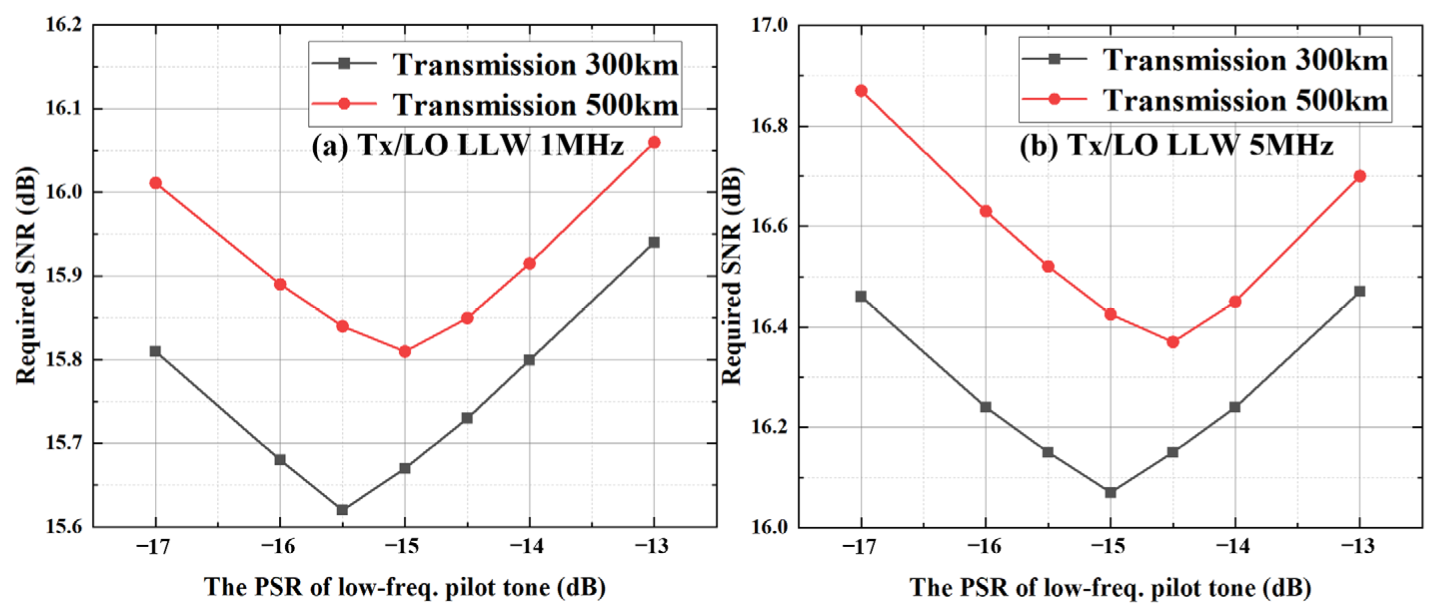
Then, the impact of the PSR of low-frequency pilot tone is verified under 1 HMz and 5 HMz Tx/LO LLW, 300 km and 500 km transmission using the optimized PSR of high-frequency pilot tone and the frequency of high-frequency pilot tone. The simulation result is given in
Figure 5.
The simulation result indicates that the optimal PSRs of low-frequency pilot tone for 300 km and 500 km transmission under a Tx/ LO LLW of 1 MHz linewidth are −15.5 dB and −15 dB, respectively. When the Tx/LO LLW increases to 5 MHz, the optimal PSRs of low-frequency pilot tone for 300 km and 500 km transmission are −15 dB and −14.5 dB, respectively.
The simulation result shows the following laws for the optimal PSR of low-frequency pilot tone: (i). The optimal PSR of low-frequency pilot tone increases as the transmission distance increases. (ii). The optimal PSR of low-frequency pilot tone increases as the laser linewidth grows.
The optimal PSR of a low-frequency pilot tone exists because the SNR of the pilot tones and payload signal needs to be balanced. (i). As the laser linewidth increases, the variance in LPN increases. In terms of LPN estimation, increased LPN variance requires an increase in the PSR of the low-frequency pilot tone to meet the requirements of LPN tracking. However, increasing the PSR of the low-frequency pilot tone would result in a too-low SNR of the payload signal. Based on the analysis above, the optimal PSR of low-frequency pilot tone would increase as a result. (ii). Longer transmission distance leads to an increase in both ASE and additive noise from EEPN, resulting in a decrease in the SNR of the pilot tones. Increasing the PSR of the low-frequency pilot can effectively reduce the effect of ASE and additional EEPN, but increasing the PSR of the low-frequency pilot will lead to a decrease in the signal–noise ratio of the payload signal. Therefore, it is necessary to consider the SNR of payload signals and the demand for tracking LPN while increasing the low-frequency pilot tone PSR. Based on this analysis, as the transmission distance increases, the optimal PSR of low-frequency increases.
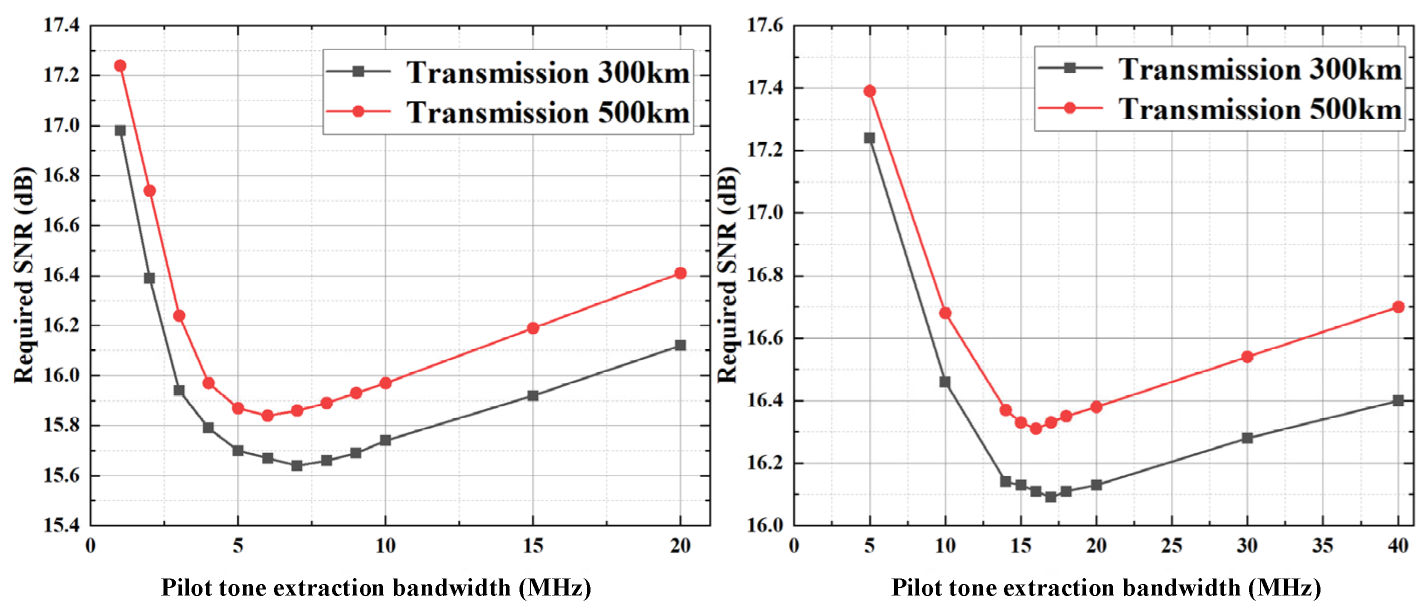
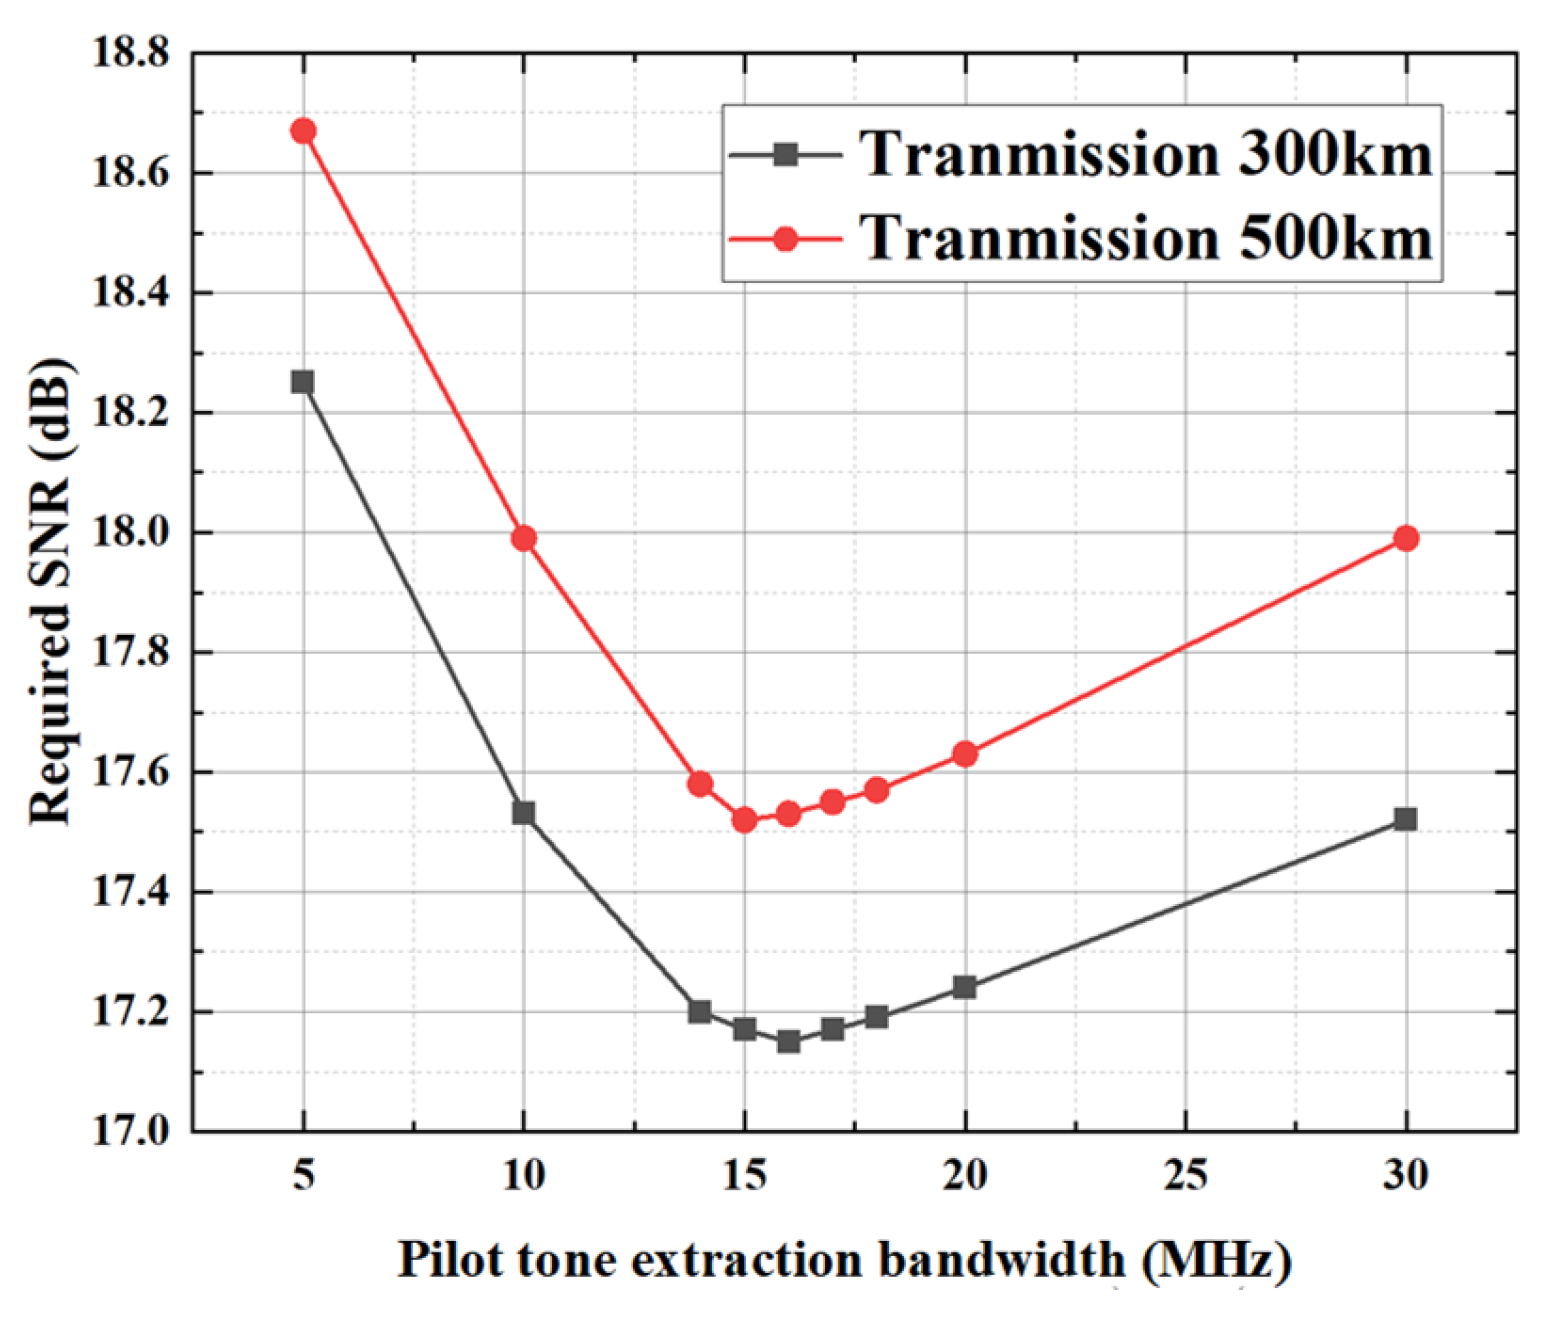
The impact of the pilot tone extraction bandwidth is verified under 1 HMz and 5 HMz Tx/LO LLW, 300 km and 500 km transmission using the optimized PSR of high-frequency pilot tone, the PSR of low-frequency pilot tone, and the frequency of high-frequency pilot tone. The simulation result is given in
Figure 6.
The simulation result indicates that the optimal pilot tone extraction bandwidths for 300 km and 500 km transmission under 1 MHz Tx/LO LLW are 7 MHz and 6 MHz, respectively. When the laser linewidth increases to 5 MHz, the optimal pilot tone extraction bandwidths for 300 km and 500 km transmission are 17 MHz and 16 MHz, respectively.
The simulation result shows the following laws for the optimal pilot tone extraction bandwidth: (i). As the laser linewidth increases, the optimal pilot tone extraction bandwidth increases. (ii). The optimal pilot tone extraction bandwidth decreases as the transmission distance increases.
The optimal pilot tone extraction bandwidth is decided by balancing the ability to track LPN and the additive noise interference on LPN estimation. (i). As the laser linewidth increases, the variance in LPN increases, where is the laser linewidth, indicating that LPN changes faster within a certain period. Extracting the pilot tone involves filtering the pilot signal broadened by LPN. In terms of LPN estimation, the pilot tone extraction bandwidth was increased to meet the requirements of LPN tracking. At the same time, increasing the pilot tone extraction bandwidth also introduces more ASE and additive noise from EEPN, which reduces the SNR of the pilot tone. Therefore, the optimal pilot tone extraction bandwidth increases as the laser linewidth increases. (ii). Longer transmission distance leads to an increase in both ASE and additive noise from EEPN, resulting in a decrease in the SNR of the pilot tone. Decreasing the pilot tone extraction bandwidth can reduce the impact of ASE and additive noise from EEPN. However, reducing the pilot tone extraction bandwidth will cause the performance of the LPN estimation based on the pilot tone to deteriorate. Based on this analysis, as the transmission distance increases, the pilot tone extraction bandwidth decreases.
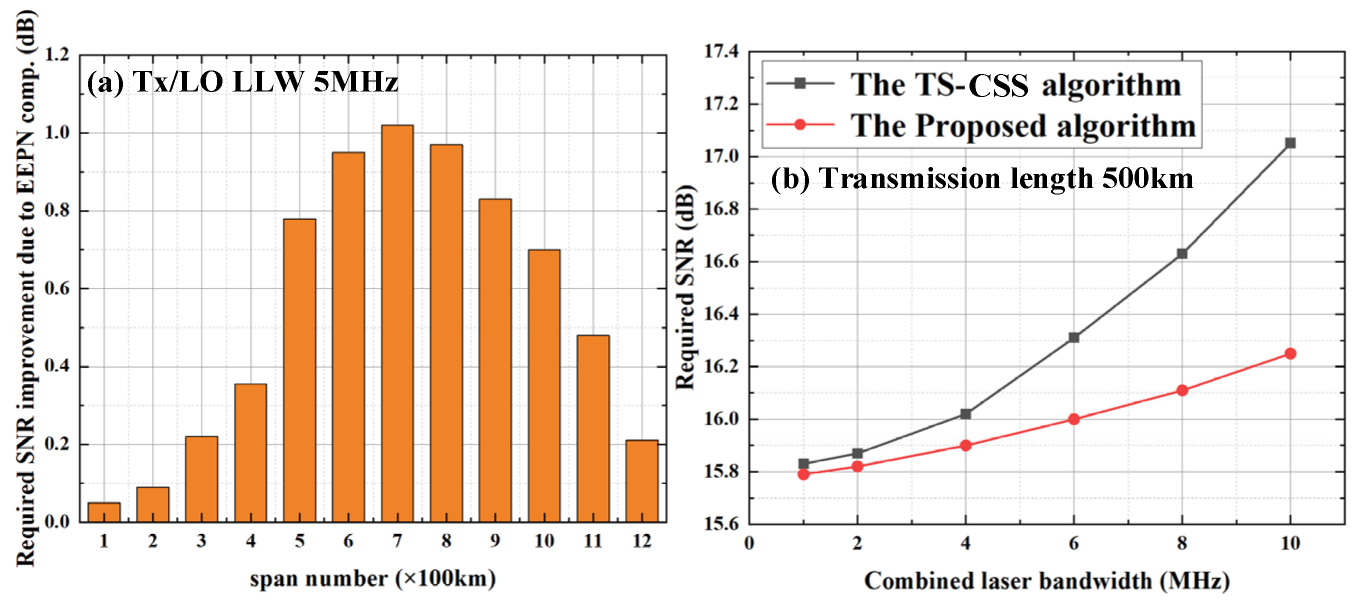
The influence of transmission distance and laser linewidth were compared under the condition of the best performance of the two different algorithms. Firstly, the impact of accumulated CD on the FTN systems with the two different algorithms is explored under 100 km to 500 km transmission with 5 MHz Tx/LO LLW. In addition, the impact of accumulated laser linewidth on the FTN systems with the two different algorithms is explored under various laser linewidth with 500 km transmission. The combined laser linewidth is 1 MHz, 2 MHz, 4 MHz, 6 MHz, 8 MHz, and 10 MHz. These simulation results are given in
Figure 7.
The required SNR improvement due to EEPN compensation in
Figure 7a is that the system performance of the proposed algorithm is subtracted from the performance of the TS-CSS algorithm under the condition of the same transmission distance to take out the influence of ASE noise. Under the transmission condition of 100–700 km, as the transmission distance increases, the accumulated CD also increases, resulting in increased EEPN damage. At this time, the error influence caused by the linear change approximation of LPN is relatively small, so the required SNR improvement due to EEPN compensation increases with the increase in transmission distance. By 500 km transmission, the FTN systems employing the proposed algorithm have about 1.05 dB required SNR improvement compared with the TS-CSS algorithm. When the transmission distance further increases, although the EEPN damage increases, the performance of the estimated EEPN deteriorates due to the deterioration of the error caused by the approximation that the phase noise varies linearly over a short period of time, so the required SNR improvement due to EEPN compensation becomes smaller.
Figure 7b shows the impact of accumulated laser linewidth on the FTN systems with the two different algorithms explored under various combined laser linewidth with 500 km transmission. The combined laser linewidth is 1 MHz, 2 MHz, 4 MHz, 6 MHz, 8 MHz, and 10 MHz. Under 1 MHz combined laser linewidth, the required SNR of the FTN systems with the proposed algorithm is improved by about 0.1 dB compared with the TS-CSS algorithm. As the laser linewidth increases, the advantage of the FTN systems using the proposed algorithm grows. Under 10 MHz combined laser linewidth, the FTN system employing the proposed algorithm has about 0.75 dB advantage in the required SNR compared with the TS-CSS algorithm. This is because the proposed algorithm is designed to mitigate EEPN, but the TS-CSS algorithm could only partially compensate for the EEPN, and the increase in laser linewidth leads to a more severe impact from EEPN, granting the proposed algorithm more advantage.
4. Complexity Analysis and Comparison
Firstly, the computational complexity analysis of the proposed algorithm is conducted in this section, and then the total receiver DSP complexity of the FTN systems employing the proposed algorithm is compared with that of the FTN systems with the TS-CSS algorithm. Generally, the computational complexity of a multiplier is approximately ten times that of an adder in hardware circuit implementation [
19,
20], and the multiplier is the dominant source of complexity for the proposed algorithm. Therefore, the computational complexity here is evaluated in terms of the required number of real multiplications per symbol.
The receiver DSP of the FTN systems with the proposed algorithm is shown in
Figure 1. That includes the overlapping frequency domain equalization (OFDE), FOE based on the pilot tones, radius-oriented equalization (RDE) algorithm with adaptive equalization and polar de-multiplexing, and the proposed algorithm for compensating EEPN. Except for the difference in the LPN compensation algorithms, the FTN systems with the CPE algorithm based on TS use the fourth power FFT to compensate for the frequency offset estimation.
As shown by
Figure 1b, the enhanced carrier recovery based on the dual pilot tones algorithm includes the following parts:
The sample rate of the filtered pilot tones is , where is the symbol rate. The filtered pilot tones transformed back to the time domain for LPN estimation. In this case, the inverse FFT is performed with the length of . The complexity of this step is real multiplications and real additions for two pilot tones.
The LPN estimation is carried out with both pilot tones under smoothing block length . The argument calculation is realized by looking up the table (LUT). For the two filtered pilot tones, the LPN estimation requires LUT and real additions.
As shown in Equation (5), the Tx LPN is canceled as acquired by performing subtraction between the LPN estimations of two filtered pilot tones, and the LO LPN is reconstructed using Equation (6). These steps cost real additions.
The Tx LPN could be estimated by Equation (7). Therefore, the total complexity is real additions.
The estimated LO LPN and evolved Tx LPN are compensated to the payload symbol. It takes four real multiplications and one real addition for each symbol.
The receiver DSP computational complexity of the two algorithms is shown in
Table 1.
In the two kinds of FTN systems, is the FFT length of the OFDE algorithm, stands for the FFT length of the FOE algorithm based on pilot tones, means the total tap number for the FIR filter, means the total tap number for the RDE algorithm, and is the length of the FFT used by the fourth power FFT algorithm to complete the frequency offset estimation. represents the smooth block length and B is the testing phase number algorithm. and are expressed as training sequences inserted every symbol. M is the number of bits per symbol, represents the tap length of the MLSE algorithm in the FTN system.
As an example, the specific complexity is calculated for a 60 GBaud PM-16QAM FTN system under a 0.9 acceleration factor. The Tx/LO laser linewidth is 5 MHz, and the transmission distance is 500 km. The parameters of the two kinds of FTN systems are optimized, respectively, to achieve the best performance. The , , and are 8192, 8192, and 4096, respectively. For the BPS algorithm, the testing phase number is 32, and the smooth block length is 32. The is 25 and the is 25. is 4, and M is 4. For the TS-CSS algorithm, and are 2 and 128, respectively. Through the above analysis, the computational complexity per symbol is 10,568 multiplications for the FTN systems with the proposed scheme, and 23,150 multiplications for the FTN systems using the TS-CSS algorithm. The comparison shows that the total receiver DSP complexity of the FTN systems with the proposed algorithm has a 54.3% reduction compared with the TS-CSS algorithm.
5. Experimental Setup and Performance Analysis
To further investigate the performance of the proposed algorithm, PM-16QAM FTN-WDM experiments have been carried out. The symbol rate in the experiment is mainly limited by the sampling rate of the digital storage oscilloscope. The symbol rate in the experiment is close to that in the simulation.
Figure 8 shows the experimental setup for 40 GBaud PM-16QAM FTN coherent transmission systems for BTB and different span number transmission. In the offline transmitter DSP, FTN shaping is realized by RRC, in which the cut-off bandwidth is the product of the acceleration factor and symbol rate, and the roll-off factor is 0.01. Then, the discrete samples after FTN shaping are pre-equalized to alleviate high-frequency damage and sent into 4 synchronized channels of arbitrary waveform generator (AWG) operating at 120 Gsample/s with ~45 GHz −3 dB bandwidth. Three oversamplings are performed to generate 40 GBaud electrical signals. The DFB lasers working at 1550 nm with a linewidth of ~5 MHz are used as Tx and LO lasers since the center frequency of the DFB laser could not be accurately adjusted. Therefore, the other two carriers use ECLs that could accurately adjust the center frequency to achieve a wavelength spacing of 36 GHz. These three channel carriers are divided into two groups: the odd and even channels, which are, respectively, sent to the dual polarization IQ modulators 1 and 2 driven by I and Q electrical signals generated by AWG. Then, the modulated carrier is launched into a re-circulating transmission fiber loop which consists of optical couplers, an optical switch (OS), an optical band pass filter (OBPF), a fiber span of 100 km standard single-mode fiber (SSMF G.652D) with an attenuation of 0.17 dB/km and PMD of 0.2 ps/km
1/2, and EDFAs. EDFA1 controls the input power to the fiber, and EDFA2 compensates for the power loss after each span. OBPF1 completes the out-of-band noise filtering for each span. The launch fiber power is set to 4 dBm to avoid the fiber nonlinear effect. The influence of laser linewidth on the proposed algorithm is not demonstrated due to the limitation of the DFB laser, which could not adjust linewidth. After fiber loop transmission, PM-16QAM FTN signals are passed through an OBPF2 with the −3 dB bandwidth of 21 GHz and the −7 dB bandwidth of 36 GHz for ROADM filtering. The AWGN is added to the transmitted signal before coherent reception. The FTN PM-16QAM signal is sampled by an 80 Gsample/s real-time sampling oscilloscope after photoelectric conversion for offline processing. The offline receiver DSP is also shown in
Figure 8. The experiment setup also works for FTN systems using the TS-CSS algorithm.
The typical low-frequency cut-off bandwidth of 40 KHz of transmitters was referenced. In the experiment, the influence of the frequency of low-frequency pilot tone on the system performance is traversed, and the optimal value of the frequency of low-frequency pilot tone is 4 MHz. Firstly, the PSR of the high-frequency pilot tone and the frequency of the high-frequency pilot tone are optimized in the experiment. When the PSR of the high-frequency pilot tone and the frequency of the high-frequency pilot tone are discussed in the experiment, the Tx/LO LLW is 5 MHz, respectively. The pilot tone extraction bandwidth is 16 MHz according to the empirical value. The impact of the PSR of the high-frequency pilot tone and the frequency of the high-frequency pilot tone in the experiment is shown in
Figure 9.
The experiment shows that the optimal PSRs of the high-frequency pilot tone range for 300 km and 500 km transmission under 5 MHz laser linewidth are −12.8 dB to −13.2 dB and −11.7 dB to −12.3 dB, respectively, and the corresponding optimal positions of the high-frequency pilot tone range are about 14.7 GHz to 15.3 GHz and 14.5 GHz to 15.1 GHz.
The experimental results show that with the transmission distance increase, the optimal PSR of the high-frequency pilot tone increases and the frequency of the high-frequency pilot tone moves to the low frequency. This is consistent with the laws derived from the simulation results.
As the transmission distance increases, it leads to an increase in both ASE and additive noise from EEPN, resulting in a decrease in the SNR of the pilot tones. That requires the pilot tone to have a higher SNR to reduce the interference from additive noise and improve the tracking ability for LPN. As shown in the previous analysis, increasing the PSR of the high-frequency pilot alone or moving the high-frequency pilot alone to a lower frequency could improve the pilot PSR but will degrade the payload signal performance. Therefore, it is necessary to comprehensively optimize the PSR of high-frequency pilot tones and the frequency of high-frequency pilot tones. In this way, as the transmission distance increases, the optimal PSR of high-frequency pilot tone increases, and the frequency of high-frequency pilot tone moves to a lower frequency.
Both the 40 Gbaud signal in the experiment and the 60 Gbaud signal in the simulation pass through the ROADM, and the roll-off characteristics of the ROADM are the 4.5-order super-Gaussian filtering characteristics under the condition of 5 MHz Tx/LO LLW and 500 km transmission. The optimal PSR and frequency of high-frequency pilot tone in the 40 Gbaud experimental results and 60 Gbaud simulation results are (−11.7~−12.3 dB, 14.5~15.1 GHz) and (−11.65~−12.4 dB, 24.75~25.3 GHz), respectively. The positions of high-frequency pilot tones are at 0.4 to 0.45 times the symbol rate. At the same time, the ROADM roll-off characteristics are the same, and only the flat-band bandwidth is different, so the PSRs of high-frequency pilot tones are also similar.
In the experiment, the PSR and the frequency of the high-frequency pilot tone are optimized. Then, the impact of the PSR of low-frequency pilot tone is verified under 5 MHz Tx/LO LLW and 300 km and 500 km transmission. The experimental result is given in
Figure 10.
The experiment shows that the optimal PSR of low-frequency pilot tone increases as the transmission distance increases. Under 300 km transmission, the optimal PSR of low-frequency pilot tone is −15 dB. When the transmission distance is 500 km, the optimal PSR of low-frequency pilot tone is −14.5 dB. This is also consistent with the laws derived from the simulation results.
As the transmission distance extends, the interference of additive noise is stronger, and a higher SNR for the pilot tones is needed to reduce the impact of additive noise and maintain the ability of pilot tones to track the LPN. In this way, the optimal PSR increases as the transmission distance is longer, and as the transmission length increases, the influence of EEPN increases.
With the optimized PSR of high-/low-frequency pilot tone above, the impact of pilot tone extraction bandwidth is examined through an experiment.
As indicated in
Figure 11, under a Tx/LO LLW of 5 MHz, the optimal pilot tone extraction bandwidths for the FTN systems with 300 km and 500 km transmission lengths are 16 MHz and 15 MHz, respectively.
The increased transmission distance would lead to increased ASE and EEPN variance as explained previously. As the transmission distance becomes longer, the interference of additive noise is stronger. A smaller pilot tone extraction bandwidth should be applied to reduce the impact of the additive noise. As the transmission length increases, the influence of EEPN increases.
The above experiments were completed to optimize the PSR of high-/low-frequency pilot tone, the frequency of the pilot tone, and the pilot tone extraction bandwidth. The influence of transmission distance and laser linewidth were compared under the condition of the best performance of the two different algorithms. The impact of accumulated CD on the FTN systems with the two different algorithms is explored under 100 km to 500 km transmission and 5 MHz Tx/LO LLW. The experimental result is shown in
Figure 12.
The required SNR improvement due to EEPN compensation in
Figure 12 is that the system performance of the proposed algorithm is subtracted from the performance of the TS-CSS algorithm under the condition of the same transmission distance. The experimental results show that the performance improvement brought by the proposed scheme increases as the transmission distance increases. These results are in accordance with those of the simulation and could be explained by the analysis given in the simulation section. By transmitting 500 km, the FTN systems with the proposed algorithm obtain about 0.65 dB in the required SNR over the TS-CSS algorithm. This proves that the proposed algorithm is effective in EEPN compensation.


