1. Introduction
Microwave frequency measurement technology has been widely used in underwater surveillance, radar early warning, electronic countermeasures, and wireless communication [
1,
2,
3]. Usually, traditional electronics approaches for microwave frequency measurement show a low response sensitivity, a limited processing speed, high power consumption, a large size, and susceptibility to electromagnetic interference.
Recently, the emergence of low-loss optical fibers and improvements in fiber optic device performance have spurred extensive research and numerous proposals in microwave photonic frequency measurement technology. Frequency measurement systems based on microwave photonics benefit from low loss, a small size, a light weight, and resistance to electromagnetic interference.
Microwave photonic frequency measurements are usually reported using frequency-to-power mapping, frequency-to-space mapping, and frequency-to-time mapping approaches. For frequency measurement based on frequency-to-power mapping, an amplitude comparison function (ACF) is normally built utilizing a dispersive element [
4], optical filters [
5], or optical mixing [
6] to convert the unknown frequency to a power ratio. However, the frequency-to-power mapping scheme can only measure microwave frequency with a single tone, thus greatly limiting its applications for practical scenarios. The principle of microwave frequency measurement based on frequency-to-space mapping is an actual conversion from microwave frequency to distributions at different spatial positions or amplitude distributions of different optical channels [
7]. The limitation of the frequency-to-power mapping and frequency-to-space mapping approaches is that they are hardly reconfigurable. A noteworthy channelization method involves the use of sawtooth wave modulation to generate an optical frequency comb for frequency measurement [
8]. The signal under test is down-converted into a low-frequency pair due to channelization. The unknown frequency is determined by the amplitude and frequency of the frequency pair. However, because the intensity difference between channels decreases with the increase in the number of channels, the measurement range is limited to the first eight channels. When accounting for the frequency response flatness and noise levels of the devices, the frequency measurement range and accuracy are further constrained. For the frequency-to-time mapping scheme, microwave frequency can be obtained with pulse identification. The stimulated Brillouin scattering effect, Fourier domain mode-locked lasers, or optoelectronic oscillators is used to assist in generating a pulse [
7,
9,
10,
11,
12,
13,
14,
15]. However, the mentioned schemes usually involve the usage of optical fiber dispersion [
16] or a complicated channelizer [
9].
In this paper, we present a microwave photonic frequency measurement scheme based on the pulse identification method. The advantage of our scheme is the ability to double the bandwidth of the linearly chirped microwave (LCM) signal to measure an unknown signal at a broad bandwidth by removing the undesired sidebands. The unknown microwave signal along with an LCM signal are modulated by upper and lower MZMs, respectively, to an optical carrier using a dual-polarization Mach–Zehnder modulator (DPMZM). By filtering out the undesired optical carrier and the optical sidebands at the high-frequency side, only optical sidebands at the low-frequency side are sent to a photodetector (PD). This means that we can measure an unknown signal at a broad bandwidth.
Microwave pulses are thus generated after the narrow-bandwidth EBPF. In this way, we can measure the accurate frequencies of the muti-tone microwave signal using the position of the pulse. An experiment is carried out to verify the proposed scheme. Microwave signals with single-tone and multi-tone signals in frequency ranges of 6–16 GHz and 26–36 GHz are measured with errors of less than ±1 MHz.
2. Principle and Methods
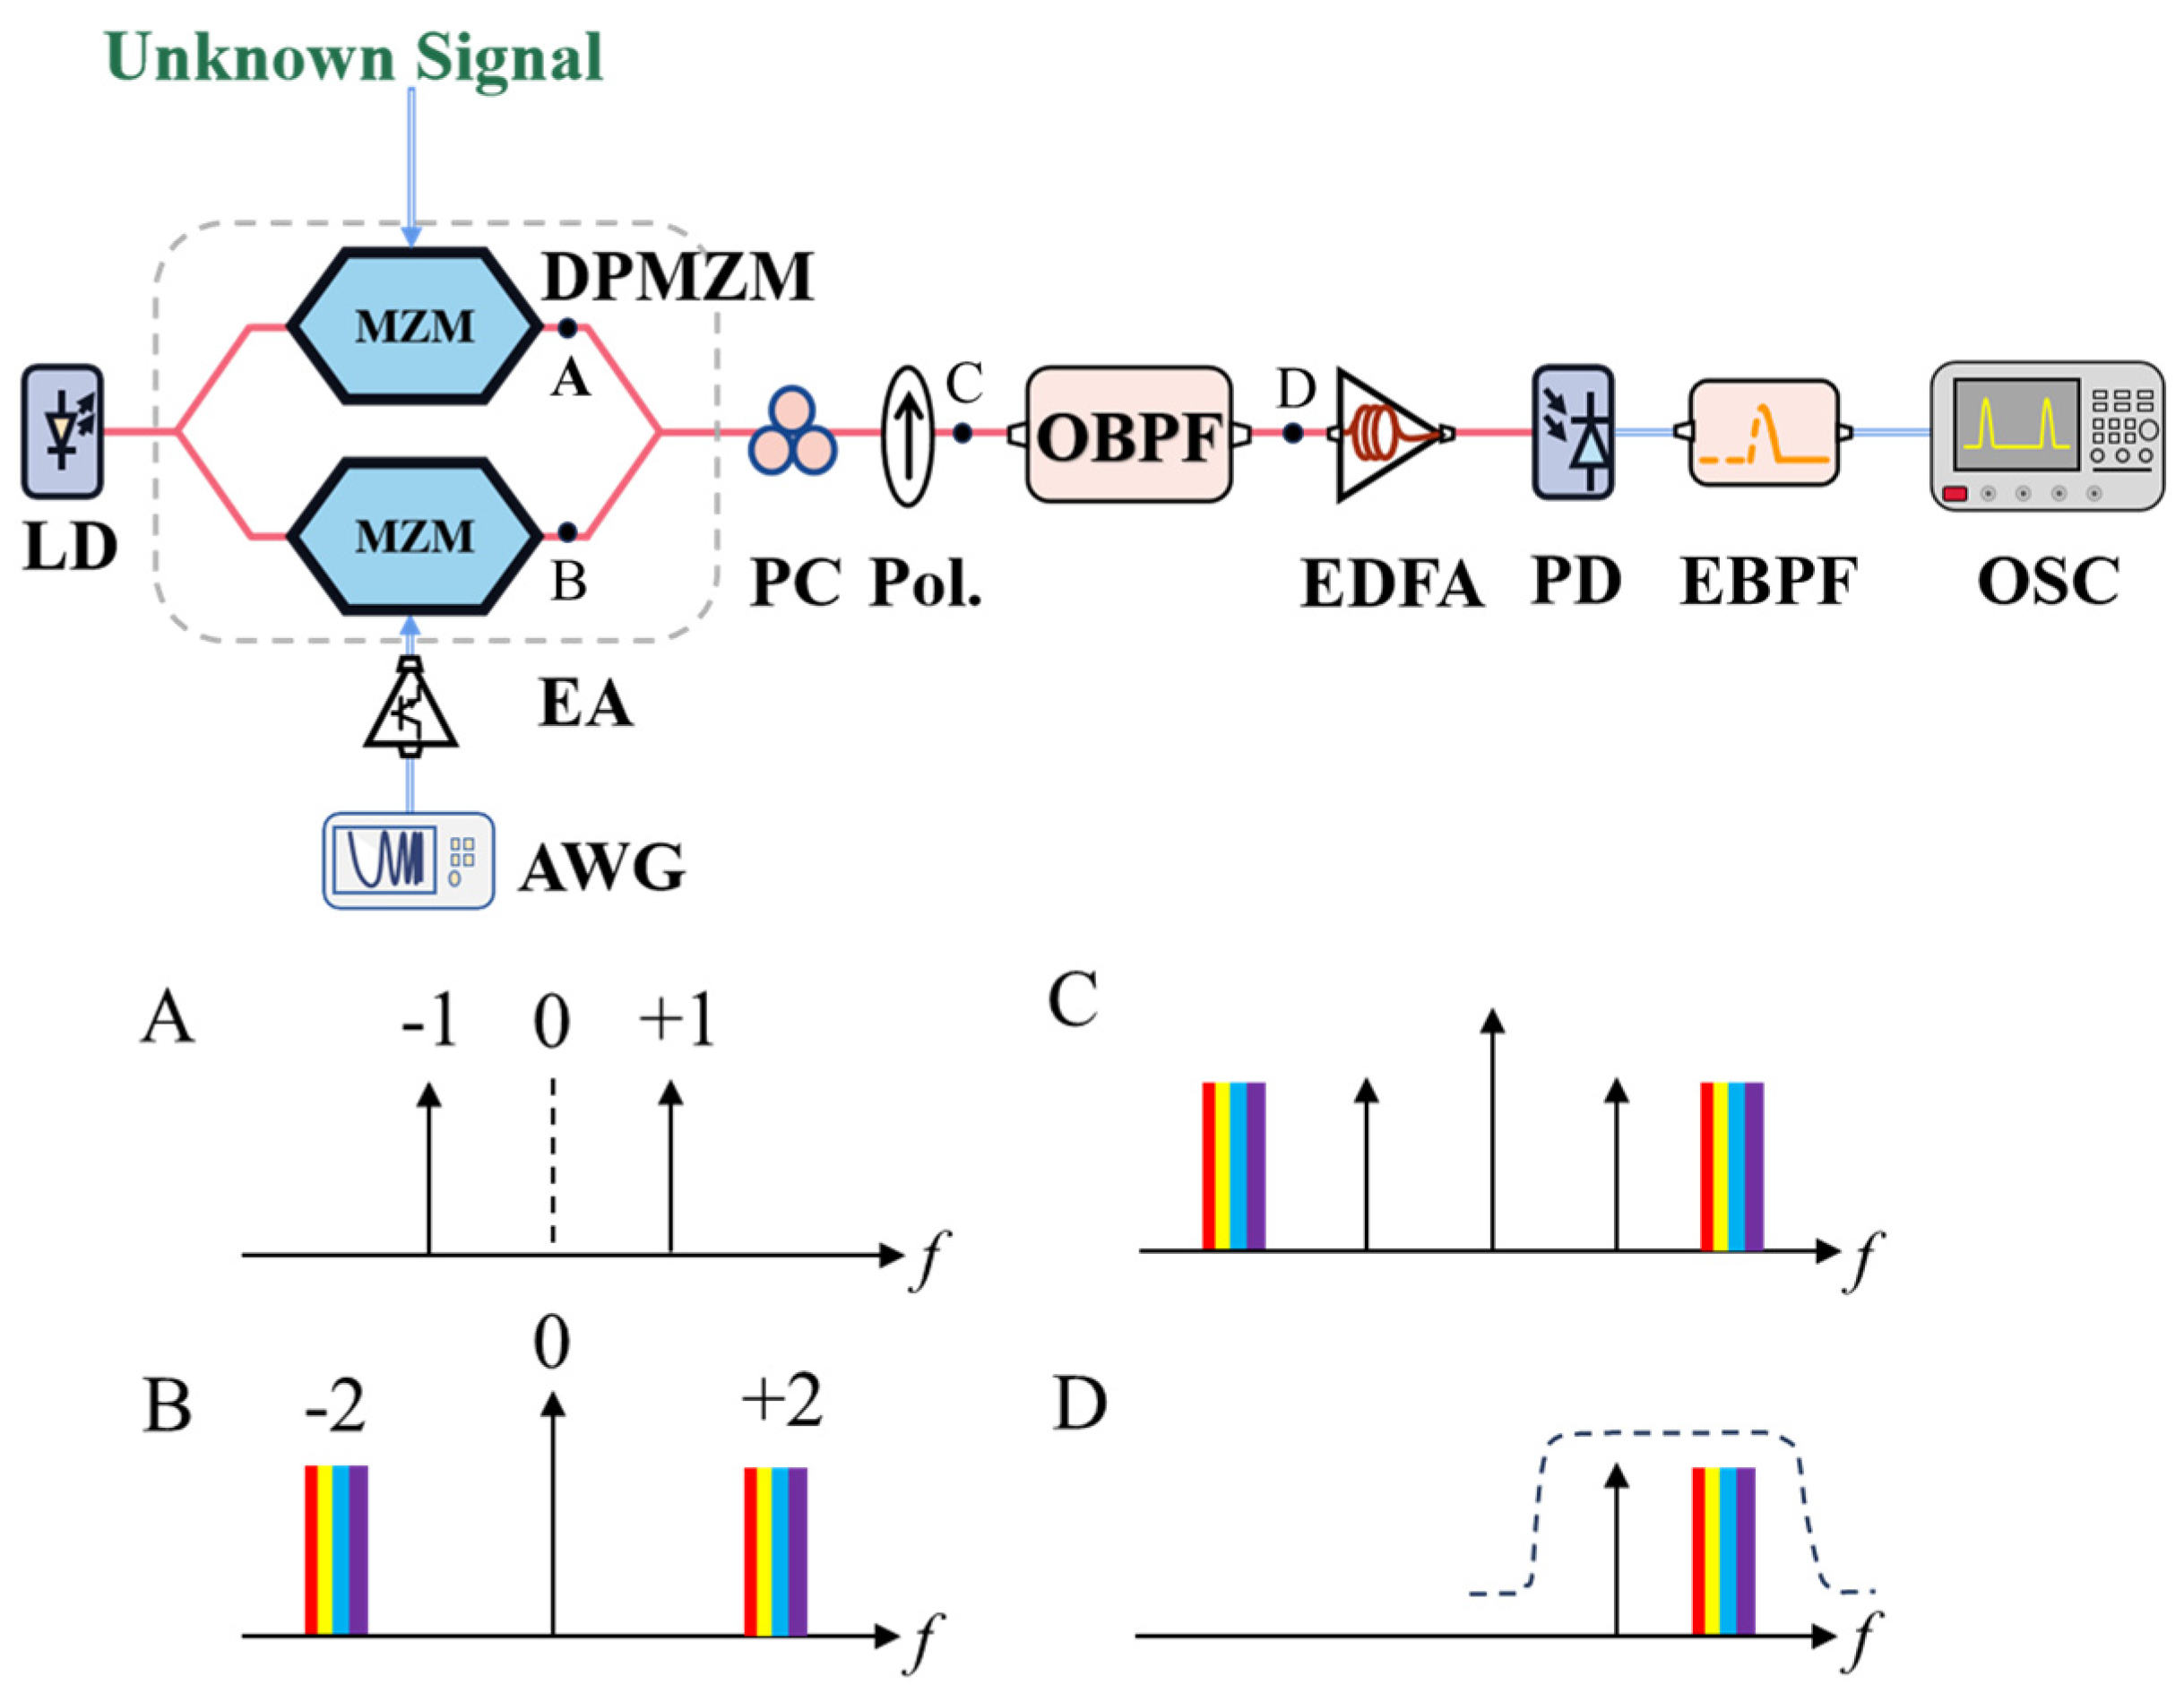
A schematic diagram of the proposed frequency measurement system and optical spectral diagrams at the corresponding positions are shown in
Figure 1. An optical carrier is injected into the DPMZM from a laser diode (LD). The upper and lower branches of the DPMZM are driven by an unknown signal
fi and a linearly chirped waveform
fs, respectively. The LCM signal used in our scheme is specifically defined as a bidirectional LCM signal, which can be expressed as
where
tu = 2
td;
fmin and
fmax represent the minimum and maximum frequencies of the bidirectional LCM signal; and
ku,
kd,
tu, and
td are the LCM signal chirp rates and duration of the upward and downward LCM signals, respectively. The upper MZM of the DPMZM is biased at the minimum transmission point to suppress the even-order sidebands. For the lower MZM of the DPMZM, it is biased at the maximum transmission point to remove the odd-order sidebands. A polarization controller (PC) and a polarizer are utilized after the DPMZM to combine two orthogonal polarized lights to the same polarization state. It is worth noting that the combination of the DPMZM, the PC, and the polarizer can be replaced by a single quadrature phase-shift keying (QPSK) modulator. Unfortunately, the QPSK modulator is not available for us at this time. Alternatively, we use a DPMZM and a polarizer to perform the same function.
An optical bandpass filter (OBPF) is cascaded to remove undesired sidebands. Finally, only the +1st-order sideband of the unknown signal and the +2nd-order sideband of the bidirectional LCM signal are sent to the PD. The use of the +2nd-order sideband doubles the bandwidth of the LCM signal. This means that we can use the LCM signal with a narrow bandwidth to measure an unknown signal at a broad bandwidth.
A microwave signal at frequency of |2
fs−
fi| is generated by beating between the +2nd-order sideband of the bidirectional LCM signal and the +1st-order sideband of the unknown signal. Only when the instantaneous frequency of the beating signal matches the central frequency of EBPF can we determine the relationship between them, which can be expressed as
where
fEBPF is the central frequency of the EBPF.
A schematic diagram of the operational principle of our scheme is shown in
Figure 2. The red dashed line represents the +2nd-order sideband of the bidirectional LCM signal. The green solid line represents the +1st-order sideband of the unknown signal. The beat frequency between them is shown by the blue solid line. A pair of electrical pulses in a period is generated due to the use of a bidirectional LCM signal. It is worth noting that the used bidirectional LCM signal has an asymmetrical chirp rate. When LCM signals with different chirp rates enter an electrical filter with a certain bandwidth, the filtered pulses have different widths, as depicted in
Figure 2. Moreover, because the bandwidths that are filtered out differ, the energy they contain also varies, leading to pulses with distinct amplitudes. Consequently, the two pulses can be effectively distinguished, and an unambiguous frequency measurement is achieved without the need for a reference signal. The time interval, Δ
t, between the two pulses in the same period can be written as
From Equation (3), we can see that Δ
t is a function of the unknown signal. In this way, the frequency of the unknown signal
fi can be expressed as
As shown by Equation (4), we divide the frequency measurement range of the unknown signal into two parts; one is from fEBPF + 2fmin to fEBPF + 2fmax, and the other one is from 2fmin − fEBPF to 2fmax − fEBPF. The frequency measurement range of the unknown signal can be expanded, and it provides two measurement intervals for channelized frequency measurement.
Equation (4) illustrates that the frequency measurement is determined by the time interval of pulse. This means that the proposed approach also has the capability of measuring microwave signals with multi-tone signals.
The system output can theoretically be expressed as
where
h1(
t) and
h2(
t) represent the beat signals of two unknown microwave signals with the LCM signal, “*” represents the convolution operation, while
hEBPF(
t) is the time-domain response of the EBPF. If the frequency difference in the two unknown signals is slight enough, the electrical pulses overlap and interfere with each other. As a result, they are hard to distinguish. Conversely, if the frequency difference in the two unknown signals is sufficiently large, the generated electrical pulses can be easily identified.
3. Results
An experiment based on the setup shown in
Figure 1 was carried out. A linearly polarized light with a wavelength of 1550.184 nm emitted by the laser source is injected into the DPMZM. The upper branch of the DPMZM is driven by an unknown signal from a microwave source. The lower branch is driven by a bidirectional LCM signal generated using an arbitrary waveform generator.
Figure 3 illustrates the simulated results of the temporal waveform of the bidirectional LCM signal and the instantaneous frequency-time diagram of the waveform in
Figure 3a, where the frequency range covers 8 to 13 GHz and the time period is 30 μs. Orthogonally polarized light from two arms of the DPMZM was superimposed through a PC and polarizer. A tunable OBPF was used to select the desired optical signals. The spectrum of the optical signal after the OBPF is shown in
Figure 4, where the +1st-order sideband of the unknown signal and the +2nd-order sideband of the bidirectional LCM signal were left. The other undesired optical component was well suppressed. A PD was cascaded to convert the optical signal to an electrical signal. An EBPF with a center frequency of 10 GHz and a bandwidth of 15 MHz was used to select the generated frequency components. An OSC was used to monitor the time waveform of the electrical pulses.
Firstly, the proposed scheme was verified by an unknown single-tone signal. The DPMZM was set as described in the Principle and Methods Section. The LCM signal generated using the AWG has a bandwidth of 5 GHz and covers the range of 8 to 13 GHz, with a chirp rate of 0.25 GHz/μs for the positive one and −0.5 GHz/μs for the negative one.
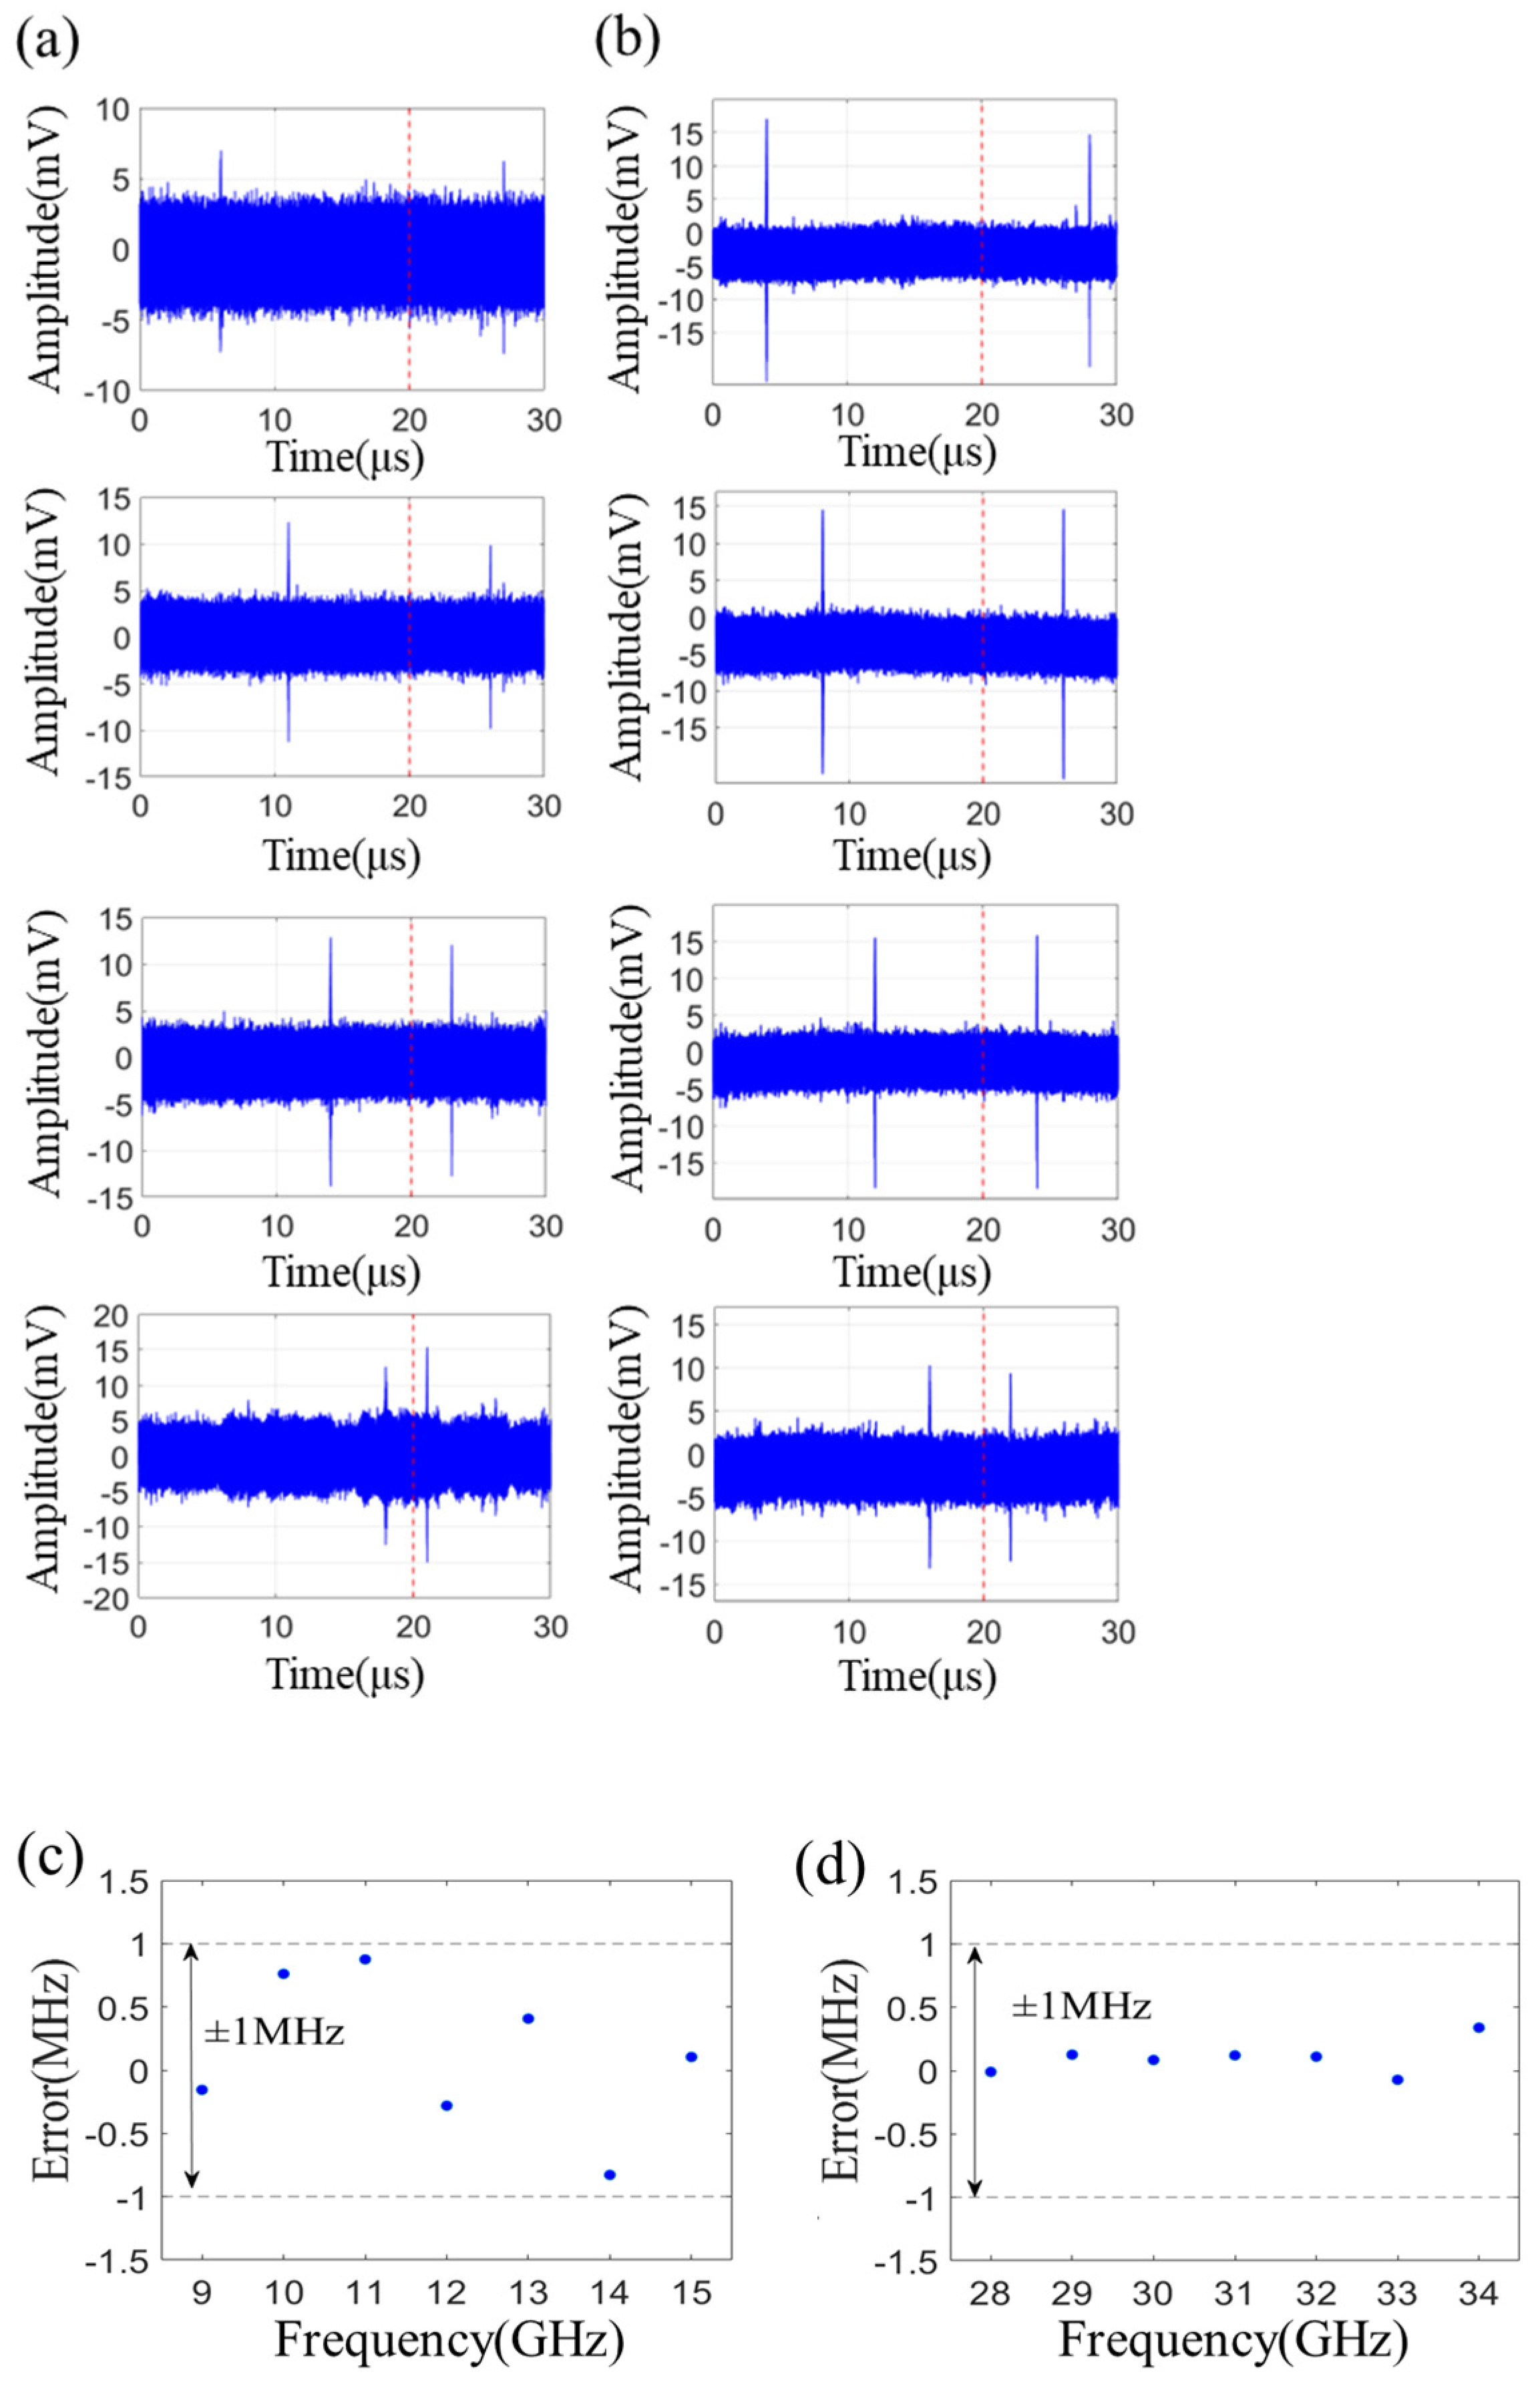
Based on the LCM signal used in our experiments, the measurement range, as illustrated in Equation (4), is divided into two parts, which are 6–16 GHz and 26–36 GHz, respectively. For measurement range of 6 to 16 GHz, an unknown microwave signal ranging from 9 to 15 GHz with a step of 2 GHz was measured. The electrical pulses captured using the OSC are shown in
Figure 5a. Using the measured pulse intervals, we substitute them into Equation (4) to calculate the measured frequency. The difference between the measured frequency and the theoretical frequency is the measurement error.
Figure 5 displays the measurement error, and it can be observed that the measurement error is within ±1 MHz.
For the other measurement range of 26 to 36 GHz, unknown microwave signals ranging from 28 to 34 GHz with a step of 2 GHz were measured. The electrical pulses can be found in
Figure 5b. The theoretical time intervals should be 24, 18, 12, and 6 us, respectively. The measured results also indicate errors of less than ±1MHz, as shown in
Figure 5d.
The proposed scheme also has the capability to measure multi-tone frequency microwave signals. A power combiner was used to combine two microwave signals generated by two microwave sources. The combined signal was driven to the upper MZM of the DPMZM.
Figure 6a,b show the electrical pulses measured using the OSC for the unknown two-tone signal at 28 and 31 GHz and at 29 and 30 GHz, respectively. Two pairs of pulses are observed within a period. The measurement errors of the two-tone microwave signals, as shown in
Figure 6c, also show high measurement accuracy. The measurement errors are all within ±1 MHz.
The frequency resolution of the proposed measurement system is also investigated. Two microwave signals with a slight difference in frequency were measured simultaneously.
To obtain the resolution of the proposed system,
Figure 7a shows the measurement results obtained for the two unknown signal frequencies set at 32 GHz and 32.04 GHz.
Figure 7b shows the measurement results when the frequencies of the two unknown signals are 32 GHz and 32.045 GHz.
Figure 7c shows the measurement results when the frequencies of the two unknown signals are 32 GHz and 32.05 GHz.
As shown in
Figure 7a–c, the frequency difference in two microwave signals increases gradually by setting their frequencies at 32 and 32.04; 32 and 32.045; and 32 and 32.05 GHz, respectively. The measured results show that the frequency resolution of the proposed scheme is greater than 50 MHz for multi-tone microwave signal measurement.
4. Discussion
A photonic-assisted multi-tone microwave frequency measurement system based on pulse identification is proposed. Compared with other frequency measurement schemes based on frequency-to-time mapping [
17,
18], our system can expand the frequency measurement range of the unknown signal and provides two measurement intervals for channelized frequency measurement. In addition, compared with our recently proposed frequency measurement schemes based on frequency-to-time mapping [
13], this system offers better measurement accuracy and a wider measurement range without switching the DC bias voltage. The better measurement accuracy may be attributed to the utilization of the optical filter that eliminates unwanted sidebands and noise. In contrast to the dual-polarization quadrature phase shift keying modulator (DP-QPSKM) scheme detailed in Ref. [
19], our scheme with a DPMZM requires controlling fewer bias voltages for frequency measurement without the need for a reference signal, thereby simplifying the processes and configurations. It has been demonstrated that our scheme has two wide measurement ranges of 6–16 GHz and 26–36 GHz. But they cannot directly be distinguished in our scheme. Therefore, a rough classification of the unknown signal can be performed by using two electrical filters at the above-mentioned bandwidth, thereby achieving channelized measurement. And our scheme provides a potential application prospect in the field of multi-channel microwave signal measurement.

