Article

A Refined Model for Ablation Through Cavitation Bubbles with Ultrashort Pulse Lasers

by
Shwetabh Verma
and
Samuel Arba Mosquera
*
SCHWIND eye-tech-solutions GmbH, Mainparkstrasse 6-12, D-63801 Kleinostheim, Germany
*
Author to whom correspondence should be addressed.
Photonics 2024, 11(11), 1047; https://doi.org/10.3390/photonics11111047
Submission received: 15 October 2024 / Revised: 4 November 2024 / Accepted: 5 November 2024 / Published: 7 November 2024
(This article belongs to the Special Issue Visual Optics)

Abstract

:
(1) Background: Ultrashort high-energy laser pulses may cause interaction mechanisms, including photodisruption and plasma-induced ablation in the medium. It is not always easy to distinguish between these two processes, as both interaction mechanisms rely on plasma generation and overlap. The purpose of this paper is to discuss prominent cavitation bubble models describing photodisruption and plasma-induced ablation and to explore their nature for different threshold energies. This exploration will help to better distinguish the two interaction mechanisms. As a second aim, we present an alternative model for the low-energy regime close to the laser-induced optical breakdown (LIOB) threshold, representing the phenomenological effect of the plasma-induced ablation regime. (2) Methods: The cavitation bubble models for photodisruption and plasma-induced ablation were used to calculate the bubble radius for a series of threshold energies (ETh = 30, 50, 70, and 300 nJ) that loosely represent commercial systems currently used in ultrashort-pulse tissue ablation. Taking a photodisruption model coefficient commonly used in the literature, the root mean square error between the two interaction models was minimized using the generalized reduced gradient fitting method to calculate the optimum scaling factors for the plasma model. The refined models with optimized coefficients were compared for a range of pulse and threshold energies. (3) Results: For low ETh (30, 50, and 70 nJ), the plasma-induced ablation model dominates for low energies that are close to the threshold energy. The photodisruption model dominates for high energies that are well above the threshold energy. At very high pulse energies, for all the simulated cases, the photodisruption model transitions and crosses over to the plasma-induced ablation model. The cross-over points from which the photodisruption model dominates tend to be reduced for larger ETh. A new universally applicable model for plasma-induced ablation has been hypothesized that considers the cavitation bubble volume and potentially better explains the bubble dynamics during intrastromal processes. (4) Conclusions: This theoretical exploration and the comparison of the outcomes to empirical data substantiate that inadvertently using the photodisruption model to explain the cavitation bubble dynamics for the entire spectrum of pulse energies and laser systems might provide erroneous estimates of cavitation bubble sizes. A reliable estimate of the true size (the maximum radius) of the cavitation bubble can be reasonably retrieved as the maximum predicted size from the fit of the photodisruption model and the newly proposed plasma-induced ablation model at any given pulse energy.

1. Introduction

Ultrashort-pulse lasers have been invaluable tools in ophthalmic surgery since the 1980s, when nanosecond Nd:YAG infrared (IR) lasers were introduced for posterior laser capsulotomy utilizing the photodisruptive interaction [1].

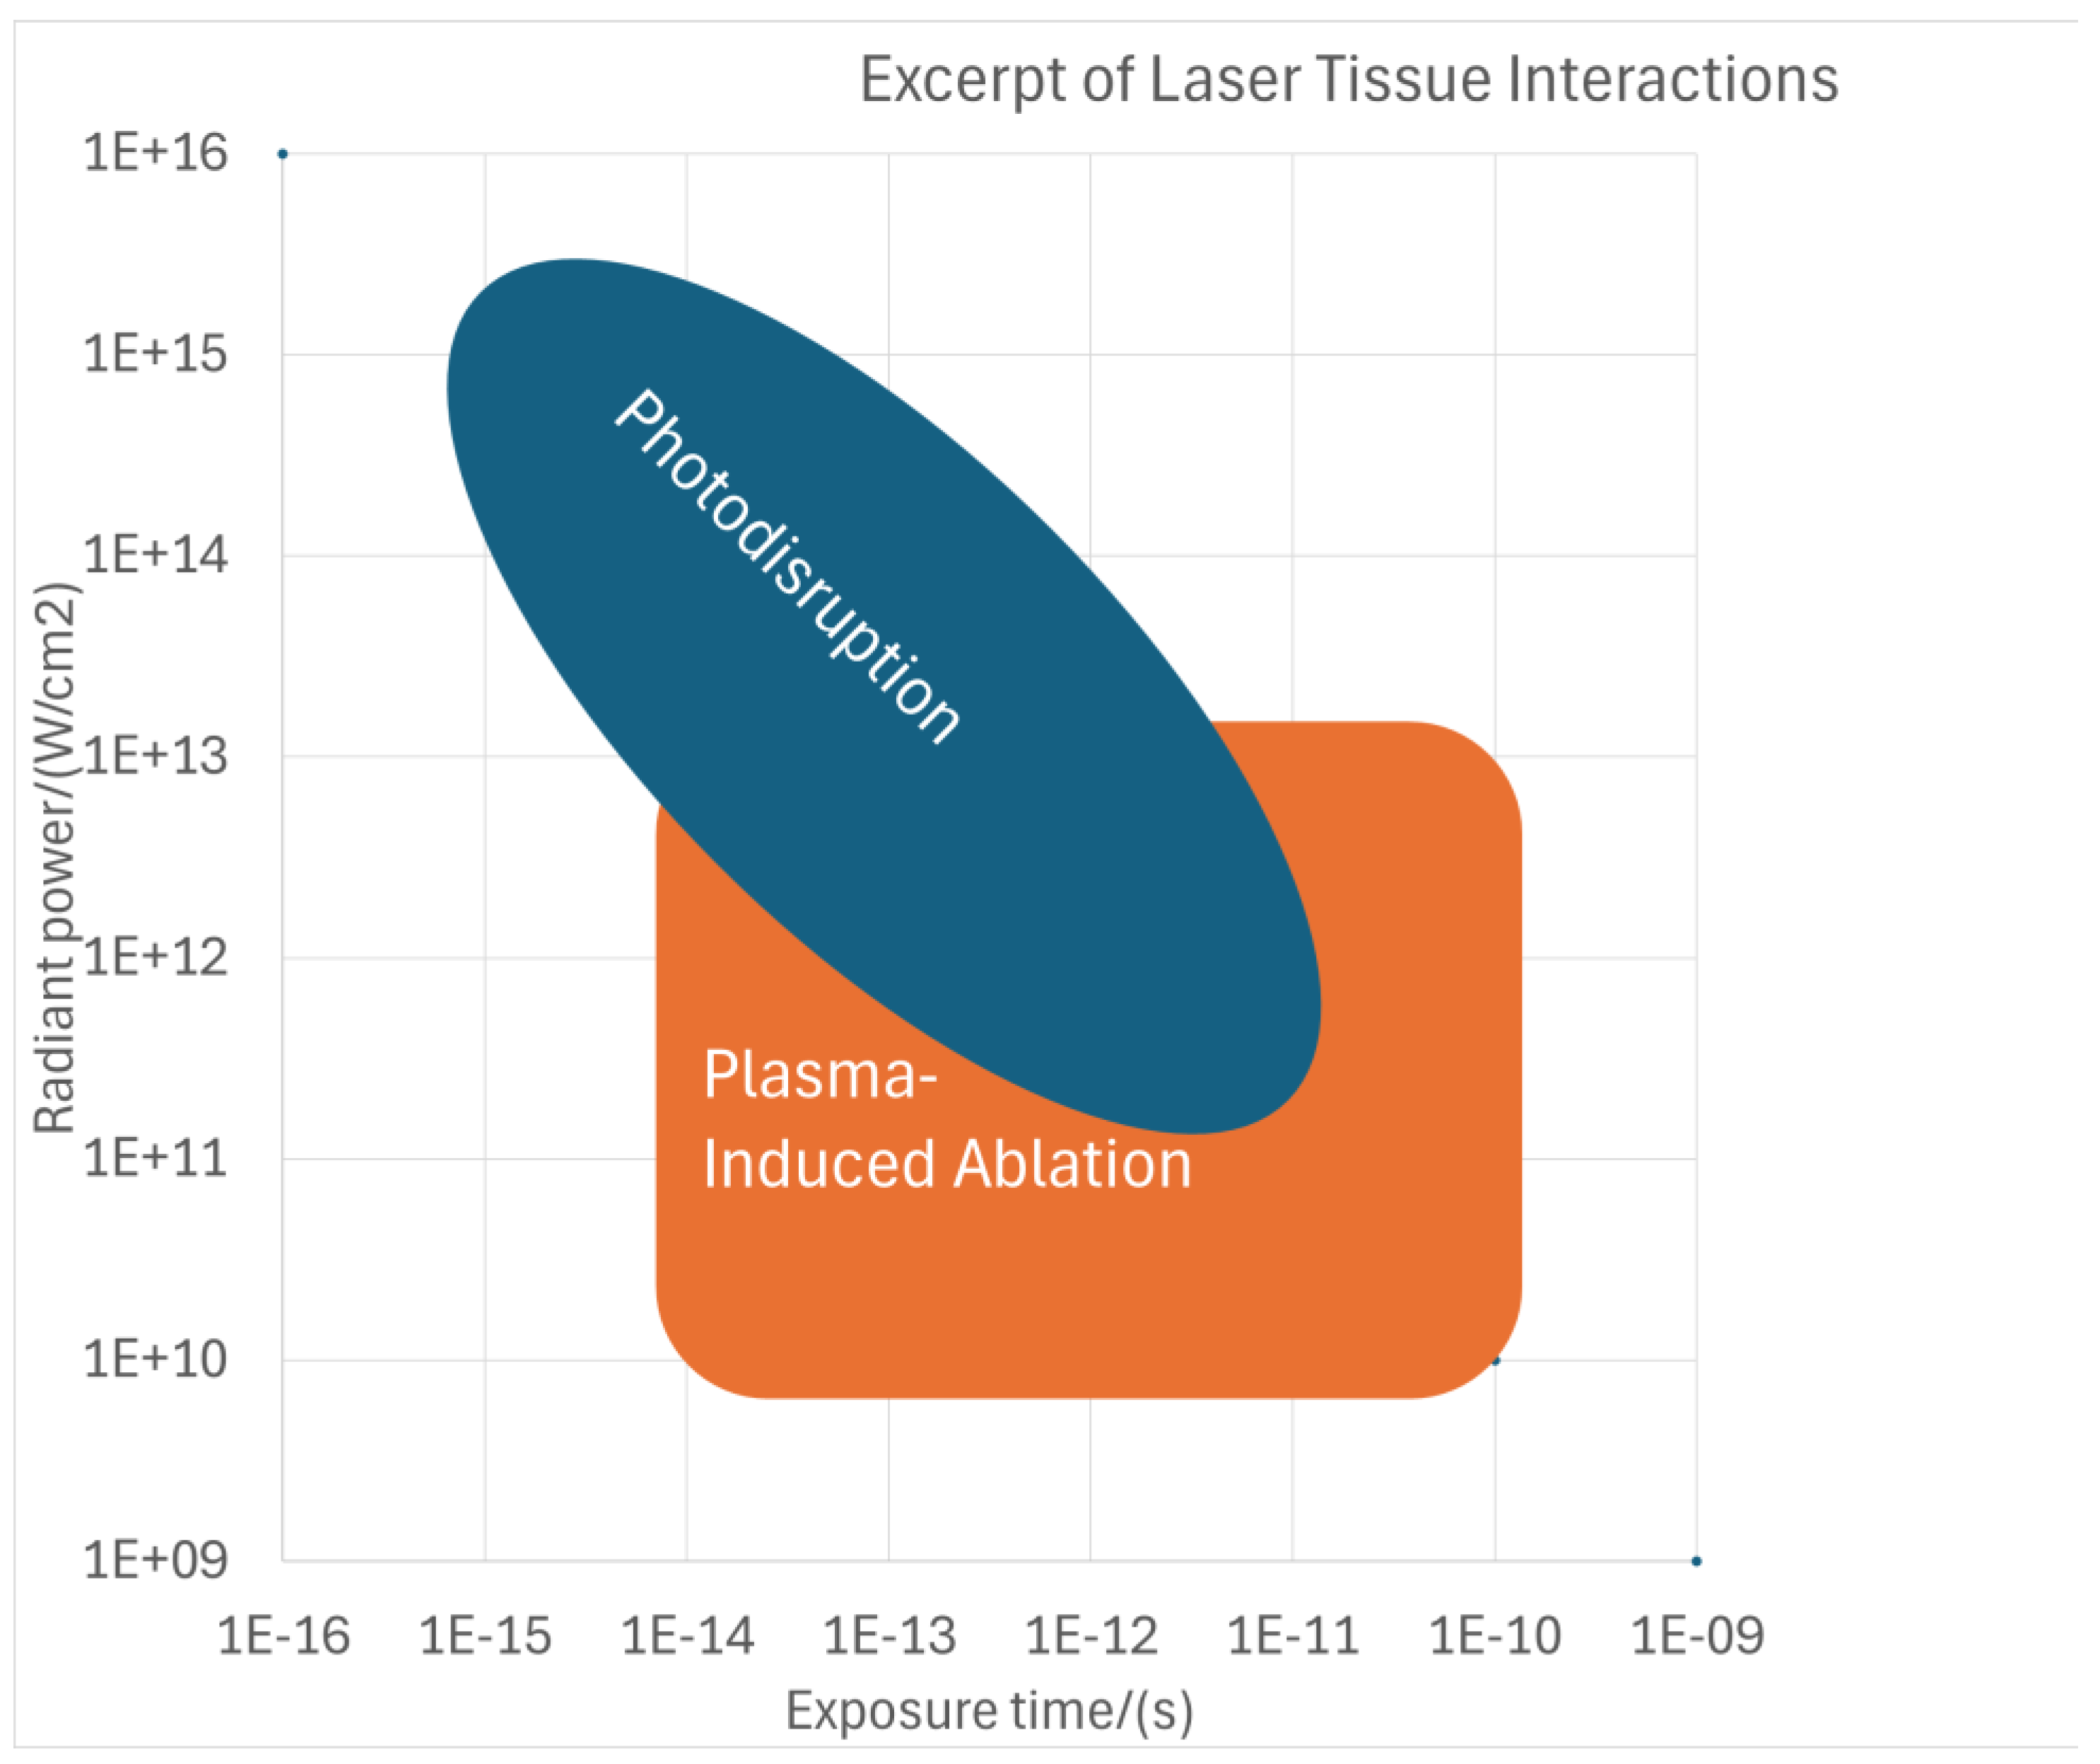
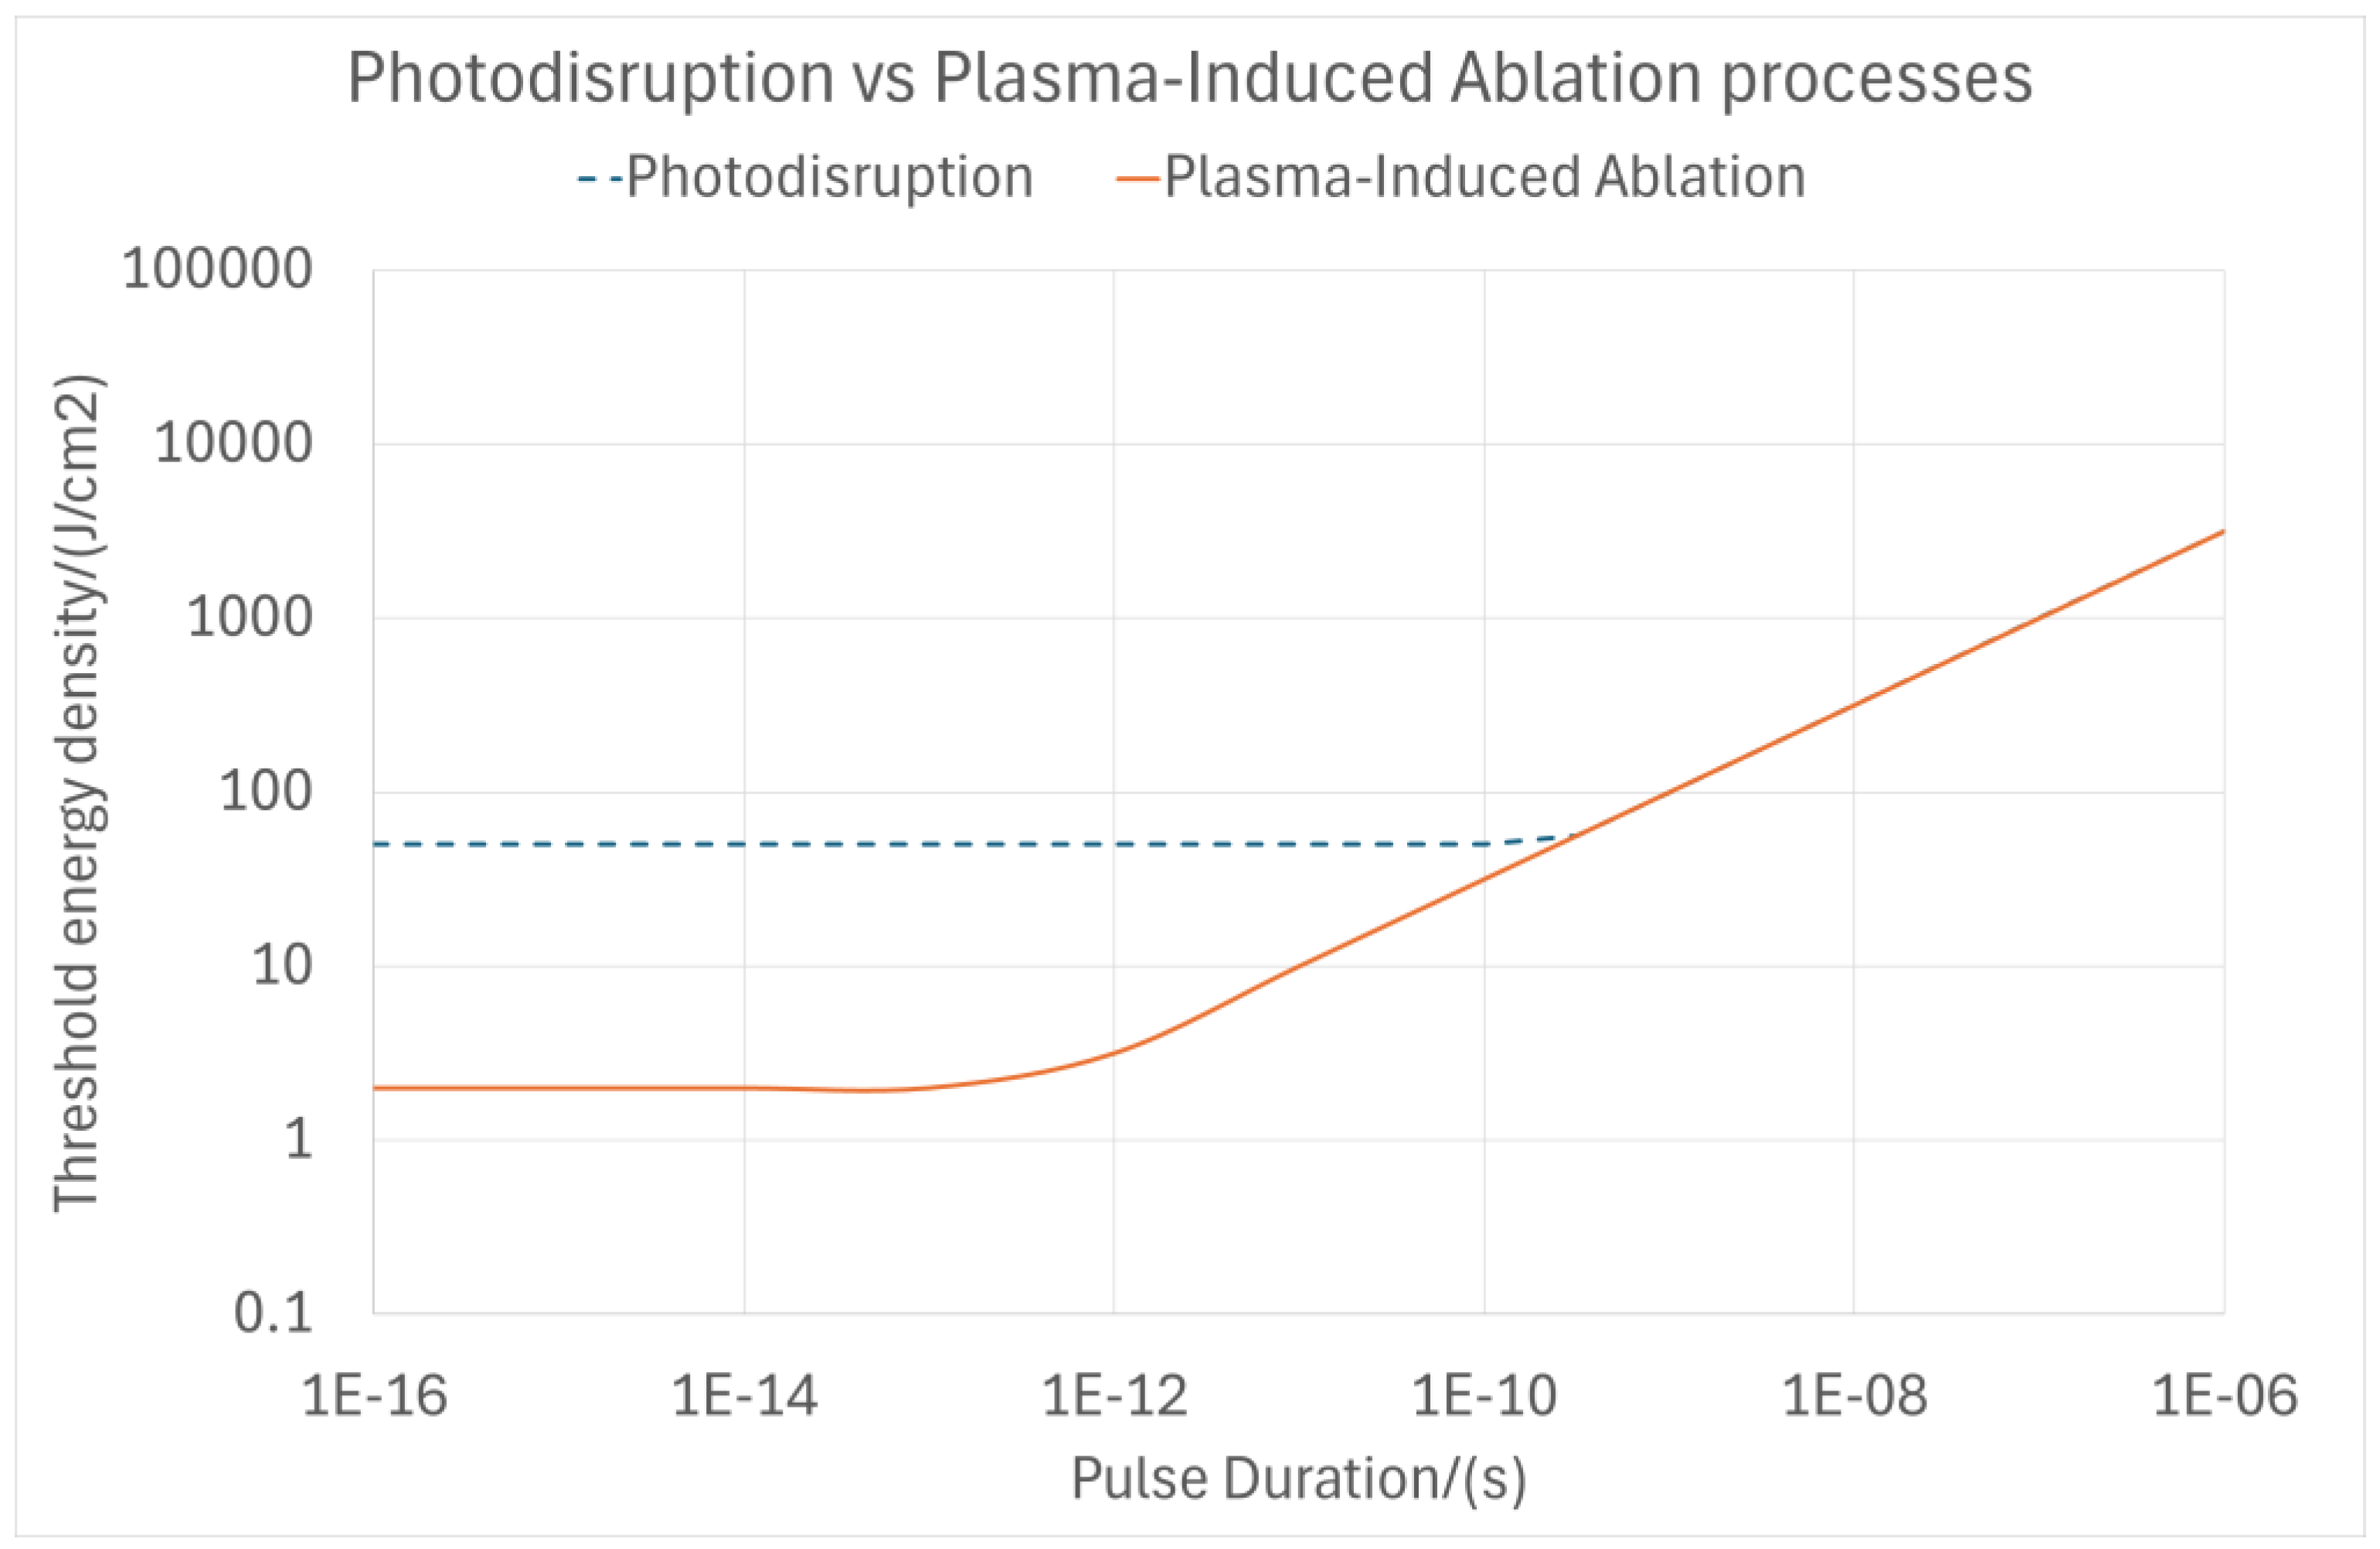
1.1. Theoretical Background of Laser–Tissue Interaction Mechanisms—Plasma-Induced Ablation and Photodisruption

The first systematic presentation of the mechanisms by which lasers react with tissue was given by Boulnois in 1986 (Figure 1) [2]. The single parameter that distinguishes and primarily controls the processes is the duration of laser exposure or the interaction time. Depending on the exposure time scale, there are four regions: continuous wave or exposure times longer than one second for photochemical interactions; exposure times from one minute to one microsecond for thermal interactions; exposure times from one microsecond to one nanosecond for photoablation; and exposure times shorter than one nanosecond for plasma-induced ablation and photodisruption. The difference between the latter two is attributed to different energy densities [3].
Under highly concentrated peak irradiances and shorter exposure times, in the picosecond and the femtosecond (fs) range, one can not only break molecules—as during photoablation—but even strip electrons from their atoms and accelerate them. A phenomenon called optical breakdown occurs when obtaining power densities exceeding 1011 W/cm2 in solids and fluids or 1014 W/cm2 in air. If the local electric field exceeds the threshold, the electric field forces the ionization of molecules to take place (breakdown). The release of the electron due to thermal emission and intense laser pulses causes high electric fields, in turn causing multiphoton (or tunneling) ionization. Free electrons absorb more photons through inverse Bremsstrahlung absorption, thus gaining sufficient kinetic energy to ionize even more atoms during subsequent collisions. This “avalanche” ionization process results in plasma that allows previously transparent tissues (such as the corneal tissue) to absorb a significant amount of energy. The created plasma initially expands with hypersonic velocity due to its high pressure and temperature. A shock wave is emitted when the plasma expansion decreases to a subsonic velocity. Further expansion of the plasma results in the creation of a cavitation bubble, followed by its implosion, which may result in secondary acoustic transients [4,5]. The thermalization of this energy leads to the rapid vaporization of the interstitial fluid, thus creating rapidly expanding cavitation bubbles, which are key to rupturing the adjacent tissue. During the avalanche ionization process, the main loss mechanisms are inelastic collisions and the diffusion of free electrons from the local volume [6].
Plasma-induced ablation, also termed plasma-mediated ablation, was first investigated and discussed by Teng et al. [7], Stern et al. [8], and Niemz et al. [9]. Niemz found that, in the case of picosecond pulses, ablation without mechanical side effects takes place at incident power densities of a few times the plasma threshold [10]. Photodisruption is a multi-cause mechanical effect starting with optical breakdown. It was first introduced by Krasnov [11] and further investigated by Aron-Rosa et al. [1] and Fankhauser et al. [12]. In the breakdown region, the effect is plasma-induced ablation, while in the adjacent region, the effects are shock waves and cavitation. Because adjacent tissue can be damaged by disruptive forces, these effects are often undesired associated symptoms. Plasma formation, shock wave generation, cavitation, and jet formation take place on different time scales. Cavitation is a macroscopic effect; a cavitation bubble undergoes several oscillations of expansion due to the high temperature and pressure of the gas in the bubble and then collapses. During photodisruption, it is the mechanical (acoustic) wave—not the laser light itself (as with plasma-induced ablation)—that breaks the tissue. Because both interaction mechanisms (plasma-induced ablation and photodisruption) rely on plasma generation and graphically overlap (Figure 2), it is not always easy to distinguish between these two processes. During photodisruption, the tissue is primarily split by mechanical forces, with shock waves and cavitation effects propagating into adjacent tissue. In contrast, plasma-induced ablation is spatially confined to the breakdown region and laser focal spot, with the tissue primarily being removed by plasma ionization itself. The primary distinguishing parameter between the two interaction processes is energy density (Figure 2).

1.2. Empirical Background of Laser–Tissue Interaction Mechanisms—Plasma-Induced Ablation and Photodisruption

The theoretical explanation of the processes is valid for water but may not be completely transferrable to corneal tissue, in which work must be done against the restoring forces of the lamellar structure of the cornea during bubble expansion. This has strong influences on intrastromal bubble dynamics, eventually leading to a smaller bubble size (and fewer oscillations) in the cornea than in water for the same pulse energy [14]. As presented in several studies, the (asymptotic) size of the cavitation bubble leading to photodisruption grows with the cubic root of the applied (suprathreshold) pulse energy [4,15,16].
Experimental confirmation of the predictions from theoretical models is of great importance for selecting optimum parameters for corneal surgery [17]. Experiments using time-resolved flash photography in corneal tissue have shown that cavitation bubbles develop more rapidly and reach a smaller maximum diameter than those generated by longer pulses [18]. Juhasz et al. [4] observed the temporal evolution of cavitation bubbles in the bovine cornea, noting that the bubble diameter depends on the laser pulse energy. They reported an approximately linear power dependence at lower pulse energies, which approaches a cubic root dependence as pulses with higher energy are applied. In one study, the picosecond optical breakdown maximum cavity radius and the shock wave zone were shown to scale with the cube root of the pump pulse energy over almost three orders of magnitude. For pulse energies close to the threshold energy of 8 μJ, the shock range was ~100–200 μm, and the cavity radius was 140 μm [16]. Calibration problems may be involved in deducing the bubble dynamics from the temporal evolution of the scattering signal intensity. Vogel et al. [15] used the scattering of a probe laser beam to determine the bubble oscillation time (which is the lifetime of the first cycle of the cavitating bubble) and used this value to deduce the maximum bubble radius using an adapted Gilmore model that considers surface tension and takes temperature dependence into account. At the threshold, only a small fraction (~0.0002%) of the laser energy is converted into bubble energy because most light is transmitted through the focus. They reported that bubbles produced by fs optical breakdown in water at the threshold are largely driven by tensile thermoelastic stress, with little contribution from vapor pressure. These bubbles are smaller than the diffraction-limited focus diameter. However, a steep increase in the maximum bubble radius is observed for pulse energies starting from 11% of the threshold energy.
Similar findings have been reported using another measuring technique: ultrasound monitoring of the cavitation bubbles. The maximum bubble radius monotonically increases with the energy of the laser pulse. For laser pulse energies higher than 80 nJ, the maximum bubble size is approximately proportional to the cube root of the laser pulse. However, in the low-energy range, this relationship breaks down because the pulse energy is close to the optical breakdown threshold [19]. These results are in good agreement with previously published experimental data obtained for nanosecond and picosecond laser breakdowns in water [16,20] and for a femtosecond laser, where the bubble radii were close to the optical breakdown threshold [15].
To determine the fs breakdown thresholds in transparent media, the laser pulses must be focused at a high numerical aperture to avoid the corruption of the results resulting from nonlinear beam propagation altering the focal spot size [21,22]. This is difficult to realize without introducing spherical aberrations into the laser beam path, which will lead to erroneous threshold values [23]. Theoretical models predict that the dependence of the ablation threshold on the pulse duration decreases rapidly for pulse durations at the low end of the fs regime [24].

1.3. Aims of This Work

Previous studies have measured bubble sizes at pulse energies much higher than the threshold to increase the signal-to-noise ratio, but these could be out of the plasma regime. Therefore, these studies have only considered the photodisruption model (proportional to the cubic root of the pulse energy) to fit the empirical data holding true for the entire range of suprathreshold energy without considering whether the effects were occurring at the plasma-induced ablation or photodisruption energy level. The constant ‘K’ that governs the growth of the cavitation bubble radius is described as having a value of ~0.7 µm/nJ1/3 in the literature, but this may be biased and could be an overestimate of the bubble size [14,25]. For energies closer to the bubble threshold, the plasma-mediated bubble size rapidly increases for slightly increased energies, where a linear mathematical relationship between the ablated area and the logarithm of the pulse energy can be found in the literature [26], supported by experimental evidence [15]. Cavitation bubbles inducing photodisruption effects grow steadily with pulse energy. With the introduction of fs laser technologies for refractive surgery, corneal cuts have become more accurate and precise than ever before [27]. The three-dimensional geometry of the cutting pattern must be converted into a series of pulse positions, often requiring several million pulses for the surgery. Every new single small bubble contributes to the cutting of the cornea, but the bubbles may be governed by different underlying mechanisms. For instance, very different regimes have been observed for the interaction mechanisms of cavitation bubbles induced by spatially and temporally separated fs laser pulses (at least for pulse energies well above the breakdown threshold) [28,29]. The pulse energies applied in some of the modern fs laser ablations might be closer to the plasma-mediated ablation regime. However, inadvertently using the photodisruption model (a cubic root relationship with the suprathreshold energy) to fit empirical data and explain the cavitation bubble dynamics for the entire spectrum of pulse energies and laser systems might provide erroneous estimates for the cavitation bubble sizes. This can result in a biased explanation of the empirical findings towards one of the physical phenomena. Understanding the underlying processes and nuances that distinguish the plasma-induced ablation and photodisruption processes may help in developing a better-fitting model to phenomenologically explain the bubble size and improve systems working with different energy configurations.
In our previous work [14], we could partly explain the difference in energy regimes by including the threshold energy in the cubic root equation, which resulted in a sharp decrease in the estimated size of the cavitation bubble for low energies. The main purpose of this study was to further refine the established cavitation bubble models for photodisruption and plasma-induced ablation based on a mathematical and modeling exploration that considers different threshold energies loosely representing currently available commercial systems. Laser parameters such as wavelength and pulse duration have been reported to impact the threshold energy [14]. By analyzing the impact of the threshold energy, the variability in commercial systems was implicitly considered in this work. This exploration will help us to better distinguish the two interaction mechanisms. As a second aim, we present an alternative model for the low-energy regime close to the laser-induced optical breakdown (LIOB) threshold, representing the phenomenological effect of the plasma-induced ablation regime.

2. Materials and Methods

Note that the terms bubble radius and diameter mentioned in the following sections refer to the maximum bubble size of the dynamic cavitation bubble.

2.1. Cavitation Bubble Model for Photodisruption (Photodisruption Model)

The bubble radius (RB) is proportional to the cubic root of the suprathreshold energy and can be calculated (in good agreement with [19]) as shown in [30]:
R B P h o t o D = K × E E T h 3  
where E is the energy of a single pulse, ETh is the threshold energy for the formation of cavitation bubbles for the irradiated tissue or material below which no bubbles occur, and K is the coefficient of the irradiated tissue or material.
For human corneal tissue irradiated with ultrashort near-infrared pulses, the threshold for bubble formation takes values in the order of nanojoules [31]. Despite its simplicity, the model remains general and applicable. The threshold energy depends on the materials and specific laser beam characteristics. Parameters such as the pulse duration and tissue properties were considered based on previous work [14]; we can determine the threshold as being proportional to
E T h τ 3 λ M 2 N A 2  
where the corresponding pulse duration is τ, the wavelength is λ, the beam quality is M2, and the numerical aperture is NA.

2.2. Cavitation Bubble Model for Plasma-Induced Ablation (PlasmaSQRT Model)

According to Liu’s “thresholding” method [32], one can retrieve under a Gaussian spot approximation the beam waist (radius at 1/e2), w0, and the energy threshold of ablation, ETh. This gives rise to a linear mathematical relationship between the ablated area, A, and the logarithm of the pulse energy, ln(E), as follows [26]:
A ( E ) = π ω o 2 2 ln E E T h
From this expression, one can derive the bubble radius as follows:
R B P l a s m a S Q R T = B × ln E E T h 2
where B is a coefficient proportional to the beam waist.

2.3. Analysis Methodology

The two interaction models (photodisruption, Equation (1), and PlasmaSQRT, Equation (4)) were used to calculate the bubble radius for a series of energy and threshold energy (ETh) values, assuming initial plausible values for the coefficients ‘K’ (K~0.6, comparable to the values in [14,25]) and ‘B’ (B~3.5, which results in bubble sizes comparable to those for the photodisruption model but for an energy regime close to the bubble threshold following the PlasmaSQRT model). For our analysis, threshold energy (ETh) values of 30, 50, 70, and 300 nJ were used in the calculations. These values loosely represent commercial systems currently used for ultrashort-pulse tissue ablation.
In our methods, we assume that the system’s properties affect the threshold energy, but the calculated factors still apply to all systems universally. For each value of threshold energy, the root mean square error between the two interaction models was calculated. In this manner, the squared sum of the errors for all the analyzed threshold energies (loosely representing commercial systems) was calculated as the metric to be optimized. The value of the coefficient ‘B’ was calculated by minimizing this metric using the generalized reduced gradient fitting method. The refined models with optimized coefficients were compared for a range of pulse energies and threshold energies. For both models explaining the physical processes of the interactions for photodisruption and plasma-induced ablation, the following expectations can be stated: for energies lower than or equal to the threshold energy, no cavitation bubbles shall be produced; the PlasmaSQRT model shall result in a larger bubble size than the photodisruption model for low energies, and the photodisruption model shall dominate for high energies.

3. Results

The values of the coefficients obtained for the two interaction models following the analyses are presented in Table 1.
Using the obtained coefficients, the size of the bubble (bubble diameter) versus the pulse energy obtained from the two interaction models for a range of threshold energies (ETh) was calculated, as presented in Figure 3. Although the coefficients were calculated for the bubble radius, the bubble diameter is presented in the figures below to help us better interpret the results. Note that, in the graphs, the X and Y axes use the logarithmic scale, and the same scale (logarithmic scale 2) is used for the X and Y axes and for all the graphs for better comparison.
Beyond the exploration of the threshold energy (ETh) values of 30, 50, 70, and 300 nJ, a limiting case was also explored (Figure 3, bottom) to identify the minimum threshold energy (113 nJ) for which the photodisruption effect dominates for any suprathreshold energy. The interpretation of these results is discussed in the next section.

4. Discussion

The methods presented in this study aimed to minimize the differences between the two prominent interaction models, explaining the cavitation bubble dynamics in the literature for photodisruption and plasma-induced ablation. This was achieved by analyzing several threshold energies that loosely represent currently available commercial systems using ultrafast laser pulses for tissue ablation. Following this methodology, optimum scaling factors were identified for both interaction models and were used to calculate the cavitation bubble diameters for a range of threshold energies.
From the results, it can be interpreted that the PlasmaSQRT model dominates low energies that are close to the threshold energy. The photodisruption model, on the other hand, dominates for high energies that are well above the threshold energy. This can be seen for the analyzed threshold energies of 30, 50, and 70 nJ (Figure 3), where the PlasmaSQRT model shoots with a larger slope for energies close to the threshold energy, eventually reaching a plateau as the energy progresses. The photodisruption model ‘catches up’ with an increasing slope as the energy reaches values much larger than the threshold energy. At very high pulse energies for all the simulated cases (for ETh < 100 nJ), the PlasmaSQRT model transitions and crosses over to the photodisruption model.
Using the interaction models and optimum scaling factors, a limiting case was also explored (Figure 3, bottom) to identify the minimum threshold energy (113 nJ) for which the photodisruption model dominates for any suprathreshold energy. This result is plausible and reinforces the findings above, which are that for an ETh well below 113 nJ, the PlasmaSQRT model dominates. For an ETh above 113 nJ, the photodisruption model takes over and dominates over the entire range of pulse energy, as can be seen in the case of ETh = 300 nJ (Figure 3—middle right). It can be noted that the cross-over point from which the photodisruption model dominates tends to decrease for a larger Eth, but it remains close to a pulse energy of ~1 μJ for ETh < 100 nJ; however, one can see a clear reduction from 30 to 50 to 70 nJ, which starts to disappear for 113 nJ, and a complete absence at 300 nJ. This follows the prediction of the PlasmaSQRT model that one would only observe a clean plasma-mediated ablation if the optical breakdown threshold remained below 113 nJ. For the cases with threshold energies below 113 nJ, the plasma-mediated ablation regime, for which photo-mechanical disruption does not dominate (despite existing), extends up to ~500 nJ to ~1 µJ. The cross-over point corresponds to values > 30 × ETh for ETh = 30 nJ; >20 × ETh for ETh = 50 nJ; >10 × ETh for ETh = 70nJ; and >>2 × ETh even for ETh ~113 nJ. This observation can be placed in context with the findings of Tinne et al. [33]. They found that bubbles in water and 1% gelatin have lifetimes above 10 μs (for energies above 1 μJ and relative energies above 6× the threshold energy). In water, below 3.6× the threshold energy (≈500 nJ in their setup), no influence between the cavitation bubble oscillations was observed, and below 7.2× the threshold (≈1000 nJ in their setup), an asymmetric bubble collapse could be observed.
One must also consider that the PlasmaSQRT model is proposed for surface ablation [27]. This model may not be completely transferrable to intrastromal processes, in which work must be done against the restoring forces of the lamellar structure of the cornea during bubble expansion. For this interaction, a modified PlasmaSQRT model could be designed considering a cubic relationship between the bubble radius and the term ln(E/ ETh), where, instead of the area, the volume of the cavitation bubble is considered, as follows:
R B P l a s m a C R T = C × ln E E T h 3
For this cubic root model (PlasmaCRT), the coefficient ‘C’ is proportional to the beam waist. Following similar methods (as described in Section 2.3) and minimizing the root mean square error between the three interaction models, the global optimum value for the coefficient ‘C’ was calculated, as shown in Table 2.
Using the obtained coefficients, the size of the bubble (bubble diameter) versus the pulse energy obtained from the three interaction models for a threshold energy ETh = 63 nJ is presented in Figure 4. This threshold energy was chosen as a compromise between the 50 and 70 nJ pulse energies, as it is not extremely low and yet is well below the limiting case of 113 nJ.
Upon comparing the PlasmaCRT and PlasmaSQRT models (Figure 4), one can interpret that, for energies closer to ETh (63 nJ), the bubble diameter for PlasmaCRT is larger than that for PlasmaSQRT. This may represent the regime for plasma-induced ablation, which is spatially confined to the breakdown region and laser focal spot volume (considered by the PlasmaCRT model) as opposed to the laser focal spot area. As the pulse energy increases, for pulse energies below ~300 nJ, the bubble size remains larger for the PlasmaCRT model compared to PlasmaSQRT. For pulse energies above 300 nJ, the PlasmaSQRT model predicts larger bubble sizes than PlasmaCRT.
Upon comparing the PlasmaCRT and photodisruption models (Figure 4), one can interpret that, for energies closer to ETh (63 nJ), the bubble diameter for PlasmaCRT is larger than that for photodisruption. This represents the regime for plasma-induced ablation, which is spatially confined to the breakdown region and laser focal spot. As the pulse energy increases, for pulse energies below 113 nJ, the bubble size increases sharply for the PlasmaCRT model compared to the other models. For pulse energies above 113 nJ, the photodisruption model grows faster, but the predicted bubble size remains below that of PlasmaCRT until they are equal at pulse energies of ~630 nJ. This represents the change in regime from plasma-induced ablation to photodisruption. At pulse energies above this value (~630 nJ), the bubble diameter predicted by the photodisruption model remains continually larger than that predicted by the PlasmaCRT model. This represents the regime of photodisruption interaction.
Considering the nature of the physical interactions, photodisruption and plasma-induced ablation may never be isolated or sequential physical events but instead occur together as competing effects in the media. Thus, one can infer from the relationship between their respective models (the photodisruption and PlasmaCRT models) that the true size (maximum radius) of the cavitation bubble can be reasonably retrieved as the maximum predicted size from both models at any given pulse energy.
Considering the map of laser–tissue interactions (Figure 1), both regimes (plasma-induced ablation and photodisruption) coexist at pulse durations between ~10 fs and ~100 ps, whereas for pulses longer than 1 ns, only photodisruption can be reached at much higher energy densities. For power densities of 1010 to 1013 W/cm2, plasma-induced ablation occurs, while for power densities of 1011 to 1016 W/cm2, photodisruption occurs. The distinction of the two interactions according to energy density (Figure 2) suggests that, for energy densities below ~2 J/cm2, no plasma-induced ablation can be expected; for energy densities above ~50 J/cm2, only photodisruption can be expected. The transition or cross-over from plasma-induced ablation to photodisruption, as suggested by Figure 2, can be set in the context of our results (Figure 3). The cross-over point was found at a pulse energy of ~1 μJ for cases with ETh < 100 nJ in our simulations. Assuming a 2.5 μm beam waist (~5 µm focus diameter), this corresponds to a cross-over point at an energy density of ~25 J/cm2, which matches well with the dashed line shown in Figure 2. The empirical threshold pulse energy for generating cavitation bubbles with the SCHWIND ATOS system (SCHWIND eye-tech solutions GmbH, Kleinostheim, Germany) is ~40 nJ. Considering the typical pulse duration (~200 fs) and beam waist (~2.7 μm) of this system, the single-pulse energy of the system would have to be >500 nJ (~1300 nJ), requiring a power density of ~6 × 10¹³ W/cm2 to leave the plasma-induced ablation regime and enter the photodisruption regime. This power density is at the upper edge of the plasma-induced ablation regime and well within the photodisruption regime (Figure 1). The same trend and conclusion can be inferred from our results (Figure 3, top right). It must be highlighted that this single-pulse energy (>500 nJ) is much higher than the capabilities of the ATOS system and even typical values used in this system (~90 nJ), suggesting that the system works within the plasma-induced ablation regime and not the photodisruption regime. For empirical scrutiny of our methods, we adjusted the value of the coefficient ‘K’ (photodisruption model), and therefore, the coefficients ‘B’ (PlasmaSQRT) and ‘C’ (PlasmaCRT), such that the bubble size calculated by the models matched for the ATOS system (from our experience) for energies of 75–95 nJ. The results and their interpretation did not change, confirming our methods.
For realistic estimates of the beam waist and pulse duration, Table 3 presents the calculated peak energy and power density corresponding to the cross-over point for each simulation case presented in this work. In addition, the empirical threshold pulse energy for generating cavitation bubbles with the SCHWIND ATOS system (~40 nJ) is also presented in the table.
Placing the methods in this work in context with the methods previously published by our group [14], one can analytically and numerically calculate the minimum amount of energy imparted onto the tissue following each model described here that would lead to the completion of corneal cuts through coalescent cavitation bubbles. These results are presented in Table 4 as the minimum (minOpt), maximum (maxOpt), and proper optimum laser pulse energies (properOpt) for the three models discussed. For the ATOS system, comparing the three models, the optimum corridor of the pulse energy would be 60 to 80 nJ following the photodisruption model, 66 to 80 nJ following the PlasmaSQRT model, and 56 to 66 nJ following the PlasmaCRT model. This reinstates the comparable nature of the photodisruption and PlasmaSQRT models and highlights the distinguishing nature of the PlasmaCRT model.
Very few studies have explored the theoretical nature of cavitation bubble dynamics with ultrashort pulses [34]. A comprehensive paper by Vogel et al. [35] discusses the historical developments of ‘cell surgery’. While the optical breakdown threshold depends strongly on the linear absorption at the laser focus for nanosecond pulses, the fs optical breakdown exhibits a much weaker dependence on the absorption coefficient of the target material. This facilitates the targeting of arbitrary cellular structures. Because the wavelength dependence of fs breakdown is weak, IR wavelengths that can penetrate tissue deeply can be used without compromising the precision of tissue effects, as is the case with nanosecond pulses.
The initial amount of subthreshold energy is invested to satisfy the condition to generate the plasma, and only a fraction of the energy above can be invested in generating the shock wave that ultimately leads to the cavitation bubble. Hence, the threshold energy is the only characterizing part of the bubble dimensions, i.e., all the curves of the bubble size vs. energy asymptotically trend to the same curve, as shown in the work by Vogel et al. [36]. Their results show no empirical plasma regime for most of the tested wavelengths and pulse durations, even if the plasma regime may exist. The cases not cleanly showing the plasma region may be “obscured” by a pedestal effect in the pulse duration. However, for ETh of ~120 nJ (the second blue curve from the left 355 nm in 0.5 ns in slide 35), ~220 nJ (the third blue curve from the left 355 nm in 1.0 ns in slide 35), ~1 µJ (the fourth blue curve from the left 355 nm in 7–11 ns in slide 35), and ~6 µJ (the third green curve from the left 532 nm in 7–11 ns), two regimes (plasma-induced ablation and photodisruption) are shown through the curved plots. These curves also suggest two different threshold energies depending on the interaction mechanism, where the threshold energy for the plasma regime is lower than that for photodisruption. The plasma regime for these cases extends up to ~400 nJ, ~800 nJ, ~60 µJ, and ~100 µJ, respectively. Analogous to the results shown in Table 3, for realistic estimates of the beam waist and pulse duration, the calculated peak energy and power density corresponding to the cross-over point for these four simulation cases are presented in Table 5 (ETh ~120, ~220, and ~1000 nJ for the 355 nm wavelength and ETh ~6000 nJ for the 532 nm wavelength). Because all these cases show a distinction between the two regimes in either the UV or green wavelength spectrum (unlike the data for near-infrared wavelengths), these data show that the two interaction mechanisms may depend on the wavelength and pulse duration. In our methods, this dependency is considered implicitly through the metric breakdown threshold energy. This can be regarded as a potential limitation to the global applicability of our findings. At the same time, this comparison highlights the merit of considering more than one modeling approach to represent the empirical data and to provide a reliable estimate of the true size (maximum radius) of cavitation bubbles.
A similar experimental study by Wang et al. [37] explored the dependence of the laser wavelength, comparing the textures of the edges of lens capsules cut with femtosecond lasers with IR and UV wavelengths to study the differences in the interactions of these lasers with biological molecules. They observed a laser-induced nonlinear breakdown of proteins and polypeptides upon exposure to 400 nm femtosecond pulses above and below the dielectric breakdown threshold. On the other hand, 800 nm femtosecond lasers do not produce significant dissociations, even above the threshold of dielectric breakdown. Despite this dependence on laser wavelength, they concluded that low thresholds, tight spot spacing, and a smaller focal volume for a given focusing geometry combine to produce very smoothly cut tissue edges. As reported in previous work [15], we only considered the threshold for bubble formation in this study. This threshold is usually lower than the threshold for dielectric breakdown [37] and lies below the actual photodisruption regime (high-density plasma), possibly in the region of low-density plasma that represents plasma-mediated ablation [5,38].
Plasmas with a large free-electron density are produced in a fairly large irradiance range below the breakdown threshold that is defined by a critical free-electron density (1021 cm1/3). To understand the full potential of fs pulses for highly localized material processing and modification of biological media, one, therefore, needs to include the irradiance range below the optical breakdown threshold. Moreover, one needs to elucidate why the conversion of absorbed laser light into mechanical energy above the breakdown threshold is much smaller than that for longer pulse durations. Simulations have shown that breakdown in bulk transparent media indicates that it is possible to create low-density plasmas in which the energy density remains below the level that leads to cavity formation in the medium. In biological media, optical breakdown is first initiated in a low-energy regime and characterized by bubble formation without plasma luminescence, with threshold pulse energies in the range of 4–5 μJ, depending on the medium’s formulation. The onset of this regime occurs over a very narrow range of pulse energies and produces small bubbles (maximum radius, 2–20 μm) due to a tiny conversion (η < 0.01%) of laser energy to bubble energy. At higher pulse energies (11–20 μJ), the process transitions to a second regime characterized by plasma luminescence and large bubble formation. The bubbles formed in this regime are 1–2 orders of magnitude larger in size (max radius ≳ 100 μm) due to a roughly two-order-of-magnitude increase in bubble energy conversion (η ≳ 3%). These characteristics are consistent with the high-density plasma formation induced by avalanche ionization and thermal runaway [38].
There are some limitations associated with this work. Spatially arranged pulses lead to coalescent bubbles that merge, resulting in a cleavage plane in the tissue. Too-low pulse energies might induce uncut areas (so-called “black spots”), leading to increased surgical manipulation during dissection and resulting in postoperative corneal edema and prolonged healing [4]; however, too-high pulse energies (or cumulative doses) would result in the formation of larger cavitation bubbles, severing the tissue (a so-called “opaque bubble layer”) and leading to local tissue distortion [14]. The expanding plasma significantly hinders laser penetration, a phenomenon known as plasma shielding. Our methods do not account for the plasma-shielding effects. In our methods, we assume that the system’s properties affect the threshold energy but that the resulting refined models universally apply to any system. An experimental confirmation of the presented theoretical findings should help us to verify our methods and results.
This presented approach cannot be considered universally applicable to all systems because the models for plasma-induced ablation in our methods do not consider the beam waist for the respective systems. However, the coefficients used in the equations could be adapted to be more universally applicable, as B = B′ × Beam waist (for PlasmaSQRT model) and C = C′ × Beam waist (PlasmaCRT model), where B′ and C′ would hold universally true for all systems. For the current state-of-the-art, the coefficients can be further generalized to B = B″ × √2 × Beam waist (for PlasmaSQRT model) and C = C″ × √2 × Beam waist (PlasmaCRT model), where C″ would hold universally true for all systems. It must be highlighted that although the beam waist varies for different systems and likely also majorly affects the threshold energy (ETh), the systems working at low threshold energies would still be close to one another.

5. Conclusions

In conclusion, our work refined prominent cavitation bubble models for photodisruption and plasma-induced ablation and demonstrated the fine differences between the models that helped us to better distinguish the two interaction mechanisms. Furthermore, we hypothesized a new model for plasma-induced ablation that considers the cavitation bubble volume and potentially better explains the bubble dynamics inside corneal tissue. By considering the proposed model (PlasmaCRT), these “separate” but “concurrent” physical phenomena can be better explained. Photodisruption builds upon plasma-induced ablation. Different regimes exist where one effect dominates over the other; however, there is no sharp transition between the effects. This implies the following:
  • Below the optical breakdown threshold, none of the effects take place.
  • Above the optical breakdown threshold, plasma-induced ablation always occurs. The models (PlasmaSQRT but further refined in the PlasmaCRT model) represent the expanding plasma region that initially grows rapidly but reaches its limit as the energy increases, leading to plasma-induced intratissue ablation (plasma melting).
  • Above the optical breakdown threshold, photodisruption also occurs.
  • Just above the optical breakdown threshold, despite its occurrence, photodisruption cannot be detected because the gas does not expand beyond the plasma volume, meaning that any photodisruption would be restricted within the ablation volume (plasma volume).
  • At pulse energies several times above the optical breakdown threshold, photodisruption (represented by the photodisruption model) dominates because the gas largely expands beyond the plasma volume. The cavitation bubble for expanding gas leads to photo-mechanical disruption, where the tissue is primarily split by mechanical forces, with shock wave and cavitation effects propagating into adjacent tissue.
In the invisible regime, where no expanding cavitation bubbles are visible when a cut is performed, one is clearly above the threshold energy and definitely in the plasma-induced ablation regime. In this energy regime, the gas does not create any relevant shock waves that would trigger the expanding cavitation bubble.
The proposed refined models can be applied to further optimize refractive lasers. With the refined models, one can better estimate the optimum energy regime for plasma-induced ablation, which can potentially further reduce the laser energy dose applied to a patient’s cornea. The calculation of the optimum single-pulse energy for a plasma-induced ablation regime should also consider additional factors, such as energy fluctuations that could result in black spots, system variabilities impacting the threshold energy, and patient variability. Combining these individual factors, a reasonable estimate is a buffer of ~+40% above the threshold energy. For the empirical threshold pulse energy for generating cavitation bubbles with the SCHWIND ATOS system, the optimum single-pulse energy calculated with these estimations is ~55 nJ (~40 nJ + 40% buffer). The response of such low pulse energies localized to the plasma-induced ablation regime should be clinically tested to truly observe their impact on patients.
Our theoretical exploration and comparison of the outcomes to empirical data from a commercial laser system substantiate that inadvertently using the photodisruption model to explain cavitation bubble dynamics for the entire spectrum of pulse energies and laser systems might produce erroneous estimates of cavitation bubble sizes. A reliable estimate of the true size (maximum radius) of the cavitation bubble can be reasonably retrieved as the maximum predicted size from the fit of the photodisruption model and the proposed PlasmaCRT model at any given pulse energy.

Author Contributions

Conceptualization, S.A.M. and S.V.; methodology, S.A.M. and S.V.; formal analysis, S.A.M. and S.V.; investigation, S.A.M. and S.V.; resources, S.A.M. and S.V.; data curation, S.A.M. and S.V.; writing—original draft preparation, S.V.; writing—review and editing, S.A.M. and S.V.; visualization, S.A.M. and S.V.; supervision, S.A.M.; project administration, S.A.M. All authors have read and agreed to the published version of the manuscript.

Funding

This research received no external funding.

Institutional Review Board Statement

Not applicable.

Informed Consent Statement

Not applicable.

Data Availability Statement

The data underlying the results presented in this paper are not publicly available at this time but may be obtained from the authors upon reasonable request.

Conflicts of Interest

The authors declare no conflicts of interest. The authors declare no competing interests. Both authors are employed by the company SCHWIND eye-tech solutions GmbH, Germany. There are no conflicts of interest between any of the authors and the company SCHWIND eye-tech solutions GmbH, Germany.

References

  1. Aron-Rosa, D.; Aron, J.J.; Griesemann, M.; Thyzel, R. Use of the neodymium-YAG laser to open the posterior capsule after lens implant surgery: A preliminary report. J. Am. Intraocul. Implant. Soc. 1980, 6, 352–354. [Google Scholar] [CrossRef]
  2. Boulnois, J.-L. Photophysical processes in recent medical laser developments: A review. Laser Med. Sci. 1986, 1, 47–66. [Google Scholar] [CrossRef]
  3. Markolf, H.N. Laser-Tissue Interactions: Fundamentals and Applications; Springer: Berlin/Heidelberg, Germany, 2004. [Google Scholar]
  4. Juhasz, T.; Hu, X.H.; Turi, L.; Bor, Z. Dynamics of shock waves and cavitation bubbles generated by picosecond laser pulses in corneal tissue and water. Lasers Surg. Med. 1994, 15, 91–98. [Google Scholar] [CrossRef] [PubMed]
  5. Tsai, P.S.; Blinder, P.; Migliori, B.J.; Neev, J.; Jin, Y.; Squier, J.A.; Kleinfeld, D. Plasma-mediated ablation: An optical tool for submicrometer surgery on neuronal and vascular systems. Curr. Opin. Biotechnol. 2009, 20, 90–99. [Google Scholar] [CrossRef] [PubMed] [PubMed Central]
  6. Smith, D.C.; Haught, A.F. Energy-Loss Processes in Optical-Frequency Gas Breakdown. Phys. Rev. Lett. 1966, 16, 1085–1088. [Google Scholar] [CrossRef]
  7. Teng, P.; Nishilka, N.S.; Anderson, R.R.; Deutsch, T.F. Acoustic studies of the role of immersion in plasma mediated laser ablation. IEEE J. Q. Electron. 1987, 23, 1845–1852. [Google Scholar] [CrossRef]
  8. Stern, D.; Schoenlein, R.W.; Puliafito, C.A.; Dobi, E.T.; Birnngruber, R.; Fujimote, J.G. Corneal ablation by nanosecond, picosend and femtosecond lasers at 532 and 625 nm. Arch. Ophthalmol. 1989, 107, 587–592. [Google Scholar] [CrossRef]
  9. Niemz, M.H.; Klancnik, E.G.; Bille, J.F. Plasma mediated ablation of corneal tissue at 1053 nm using a Nd:YLF oscillator/regenerative amplifier laser. Lasers Surg. Med. 1991, 11, 426–431. [Google Scholar] [CrossRef]
  10. Niemz, M.H. Investigation and spectral analysis of the plasma-induced ablation mechanism of dental hydroxyapatite. Appl. Phys. B 1994, 58, 273–281. [Google Scholar] [CrossRef]
  11. Krasnov, M.M. Laserpuncture of anterior chamber angle in glaucoma. Am. J. Ophthalmol. 1973, 75, 674–678. [Google Scholar] [CrossRef]
  12. Fankhauser, F.; Roussel, P.; Steffen, J.; van der Zypen, E.; Chrenkova, A. Clinical studies on the efficiency of high power laser radiation upon some structures of the anterior segment of the eye. Int. Ophthalmol. 1981, 3, 129–139. [Google Scholar] [CrossRef] [PubMed]
  13. Niemz, M.K. Laser-Tissue Interactions: Fundamentals and Applications, 3rd ed.; Springer: Berlin/Heidelberg, Germany, 2007. [Google Scholar]
  14. Arba-Mosquera, S.; Naubereit, P.; Sobutas, S.; Verma, S. Analytical optimization of the cutting efficiency for generic cavitation bubbles. Biomed. Opt. Express. 2021, 12, 3819–3835. [Google Scholar] [CrossRef] [PubMed] [PubMed Central]
  15. Vogel, A.; Linz, N.; Freidank, S.; Paltauf, G. Femtosecond-laser-induced nanocavitation in water: Implications for optical breakdown threshold and cell surgery. Phys. Rev. Lett. 2008, 100, 038102. [Google Scholar] [CrossRef] [PubMed]
  16. Zysset, B.; Fujimoto, J.G.; Deutsch, T.F. Time-resolved measurements of picosecond optical breakdown. Appl. Phys. B 1989, 48, 139–147. [Google Scholar] [CrossRef]
  17. Vogel, A.; Capon, M.R.; Asiyo-Vogel, M.N.; Birngruber, R. Intraocular photodisruption with picosecond and nanosecond laser pulses: Tissue effects in cornea, lens, and retina. Investig. Ophthalmol. Vis. Sci. 1994, 35, 3032–3044. [Google Scholar]
  18. Juhasz, T.; Kastis, G.A.; Suárez, C.; Bor, Z.; Bron, W.E. Time-resolved observations of shock waves and cavitation bubbles generated by femtosecond laser pulses in corneal tissue and water. Lasers Surg. Med. 1996, 19, 23–31. [Google Scholar] [CrossRef] [PubMed]
  19. Aglyamov, S.R.; Karpiouk, A.B.; Bourgeois, F.; Ben-Yakar, A.; Emelianov, S.Y. Ultrasound measurements of cavitation bubble radius for femtosecond laser-induced breakdown in water. Opt. Lett. 2008, 33, 1357–1359. [Google Scholar] [CrossRef] [PubMed] [PubMed Central]
  20. Vogel, A.; Busch, S.; Jungnickel, K.; Birngruber, R. Mechanisms of intraocular photodisruption with picosecond and nanosecond laser pulses. Lasers Surg. Med. 1994, 15, 32–43. [Google Scholar] [CrossRef] [PubMed]
  21. Schaffer, C.B.; Brodeur, A.; García, J.F.; Mazur, E. Micromachining bulk glass by use of femtosecond laser pulses with nanojoule energy. Opt. Lett. 2001, 26, 93–95. [Google Scholar] [CrossRef]
  22. Arnold, C.L.; Heisterkamp, A.; Ertmer, W.; Lubatschowski, H. Computational model for nonlinear plasma formation in high NA micromachining of transparent materials and biological cells. Opt. Express 2007, 15, 10303–10317. [Google Scholar] [CrossRef]
  23. Vogel, A.; Nahen, K.; Theisen, D.; Birngruber, R.; Thomas, R.J.; Rockwell, B.A. Influence of optical aberrations on laser-induced plasma formation in water and their consequences for intraocular photodisruption. Appl. Opt. 1999, 38, 3636–3643. [Google Scholar] [CrossRef] [PubMed]
  24. Giguère, D.; Olivié, G.; Vidal, F.; Toetsch, S.; Girard, G.; Ozaki, T.; Kieffer, J.C.; Nada, O.; Brunette, I. Laser ablation threshold dependence on pulse duration for fused silica and corneal tissues: Experiments and modeling. J. Opt. Soc. Am. A Opt. Image Sci. Vis. 2007, 24, 1562–1568. [Google Scholar] [CrossRef] [PubMed]
  25. Amann, H.; Mosquera, S.A. Optimization of the Spot Spacings for Reducing Roughness in Laser-Induced Optical Breakdown Processes for Corneal Laser Vision Correction. Photonics 2024, 11, 114. [Google Scholar] [CrossRef]
  26. Garcia-Lechuga, M.; El Reaidy, G.G.; Ning, H.; Delaporte, P.; Grojo, D. Assessing the limits of determinism and precision in ultrafast laser ablation. Appl. Phys. Lett. 2020, 117, 171604. [Google Scholar] [CrossRef]
  27. Reinstein, D.Z.; Archer, T.J.; Gobbe, M. Accuracy and reproducibility of cap thickness in small incision lenticule extraction. J. Refract. Surg. 2013, 29, 810–818. [Google Scholar] [CrossRef]
  28. Tinne, N.; Schumacher, S.; Nuzzo, V.; Arnold, C.L.; Lubatschowski, H.; Ripken, T. Interaction dynamics of spatially separated cavitation bubbles in water. J. Biomed. Opt. 2010, 15, 068003. [Google Scholar] [CrossRef]
  29. Tinne, N.; Lübking, E.; Lubatschowski, H.; Krüger, A.; Ripken, T. The influence of a spatial and temporal pulse-overlap on the laser-tissue-interaction of modern ophthalmic laser systems. Biomed. Eng./Biomed. Tech. 2012, 57, 302–305. [Google Scholar] [CrossRef]
  30. Sinibaldi, G.; Occhicone, A.; Pereira, F.; Caprini, D.; Marino, L.; Michelotti, F.; Casciola, C. Laser induced cavitation: Plasma generation and breakdown shockwave. Phys. Fluids 2019, 31, 103302. [Google Scholar] [CrossRef]
  31. Noack, J.; Vogel, A. Laser-induced plasma formation in water at nanosecond to femtosecond time scales: Calculation of thresholds, absorption coefficients, and energy density. IEEE J. Quantum Electron. 1999, 35, 1156–1167. [Google Scholar] [CrossRef]
  32. Liu, J.M. Simple technique for measurements of pulsed Gaussian-beam spot sizes. Opt. Lett. 1982, 7, 196–198. [Google Scholar] [CrossRef] [PubMed]
  33. Tinne, N.; Kaune, B.; Krüger, A.; Ripken, T. Interaction mechanisms of cavitation bubbles induced by spatially and temporally separated fs-laser pulses. PLoS ONE 2014, 9, e114437. [Google Scholar] [CrossRef] [PubMed]
  34. Senegačnik, M.; Kunimoto, K.; Yamaguchi, S.; Kimura, K.; Sakka, T.; Gregorčič, P. Dynamics of laser-induced cavitation bubble during expansion over sharp-edge geometry submerged in liquid—An inside view by diffuse illumination. Ultrason. Sonochem. 2021, 73, 105460. [Google Scholar] [CrossRef] [PubMed] [PubMed Central]
  35. Vogel, A.; Noack, J.; Hüttman, G.; Paltauf, G. Mechanisms of femtosecond laser nanosurgery of cells and tissues. Appl. Phys. B 2005, 81, 1015–1047. [Google Scholar] [CrossRef]
  36. Vogel, A. Laserdisruption: Plasma-Mediated Surgery. Lecture 2020. Slides 33–36. Available online: https://www.bmo.uni-luebeck.de/fileadmin/files/Verschiedenes/Lehre/Lasermedizin/Scripte_2012/08_Laserdisruption.pdf (accessed on 17 November 2020).
  37. Wang, J.; Schuele, G.; Palanker, D. Finesse of transparent tissue cutting by ultrafast lasers at various wavelengths. J. Biomed. Opt. 2015, 20, 125004. [Google Scholar] [CrossRef]
  38. Genc, S.L.; Ma, H.; Venugopalan, V. Low-density plasma formation in aqueous biological media using sub-nanosecond laser pulses. Appl. Phys. Lett. 2014, 105, 063701. [Google Scholar] [CrossRef] [PubMed] [PubMed Central]
Figure 1. Map of laser–tissue interactions derived from Boulnois [2].
Photonics 11 01047 g001
Figure 2. Distinction of plasma-induced ablation and photodisruption according to the applied energy density. Note that, for nanosecond pluses, purely plasma-induced ablation is not observed but is always associated with disruptive effects, even at the threshold for optical breakdown. The figure was derived and redrawn from previous work [13].
Photonics 11 01047 g002
Figure 3. Relationship between the bubble diameter and pulse energy for the two interaction models (photodisruption and PlasmaSQRT models) for an ETh of (a) 30, (b) 50, (c) 70, and (d) 300 nJ. (e) A limiting case is explored and presented for the minimum threshold energy (113 nJ) for which the photodisruption effect dominates for any suprathreshold energy. Note that the coefficients were calculated for the bubble radius in the methods, yet the graphs represent the bubble diameter for better interpretation. The X and Y axes are in the logarithmic scale of base 2.
Photonics 11 01047 g003
Figure 4. Relationship between the bubble diameter and pulse energy for the three interaction models (photodisruption, PlasmaSQRT, and PlasmaCRT) for an ETh of 63 nJ. Note that the coefficients were calculated for the bubble radius in the methods, yet the graphs represent the bubble diameter for better interpretation. The X and Y axes are in the logarithmic scale of base 2.
Photonics 11 01047 g004
Table 1. The values of the coefficients obtained for the photodisruption model and PlasmaSQRT model.
CoefficientK (Photodisruption Model) B (PlasmaSQRT Model)
Global Optimum Value~0.63.433
Table 2. The values of the coefficients obtained for the photodisruption, PlasmaSQRT, and PlasmaCRT models.
CoefficientK (Photodisruption Model) B (PlasmaSQRT Model)C (PlasmaCRT Model)
Global Optimum Value~0.63.4333.735
Table 3. Peak energies and power densities corresponding to the cross-over points for all the simulated cases calculated for estimates of the pulse duration and beam waist.
Threshold Energy (nJ)Estimated Pulse Duration (fs)Estimated Beam Waist (µm)Cross-Over Energy (nJ)Peak Energy Density (J/cm2)Peak Power Density (W/cm2)
30190~2.61623~15~8.0E+13
40200~2.71316~11~5.7E+13
50210~2.81110~9~4.3E+13
70270~3.0768~5~2.0E+13
300800~4.2No cross-over~2~2.2E+12
113300~3.6No cross-over~1~4.3E+12
63250~2.9895~7~2.7E+13
Table 4. Analytical and numerical presentation of the optimum amount of pulse energy (minimum, maximum, and proper optimum) imparted onto the tissue following each model described in this work, following a previously published method [14].
ModelPhotodisruption ModelPlasmaSQRT ModelPlasmaCRT Model
CategoryminOpt (nJ)maxOpt (nJ)properOpt (nJ)minOpt (nJ)maxOpt (nJ)properOpt (nJ)minOpt (nJ)maxOpt (nJ)properOpt (nJ)
Analytical Expression3/2 × ETh3 × ETh2 × ETh e × EThe × ETh2 × EThe(1/3) × EThe(2/3) × EThe(1/2) × ETh
Threshold Energy (nJ)
30459060498260425849
4060120806610980567866
507515010082136100709782
7010521014011519014098136115
300450900600495815600419584495
113170339226186307226158220186
639518912610417112688123104
Table 5. Peak energies and power densities corresponding to the cross-over points for selected simulation cases from the work by Vogel et al. [36] were calculated for estimates of the pulse duration and beam waist.
Threshold Energy (nJ)Estimate of Pulse DurationEstimate of Beam Waist (µm)Cross-Over EnergyPeak Energy Density (J/cm2)Peak Power Density (W/cm2)
~120500 ps~0.4400 nJ~175~3.5E+11
~2201 ns~0.4800 nJ~350~3.5E+11
~10007–11 ns~0.460 µJ~26,000~2.9E+12
~60007–11 ns~0.4100 µJ~19,000~2.1E+12
Disclaimer/Publisher’s Note: The statements, opinions and data contained in all publications are solely those of the individual author(s) and contributor(s) and not of MDPI and/or the editor(s). MDPI and/or the editor(s) disclaim responsibility for any injury to people or property resulting from any ideas, methods, instructions or products referred to in the content.

