1. Introduction
CVBs (cylindrical vector beams) exhibit many superior characteristics in the field of laser processing due to their ability to generate unique and powerful local longitudinal electric fields in any plane parallel to the optical axis under strong focusing conditions [
1,
2]. This beam’s axisymmetric polarization and intensity distribution significantly enhance its processing speed and quality during laser welding, cutting, drilling, and micro/nanomaterial processing. For instance, CVBs used in laser welding and cutting can increase processing speed by 1.5–2-fold [
3,
4], while also achieving higher hole-width-to-hole-depth ratios and smoother hole walls during laser drilling [
5]. Additionally, CVBs can create superior biomimetic surface structures [
6], making them ideal for high-quality, high-efficiency [
7] laser processing. By combining the rotational Doppler effect, the angular velocity of a rotating object can be measured [
8].
In recent years, significant progress has also been made in the research of CVB amplifiers. In 2008, the Fridman Moti team [
9] at the Weizmann Institute of Science in Israel constructed an oscillator cavity using a large-mode-area Er-doped fiber with a length of 10 m, core/cladding diameters of 20/125 μm, and a numerical aperture of 0.07 as the gain medium. They employed a thin film polarizer as the polarization device and a spatially variable delay line with a gradual change along the slow axis as the polarization twisting device. Ultimately, the output power for both the TM
01 and TE
01 modes reached 45 mW, with an M
2 value of 2.05, and the polarization purities for the TM
01 and TE
01 modes were 92% and 90%. In 2019, Jefferson–Brain [
10] from the University of Southampton in the UK used a TM01 mode output Yb:YAG laser as the seed source for a thermal conductive fiber amplifier with a Yb-doped thermal conductive fiber rod as the gain medium, achieving a TM01 mode output with a power of 10.7 W, with a minimal increase in the M
2 parameter. In 2023, Iuliia Zalesskaia [
11] from Tampere University in Finland used a 15 MHz repetition rate, a 10 ps pulse linear polarization seed source, and an S-wave plate to convert linear-polarized light to radial-polarized light, setting up an MOPA laser with spun tapered double-clad fibers (sT-DCFs), maintaining a good beam shape and polarization state. They also achieved a TM01 mode output with an average power of 14.5 W, a peak power of 91 kW, and a pulse energy of 0.97 μJ. In 2016, Liu [
12] et al. from the National University of Defense Technology used a mechanical LPFG for mode conversion and an LMA-YDF with core/cladding diameters of 25/250 μm and a numerical aperture of 0.06, achieving a continuous LP
11 mode output of 117 W with a center wavelength of 1059.3 nm, a conversion efficiency of 66%, a signal-to-noise ratio of >40 dB, and a 3 dB linewidth of 0.03 nm, with a 1000 s stability of ±1%. In 2023, Liu Shixin [
13] from Shandong University used femtosecond laser etching on quartz glass to design and manufacture an integrated metamaterial mode conversion fiber device, setting up a fully fiber-based cylindrical vector MOPA laser with a gain fiber of 11 m, core/cladding diameters of 20/400 μm, an inner cladding numerical aperture of 0.0064, and an absorption coefficient of 1.2 dB/m at 975 nm. They achieved a radial-polarized light output with 95.2% polarization purity, 94% mode purity, and 52.2 W output power, with an amplifier slope efficiency of 58.7%.
The above solutions mainly use different mode selection schemes combined with various fibers for amplification. For gain medium selection, single-crystal fibers or thermal conductive fiber rods are limited by their size and doping concentration, leading to low amplification efficiency and high heat generation. Although sT-DCF has advantages, it is difficult to manufacture and costly. By comparing the CVB generation schemes and the research on foreign CVB fiber amplification schemes, this paper proposes, for the first time, the use of a mode selection coupler made using the fusion tapering method as an external mode conversion device. Large-mode-area Yb-doped fibers are utilized to construct a one-stage MOPA structure for the fiber amplification of CVBs. The mode purity and beam quality of the amplified CVBs remain at a high level. This approach not only simplifies fabrication and improves operational control, but also achieves high mode conversion efficiency and low heat generation.
2. Principle Experimental Analysis
In optical fibers, the constraints of the core boundary allow single-mode fibers, with their smaller core diameter, to support stable mode propagation within the core. In contrast, multi-mode fibers, with larger cores, can support multiple modes propagating simultaneously. In a CVB fiber amplifier, achieving 100% mode purity of the polarized light is challenging due to factors such as mode converters and fiber splicing. During amplification, other modes may be transmitted and amplified alongside the primary mode, potentially leading to a decrease in mode purity during power amplification, which directly affects the characteristics of the CVBs after amplification. This reduction in mode purity is primarily due to multi-mode coupling and mode competition during amplification, as well as thermally induced birefringence during transmission. Traditional fiber amplifier models do not account for these phenomena, so it is necessary to reanalyze and adjust traditional fiber amplifier models to address the specific structural characteristics of large-mode-area fiber amplifiers.
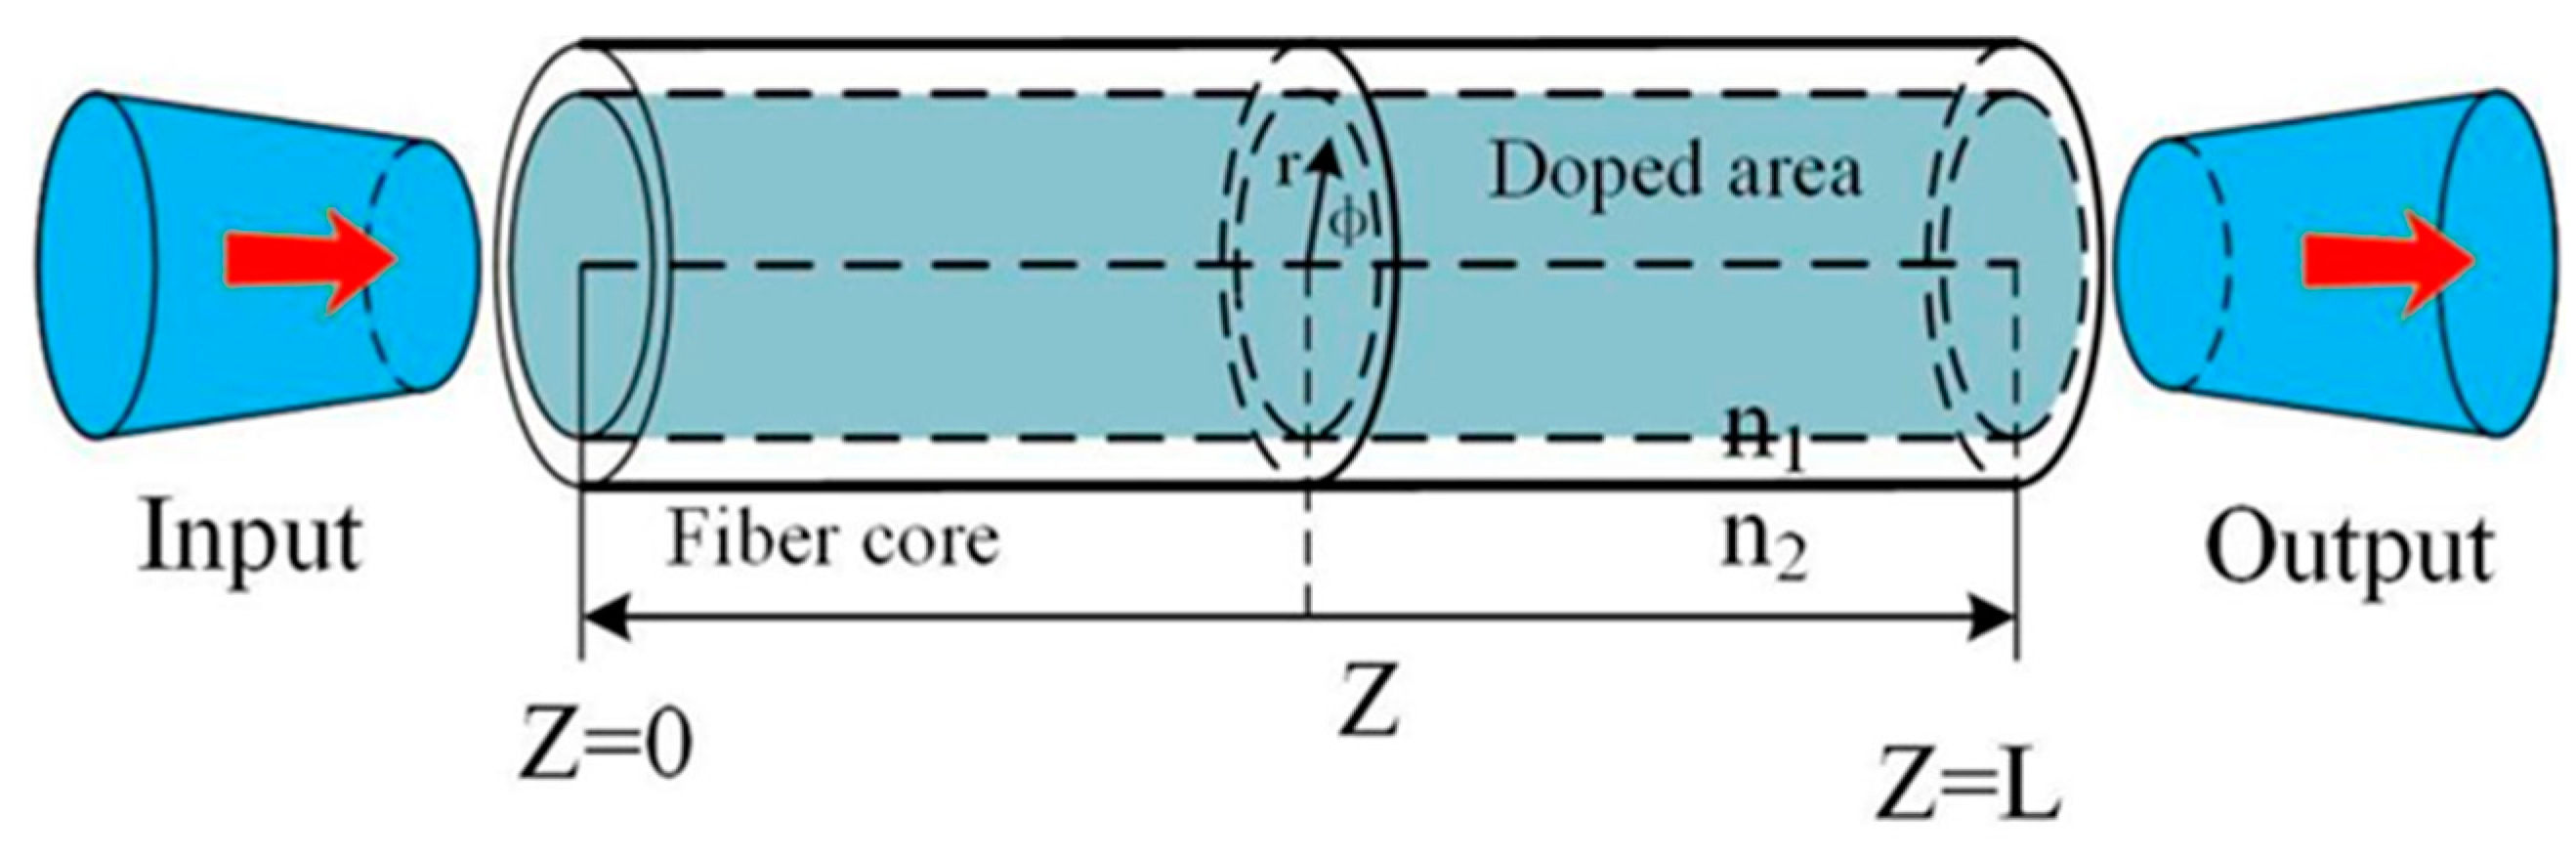
Compared to traditional single-mode fiber amplifiers, large-mode-field fiber amplifiers enable multimode transmission of the signal laser within the gain medium fiber. The physical processes of a large-mode-field fiber amplifier include the following three steps: end-face excitation, where the signal light is coupled into the input end-face of the gain fiber; intermediate transmission zone amplification, where the signal light is amplified as it travels through the gain fiber; and output, where the amplified signal light is emitted from the output end of the fiber, as shown in
Figure 1.
According to the fiber end-face excitation theory, when signal light is injected from the front end-face of a large-mode-field fiber into the core, several transmission modes will be excited, and the initial power of these modes depends on the end-face excitation conditions [
14,
15,
16]. During amplification in the core, each mode may interact with doped ions in regions of higher field strength to gain amplification [
17]. This leads to mode competition phenomena similar to the spatial hole burning effect in solid-state lasers [
18]. In an ideal medium, the confined modes in the fiber should be able to propagate independently within the core without power exchange. This phenomenon is attributed to gain differences, which lead to “competition” between modes. However, in practical applications, due to potential non-uniformities in the fiber’s refractive index distribution and inconsistencies in waveguide boundaries, these factors facilitate power exchange between modes, resulting in mode coupling phenomena.
In a gain medium fiber, if there are M transmissible modes, the power variation in these modes during propagation in the core can be expressed as follows:
In this equation, α0m represents the inherent loss coefficient of the m-th mode within the fiber, Pm denotes the power of the m-th mode, and dij is the power coupling coefficient between the i-th and j-th modes. According to the derivation of Formula (1), it can be concluded that mode coupling is mutual.
Overall, after signal light undergoes transmission, amplification, and coupling in a large-mode-field gain fiber, the light from different modes is output with varying powers, and the output mode field determines the beam quality and other characteristics of the output light.
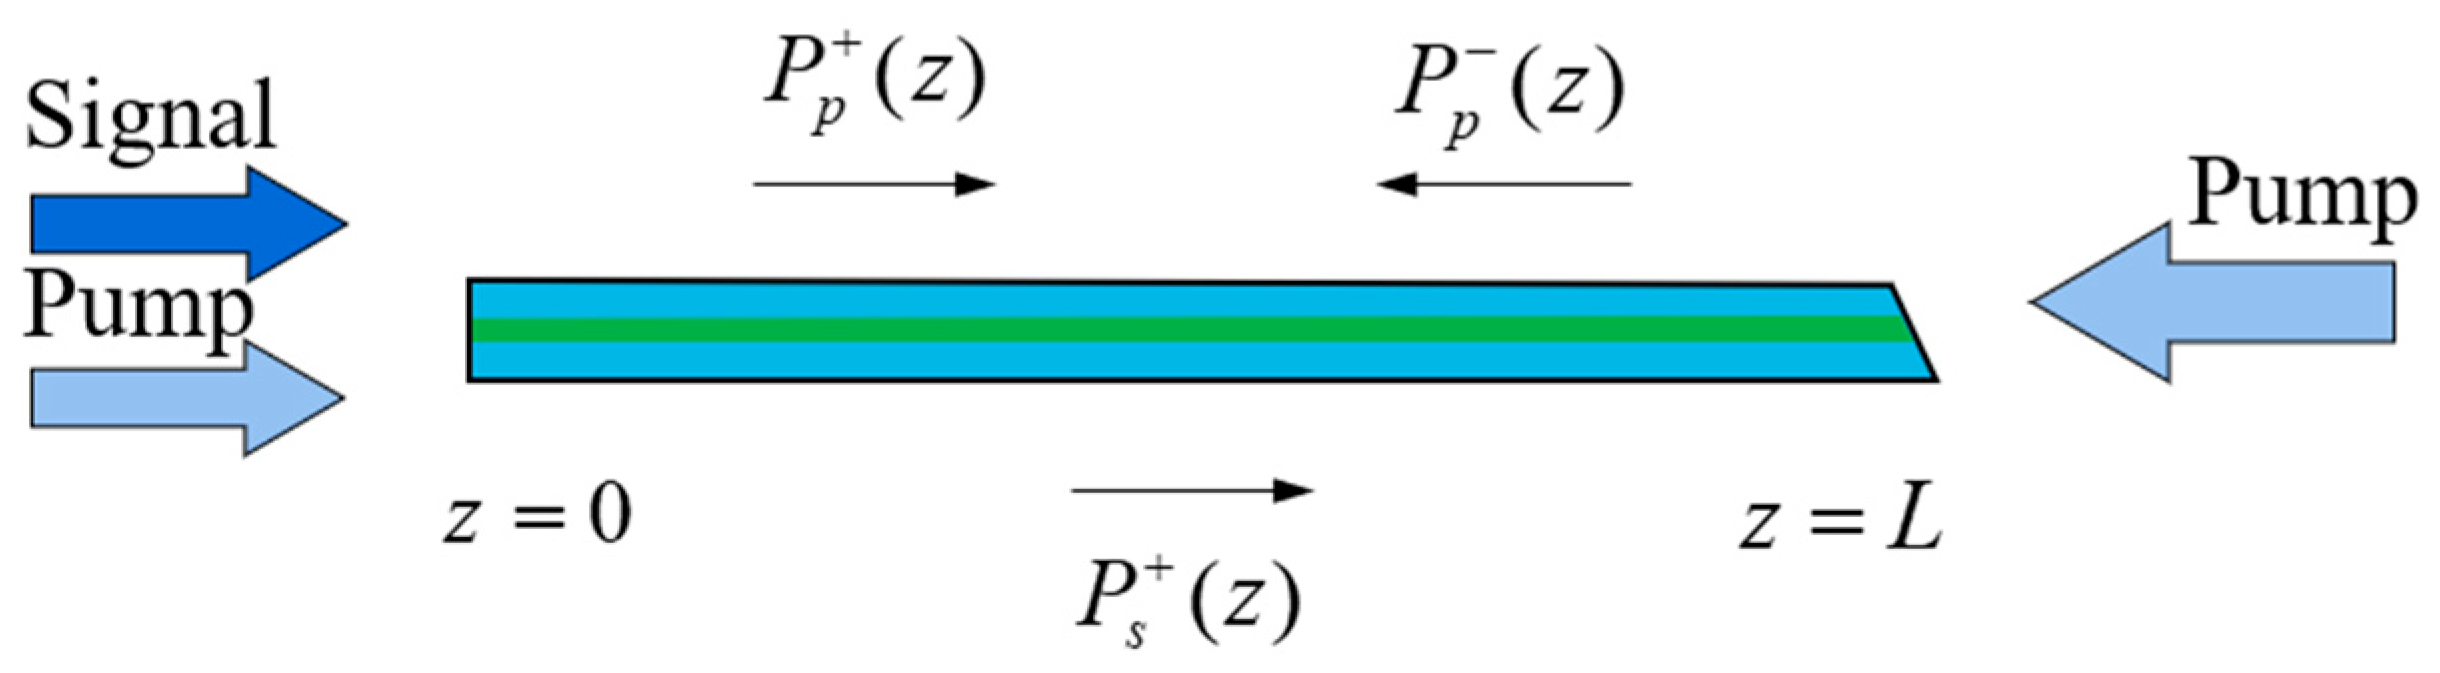
In a typical fiber amplifier model, two mirrors are removed to construct the linear cavity model shown in
Figure 2. The following assumptions are made in this model: the absorption of the excited state is neglected, approximating it as a two-level system. For strong pump multimode fibers, it is assumed that the pump light is uniform across the fiber cladding’s cross-section, and amplified spontaneous emission (ASE) is neglected, constructing a multimode transmission model.
In the formula, denotes the power of the i-th mode for both forward and backward directions; and represent the particle number densities of the lower and upper laser levels (); is the sum of the particle number densities of the upper and lower levels; and are the absorption and emission cross-sections of the pump light; and are the absorption and emission cross-sections of the signal light, respectively; and are the scattering loss factors for the i-th mode pump light and signal light, respectively; and are the frequencies of the pump light and signal light, respectively; is the pump light power fill factor; is the power fill factor for the i-th mode signal light; τ is the spontaneous lifetime of the laser upper level ions; and h is Planck’s constant.
The boundary conditions for the laser are as follows:
In this formula,
and
are the pump power at the end-faces of the fiber cladding at
z = 0 and
z = L. The laser output power of the fiber laser is as follows:
The power fill factors
and
characterize the interaction strength between the pump light and the
i-th mode signal light with the doped ions. The factors
and
can be interpreted as the relative power densities of the pump light and the
i-th mode signal light at coordinate
on the fiber cross-section, expressed as follows:
In this formula,
Aclad is the cross-sectional area of the cladding and
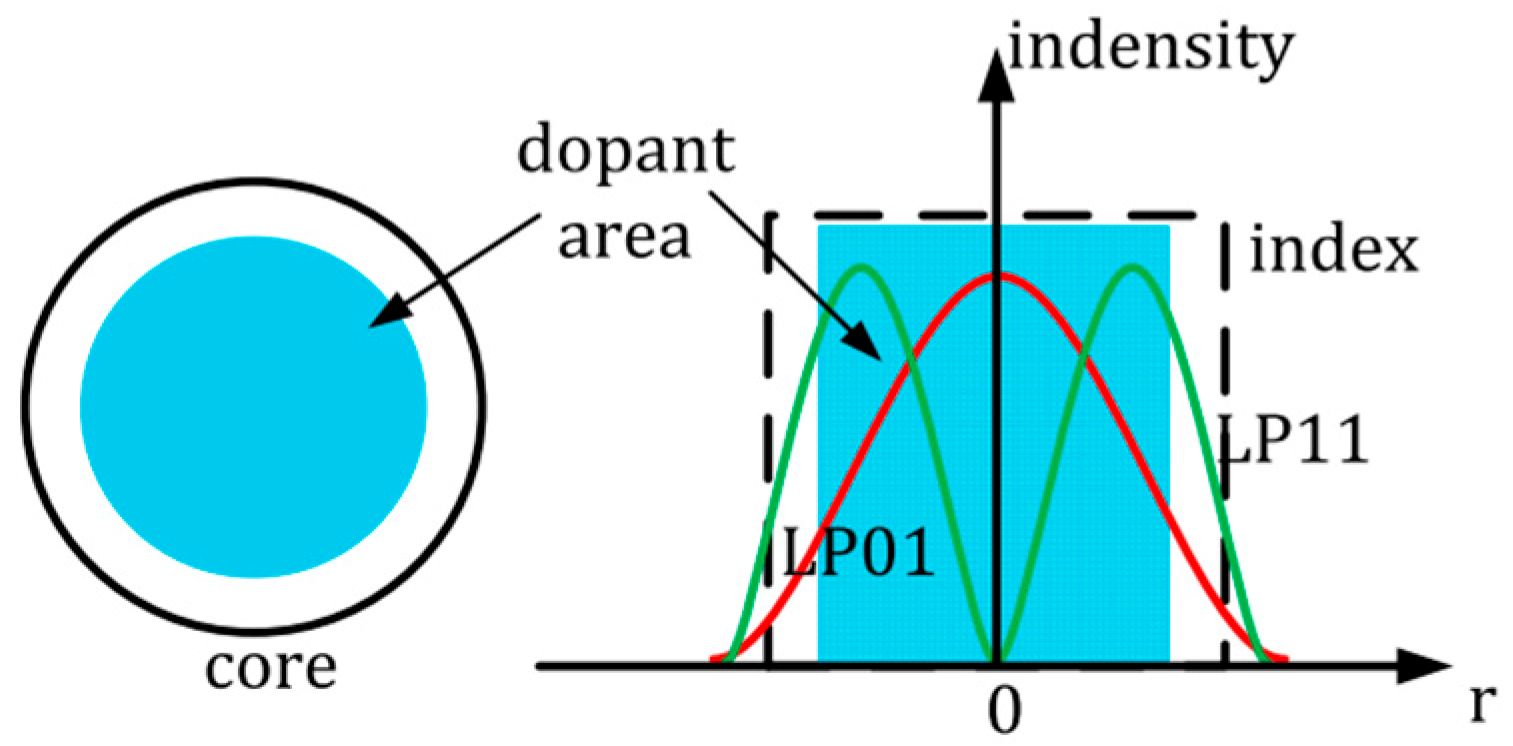
is the intensity distribution function of the i-th mode. Formula (9) describes the variation in the power of the pump light and signal light (for each individual transverse mode) along the length of the fiber. When the doped ions are distributed non-uniformly in the core region, the gain obtained by each propagating mode in the core depends on the power fill factor and the distribution of the doped ions. In the case of a uniform doping distribution, the gain is more significant for modes with higher power distribution in the core, resulting in the fundamental mode achieving the maximum gain, as shown in
Figure 3.
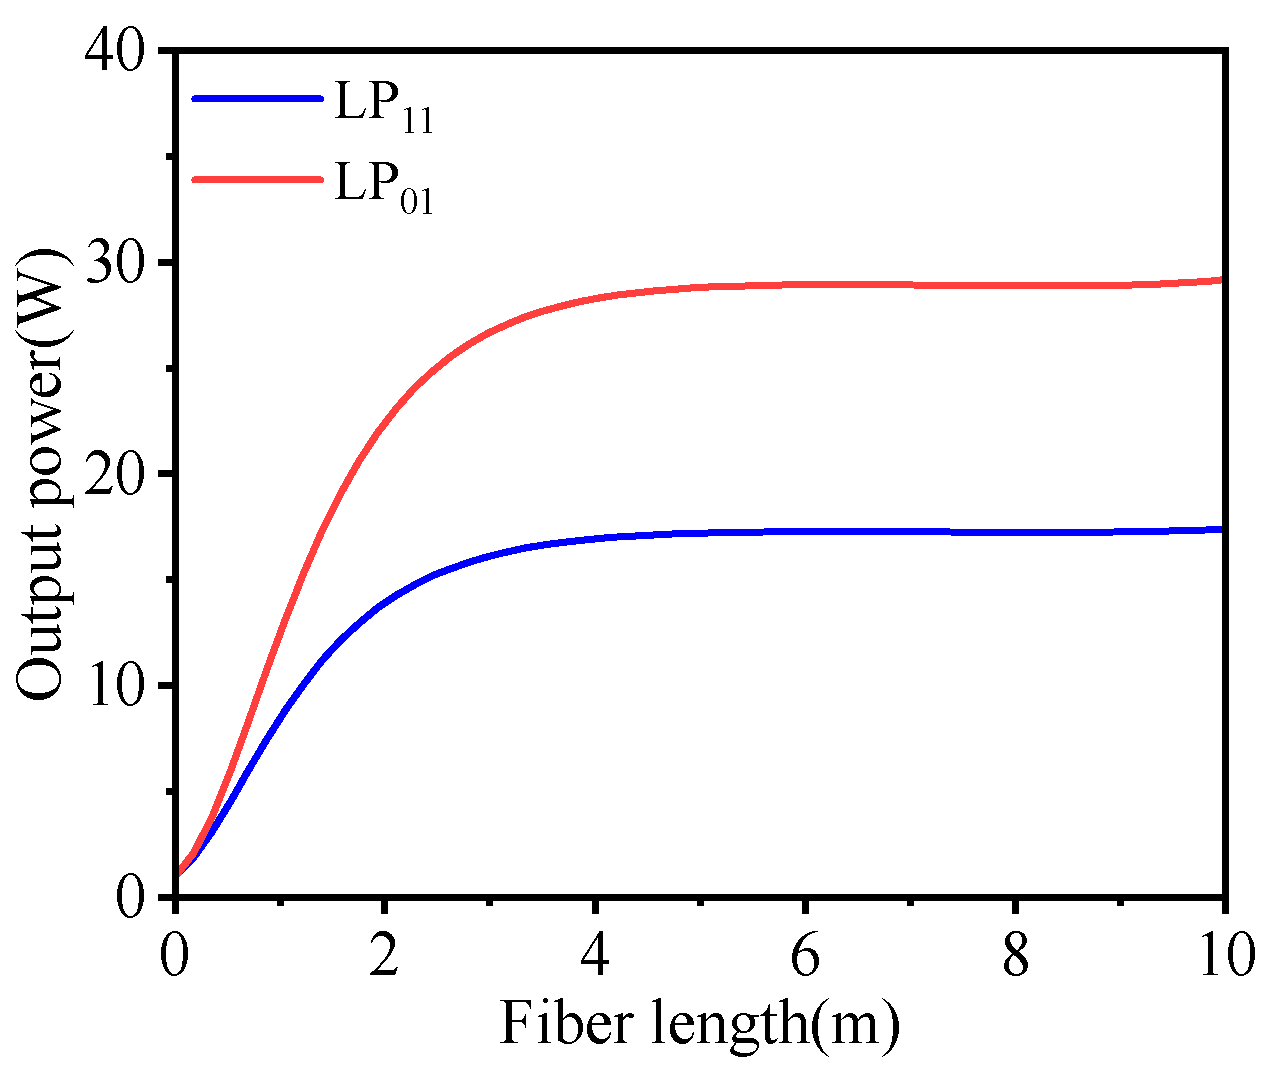
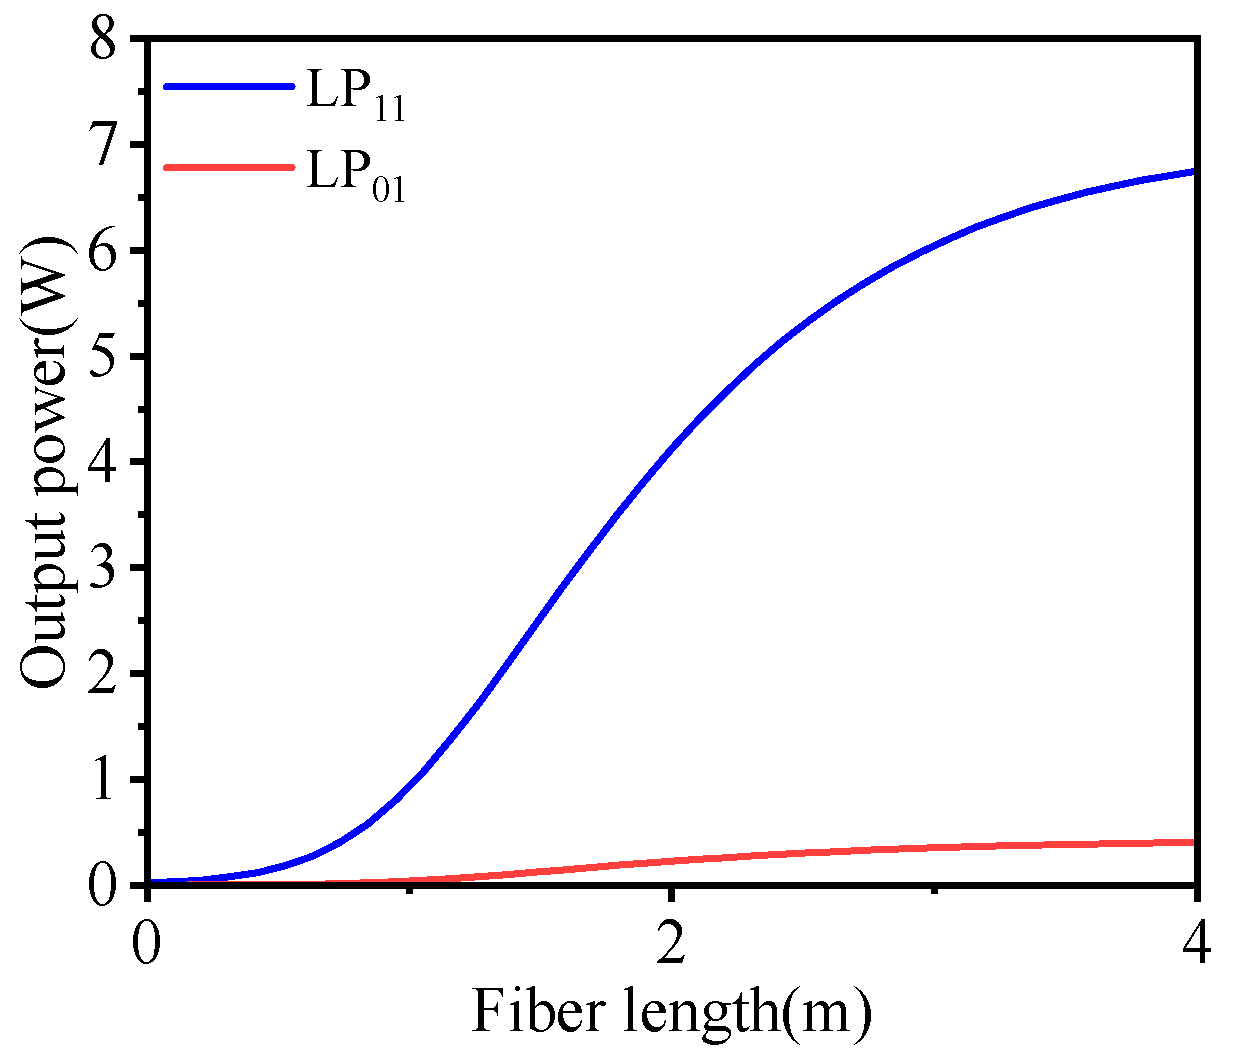
As shown in
Figure 4, under the same pump power and input power, the LP
01 mode is more easily amplified and exhibits a higher amplification efficiency.
Figure 5 illustrates the purity of the LP
11 mode after amplification, with 97% mode purity. For a fiber length of 4 m, the purity is calculated to be 94.38% through the command window. It should be noted that this result is solely due to the simultaneous amplification of the LP
01 mode and does not account for thermal effects in the fiber. Thus, it is evident that, during the amplification of the LP
11 mode, it is crucial to minimize the presence of the LP
01 mode to avoid a reduction in the mode purity of the LP
11 mode, due to the simultaneous amplification of the LP
01 mode.
The parameters used in the numerical simulation are listed in
Table 1. First, the power fill factors for the LP
11 and LP
01 modes were calculated using the parameters from
Table 1, and these were then substituted into the aforementioned rate equations to solve them. As shown in
Figure 3, using forward pumping with a pump power of 50 W and a fiber length of 10 m, output power variations along the fiber length were obtained under an initial power of 1 W for simultaneous amplification of the LP
11 and LP
01 modes. Next, with an initial power of 19.4 mW for the LP
11 mode and 0.6 mW for the LP
01 mode and an LP
11 mode purity of 97%, the relationship under a 10 W forward pump power is shown in
Figure 5.
To gain a deeper understanding of the generation and amplification mechanisms of polarized light in optical fibers, this section analyzes the coupling and competition characteristics of different modes in large-mode-area fibers through the theory of large-mode-area fiber lasers. A set of rate equations for multi-mode fiber amplifiers was established to analyze the gain achieved by each transmission mode within the core. Numerical simulations were conducted to compare the amplification of LP01 and LP11 modes in an LMA-YDF-15/130-M fiber under the same pump power and input power conditions. The simulations showed that, with a pump power of 10 W, in a 4-m-long gain fiber, and a seed power of 20 mW, the LP01 mode was more easily amplified than the LP11 mode. After amplification, the mode purity of CVBs, initially at 97%, decreased to 94.38%. This provides theoretical guidance for the experimental study of CVB fiber laser amplifiers in the next sections.
3. Experimental Apparatus
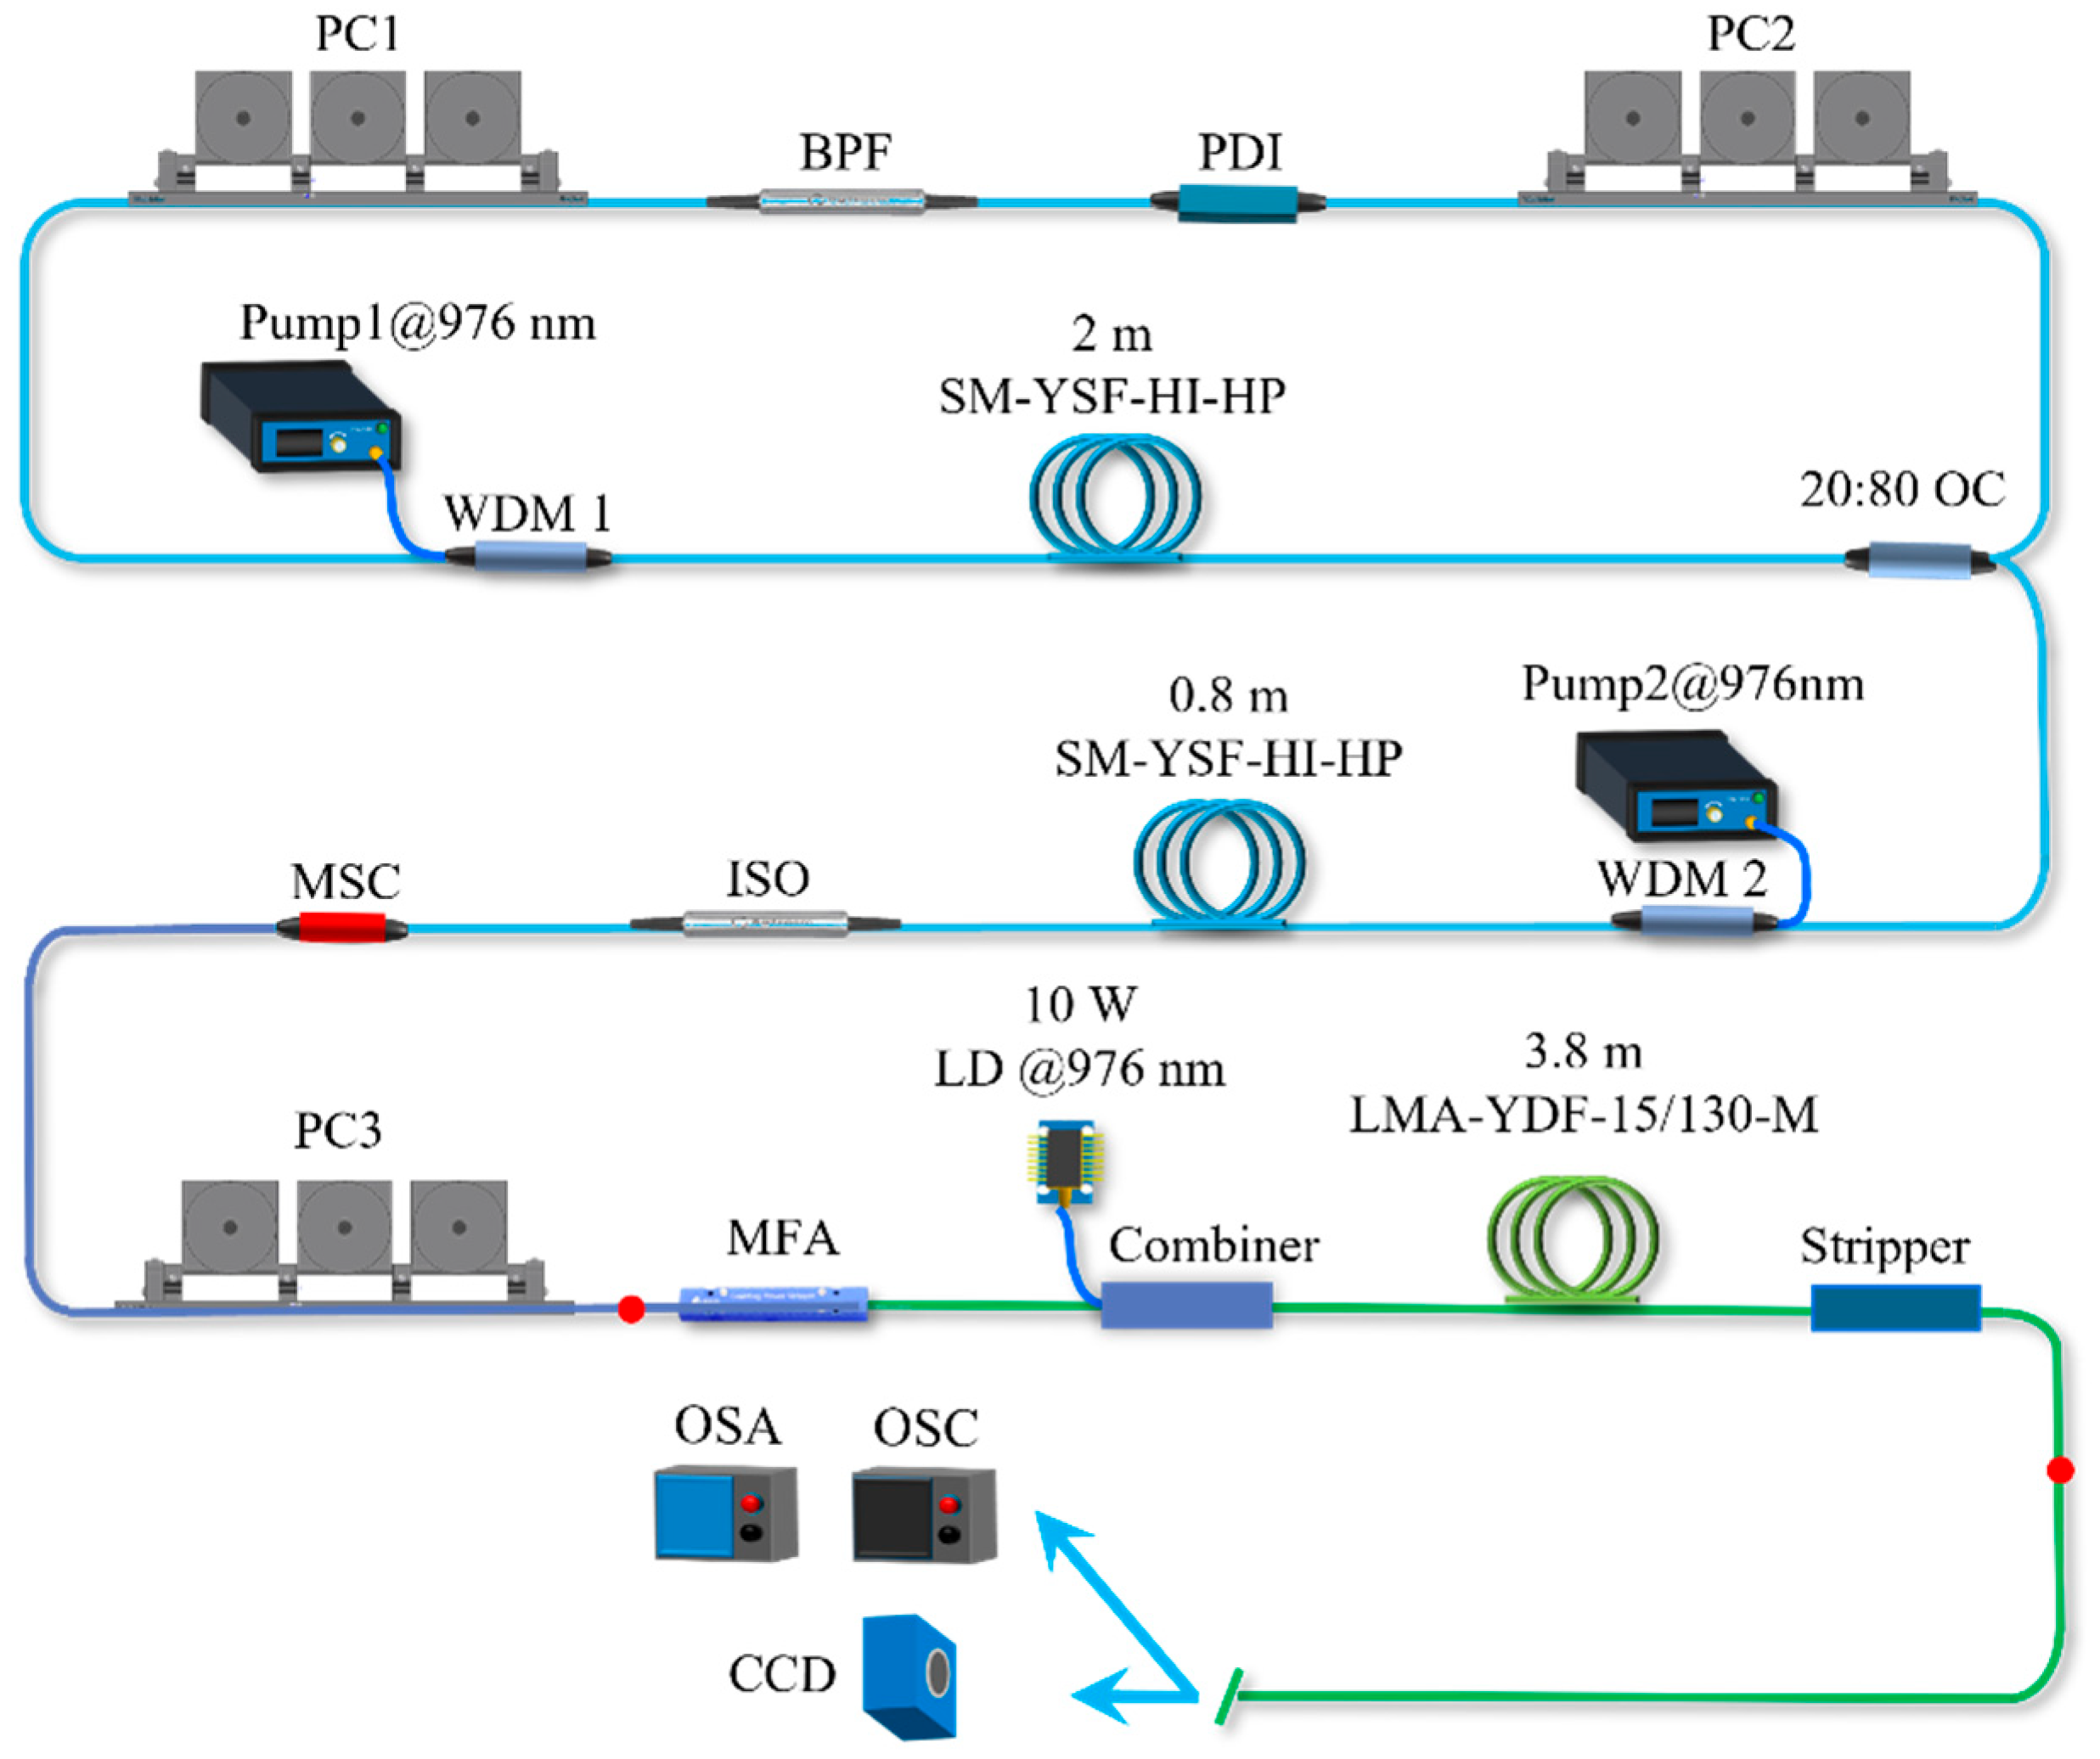
The experiment on all-fiber passive mode-locking amplifiers using NPR (nonlinear polarization rotation) mode-locking technology is illustrated in
Figure 6. A 976 nm single-mode laser diode (LD) was coupled into the ring cavity through a 980/1060 nm wavelength division multiplexer (WDM1). The gain medium was a 2-m-long ytterbium-doped fiber with core/cladding diameters of 6/125 μm, and the core absorption coefficient was 250 dB/m at 976 nm. The NPR mode-locking module consisted of a polarization-dependent isolator (PDI) and two three-paddle polarization controllers (PC), where the band-pass filter (BPF) provided spectral filtering. A single-mode fiber-optical coupler (SMF-OC) with a 20/80 coupling ratio was used as the output end. The pre-amp stage was constructed with a 0.8 m Nufern SM-YSF-HI-HP, an LD with a maximum power of 500 mW, and a WDM of 980/1060 nm. The light output from the pre-amp stage was injected into the mode selective coupler (MSC) through an isolator, converting the LP
01 mode to the LP
11 mode. The MSC was made from two types of optical fibers, Nufern HI1060 and Nufern HI1060, via fusion drawing. The Nufern HI1060 had core/cladding diameters of 8.2/125 μm, with an NA of 0.14 and a normalized frequency of 3.4; it only supported the fundamental mode and the second-order modes TM
01, TE
01, and HE
21 (both odd and even). The Nufern HI1060 had core/cladding diameters of 5.3/125 μm and an NA of 0.14, supporting only the fundamental mode; a single-mode fiber was used for the 1 μm wavelength range. Due to the differing parameters of SMFs and FMFs, the propagation constants were not equal. During production, the SMF was typically tapered to change its effective refractive index, thus meeting the phase-matching conditions and enabling mode coupling and conversion from the fundamental mode to higher-order modes in the coupling region. Using an MSC for mode conversion is simpler, provides a higher mode purity, is cost-effective, and offers strong stability [
19]. After PC3 was placed in the MSC, the output light was polarized and adjusted to a better polarization state before subsequent amplification. The first-amp stage consisted of an LMA-YDF-15/130-M with a length of 3.8 m for cladding-pumped amplification. The fiber-cladding pump absorption coefficient was 5.4 dB/m @ 976 nm, with a core/cladding NA of 0.08/0.46. The corresponding normalized V parameter was 3.54, supporting LP
01 and LP
11 mode transmission. A single multimode pump source with an output power of 10 W and operating wavelength of 976 nm was used. The pump light was coupled into the gain fiber through a side-pumping combiner. At the fiber end, the outer cladding was stripped to about 8 cm, and a high-refractive-index UV-cured fiber coating adhesive (DSM950-200,
n = 1.55) was applied to serve as a cladding-pump stripper, named Stripper. Finally, the output fiber end was cut at an 8-degree angle to prevent Fresnel reflection from interfering with the amplifier’s normal operation. We observed the output spectrum and pulse trains using an optical spectrum analyzer (OSA, YOKOGAWA, AQ6370C) and an oscilloscope (OSC, Tektronix, TDS3054B). The beam profile was monitored with a CCD camera.
4. Analysis and Discussion
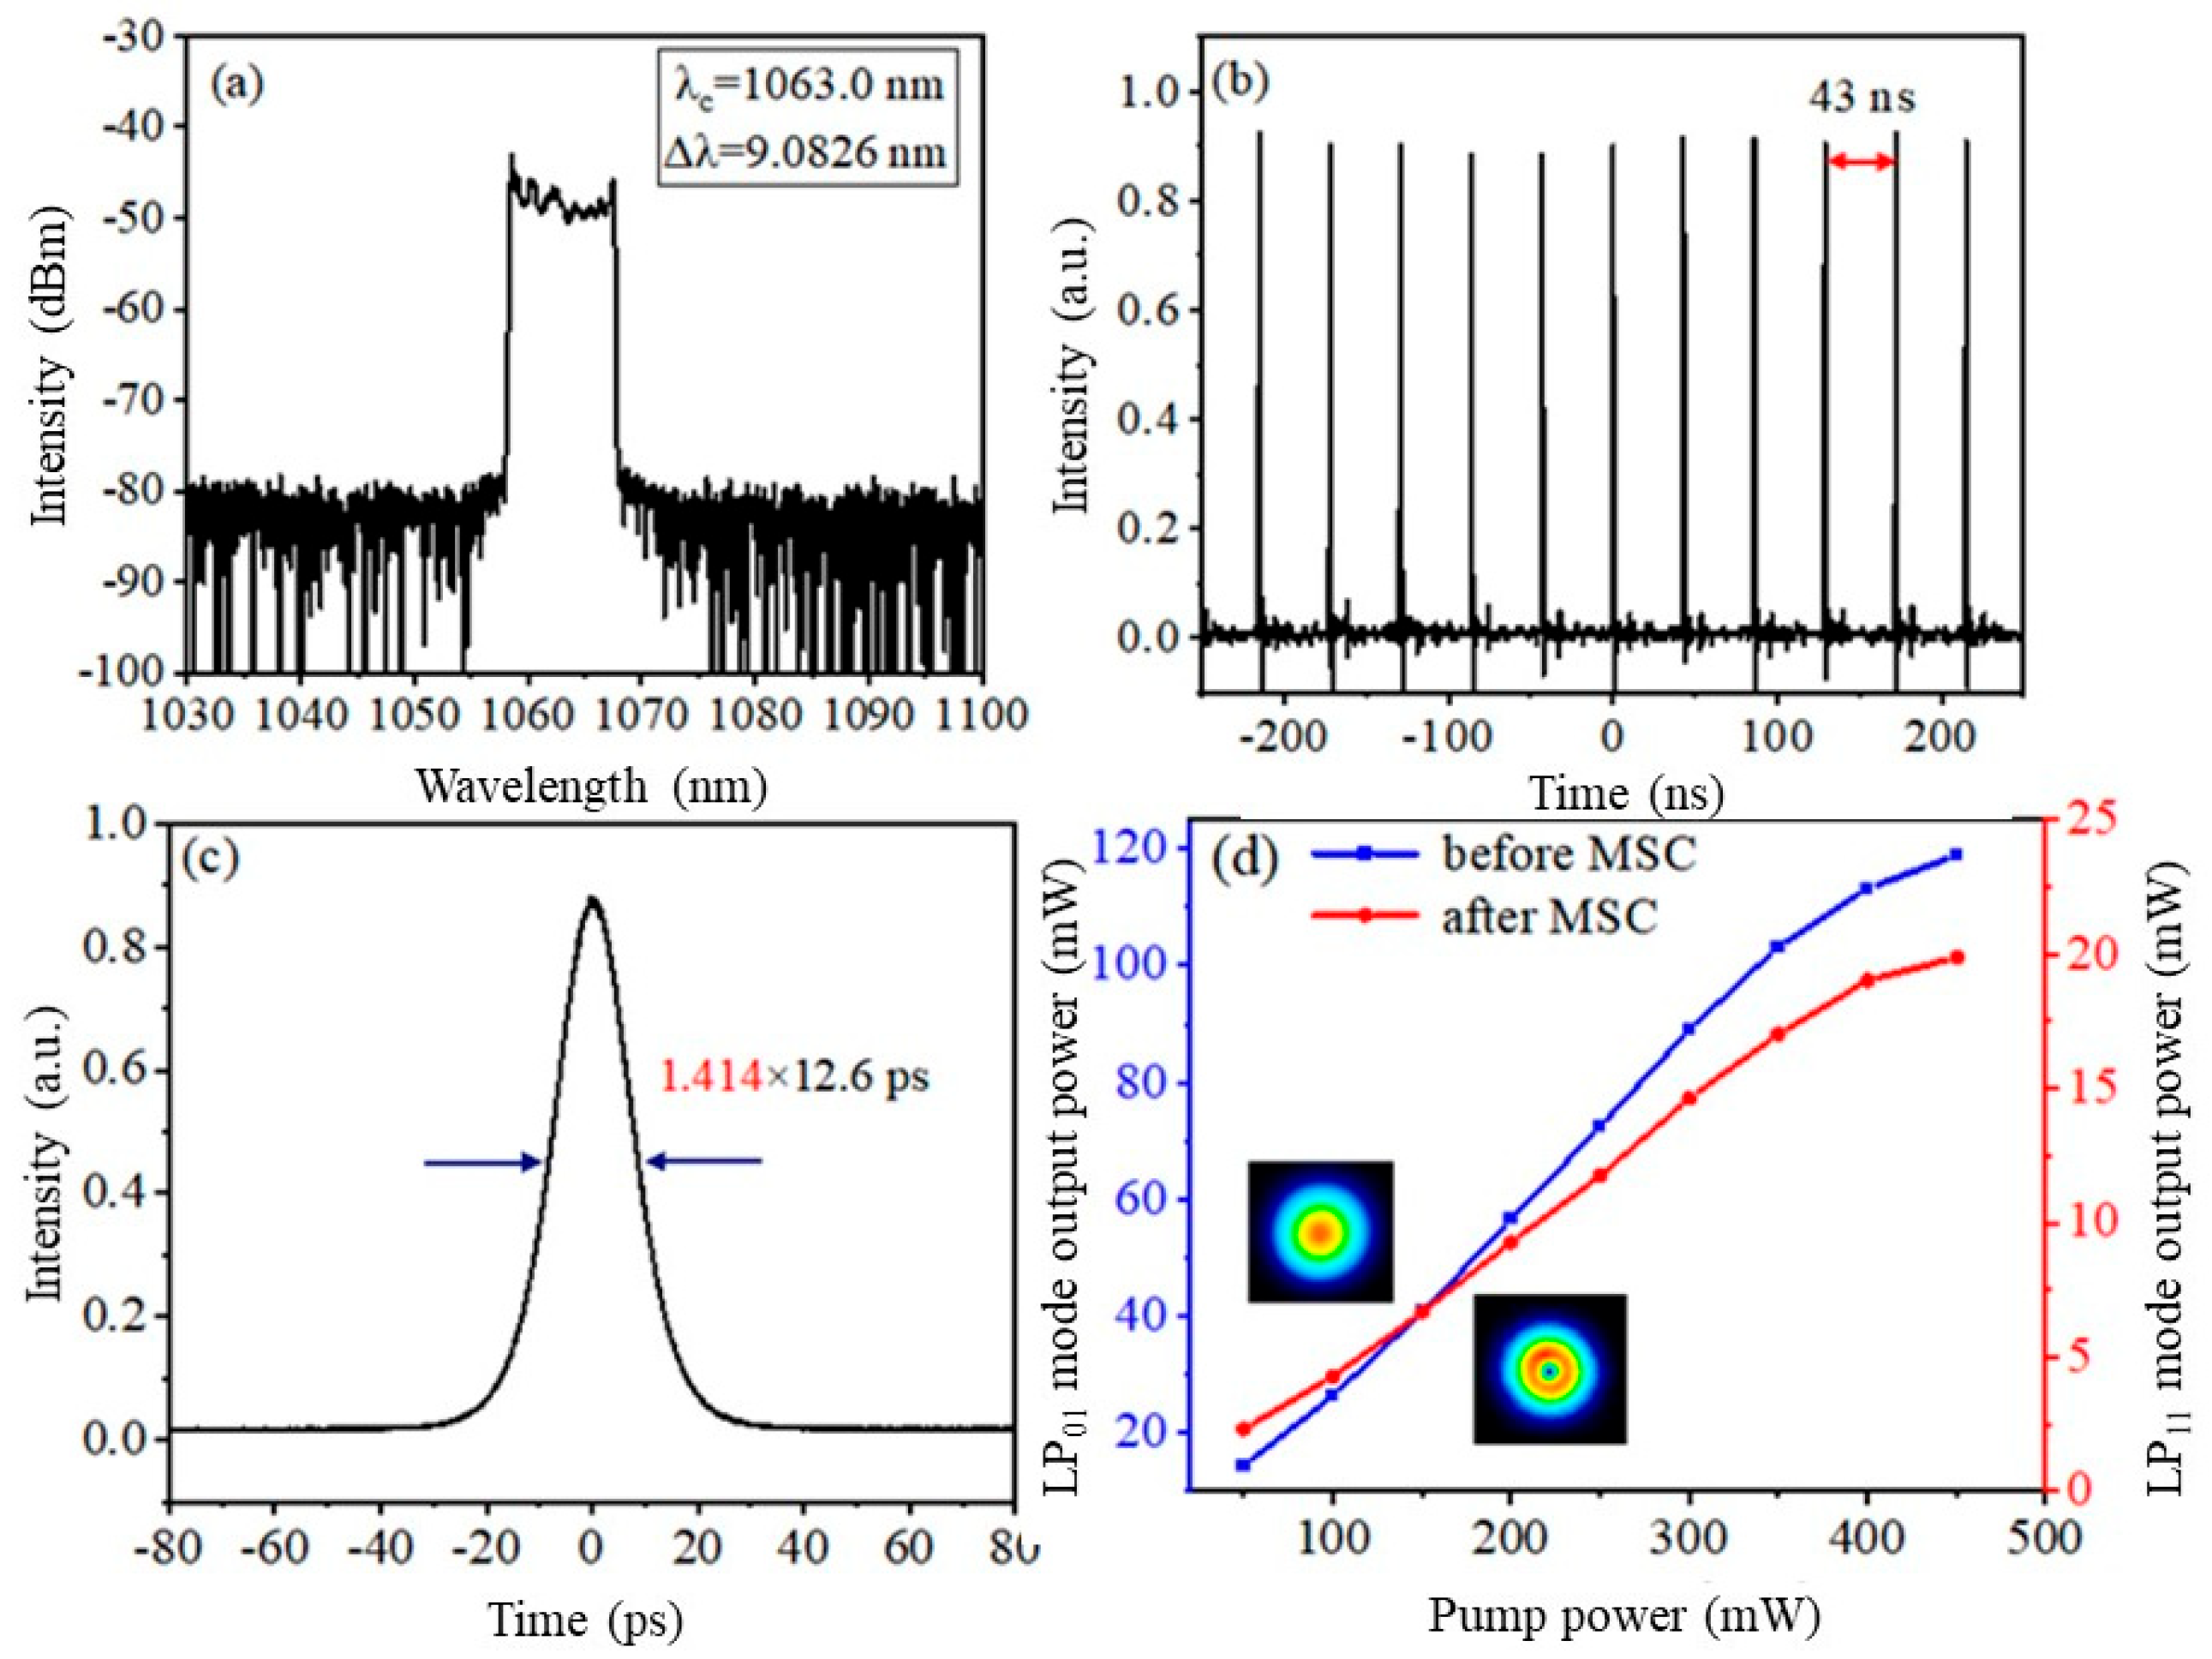
The spectrum of the pre-amp stage is shown in
Figure 7a, and
Figure 7b displays the pulse sequence with a repetition frequency of 23.25 MHz.
Figure 7c presents the autocorrelation curve, with a pulse width of 12.6 ps after Gaussian fitting.
Figure 7d illustrates the variation in output power before and after the MSC with respect to the pump power. As the pump power increases, the output power exhibits a nearly linear increase. The inset shows the mode field distribution of the LP
01 mode (left) and the LP
11 mode (right) when the pre-amp stage pump power is 450 mW. From
Figure 7d, it can be seen that the output power is 118.9 mW at a pump power of 450 mW. After passing through the MSC, the power is 19.87 mW, resulting in a mode conversion efficiency of 16.7%. The relatively low CVB conversion efficiency is attributed to the design and manufacturing process of the MSC itself.
When the pump power of the pre-amp stage is set to 450 mW, the CVB output can be observed via the CCD. To verify the mode of the optical spot, a linear polarizer is inserted between the CCD and the polarization controller as an analyzer.
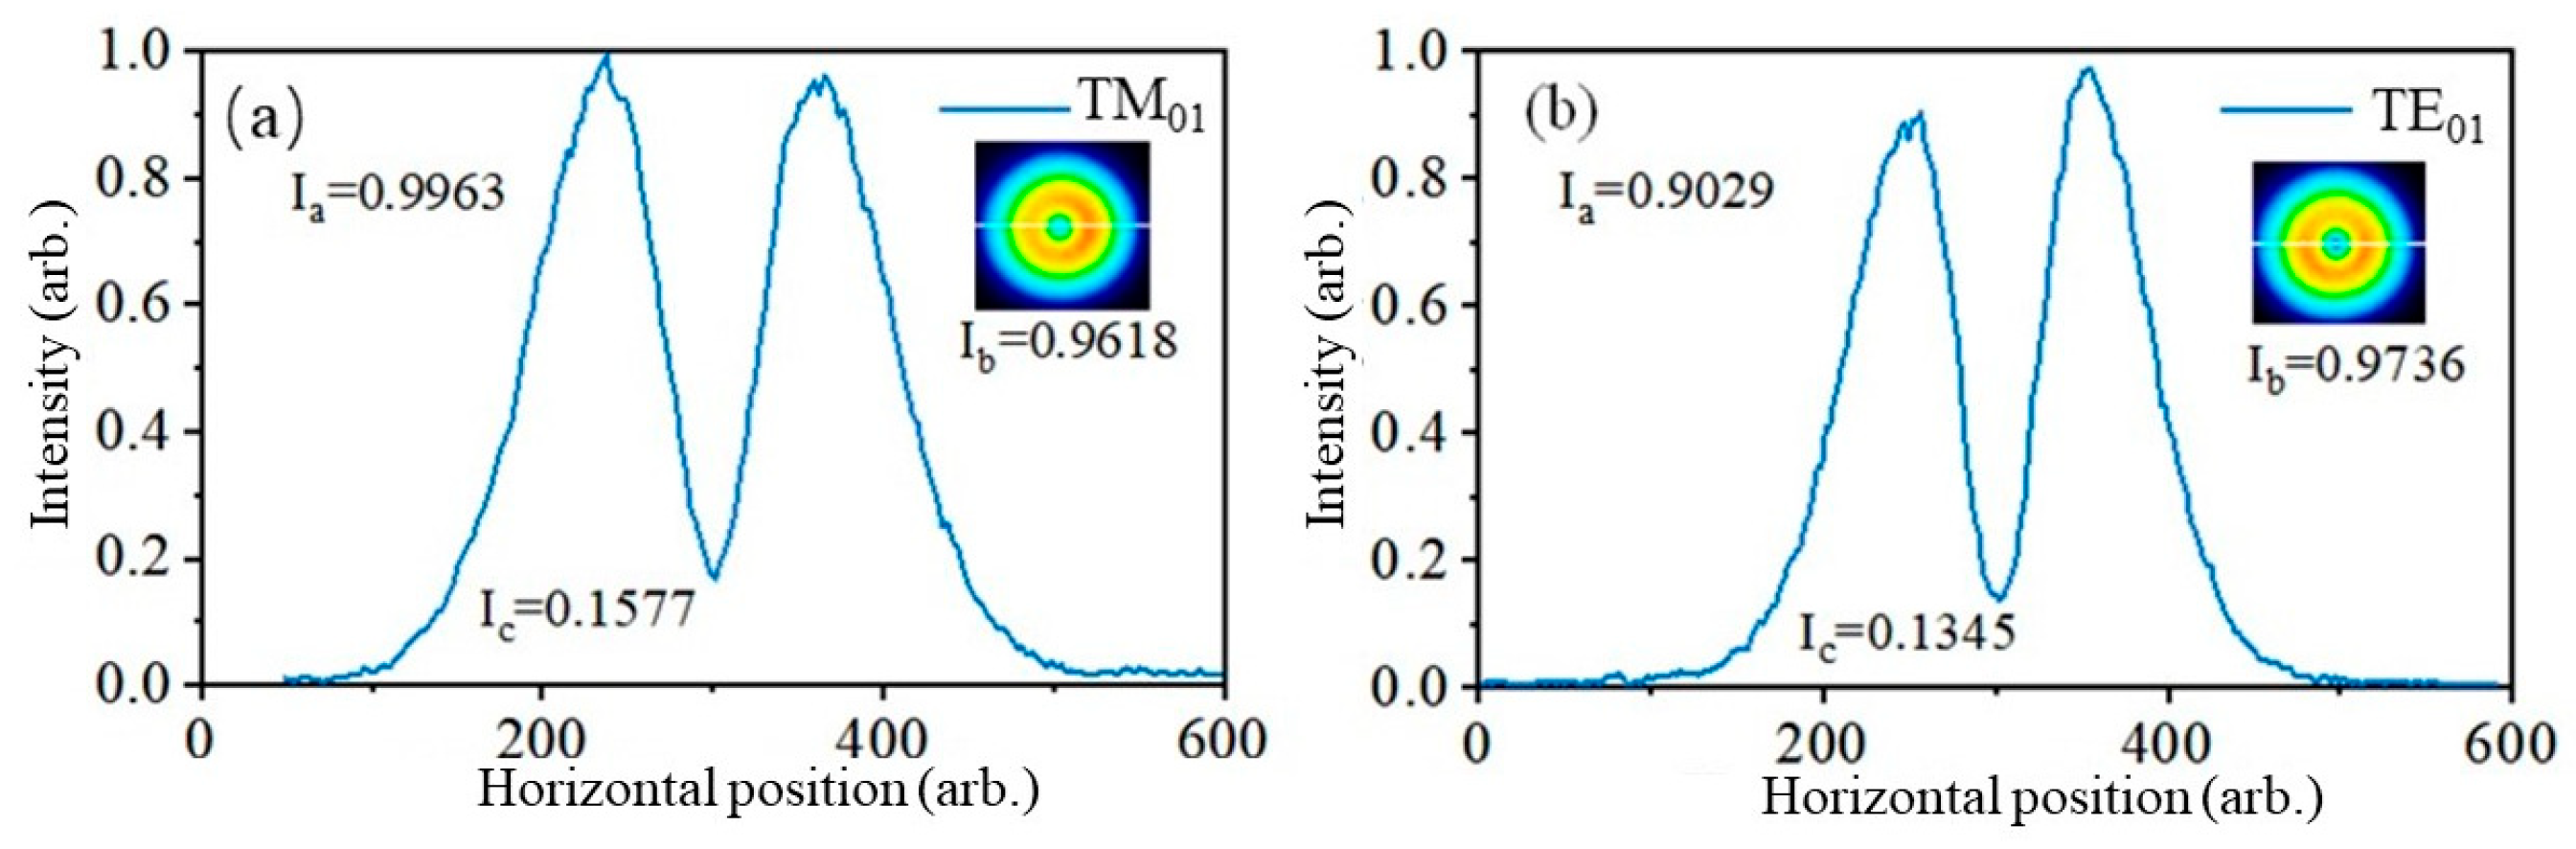
Figure 8a–j shows the mode field intensity distributions of radial- and azimuthal-polarized beams.
Figure 8 displays the output beam intensity distributions for the TM
01 and TE
01 modes. I
a, I
b, and I
c represent the normalized optical intensity at different positions for the TM
01 or TE
01 modes. It is observed that the I
c value is not zero, indicating a small portion of Gaussian light, which does not affect the subsequent amplification. The purity of the TM
01 and TE
01 modes is 97.24% and 98.36%, as shown in
Figure 9.
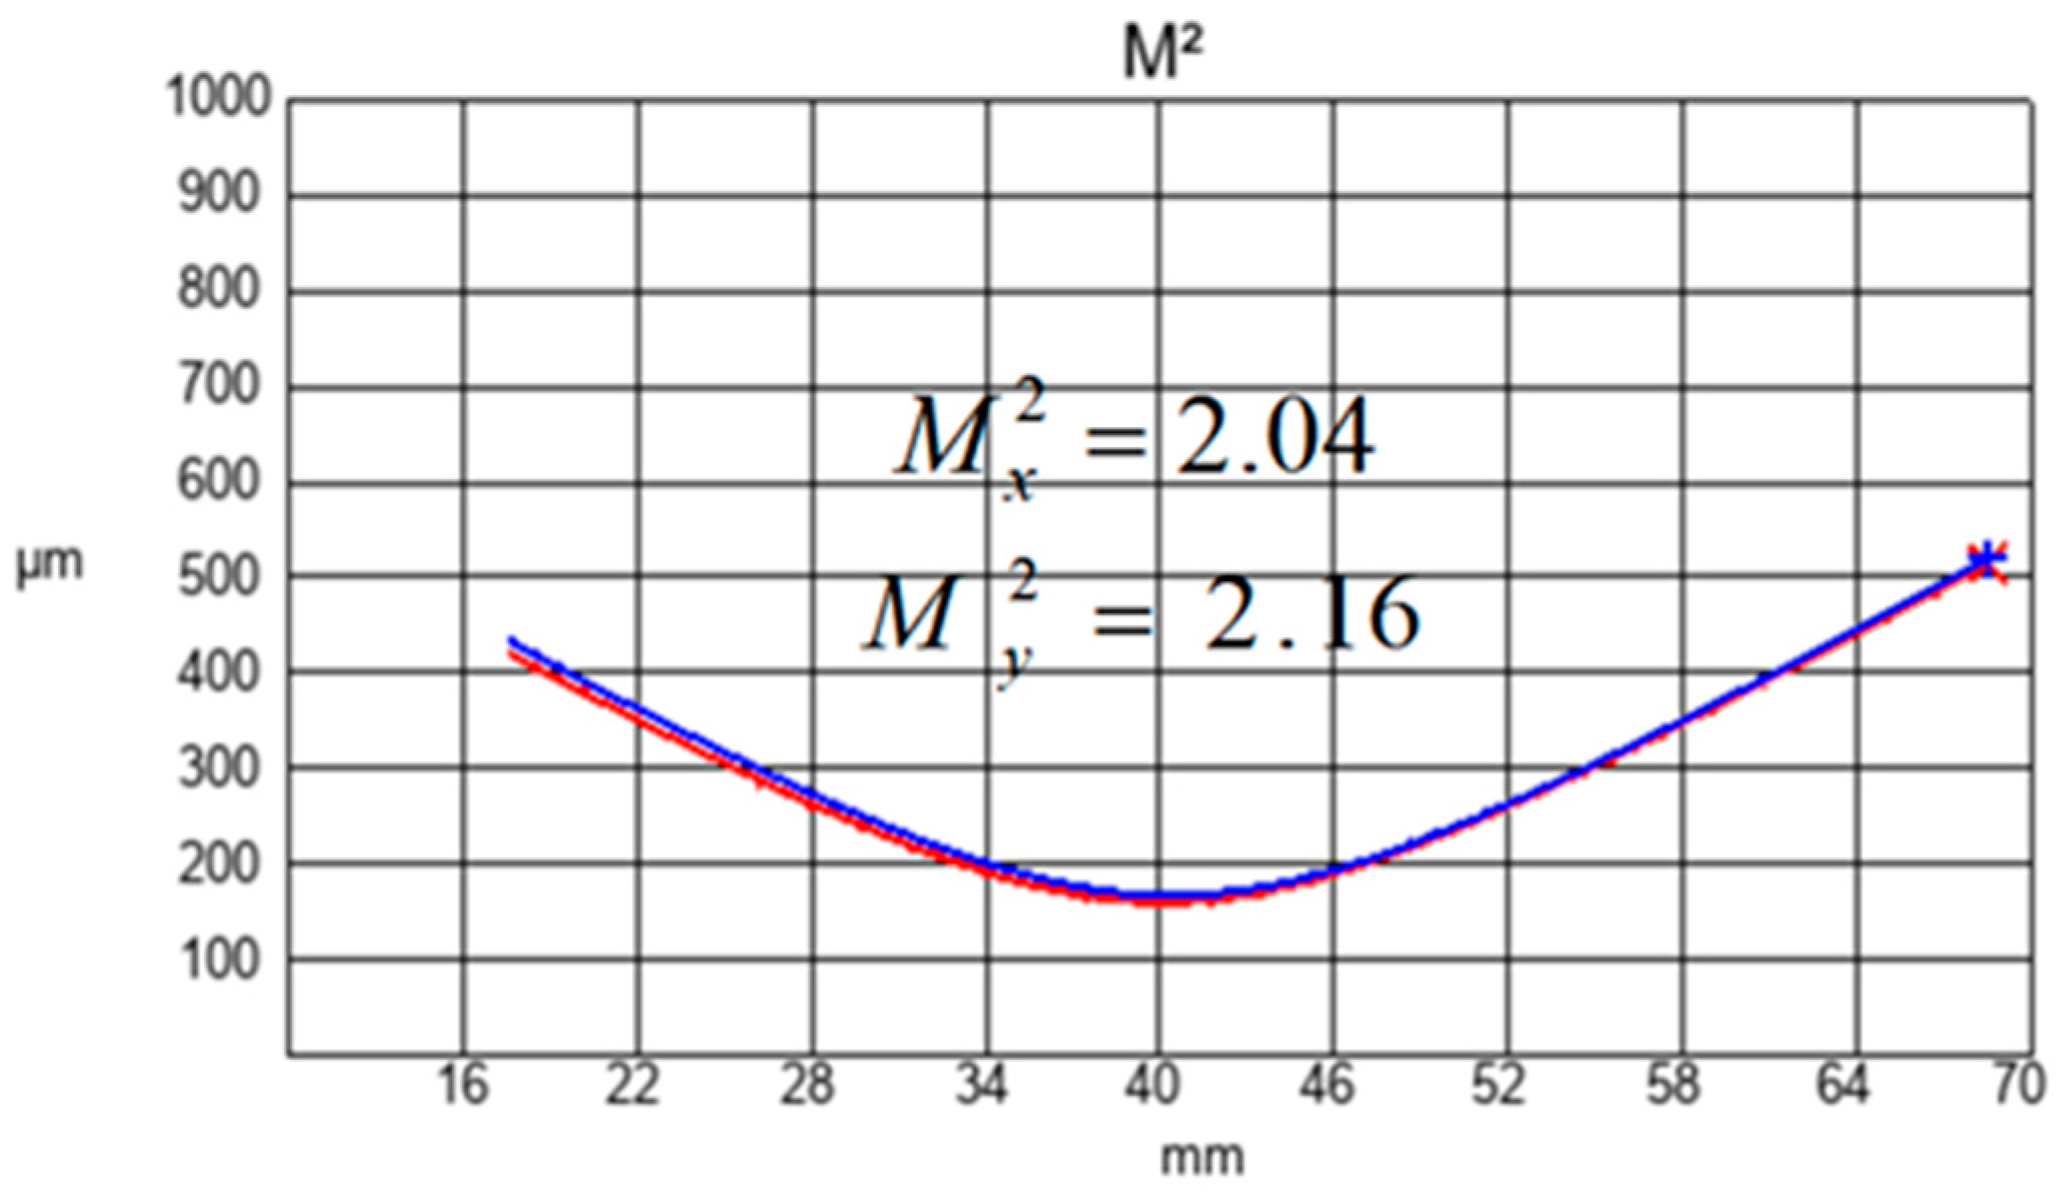
The beam quality was measured using a DataRay model S-WCD-LCM-C M
2 factor measurement device at an output power of 118.9 mW, as shown in
Figure 10. The measured beam quality factor in the horizontal direction is M
2 = 2.04, and in the vertical direction, it is M
2 = 2.16. The measured beam quality factor is M
2 = 2.1, which is consistent with the theoretical value of two [
20] for the radial-polarized TM
01 mode.
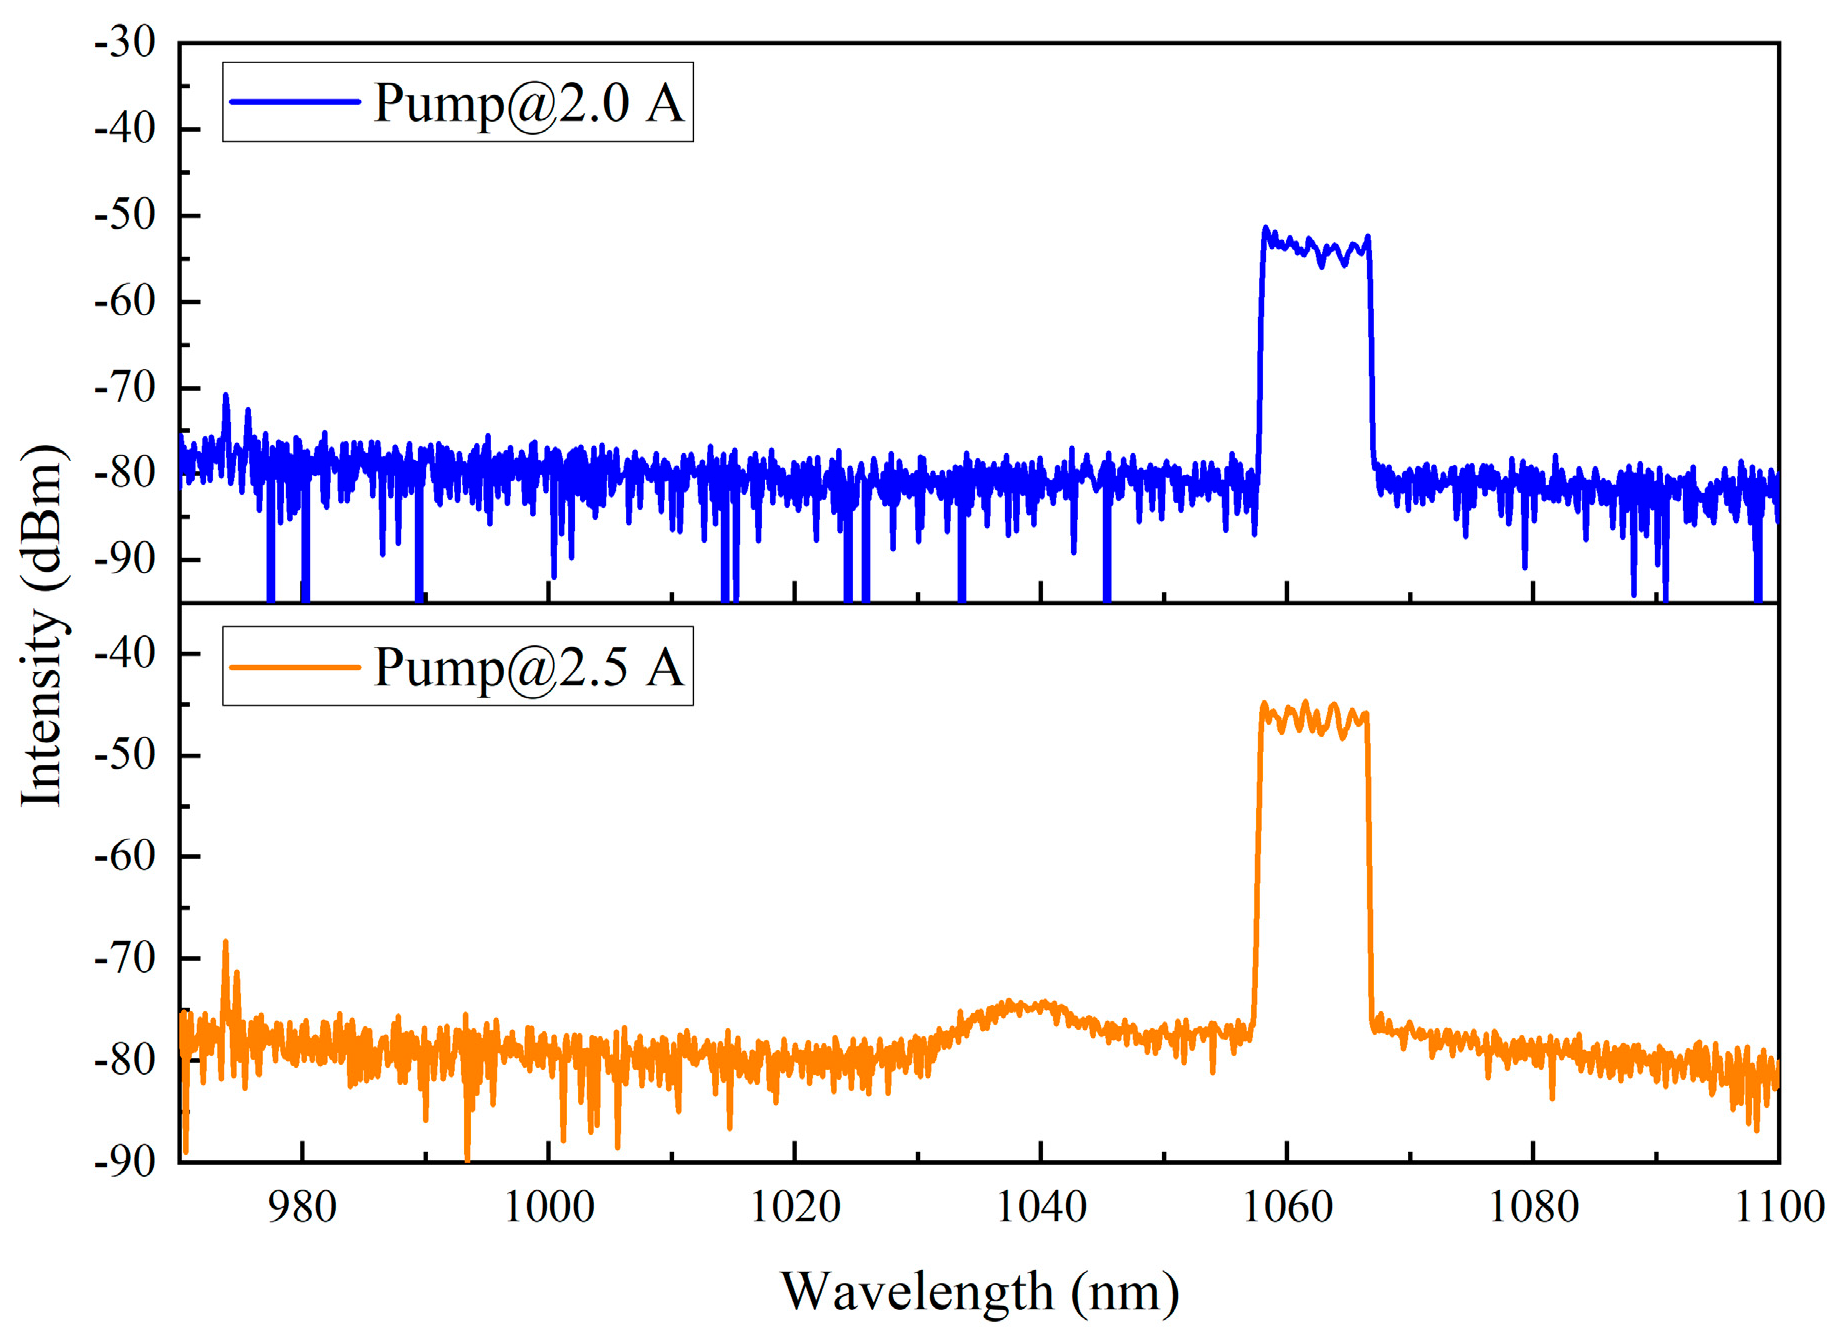
For the first-amp stage, with pump power of 1.15 W (for which the current is 2 A) and 1.6 W (for which the current is 2.5 A), the spectral profiles are shown in
Figure 11. However, as the pump power increases, amplified spontaneous emission (ASE) becomes more pronounced, which can affect the amplifier’s output power and stability, making it unfavorable for subsequent amplification. Therefore, the pump power for the first amplification stage is chosen to be 1.15 W, resulting in an output power of 152.4 mW.
After the first-amp stage, the mode purities for TM
01 and TE
01 are 92.54% and 93.31%, as shown in
Figure 12. The slight discrepancy from the theoretical value of 94.39% in
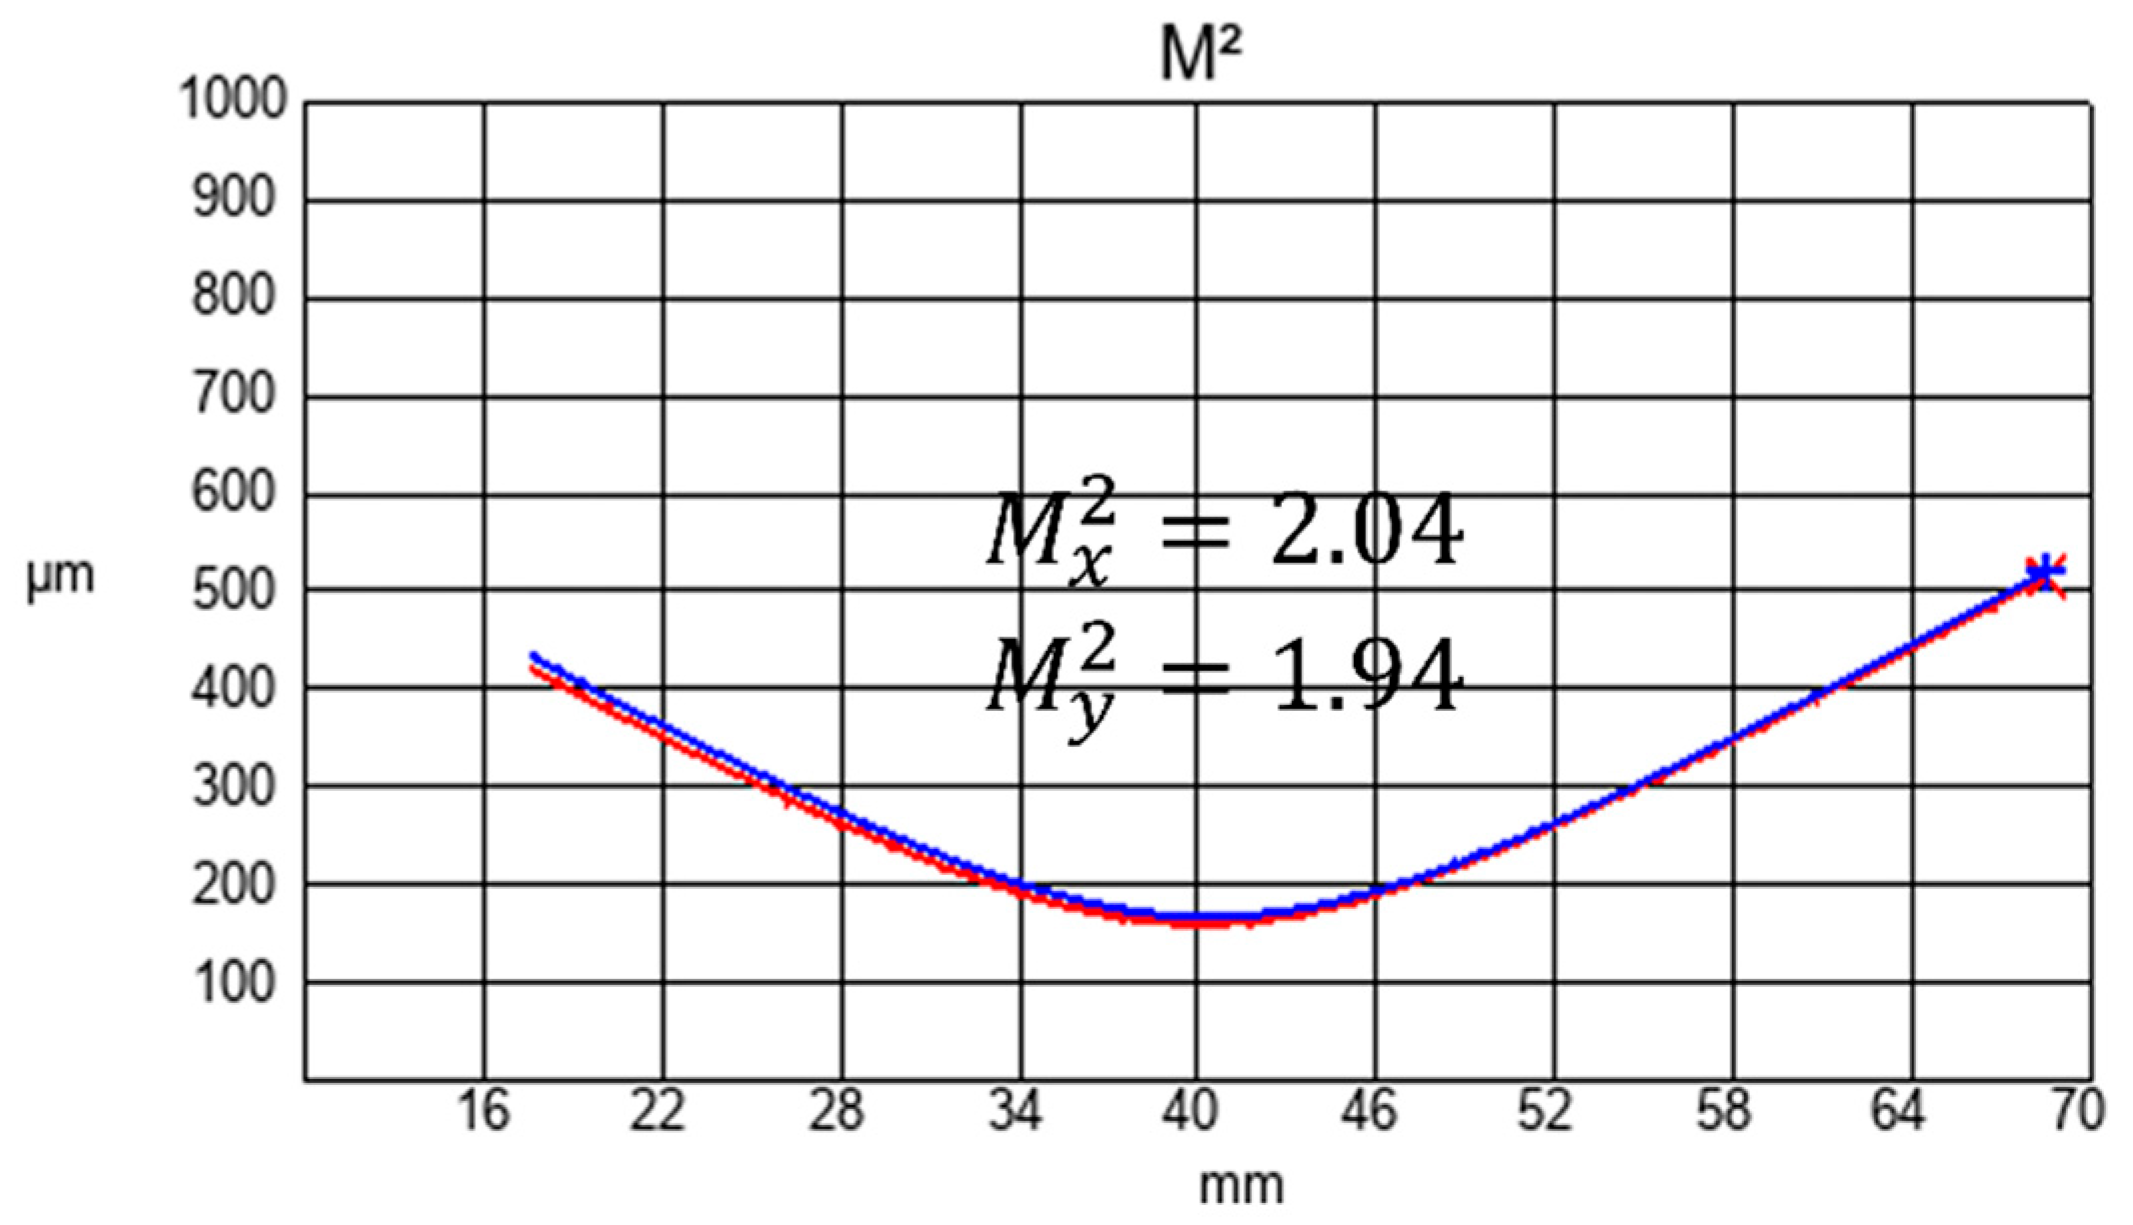
Section 2 is due to mode purity degradation caused by thermally induced birefringence in the fiber. The measured beam quality factor in the horizontal direction is M
2 = 2.04, and, in the vertical direction, it is M
2 = 1.94, as shown in
Figure 13. The measured beam quality factor is M
2 = 1.99. Due to the amplification of the LP
01 mode, the Y-direction beam quality deteriorates slightly, affecting mode purity.
The internal inhomogeneities of isotropic LMA fibers inevitably lead to distortions in spatial intensity and polarization distribution during transmission and amplification, limiting beam quality. These inhomogeneities arise from external and internal disturbances such as bending, lateral compression, elliptical cores, and inherent stresses due to variations in dopant distribution. Consequently, using isotropic fibers reduces the beam quality and mode purity. Further amplification increases the gain and power of the fundamental mode, significantly degrading mode purity.

 ,
, 


