Article

Precise Reflectance/Transmittance Measurements of Highly Reflective Optics with Saturated Cavity Ring-Down Signals

1
School of Optoelectronic Science and Engineering, University of Electronic Science and Technology of China, Chengdu 610054, China
2
Institute of Optics and Electronics, Chinese Academy of Sciences, Chengdu 610209, China
3
National Laboratory on Adaptive Optics, Chengdu 610209, China
*
Author to whom correspondence should be addressed.
Photonics 2024, 11(10), 984; https://doi.org/10.3390/photonics11100984
Submission received: 13 September 2024 / Revised: 15 October 2024 / Accepted: 17 October 2024 / Published: 19 October 2024
(This article belongs to the Special Issue Optoelectronic Detection Technologies and Applications)

Abstract

:
In this paper, a data processing approach was developed to accurately extract the ring-down time and amplitude of the saturated cavity ring-down (CRD) signal; both were utilized to determine simultaneously the high reflectance and residual transmittance of highly reflective (HR) mirrors with a dual-channel CRD configuration. The influence of saturation was eliminated by deleting the beginning saturated data points of the saturated CRD signal and fitting the remaining non-saturated CRD signal to a single-exponential function. By comparing the reflectance/transmittance measurement results of HR samples obtained via data processing of saturated CRD signals and via single-exponentially fitting non-saturated CRD signals with utilization of neutral density filter(s) to eliminate saturation, it was found that the reflectances obtained with both methods were in excellent agreement, while the residual transmittance obtained with the saturated CRD signal was more accurate than that obtained with the neutral-density-filter-attenuated non-saturated CRD signal. The proposed data processing method eliminated the need to use the neutral density filters, therefore avoiding the adding of the optical density error to the uncertainty of residual transmittance measurement and improving the measurement accuracy. The proposed data processing method also extended the dynamic range of the dual-channel CRD scheme for simultaneous measurement of reflectance, transmittance and optical loss.

1. Introduction

In recent years, highly reflective (HR) laser optics with reflectance higher than 99.9% have been widely used in various laser systems and laser-based applications such as high-power laser systems [1,2], laser gyroscopes [3,4], gravitational wave detectors [5,6] and optical clocks [7]. Cavity ring-down (CRD) [8,9,10,11,12,13,14,15,16] is the appropriate technique to measure the reflectance of planar or curved mirrors higher than 99.9% with up to sub-ppm (part per million) accuracy [17,18,19]. The CRD technique is currently the international standard (ISO 13142 [20]) for measuring the high reflectance of HR optics and the high transmittance of anti-reflective (AR) laser components. Recently, CRD has been extended to the simultaneous measurement of the high reflectance and residual transmittance of HR optics [21]. In CRD reflectance measurements, the ring-down time of the CRD signal, which is determined by fitting the measured CRD signal to a single exponential function, is used to determine the reflectance [19]. Therefore, the reflectance measurement accuracy is largely determined by the measurement accuracy of the ring-down time. The accurate determination of the ring-down time requires (1) the measured CRD signal to not be distorted and to follow a single-exponential function; (2) a high signal-to-noise ratio (SNR) of the CRD signal to minimize the influence of the various noises. To achieve a high SNR, in typical CRD experiments high-sensitivity and fast-response photo-detectors such as amplified photo-detectors, avalanche photo-detectors (APD) and photomultiplier tubes (PMT) are usually employed to detect the CRD signal [22,23]. In this case, photo-detection saturation easily occurs when the CRD amplitude is high [24,25,26,27]. To avoid detection saturation, neutral-density (ND) filters are normally employed to attenuate the detected light power to below the saturation level of the photo-detector. A CRD signal with single-exponential decay behavior is therefore obtained to accurately determine the ring-down time.
On the other hand, for the simultaneous high reflectance and residual transmittance measurement of HR optics with a dual-channel CRD, the ring-down time is used to determine the high reflectance, and the amplitude ratio of two CRD signals detected via the transmissions of the cavity mirror and of the test HR optics is employed to determine the residual transmittance [21]. The use of optical attenuator (ND filters) in front of the photo-detector to eliminate detection saturation would induce errors in the CRD amplitude measurement and therefore cause additional uncertainty to the residual transmittance measurement of the HR optics. This is especially true when the optical density (OD) of the ND filter is high, as a high OD is more difficult to measure accurately with conventional spectrophotometry. In addition, possible interference effects [28,29] of the ND filter plates would also cause errors to both ring-down time and amplitude determination of the detected CRD signal, which could result in accuracy deterioration for both high reflectance and residual transmittance measurements of HR optics with CRD.
In this paper, instead of employing ND filters to eliminate saturation in CRD signal detection, the ring-down time and amplitude used to determine the high reflectance and residual transmittance of HR optics are extracted from the saturated CRD signal detected without employment of optical attenuators. By deleting those beginning data points influenced by detection saturation and fitting the remaining non-saturated data points of the saturated CRD signal to a single-exponential function, the ring-down time and amplitude of the CRD signal are determined and used to determine the high reflectance and residual transmittance of the HR optics, respectively. For high reflectance measurement via the ring-down time of CRD signal, the results are in excellent agreement with that obtained with employment of ND filters to eliminate the detection saturation. For residual transmittance measurement via the amplitude ratio, more accurate values are achieved as compared to that obtained with the use of ND filters. In addition, the dynamic range of the reflectance/transmittance measurement is extended by utilizing the saturated CRD signal.

2. Experimental Setup and Method

A dual-channel CRD experimental setup based on an optical feedback CRD scheme [21] for simultaneously measuring the high reflectance and residual transmittance of an HR mirror is schematically shown in Figure 1. In brief, a continuous-wave Fabry–Pérot (F-P) diode laser (IQ2H10(1064-50)G36/B920, Power Technology, Little Rock, AR, USA) centered at 1065.3 nm with TEM00 mode output is used as the light source. The output power of the diode laser is square-wave-modulated at 200 Hz with a duty circle of 50% by a PC-controlled function generation (FG) card (M2p.6541-x4, Spectrum Instrumentation, Großhansdorf, Germany). A thin film polarizer and a half-wave plate are inserted in the beam path for polarization selection (s- or p-polarization). The initial ring-down cavity (RDC), as shown in Figure 1a, is formed by two plano-concave mirrors R1 and R2 (Layertec, Mellingen, Germany) (called cavity mirrors) with radius of curvature of −1 m and a plane coupling mirror R3 (Layertec, Germany). The cavity length is approximately 80.1 cm with an uncertainty of smaller than ±1 mm, assured via the mechanical design of the baseplate for installing the cavity mirrors. The CRD signal which leaks out of the RDC through transmission of cavity mirror R1 is detected by photo-detector PD1 (PDA015C2, Thorlabs, Newton, NJ, USA) and acquired by a data acquisition (DA) card (sampling rate: 80 MHz; M2p.5941-x4, Spectrum Instrumentation, Germany) for data processing. The CRD signal is recorded at the negative edge of the modulation. An ND filter may be placed in front of photo-detector PD1 for light power attenuation to avoid detection saturation if necessary. A maximum of 12,000 data points are recorded for each CRD signal.
To measure simultaneously the high reflectance and residual transmittance of an HR mirror, the decay time τ0 of the initial RDC is first measured by PD1. Then, the test HR sample is inserted into the initial RDC with the required angle of incidence (AOI) to form a test RDC, as shown in Figure 1b. The test cavity length is kept the same as the initial cavity length (80.1 cm). The CRD signal which leaks out of the RDC through the transmission of the test HR sample is simultaneously detected by a second photo-detector PD2 (PDA015C2, Thorlabs) and acquired by the DA card. An ND filter may be placed in front of PD2 to avoid detection saturation if necessary. For the simultaneous measurement of the high reflectance and residual transmittance of the test HR sample, the CRD signals detected by PD1 and PD2 are simultaneously recorded and fitted to a single-exponential function to determine the ring-down time and amplitudes of the detected CRD signals if no detection saturation is present.
On the other hand, when saturation is present, the beginning data points influenced by detection saturation (down to 0.8 times of the saturation level) are deleted and the remaining non-saturated data points of the CRD signal are fitted to a single-exponential function (expressed as I t = I 0 e t τ + B , where I 0 represents the amplitude of CRD signal, τ denotes the ring-down time and B denotes a DC offset) to extract the ring-down time and amplitude. The ring-down time τ1 obtained from the CRD signal detected by PD1, together with the decay time τ0 of the initial RDC, is used to determine the high reflectance, while the amplitude ratio of the two CRD signals, after proper calibration, is used to determine the residual transmittance of the test HR sample. That is, the reflectance R of the test HR sample is
R = exp L c τ 0 L c τ 1
where L is the length of the initial and test RDCs and c is the speed of light. The transmittance T of the test HR sample is [21]
T = M · T 1 · P P D 2 P P D 1
Here, PPD1 and PPD2 are the amplitudes of CRD signals detected by photo-detectors PD1 and PD2, respectively. T1 represents the transmittance of cavity mirror R1, which can be determined independently and accurately via an angle-resolved CRD scheme [30] with an AR laser optic. M is a calibration factor, which is determined by the responsivities of PD1 and PD2, and the OD of the ND filters used in front of the photo-detectors. For accurate determination of the calibration factor M, the OD(s) of the ND filter(s) must be precisely known or measured.
Experimentally, the calibration factor M can be easily determined by measuring the amplitude ratio for the same laser power with the two photo-detectors, respectively, as well as by taking into consideration the ODs of the ND filters. That is, when ND filters are used to eliminate detection saturation,
M = P P D 1 × 10 O D 1 P P D 2 × 10 O D 2
For the calibration factor determination, the major error source is attributed to the uncertainty of the OD values of the ND filters [22], which are used to eliminate detection saturation. No use of ND filters could certainly improve the measurement accuracy of the CRD amplitude and therefore of the residual transmittance of the test HR sample. In this case, the influence of detection saturation on the ring-down time and amplitude determination can be eliminated via data processing of saturated CRD signals.
Experiments are performed to demonstrate the precise reflectance and transmittance measurements with saturated CRD signals by comparing the results obtained with un-saturated and saturated CRD signals. Three test HR samples with different reflectance/transmittance values, therefore showing different levels of saturation, are tested. Three ND filters with different OD values are used in the experiment to eliminate detection saturation in the CRD signals. The nominal OD values for the three ND filters NENIR05A-C, NENIR07A-C and NENIR10A-C (Thorlabs) are 0.5, 0.7 and 1.0, respectively, and the corresponding nominal transmittance values are 30.9%, 18.1% and 9.6% at the test wavelength 1065 nm, respectively. The measured transmittance values via a commercial spectrophotometer (Lambda 1050, Pekin Elmer) are 32.5%, 18.2% and 9.2%, respectively. The differences between the nominal and measured transmittance values are 4.9%, 0.5% and 4.3%, respectively.

3. Experimental Results and Discussion

3.1. Reflectance Determination of Cavity Mirrors with Un-Saturated and Saturated CRD Signals

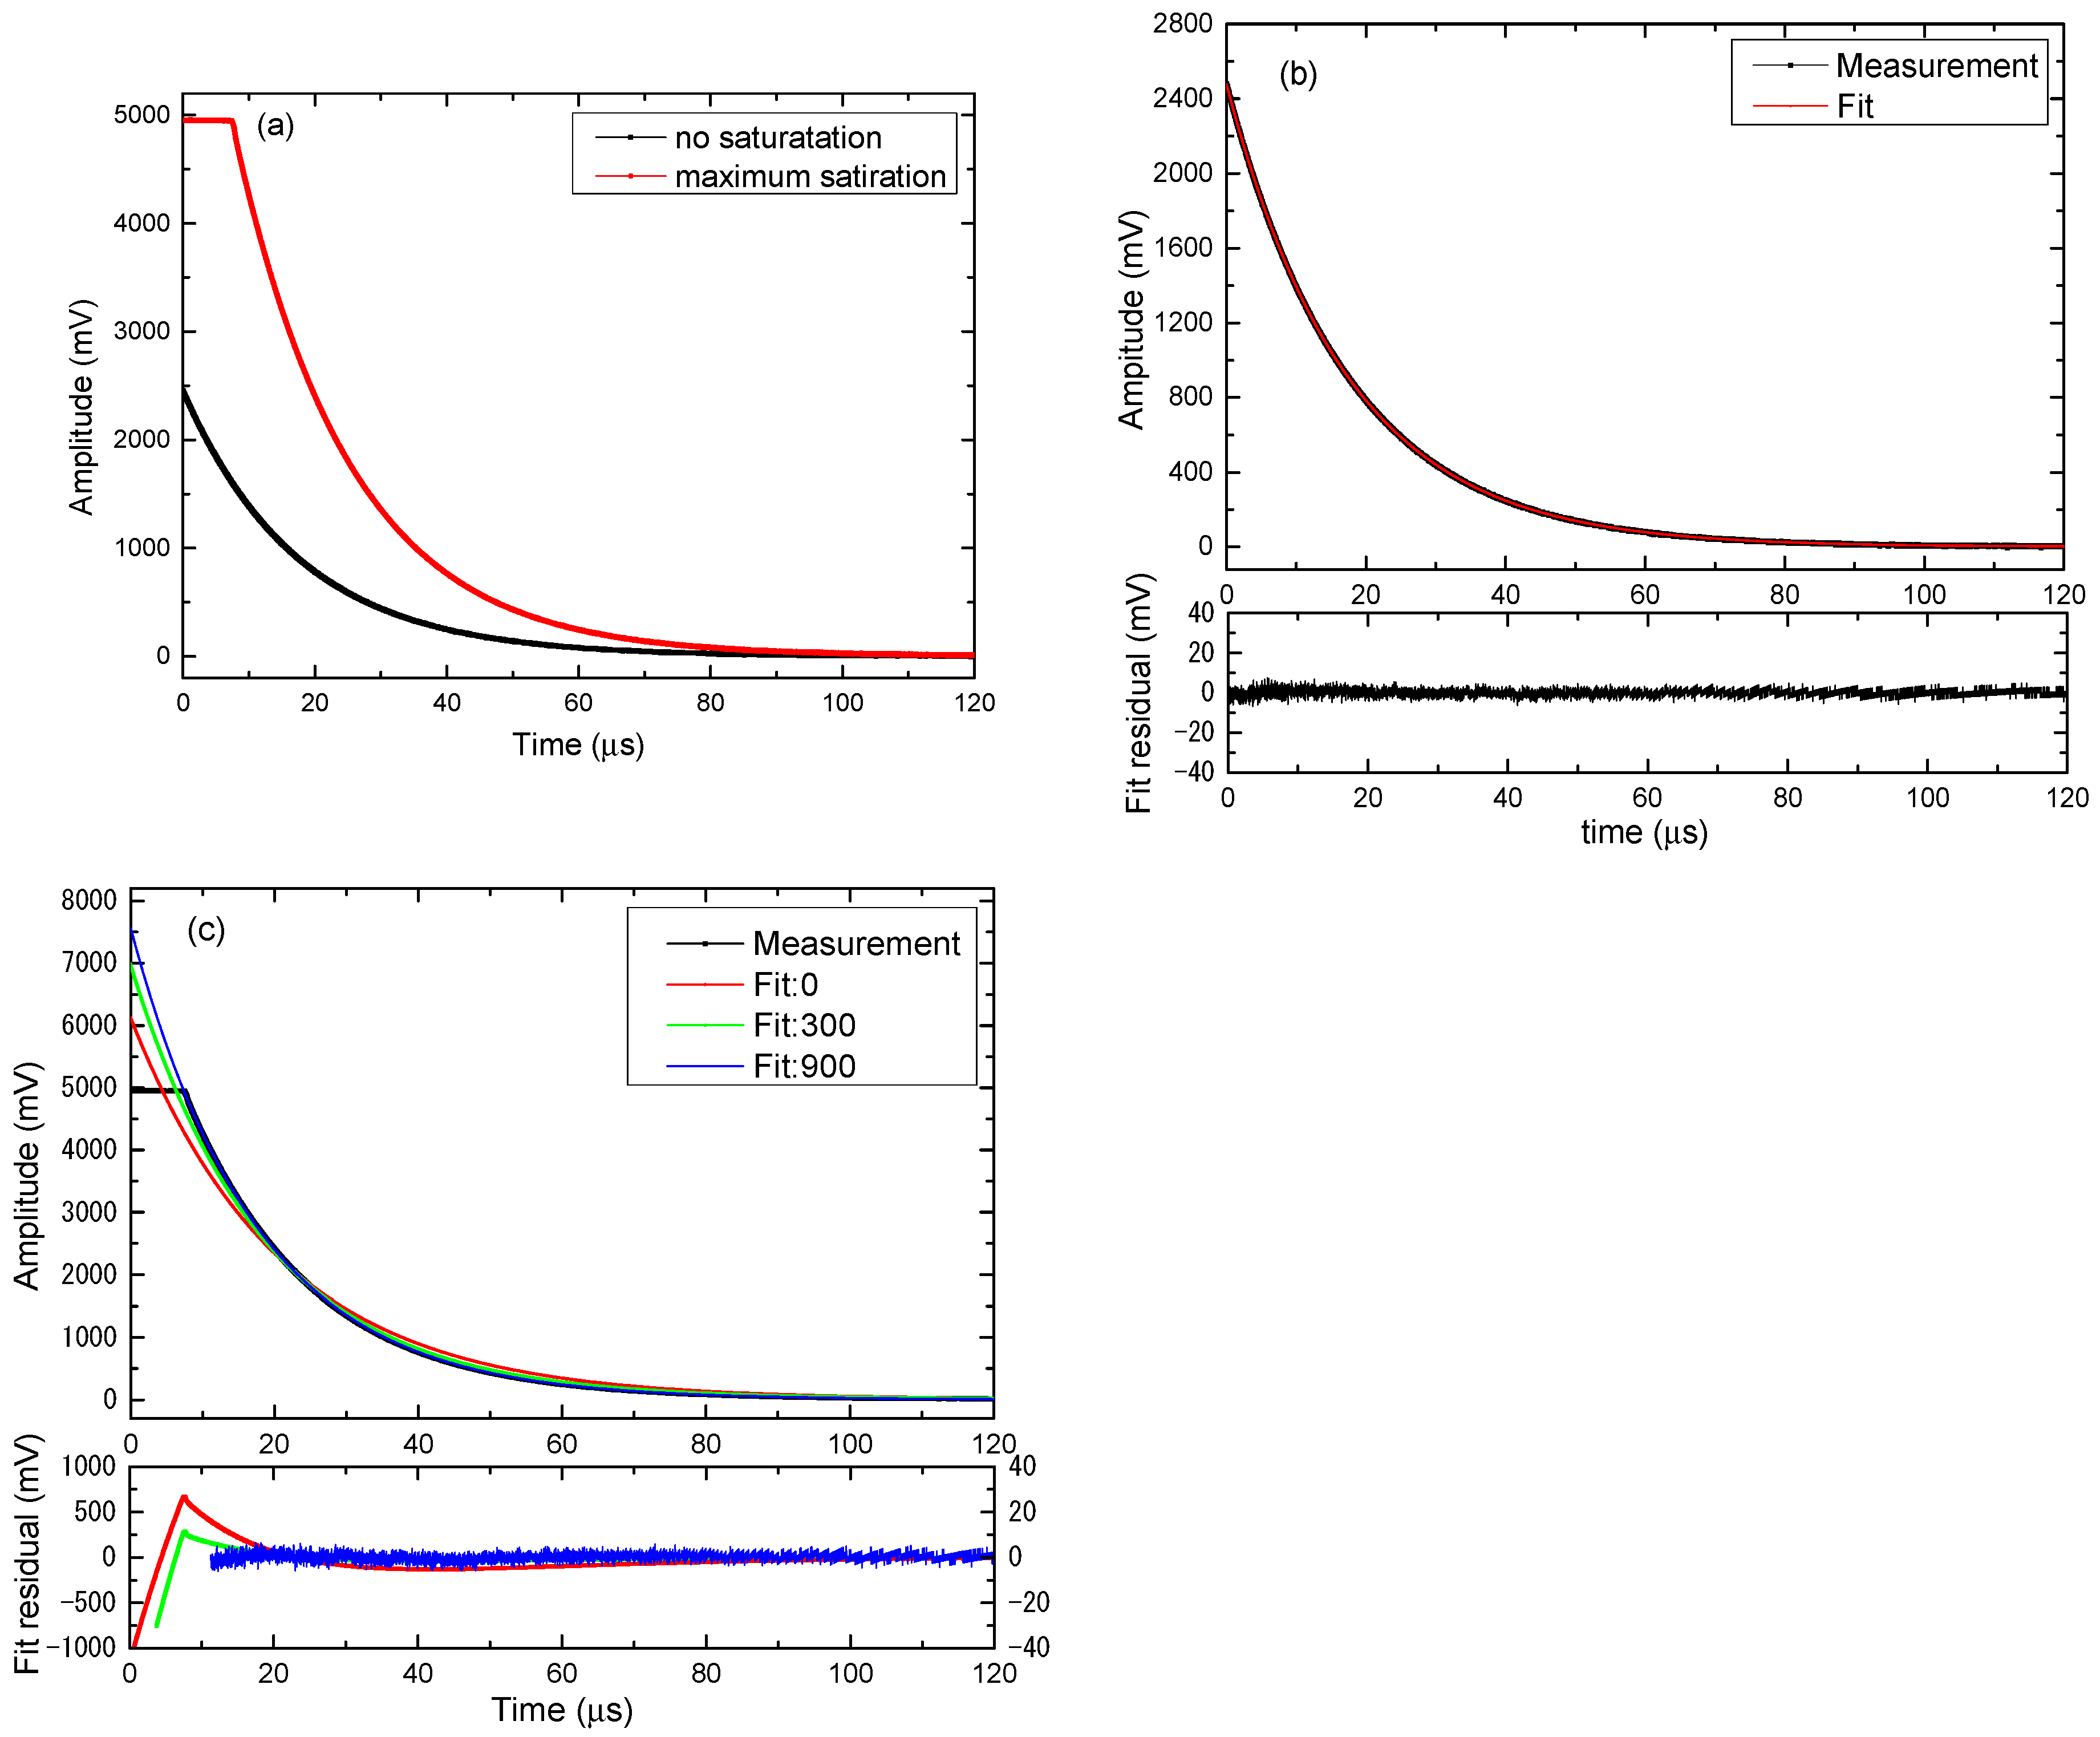
At first, the influence of detection saturation on the determination of the ring-down time of the initial RDC and of the average reflectance of the cavity mirror is analyzed. The CRD configuration shown in Figure 1a is employed. The OD = 0.5 ND filter is used to eliminate the saturation in the CRD signal detected via PD1. Figure 2a shows the saturated and attenuated (non-saturated) CRD signals. Without the ND filter to attenuate the light power, the CRD signal is totally saturated to a level of 4.95 V at the beginning 8 μs time period and gradually becomes non-saturated after that. When the ND filter is employed, no signal saturation is present. The non-saturated CRD signal follows a single-exponential function perfectly, as shown in Figure 2b, with a fit residual below ±6 mV peak-to-peak and ~1.6 mV standard deviation. On the other hand, after the saturated data points are totally deleted, the remaining data points of the saturated CRD signal also follow the single-exponential function, as shown in Figure 2c, with a fit residual below ±6 mV peak-to-peak and ~1.7 mV standard deviation. The low fit residuals of the non-saturated CRD signal and the non-saturated portion of the saturated CRD signal also indicate the good linearity of the photo-detector.
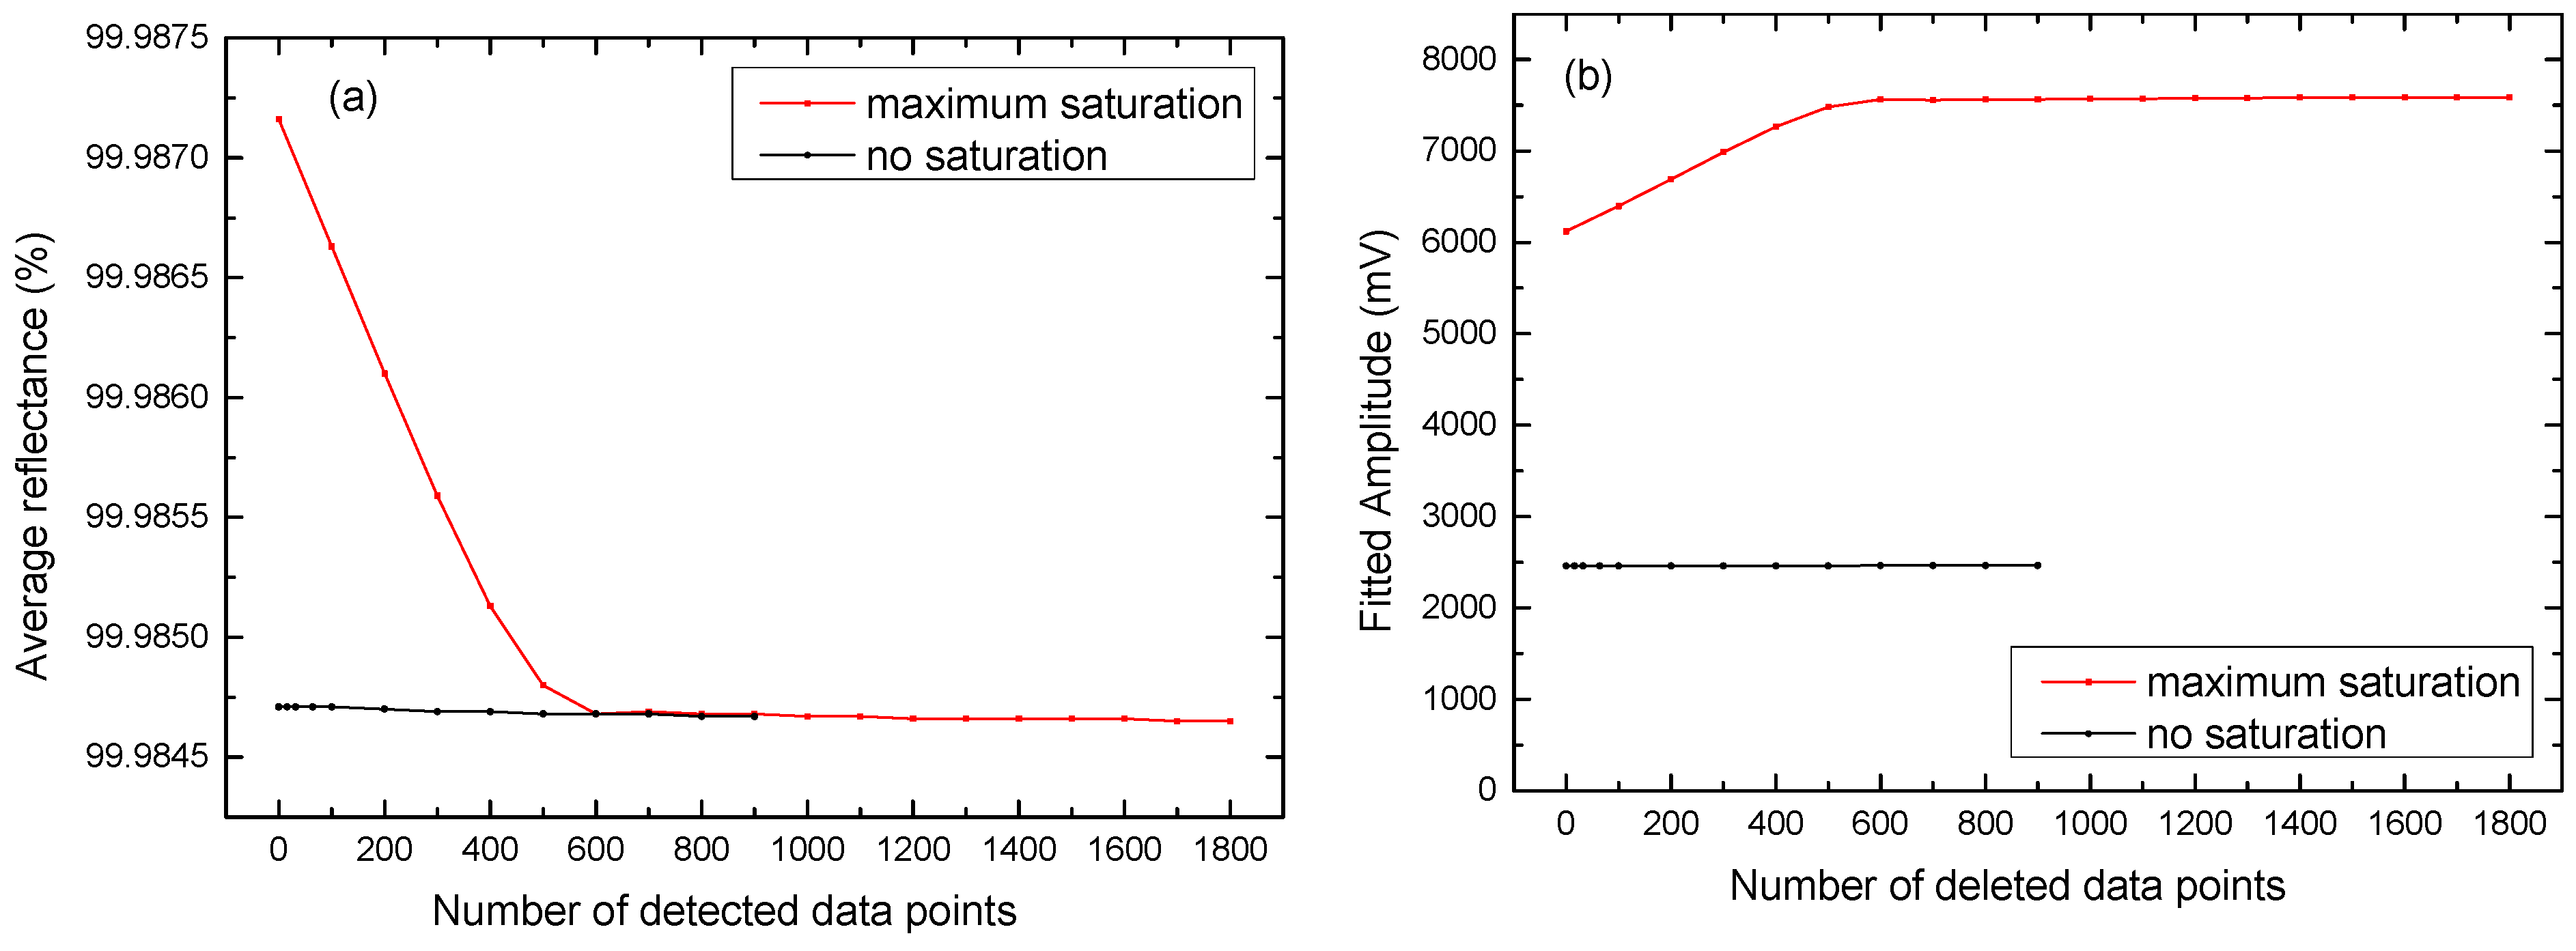
From the single-exponential fits, the ring-down time and amplitude of the CRD signal are determined. The ring-down time is further used to calculate the average reflectance of the cavity mirrors with R = ( R 1 R 2 ) 1 / 2 R 3 = e x p ( L / c τ 0 ) , with R1, R2, and R3 the reflectances of the cavity mirrors R1 and R2 and the coupling mirror R3, respectively. The results are presented in Figure 3. Clearly, for the non-saturated CRD signal, deleting the beginning CRD data points has no influence on the determination of the ring-down time and amplitude. On the other hand, for the saturated CRD signal, the fitted ring-down time and amplitude become independent of the saturation once all saturated data points at the beginning of the CRD signal are deleted in the single-exponential fitting. The average reflectance values of the cavity mirrors determined from the fitted ring-down time via non-saturated and saturated CRD signals are nearly identical, as shown in Figure 3a, and the fitted amplitude from the saturated CRD signal is approximately 7.56 V, which is approximately 3 times of that of the non-saturated CRD signal, which is consistent with the OD of the ND filter.
Repeat experiments are performed to see the agreement between the average reflectances determined with the saturated and non-saturated CRD signals. In both cases, the measurements are repeated 10 times. The statistical average reflectance value obtained from the saturated CRD signal is 99.98468 ± 0.00002%, which is in excellent agreement with that obtained from the non-saturated CRD signal, 99.98469 ± 0.00002%. In addition, a variable attenuator is employed to continuously change the attenuation factor and therefore the saturation level, and the results prove the independence of the measured average reflectance on the degree of detection saturation after proper data processing.

3.2. Simultaneous Determination of Reflectance and Transmittance with Un-Saturated and Saturated CRD Signals

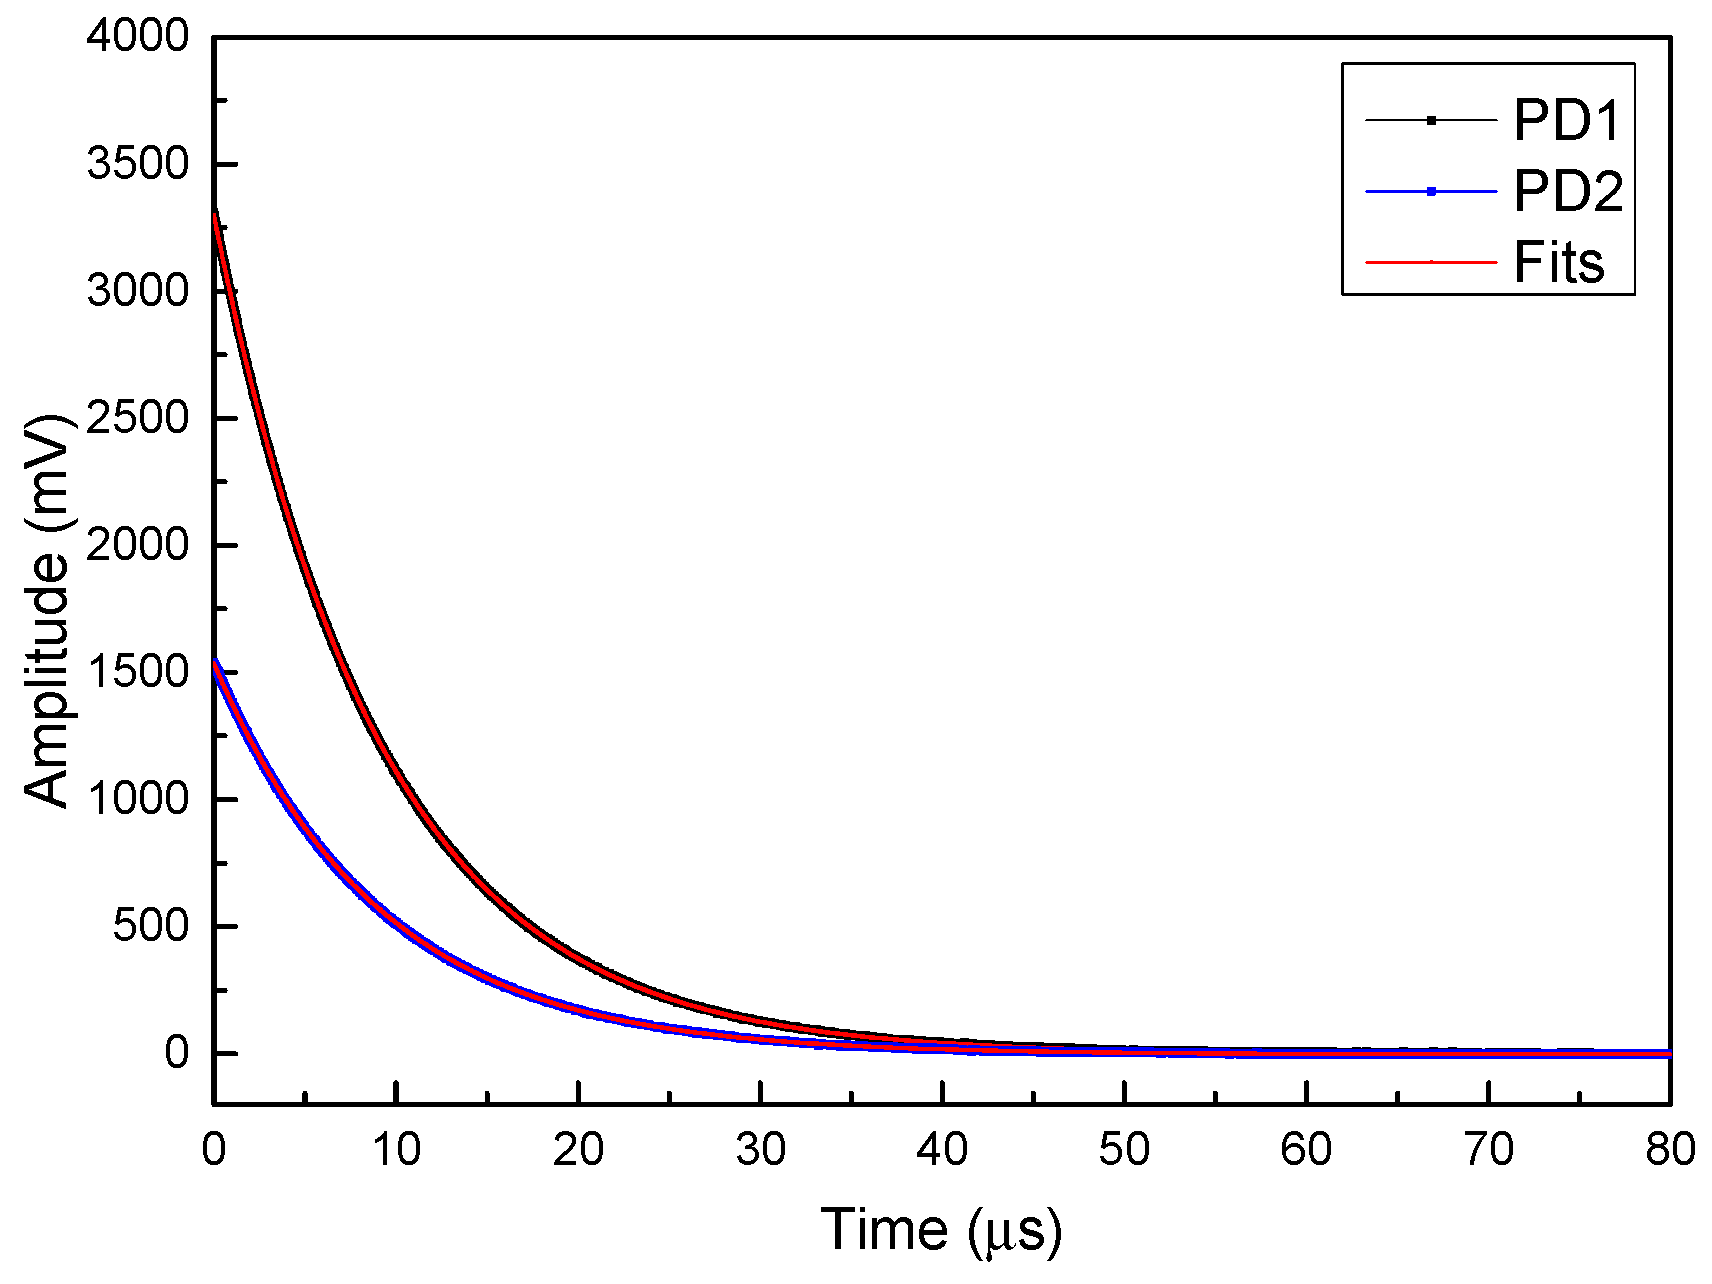
Three HR samples with different reflectance/transmittance combinations and therefore resulting in different level of saturation in the detected CRD signals are employed to demonstrate the simultaneous determination of high reflectance and residual transmittance with either non-saturated or saturated CRD signals. For HR sample #1, no detection saturation is present for both CRD channels. The CRD signals detected via PD1 and PD2 without ND filters are presented in Figure 4. Clearly, both CRD signals perfectly follow the single-exponential function. From the fitted ring-down time of the CRD signal detected via PD1 and the amplitude ratio of both CRD signals detected via PD1 and PD2, the reflectance and transmittance of HR sample #1 are determined to be 99.98607 ± 0.00004% and 7.6 ± 0.1 ppm (statistical results of 10 repeat measurements), respectively.
To test the influence of the ND filter on the simultaneous determination of reflectance and transmittance, ND filters with OD = 0.5 and 0.7 are placed in front of PD1, respectively, to reduce the CRD amplitude, and the measurement is repeated. With the ND filter of OD = 0.5, the reflectance and transmittance are determined to be 99.98608 ± 0.00004% and 7.4 ± 0.1 ppm, respectively. Meanwhile, with the ND filter of OD = 0.7, the reflectance and transmittance are determined to be 99.98606 ± 0.00003% and 7.9 ± 0.1 ppm, respectively. The results indicate that the use of the ND filter causes no influence on the reflectance determination, but causes an error of 0.2~0.3 ppm, or 2.6~3.9% on the residual transmittance determination. It is worth mentioning that when calculating the transmittance, not the nominal OD values but the transmittance values of the ND filters measured via the spectrophotometer are employed. Still, significant error is caused to the transmittance determination due to the OD uncertainty of the ND filters. On the other hand, if the nominal transmittance (30.9% versus measurement value 32.5%) of the ND filter with OD = 0.5 is used, the transmittance of the test sample #1 changes to 7.0 ± 0.1 ppm, the induced measurement error increases to 7.9%. From the measured reflectance and transmittance, the optical loss (1-R-T) of the test HR sample #1 is determined to be 131.7 ppm.
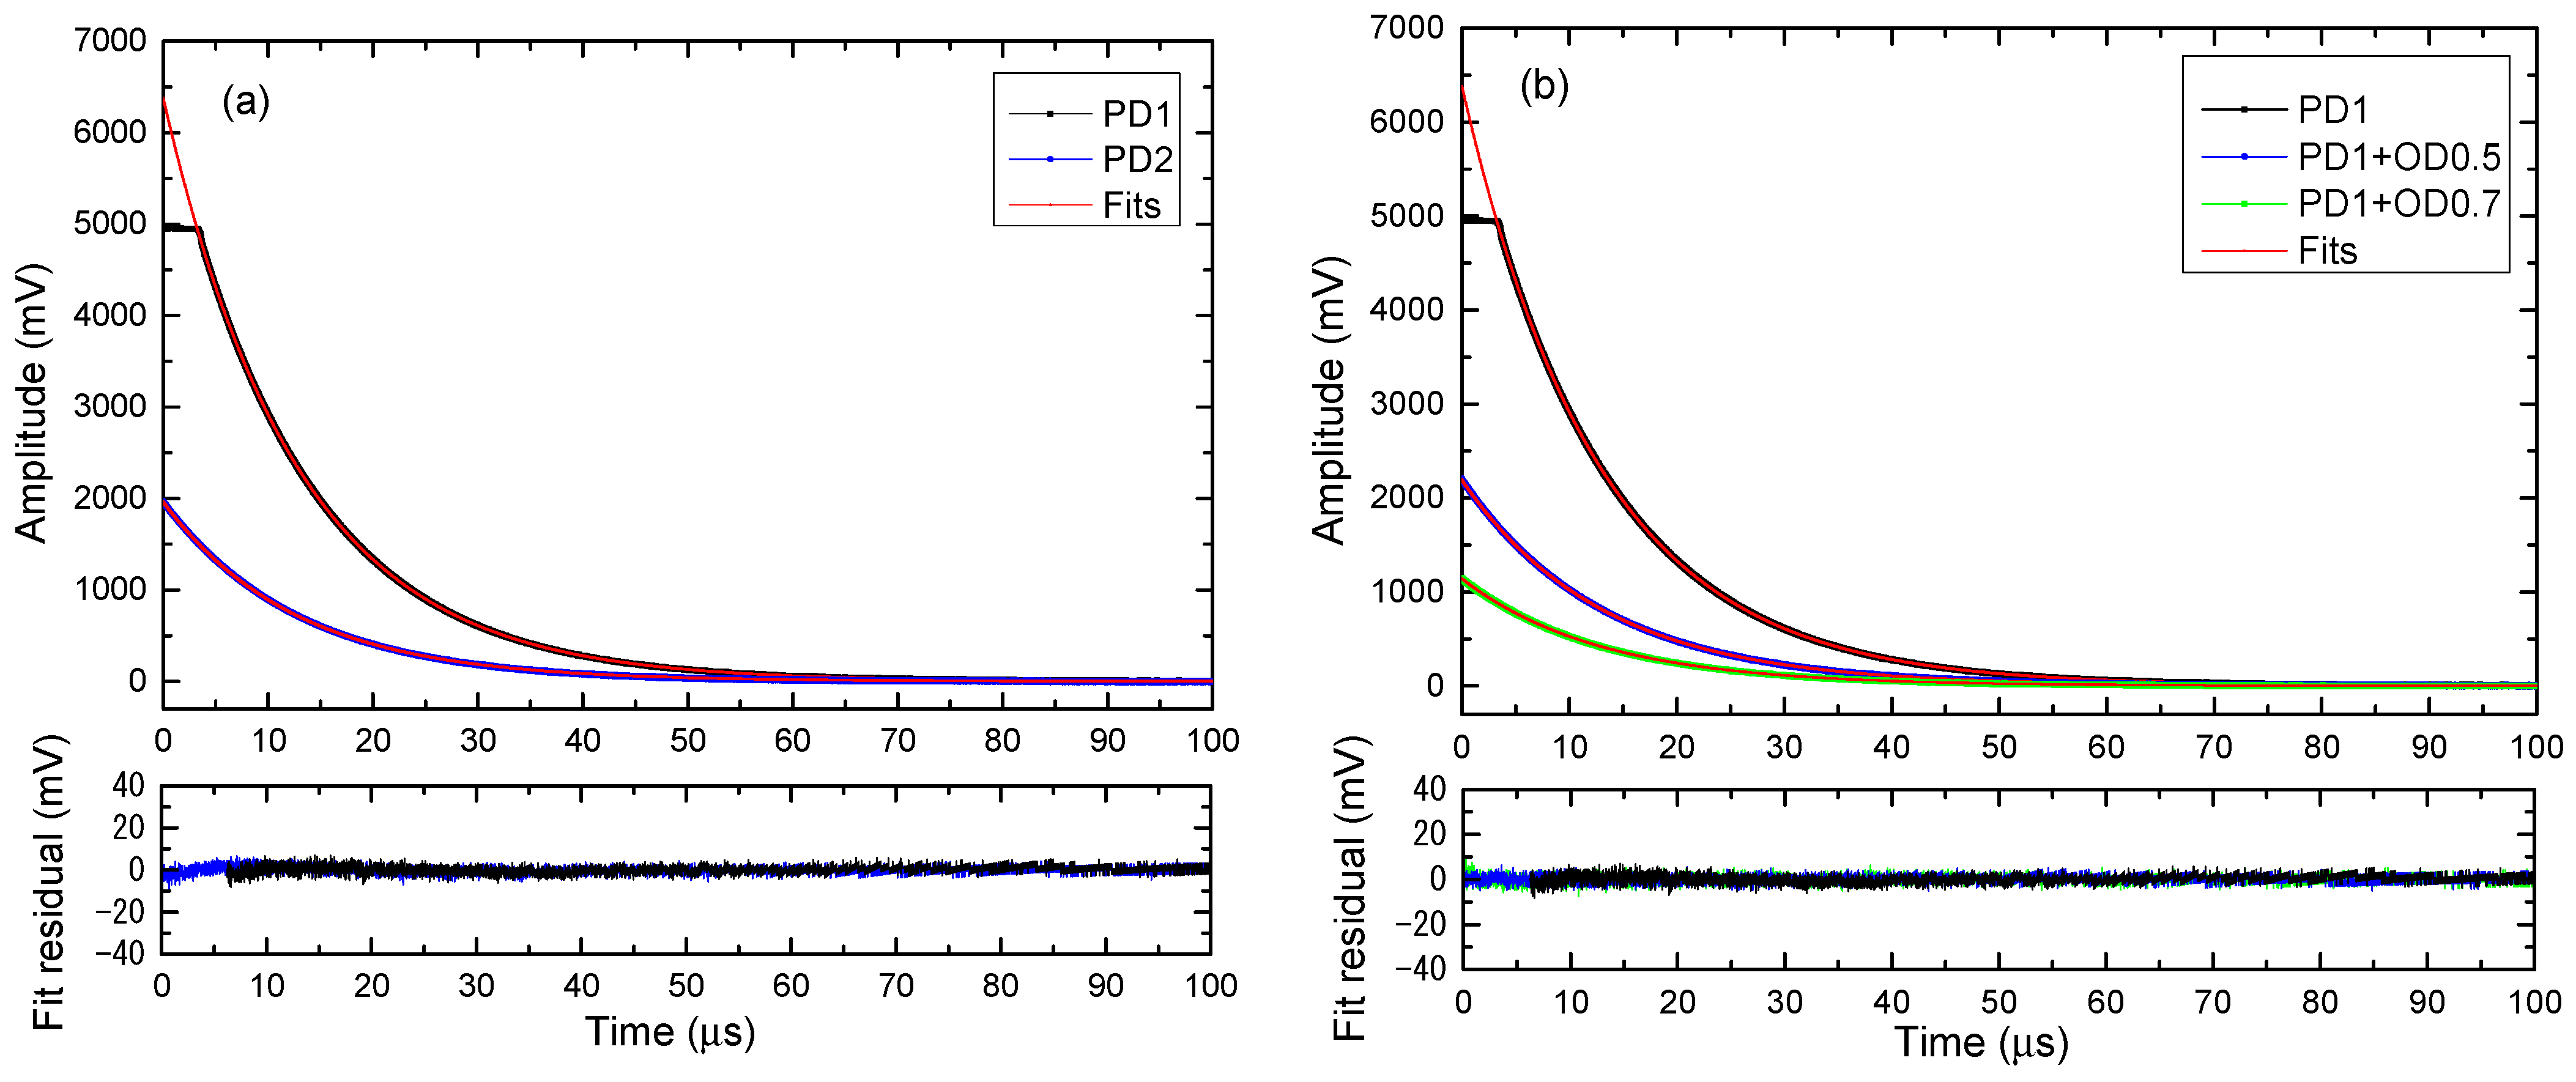
For test HR sample #2, when no ND filter is used, the CRD signal detected via PD1 is saturated, while the CRD signal detected via PD2 is not saturated, as presented in Figure 5a.
First, the saturated CRD signal detected via PD1 without employment of the ND filter is data-processed (the beginning 500 data points are deleted to eliminate saturation) to obtain the CRD amplitude and ring-down time; the non-saturated CRD signal detected via PD2 is fitted to the single-exponential function to obtain the CRD amplitude, and the reflectance and transmittance of test HR sample #2 are determined via Equations (1) and (2). The statistical results of 10 repeat measurements are 99.99463 ± 0.00002% and 5.4 ± 0.1 ppm, respectively.
Then, the ND filter of OD = 0.5 and 0.7 is placed in front of PD1, respectively, to eliminate the detection saturation. The CRD signals detected with the ND filters of OD = 0.5 and 0.7 are presented in Figure 5b. Again, the measurements are repeated 10 times. The statistical results with OD = 0.5 are 99.99461 ± 0.00003% and 5.3 ± 0.1 ppm, respectively, and with OD = 0.7 are 99.99459 ± 0.00001% and 5.6 ± 0.1 ppm, respectively. The use of the ND filter to eliminate the detection saturation induces an error of 0.1~0.2 ppm, or 1.9~3.6% to the transmittance. From the measured reflectance and transmittance, the optical loss (1-R-T) of test HR sample #2 is calculated to be 48.3 ppm.
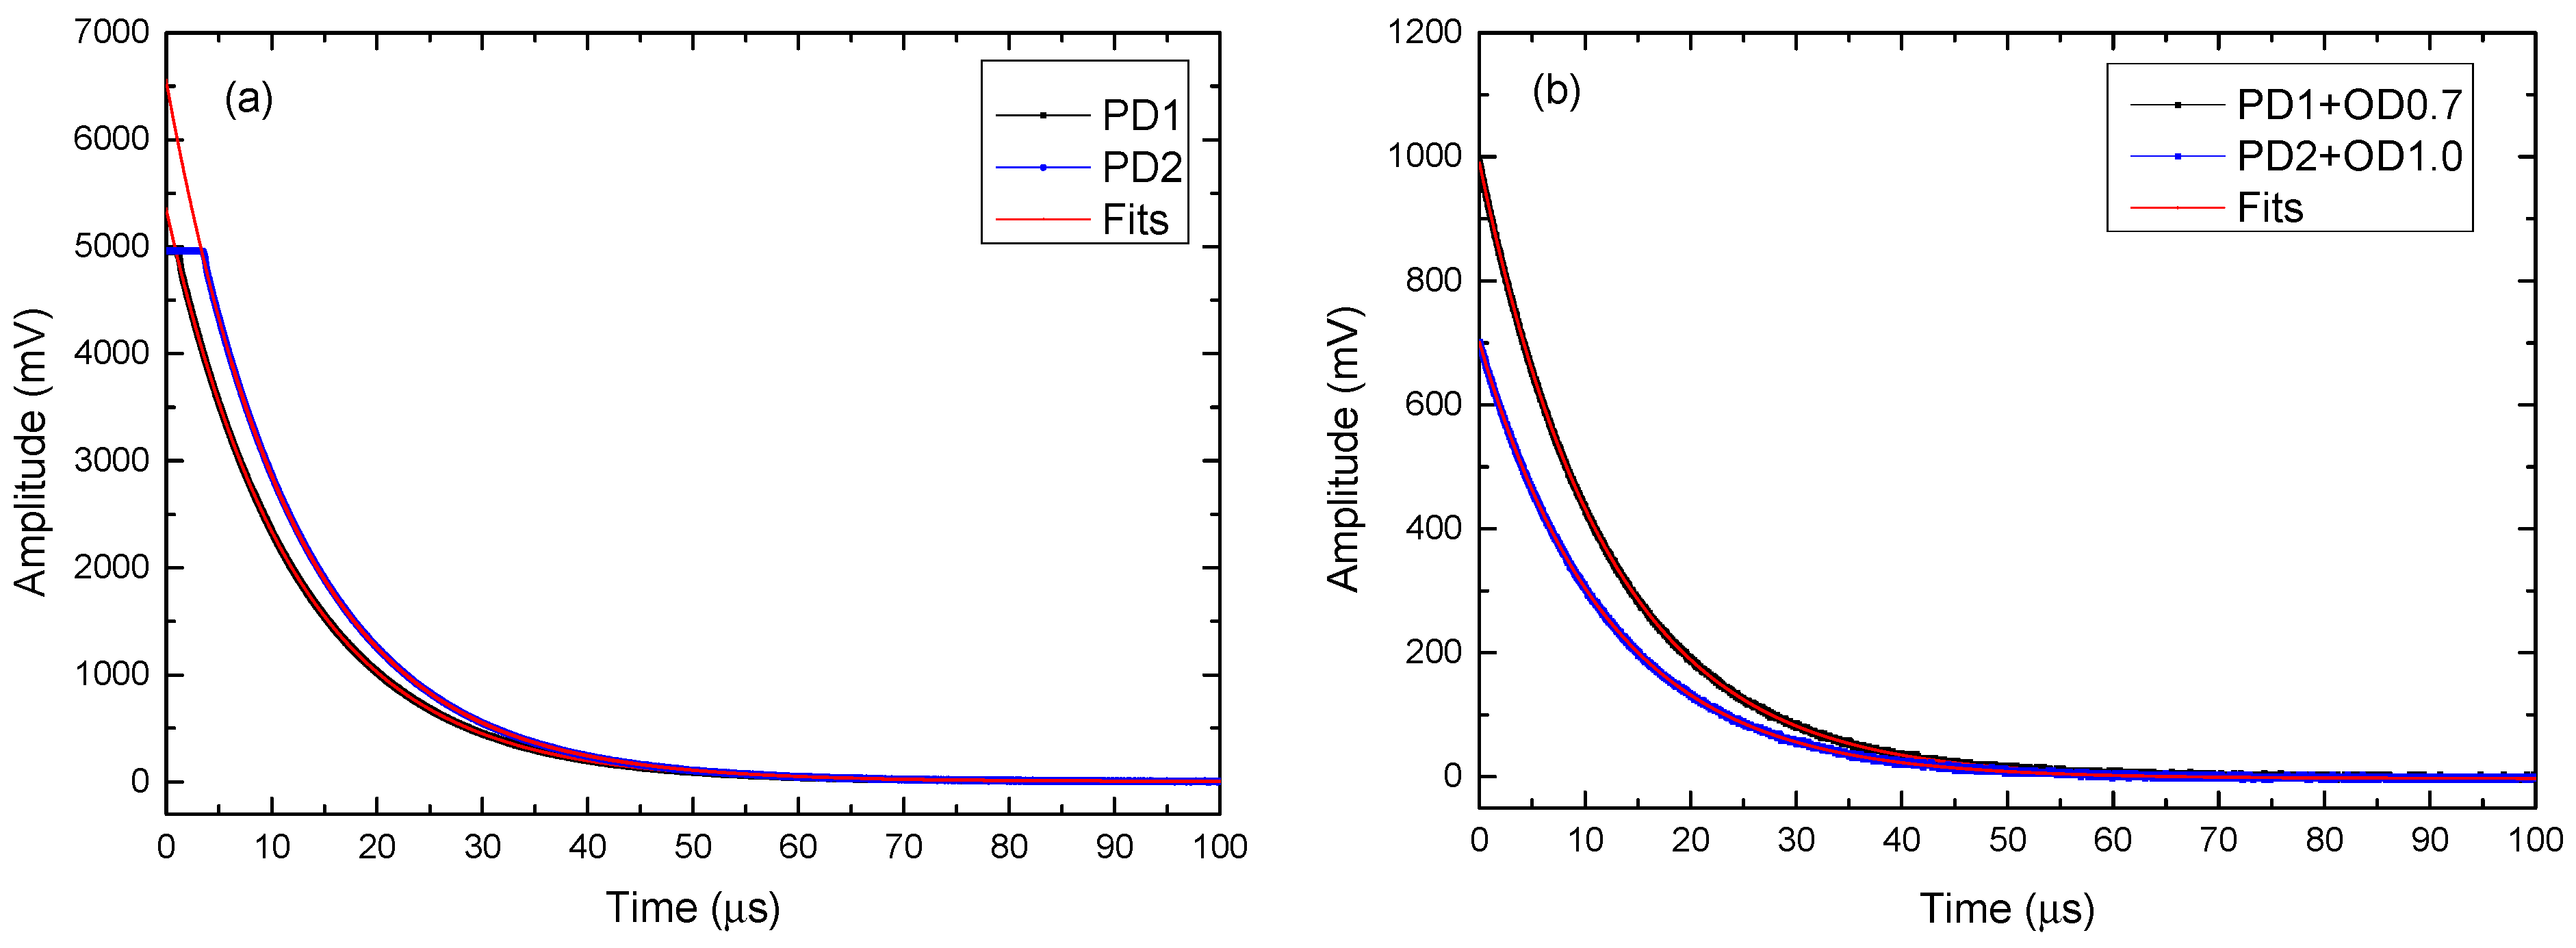
For test HR sample #3, the CRD signals detected via PD1 and PD2 are both saturated with different saturation levels, as shown in Figure 6a.
Similarly, the saturated CRD signals detected via PD1 and PD2 without employment of an ND filter are data-processed (the beginning 300 data points in the PD1-detected CRD signal and 500 data points in the PD2-detected CRD signal are deleted to eliminate saturation) to obtain the CRD amplitude and ring-down time. The reflectance of test HR sample #3 is determined with the fitted ring-down time of the PD1-detected CRD signal via Equation (1), and the residual transmittance is determined with the amplitude ratio via Equation (2). The statistical results of 10 repeat measurements are 99.99323 ± 0.00004% and 21.2 ± 0.2 ppm, respectively. The optical loss of the test HR sample #3 is then 46.5 ppm.
Again, different ND filter combinations are used to eliminate the saturations in both CRD signal channels. For example, the ND filter with OD = 0.7 is placed in the PD1 detection channel, and the ND filter with OD = 1.0 is inserted in the PD2 detection channel. The resulting CRD signals are presented in Figure 6b. The statistical results of 10 repeat measurements give reflectance 99.99316 ± 0.00002% and residual transmittance 23.8 ± 0.2 ppm, respectively. Replacing the OD = 1.0 ND filter in the PD2 detection channel with the OD = 0.5 ND filter results in reflectance 99.99318 ± 0.00002% and residual transmittance 22.8 ± 0.2 ppm, respectively. The OD = 0.5 and 0.7 ND filter combination induces an error of 7.5% to the transmittance measurement, while the OD = 0.7 and 1.0 ND filter combination causes an error as large as 12.3% to the transmittance measurement.
The measurement results for the three test HR samples indicate the following: (1) The detection saturation has no influence on the determination of the reflectance which is calculated from the measured ring-down time. The ring-down time can be accurately extracted either from the saturated CRD signal by deleting the beginning saturated data points and fitting the remaining non-saturated CRD signal to a single-exponential function, or from the non-saturated CRD signal by utilizing ND filter(s) to eliminate the detection saturation. (2) The residual transmittance of the test HR sample can be accurately determined by the amplitude ratio obtained from the saturated or non-saturated CRD signals without employment of ND filter(s) for detection power attenuation, and therefore to eliminate detection saturation. (3) The utilization of ND filter(s) to eliminate detection saturation causes no error to the reflectance measurement, but causes significant error to the residual transmittance measurement of the HR sample. (4) The ND-filter-induced error to the residual transmittance measurement increases with the increasing OD of the ND filter. This is because as the OD increases, the transmittance of the ND filter decreases, and the error in the spectrophotometer-measured transmittance of the ND filter increases, resulting in increased uncertainty in the residual transmittance of the test HR sample via Equation (3). It is concluded that by deleting the beginning saturated data points in the saturated CRD signal and fitting the remaining non-saturated data points to a single-exponential function, the ring-down time and amplitude of the saturated CRD signal are accurately determined and applied to calculate the high reflectance and residual transmittance of the test HR sample. A higher accuracy for the residual transmittance measurement is expected as error caused by the ND filter(s) is avoided. This error is significant when the OD of the ND filter is high.
The data processing approach to eliminate the influence of detection saturation on the determination of the ring-down time and amplitude of the saturated CRD signal could also extend the measurement dynamic range of the dual-channel CRD for the residual transmittance measurements of the HR sample. This dynamic range is determined by the amplitude range of the CRD signal(s), which is limited by the saturation level and noise level of the photo-detectors. The proposed data processing removes the saturation-induced maximum amplitude limit, and therefore expands the measured amplitude range of the CRD signal(s). It is expected that by employing the proposed data processing approach, the residual transmittance ranging from below 1 ppm up to over 5000 ppm can be readily measured with the CRD technique.
It is worth mentioning that in principle the detection saturation could also be eliminated by reducing the laser power entering the RDC, either via adjusting the drive current of the laser power supply or via putting optical attenuators between the laser and the RDC. However, either adjusting the drive current or inserting OD filter(s) before the ODC could affect the mode coupling of the laser beam into the RDC, and therefore cause errors to the CRD signal detection. In our case, by employing the optical feedback CRD for reflectance/transmittance measurement, the use of OD filter(s) before the RDC changes the optical feedback strength, and therefore influences the coupling and the CRD signal detection. Such issues are avoided by employing ND filters to attenuate the laser power entering the photo-detectors.

4. Conclusions

To summarize, a data processing approach was developed to accurately extract the ring-down time and amplitude of the saturated CRD signal; both were utilized to determine simultaneously the high reflectance and residual transmittance of HR mirrors in a dual-channel CRD configuration. By comparing the measurement results of three HR samples with different reflectance/transmittance combinations obtained via data processing of saturated CRD signals and via non-saturated CRD signals with utilization of ND filter(s) to eliminate detection saturation, it was found that the reflectances obtained with both methods are in excellent agreement, while the residual transmittance obtained with the saturated CRD signal is more accurate than that obtained with the ND-filter-attenuated non-saturated CRD signal. This is because the utilization of the ND filter induced additional error to the amplitude ratio of the two-channel CRD signals. The proposed data processing method eliminated the need to use the ND filter, and therefore avoided the adding of the OD error to the uncertainty of residual transmittance measurement, and improved the transmittance measurement accuracy. Compared to existing CRD schemes for simultaneous reflectance/transmittance measurements, the proposed data processing method not only resulted in more accurate determination of the optical loss (1-R-T), which is especially important when the optical losses become below 10 ppm [31], but also extended the measurement dynamic range. It is expected that the method presented in this paper could be useful in the preparation of high-performance laser optics with extremely low optical losses [32].

Author Contributions

Conceptualization, B.L. and Y.H.; methodology, Y.H. and J.W.; software, Y.H. and T.W.; validation, Y.H. and B.L.; investigation, Y.H. and H.C.; resources, J.W. and H.C.; data curation, J.W.; writing—original draft preparation, Y.H. and B.L.; writing—review and editing, B.L.; visualization, Y.H. and T.W. All authors have read and agreed to the published version of the manuscript.

Funding

National Key Research and Development Program of China (2021YFC2202203).

Data Availability Statement

Data of the results presented in this article are available from the corresponding author upon reasonable request.

Conflicts of Interest

The authors declare no conflicts of interest.

References

  1. Haynam, C.A.; Wegner, P.J.; Auerbach, J.M.; Bowers, M.W.; Wonterghem, B.M.V. National Ignition Facility laser performance status. Appl. Opt. 2007, 46, 3276–3303. [Google Scholar] [CrossRef] [PubMed]
  2. Willemsen, T.; Chaulagain, U.; Havlickova, I.; Borneis, S.; Ebert, W.; Ehlers, H.; Gauch, M.; Gross, T.; Kramer, D.; Lastovicka, T.; et al. Large area ion beam sputtered dielectric ultrafast mirrors for petawatt laser beamlines. Opt. Express 2022, 30, 6129–6141. [Google Scholar] [CrossRef] [PubMed]
  3. Chow, W.W.; Gea-Banacloche, J.; Pedrotti, L.M.; Sanders, V.E.; Scully, M.O. The ring laser gyro. Rev. Mod. Phys. 1985, 57, 61–104. [Google Scholar] [CrossRef]
  4. Passaro, V.M.N.; Cuccovillo, A.; Vaiani, L.; De Carlo, M.; Campanella, C.E. Gyroscope Technology and Applications: A Review in the Industrial Perspective. Sensors 2017, 17, 2284. [Google Scholar] [CrossRef] [PubMed]
  5. Reid, S.; Martin, I.W. Development of mirror coatings for gravitational wave detectors. Coatings 2016, 6, 61. [Google Scholar] [CrossRef]
  6. Pinard, L.; Michel, C.; Sassolas, B.; Balzarini, L.; Degallaix, J.; Dolique, V.; Flaminio, R.; Forest, D.; Granata, M.; Lagrange, B.; et al. Mirrors used in the LIGO interferometers for first detection of gravitational waves. Appl. Opt. 2017, 56, C11–C15. [Google Scholar] [CrossRef]
  7. Krinner, L.; Dietze, K.; Pelzer, L.; Spethmann, N.; Schmidt, P.O. Low phase noise cavity transmission self-injection locked diode laser system for atomic physics experiments. Opt. Express 2024, 32, 15912–15922. [Google Scholar] [CrossRef]
  8. Berden, G.; Peeters, R.; Meijer, G. Cavity ring-down spectroscopy: Experimental schemes and applications. Int. Rev. Phys. Chem. 2000, 19, 565–607. [Google Scholar] [CrossRef]
  9. Herbelin, J.M.; McKay, J.A.; Kwok, M.A.; Ueunten, R.H.; Urevig, D.S.; Spencer, D.J.; Benard, D.J. Sensitive measurement of photon lifetime and true reflectances in an optical cavity by a phase-shift method. Appl. Opt. 1980, 19, 144–147. [Google Scholar] [CrossRef]
  10. Anderson, D.Z.; Frisch, J.C.; Masser, C.S. Mirror reflectometer based on optical cavity decay time. Appl. Opt. 1984, 23, 1238–1245. [Google Scholar] [CrossRef]
  11. Rempe, G.; Thompson, R.J.; Kimble, H.J.; Lalezari, R. Measurement of ultralow losses in an optical interferometer. Opt. Lett. 1992, 17, 363–365. [Google Scholar] [CrossRef] [PubMed]
  12. Uehara, N.; Ueda, A.; Ueda, K.; Sekiguchi, H.; Mitake, T.; Nakamura, K.; Kitajima, N.; Kataoka, I. Ultralow-loss mirror of the parts-in-106 level at 1064 nm. Opt. Lett. 1995, 20, 530–532. [Google Scholar] [PubMed]
  13. Gong, Y.; Li, B.; Han, Y. Optical feedback cavity ring-down technique for accurate measurement of ultra-high reflectivity. Appl. Phys. B 2008, 93, 355–360. [Google Scholar] [CrossRef]
  14. Cho, H.J.; Lee, J.C.; Lee, S.H. Design and development of an ultralow optical loss mirror coatings for zerodur substrate. J. Opt. Soc. Korea 2012, 16, 80–84. [Google Scholar] [CrossRef]
  15. Qin, C.; Guo, X.Q.; Zhou, J.; Wang, C.X.; Rong, J.Y.; Zhang, Q.; Li, G.; Zhang, P.F.; Zhang, T.C. Optical characterization of a fiber Fabry-Perot cavity: Precision measurement of intra-cavity loss, transmittance, reflectance. Opt. Express 2024, 32, 14780–14788. [Google Scholar] [CrossRef]
  16. Zhang, H.; Zhang, D.; Hu, M.; Wang, Q. Direct readout of mirror reflectivity for cavity-enhanced gas sensing using Pound-Drever-Hall signals. Opt. Lett. 2023, 48, 5996–5999. [Google Scholar] [CrossRef] [PubMed]
  17. Truong, G.W.; Winkler, G.; Zederbauer, T.; Bachmann, D.; Heu, P.; Follman, D.; White, M.E.; Heckl, O.H.; Cole, G.D. Near-infrared scanning cavity ringdown for optical characterization of supermirrors. Opt. Express 2019, 27, 19141–19149. [Google Scholar] [CrossRef]
  18. Truong, G.W.; Perner, L.W.; Beiley, D.M.; Winkler, G.; Catano-Lopez, S.B.; Wittwer, V.J.; Sudmeyer, T.; Nguyen, C.; Follman, D.; Fleisher, A.J.; et al. Mid-infrared supermirrors with finesse exceeding 400000. Nat. Commun. 2023, 14, 7846. [Google Scholar] [CrossRef]
  19. Wu, M.; Wang, J.; Han, Y.; Cui, H.; Li, B. Minimizing the influence of higher-order transverse modes on the precision of cavity ring-down measurements. Opt. Lasers Eng. 2023, 161, 107339. [Google Scholar] [CrossRef]
  20. ISO 13142; Optics and Photonics—Lasers and Laser-Related Equipment—Cavity Ring-Down Method for High-Reflectance and High-Transmittance Measurement. International Organization for Standardization: Geneva, Switzerland, 2021.
  21. Cui, H.; Li, B.; Xiao, S.; Han, Y.; Wang, J.; Gao, C.; Wang, Y. Simultaneous mapping of reflectance, transmittance and optical loss of highly reflective and anti-reflective coatings with two-channel cavity ring-down technique. Opt. Express 2017, 25, 5807–5820. [Google Scholar] [CrossRef]
  22. Li, B.; Zhang, X.; Yang, Z.; Wang, J.; Han, Y.; Li, T.; Cui, H.; Zhao, B. Optical scattering measurement of highly reflective coatings with cavity ring-down technique. Opt. Lett. 2024, 49, 4601–4604. [Google Scholar] [CrossRef] [PubMed]
  23. Gong, Y.; Li, B. Effect of instrumental response time in exponential-decay based cavity ring-down technique for high reflectivity measurement. Proc. SPIE 2007, 6720, 67201E. [Google Scholar]
  24. Liu, P.L.; Williams, K.J.; Frankel, M.Y.; Esman, R.D. Saturation characteristics of fast photodetectors. IEEE Trans. Microw. Theory Tech. 1999, 47, 1297–1303. [Google Scholar] [CrossRef]
  25. Huang, Y.L.; Sun, C.K. Nonlinear saturation behaviors of high-speed p-i-n photodetectors. J. Light. Technol. 2000, 18, 203–212. [Google Scholar] [CrossRef]
  26. Liu, W.; Xu, Z. APD nonlinearity and its impact on PAM-based visible light communication. IEEE Commun. Lett. 2020, 24, 1057–1061. [Google Scholar] [CrossRef]
  27. Liu, W.; Xu, Z.; Jin, X. Saturation compensation for visible light communication with off-the-shelf detectors. Opt. Express 2021, 29, 9670–9683. [Google Scholar] [CrossRef]
  28. Caro, G.E.; Veiras, F.E.; Acosta, E.O.; Perez, L.I. Influence of multiple reflections on the transmission coefficients of uniaxial plane–parallel plates. Appl. Opt. 2021, 60, 4573–4581. [Google Scholar] [CrossRef]
  29. Gregorčič, P.; Babnik, A.; Možina, J. Interference effects at a dielectric plate applied as a high-power-laser attenuator. Opt. Express 2010, 18, 3871–3882. [Google Scholar] [CrossRef]
  30. Li, B.; Cai, H.; Han, Y.; Gao, L.; Gao, C.; Wang, Y. Simultaneous determination of optical loss, residual reflectance and transmittance of highly anti-reflective coatings with cavity ring down technique. Opt. Express 2014, 22, 29135–29142. [Google Scholar] [CrossRef] [PubMed]
  31. Winkler, G.; Perner, L.W.; Truong, G.-W.; Zhao, G.; Bachmann, D.; Mayer, A.S.; Fellinger, J.; Follman, D.; Heu, P.; Deutsch, C.; et al. Mid-infrared interference coatings with excess optical loss below 10 ppm. Optica 2021, 8, 686–696. [Google Scholar] [CrossRef]
  32. Cole, G.D.; Zhang, W.; Bjork, B.J.; Follman, D.; Heu, P.; Deutsch, C.; Sonderhouse, L.; Robinson, J.; Franz, C.; Alexandrovski, A.; et al. High-performance near- and mid-infrared crystalline coatings. Optica 2016, 3, 647–656. [Google Scholar] [CrossRef]
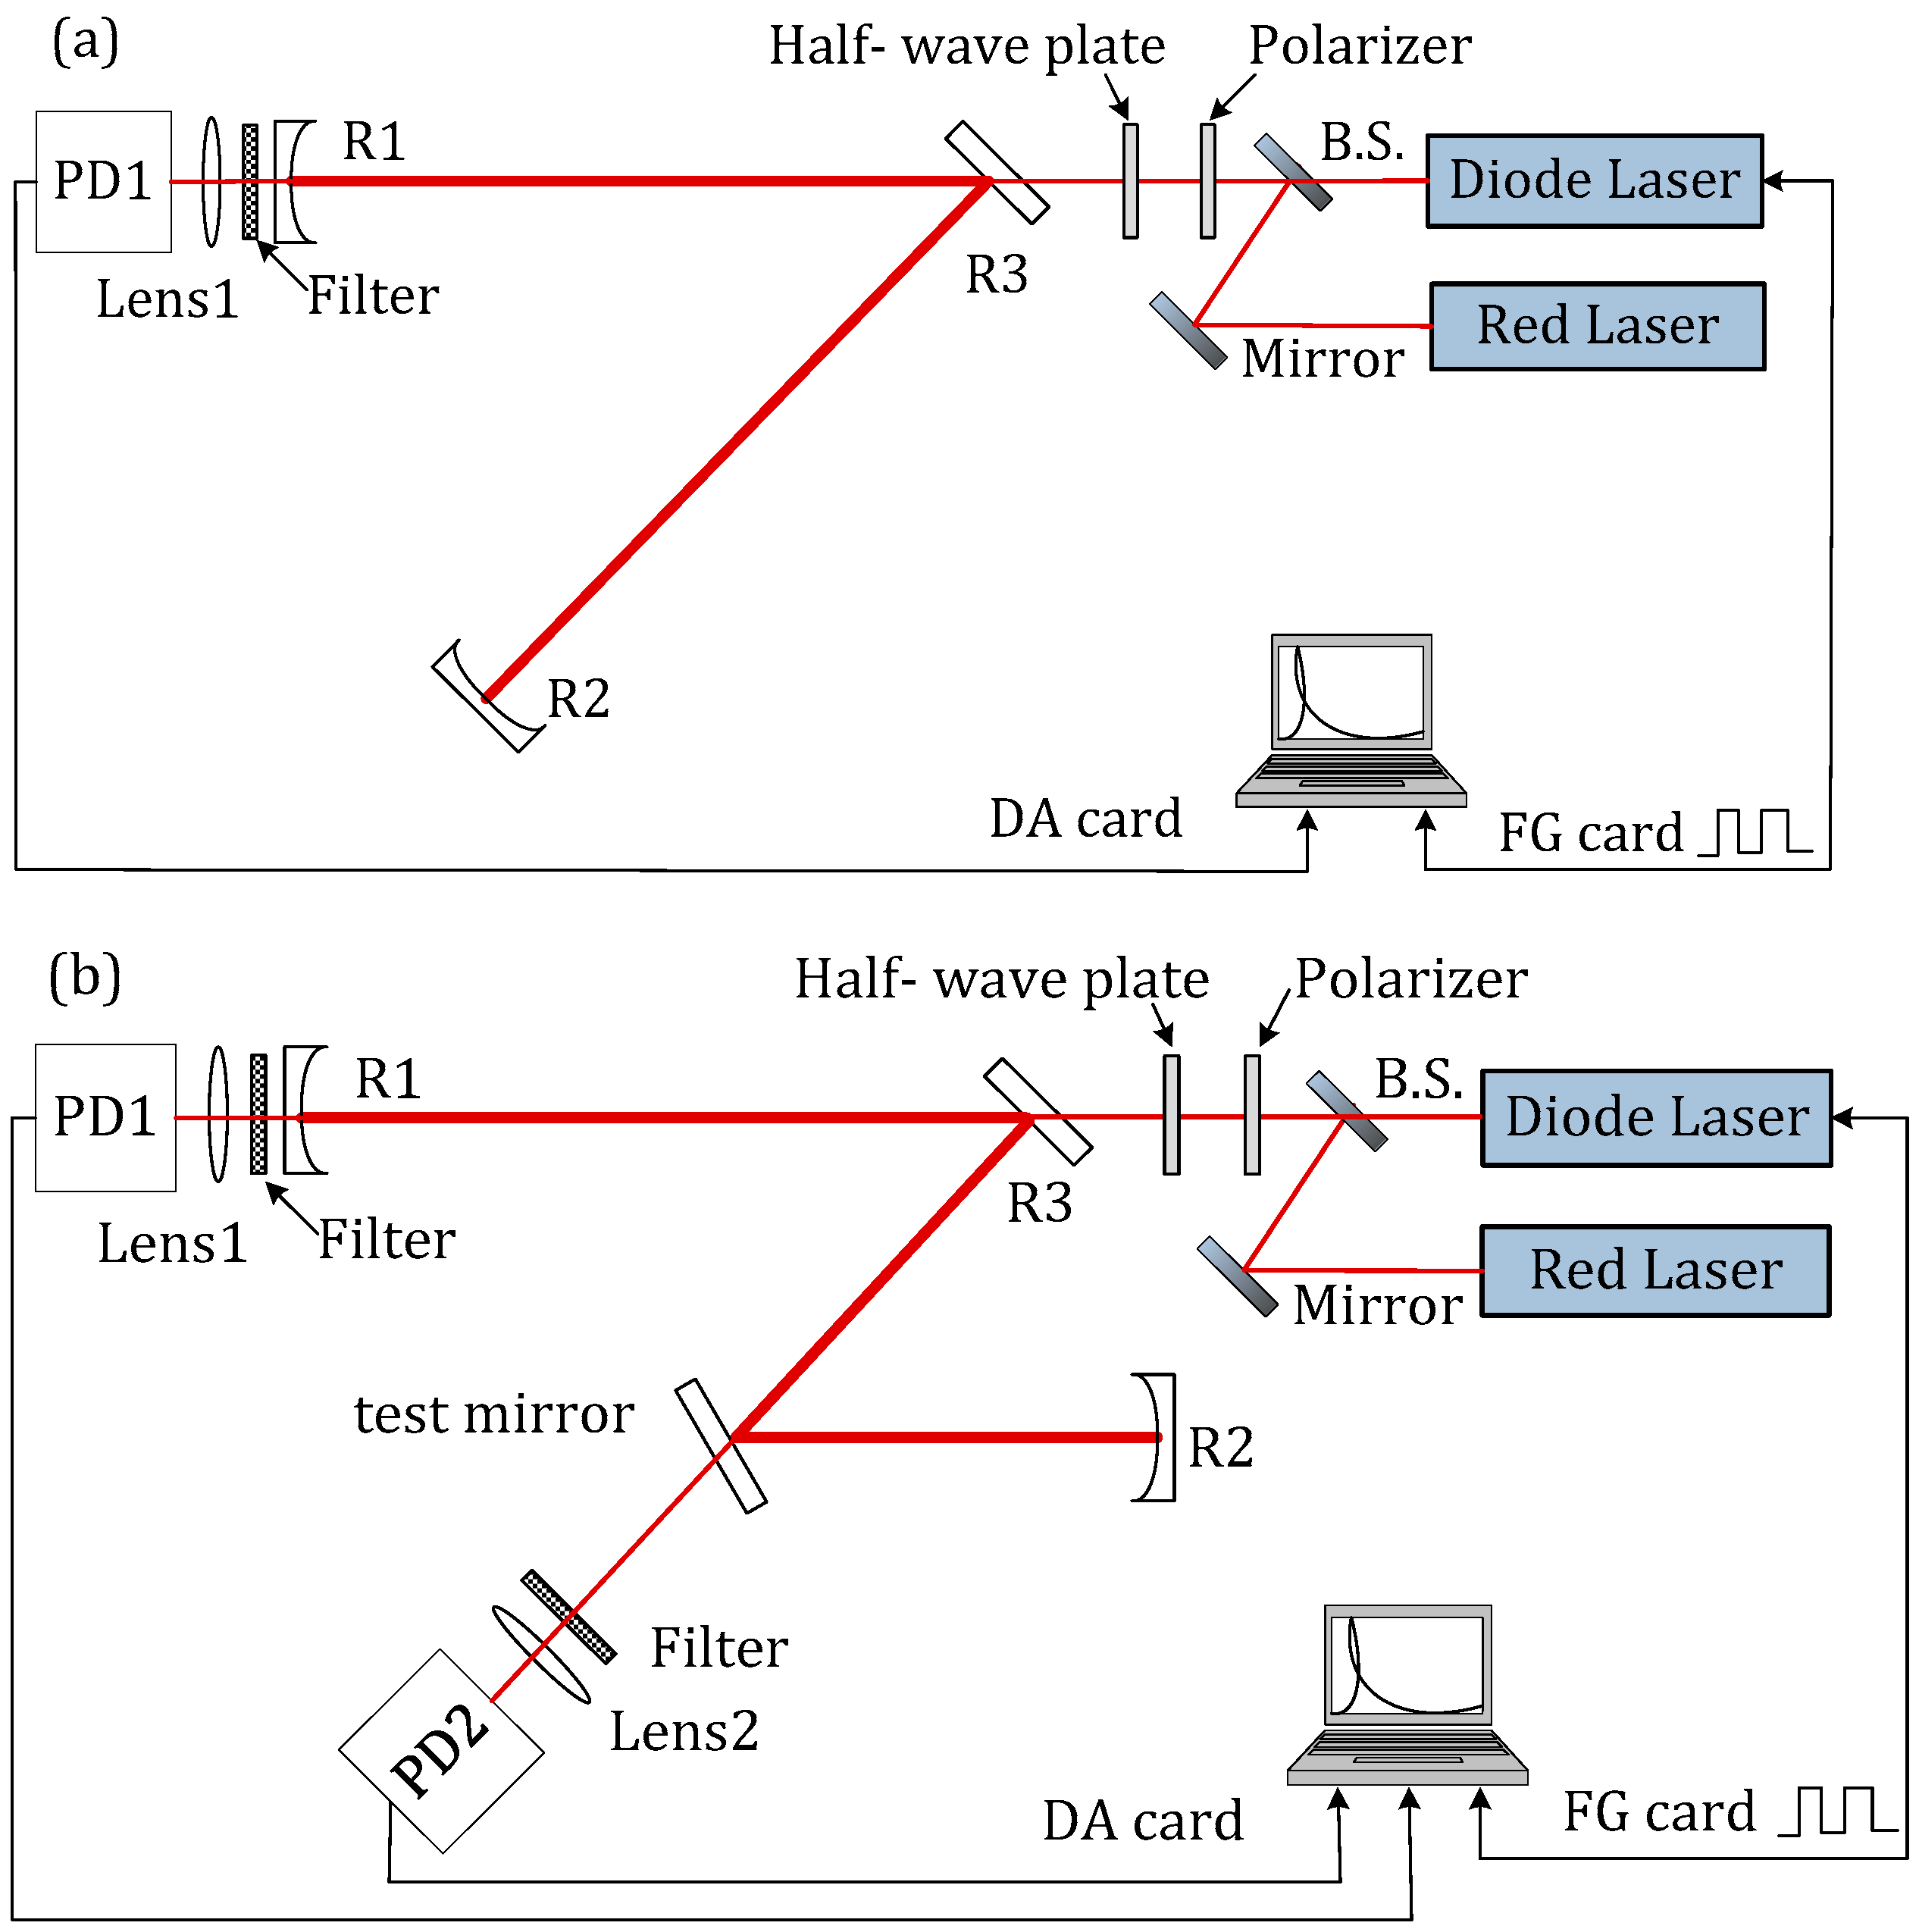
Figure 1. Dual-channel CRD experimental setup for simultaneous reflectance and transmittance measurement of HR mirrors. (a) Initial RDC configuration; (b) test RDC configuration. B.S.: beamsplitter; PD1, PD2: photo-detectors; R1, R2: cavity mirrors; R3: coupling mirror.
Photonics 11 00984 g001
Figure 2. (a) Non-saturated and saturated CRD signals of the initial cavity; (b) non-saturated CRD signal, corresponding single-exponential fit and fit residual; (c) saturated CRD signal and corresponding single-exponential fits with different numbers (0, 300, 900) of beginning data points being removed. The fit residuals with 0 and 300 data point removal are presented with the left scale, and the fit residual with 900 data point removal is presented with the right scale.
Photonics 11 00984 g002
Figure 3. (a) Average reflectance of the cavity mirrors determined via non-saturated and saturated CRD signals with different numbers of beginning data points removed; (b) fitted amplitudes of non-saturated and saturated CRD signals with different numbers of beginning data points removed.
Photonics 11 00984 g003
Figure 4. The CRD signals detected via PD1 and PD2 without ND filters for test HR sample #1.
Photonics 11 00984 g004
Figure 5. (a) The CRD signals detected via PD1 and PD2 without ND filters; (b) the CRD signals detected via PD1 without and with ND filters of OD = 0.5 and 0.7, respectively, for test HR sample #2. The corresponding single-exponential fits and fit residuals are presented.
Photonics 11 00984 g005
Figure 6. (a) The CRD signals detected via PD1 and PD2 without ND filters; (b) the CRD signals detected via PD1 and PD2 with ND filters of OD = 0.7 and 1.0, respectively, for test HR sample #3.
Photonics 11 00984 g006
Disclaimer/Publisher’s Note: The statements, opinions and data contained in all publications are solely those of the individual author(s) and contributor(s) and not of MDPI and/or the editor(s). MDPI and/or the editor(s) disclaim responsibility for any injury to people or property resulting from any ideas, methods, instructions or products referred to in the content.