Abstract
Non-invasive methods for determining blood hemoglobin (Hb) concentration are urgently needed to avoid the painful and time-consuming process of invasive venous blood sampling. Many such methods rely on assessing the average attenuation of light over a tissue area where hemoglobin is the dominant chromophore, without separating those areas corresponding to vessels and bloodless tissue. In this study, we investigate whether it is possible to determine hemoglobin levels in the blood by assessing the changes in light intensity when passing through large vessels in comparison to adjacent tissues, using this as a Hb level predictor. Using Monte Carlo light transport modeling, we evaluate the accuracy of determining hemoglobin levels via light intensity contrast and vessel widths estimated in the transmittance illumination geometry and estimate the influence of physiologically significant parameters such as vessel depth, dermis vascularization, and melanin content in the epidermis on the blood Hb prediction error. The results show that physiological variations in tissue parameters limit the mean absolute error of this method to ~15 g/L for blood Hb levels varying in the 60–160 g/L range, which finding is also supported by experimental data obtained for volunteers with different total blood Hb levels that have been determined invasively. We believe the application of new approaches to the non-invasive assessment of Hb levels will lead to the creation of reliable and accurate devices that are applicable in point-of-care and clinical practice.
1. Introduction
The concentration of hemoglobin in human blood (hereafter referred to as the blood Hb level) is an important clinical parameter that is monitored in most blood tests. Yet, currently, the determination of Hb level is invasive, involving venous blood sampling, which is painful, requires skilled medical personnel, and is time-consuming [1].
As a result, there is a growing interest in rapid non-invasive optical techniques for measuring Hb levels, leveraging the strong absorption of Hb in the visible and near-infrared spectral ranges. While various approaches have been proposed, they differ in the tissue sites investigated, spectral ranges, and imaging/sensing scheme geometry. For instance, a few FDA-approved devices use the method of multispectral photoplethysmography [2,3,4] to assess hemoglobin levels. Other studies suggest quantitative blood Hb level assessment using RGB imaging or the analysis of the diffuse reflectance spectra of various tissue areas where Hb is the dominant chromophore, such as the eye conjunctiva [5,6,7,8,9], fundus and external eye [10,11,12], or nail plates [13,14,15]. It is worth noting that although some studies claim a fairly low level of error regarding non-invasive Hb level determination (below 10 g/L, or 1 g/dL), independent studies have shown consistently higher error rates for different optical techniques of around 15–20 g/L [4,16,17,18,19,20,21]. According to the authors of [22], the acceptable relative error for non-invasive blood Hb assessment methods should be approximately 10% in the critical anemic range (60–100 g/L or 6–10 g/dL). Therefore, it is imperative that the absolute error within this range should not surpass 10 g/L. This limitation currently restricts the use of non-invasive Hb assessment methods in clinical settings.
One potential explanation for the high error in optical Hb level assessment may stem from the use of “averaged” information on the light attenuation in an investigated tissue area, without consideration of the light absorption specifically performed by blood vessels. Concurrently, a more comprehensive examination of Hb level determination techniques based on imaging indicates that it is the data pertaining to the absorption properties of blood vessels that hold paramount significance for blood Hb level prediction or in forecasting anemia risk [10].
Imaging of blood vessels can be particularly successful in the near-infrared range. Indeed, the absorption of oxy- and deoxy-Hb in the near-IR range makes veins clearly distinguishable from the surrounding tissues in reflected or transmitted light. This has already been utilized for visualizing veins in point-of-care diagnostic tasks [23,24,25] and is also being considered as a method of personal identification, based on the unique pattern of the blood vessels in the hand [25,26,27]. However, the potential use of contrast with large vessels in the near-IR region to determine blood Hb levels has not been fully explored. It can be hypothesized that the difference in transmitted light intensities through veins and the surrounding tissues would primarily depend on hemoglobin concentration and vessel thickness. Then, by evaluating vessel thickness and the observed “contrast” of diffusely transmitted or reflected light—the ratio of light intensity transmitted through the vein to the intensity of light transmitted through adjacent vessel-free tissue—it will be possible to estimate blood Hb levels. Only a limited number of studies have addressed the potential of utilizing contrast in diffuse light transmission through small finger veins to determine hemoglobin levels, with reported errors in the order of 25 g/L (2.5 g/dL) [28,29]. However, the operational principles of these methods and the various factors contributing to the high error rates of these devices have not been elucidated, nor have potential sources of error in this technique been thoroughly investigated.
In this work, we utilize Monte Carlo light transport modeling to investigate the feasibility of assessing blood Hb levels using the contrast of diffuse light transmission in arm veins. We quantify the potential error in Hb level determination using this method, taking into account various physiological parameters such as vessel depth, scattering parameters, melanin content in the skin, and blood volume fraction in the dermis. Finally, we show an experimental proof-of-concept of this method in patients with normal and low hemoglobin levels and discuss potential artifacts that affect the accuracy of determining hemoglobin levels using this technique.
2. Materials and Methods
2.1. Monte Carlo Simulations
2.1.1. Simulated Object Geometrical Properties
The Monte Carlo modeling of light transport in tissues was carried out using the PyXOpto package [30]. The simulated object represented a voxelized parallelepiped with a voxel size of 50 µm and a depth of Z—10 mm, with lateral dimensions along the X and Y coordinates of 40 mm and 20 mm, placed in the area X × Y × Z ∈ [−20, 20] × [−10, 10] × [0, 10] mm. The simulated object consisted of two layers parallel to the X × Y plane, simulating the optical properties of the epidermis (layer 1) and “internal” tissues—dermis, hypodermis, muscles, etc. (layer 2). The thickness of the first layer was fixed and was equal to 0.1 mm, and the entire remaining volume was filled by the second layer. To model a blood vessel, a cylinder with an axis directed parallel to the Y-axis, centered at , and , where r is the radius of the vessel, and is the distance from the vessel surface closest to the surface boundary, was located in the modeled object. A schematic view of the object in the X × Z plane is presented in Figure 1a.
A uniform collimated radiation source, located at the point = 10 mm, was used for the illumination of the entire X × Y plane of the object, while the signal was detected by a transmission detector located in the X × Y plane with coordinates = 0 mm.
2.1.2. General Optical Properties of Media
The absorption, scattering, and anisotropy factor coefficients of the vessel, shown as for simplicity, were modeled by the optical properties of venous blood, neglecting the parameters of vessel walls. The blood absorption coefficient was selected based on the total hemoglobin concentration and the blood oxygen saturation parameter , as the sum of the absorption coefficients of oxy- and deoxyhemoglobin, according to Equation (1):
where and are the molar extinction coefficients of oxy- and deoxyhemoglobin at a given absorption wavelength, which was taken from [31]. To reduce the number of variable parameters, the saturation coefficient was fixed at = 0.7, which corresponds to the average level of oxygen saturation of venous blood [32]. The scattering coefficient and scattering anisotropy factor were chosen according to the Mie/Perkus–Yevick model [33], based on the hematocrit level Hct, which, in turn, was calculated as the ratio of the hemoglobin concentration in the blood to the hemoglobin concentration in the erythrocyte: assuming that the hemoglobin concentration in the erythrocyte is = 333.3 g/L. The scattering anisotropy coefficient for blood at a wavelength of 850 nm was chosen to be = 0.981.
The absorption coefficients of layers 1 and 2, modeling the epidermis and internal tissues, were selected, based on the extinction coefficients and volume concentrations of the main tissue chromophores, as:
where are the volume fractions of blood, water, fat, and melanin in the layer, and are the absorption values of pure substances with a unit volume fraction, using values taken from [31] for water and fats from [34] for melanin.
The scattering coefficient of the epidermis and internal tissues was chosen according to the approach employed in [34] (Equation (3)):
where is the fraction of Rayleigh scattering in the total scattering of tissues, is the value of the scattering coefficient at 500 nm, and is a parameter that controls the dependence of the Mie scattering value on the wavelength λ. The values of these parameters for the layer simulating the epidermis were equal to = 0.29, = 667 cm−1, = 0.689 [35], and the anisotropy coefficient = 0.9, which yielded the scattering coefficient (850) = 351.7 cm−1. Regarding internal tissues, for simplicity, the values of the scattering parameters were chosen that corresponded to the dermis and were equal to = 0.41, = 436 cm−1, = 0.562, which yielded the scattering coefficient (850) = 220.6 cm−1; the anisotropy coefficient was also equal to = 0.9. For simplicity, all media had a matching refractive index of .
The values of the volume fractions of each of the chromophores and the final values of the absorption and scattering coefficients chosen for the different numerical experiments are indicated below in Section 2.1.3, Section 2.1.4 and Section 2.1.5.
2.1.3. Experiments for Assessment of the Influence of Vessel Thickness and Blood Hb Level on the Vessel Contrast
In the first experiment, we assessed the influence of only two parameters on the observed changes in diffuse transmittance: hemoglobin concentration in the blood and vessel radius. For this purpose, the vessel was located at a depth below the surface = 0.1 mm. The radius of the vessel varied in the range from 0.5 to 3.05 mm, with a step of 0.15 mm. The hemoglobin concentration in the vessel varied from 60 to 160 g/L with a 10 g/L step, leading to a change in absorption in the vessel at a wavelength of 850 nm from ~0.78 to 2.25 cm−1 and a variation in the blood scattering coefficient from ~540 to ~760 cm−1. The contents of blood, water, lipids, and melanin in the epidermis were set to be equal to = 0, = 0.5, = 0, = 0; regarding the internal areas of tissues, for simplicity, data for the dermis were used— = 0.002 (i.e., 0.2%), = 0.65, = 0, = 0 [34].
2.1.4. Assessment of the Influence of Different Vessel Depths on the Error of Hb Level Prediction
To assess the influence of vessel depth on the error of Hb level estimation, we simulated situations when the hemoglobin concentration in the vessel, the size of the vessel, and the distance from the vessel to the tissue surface dsurface were varied. Variations in the hemoglobin concentration in the blood vessel and the radii of the vessels, as well as the parameters of the volume fractions of the main tissue chromophores were chosen, similar to Section 2.1.3. The distance from the vessel to the surface dsurface varied in the range from 0.1 to 2.1 mm, with a step of 0.1 mm.
2.1.5. Assessment of the Influence of the Scattering Coefficient, Blood Content in the Dermis and Melanin in the Epidermis on the Error of Hb Level Prediction
To assess the influence of various optical parameters of surrounding tissues on the accuracy of blood Hb level prediction, the following experiments were performed. In the simulations, both blood Hb concentration and the radii of the vessels varied, as described in Section 2.1.3, along with one of the following optical parameters: the scattering coefficient of layer 2, blood volume fraction in layer 2, and the melanin content in layer 1. The simulation was carried out for two distances between the vessel and the surface—dsurface = 0.1 mm and dsurface = 1.0 mm. In experiments with changing the scattering coefficient surrounding the vessel, the scattering coefficient was varied from 165 cm−1 to 275 cm−1, with a step of ~6 cm−1, i.e., the scattering coefficient varied in the range of ±25% from the average value of the scattering coefficient of the second layer = 220 cm−1.
The blood volume content varied in the range from 0.1 to 0.3% in increments of 0.02%, modeling the biological variation of vascularization of tissues by ±50% from the average blood content, which, when taking into account changes in the concentration of hemoglobin in the blood, led to a change in the absorption coefficient of the second layer from 0.025 to 0.035 cm−1.
In the experiment with changing the melanin volume fraction, the parameter was changed in the range from 0 to 5% in steps of 0.5%, leading to a change in the absorption coefficient of the first layer from ~0.02 cm−1 to ~5.3 cm−1.
2.2. Data Analysis and Machine Learning Model Evaluation on Monte-Carlo Simulation Data
Data obtained for different Monte Carlo light transport modeling experiments were used to train and evaluate machine-learning-based models for predicting Hb levels from optical parameters.
To extract optical features from the detected intensity, as a first step, the intensity of the detected light that was diffusely transmitted through the medium at each detector pixel, with coordinates was used to obtain a one-dimensional profile along the x-axis by averaging along the y-axis: . The resulting intensity profile was used to calculate predictors characterizing the vessel width , estimated as the full width at the half-minimum of the intensity profile (Figure 1b), and the difference in the intensities of light transmitted through the vessel and the surrounding tissue (Equation (4)):
where , .
To predict the Hb level, we used linear regression with L1 and L2 regularization for Hb level prediction. Prior to the model fitting, the training data were normalized and additional polynomial features (with a degree not exceeding 3) were calculated from the initial features, and .
Tuning of the model hyperparameters (the degree of the polynomial features and the parameters of the regularization terms) was carried out using a grid search with a 5-fold cross-validation. Additionally, before training, part of the data (~30% of the original sample) was selected as a test set. The test set was used to ensure a lack of overfitting of the models at the hyperparameter selection stage.
To assess the influence of different parameters (vessel depth, scattering coefficient, blood content in the dermis, and melanin fraction) on the Hb prediction error, separate models were trained and evaluated for each dataset described in Section 2.1.3, Section 2.1.4 and Section 2.1.5.
2.3. Volunteers
The proposed method was evaluated experimentally on volunteers undergoing examinations in the admission department of City Clinical Hospital № 67 (Moscow, Russia). Diffuse light transmittance of the veins was measured for 9 volunteers (3 male and 6 female) with a mean age of 31 ± 13 y.o. For all patients, blood Hb levels were determined using an invasive reference technique according to standard clinical protocols. Venous blood collected from the antecubital vein using the Vacutainer was characterized using CBC analysis in a certified clinical diagnostic laboratory. The measurements were performed 10–15 min after collecting optical data, and furthermore, were used as a ground truth for Hb level prediction. Data for patients involved in the study comprised gender, age, and hemoglobin level, assessed invasively using a reference method; a non-invasive optical method is presented in Table S1 in the Supplementary Materials. The studies were approved by the Moscow City Ethics Committee, in accordance with the standards of the operating procedures (protocol No. 68 from 4 July 2022).
2.4. Experimental Setup
A special experimental setup was developed to map the diffuse transmission of light by hand tissues in the near-IR range. The experimental setup consisted of the light source on which the patient’s palm was placed, with a NIR-enhanced camera located above the source to detect light passing through the area of the hand located above the light source.
The light source consisted of several LEDs with a central emission wavelength of 850 nm (FWHM~20 nm), having a total radiation power of no more than 100 mW, and an additional diffuser made of ground glass to homogenize the radiation at the output of the radiation source. Diffuse map imaging was carried out using a CS135MUN NIR-enhanced camera (Thorlabs, Newton, NJ, USA) with a high aperture objective MVL5M23 (Thorlabs, USA), located ~35 cm from the source. The experimental setup was placed in a light-proof box made of aluminum composite material with a size of ~30 cm × 40 cm × 22 cm and a rectangular hole of ~13 × 18 cm so that the patient could place their hand inside.
2.5. Analysis of Experimental Data
2.5.1. Feature Extraction from Images
Diffuse reflectance maps of the hand were analyzed as follows. Using ImageJ, clearly visible areas of veins were identified on diffuse transmittance maps (about 20–30 different areas), after which an intensity profile in a direction perpendicular to the venous bed was extracted, with averaging in the region of 10 pixels using the “Intensity Profile” utility.
Next, to eliminate the influence of inhomogeneities in intensity changes on the different sides of the vessel, a baseline correction procedure was applied to the obtained data using the AirPLS method [36], with the parameter = 10. Next, the position of the minimum in the extracted intensity profile was determined. The intensity value at the minimum point was taken as a value corresponding to , and the intensity value of the baseline in the same location was taken as an estimate of the . These values were used to calculate the according to Equation (4). The baseline-corrected intensity profile was used to estimate the parameter as the full width at a half-minimum of the profile.
2.5.2. Blood Hb Level Prediction for Experimental Data
Based on the and values estimated from the experimentally obtained profiles, we predicted the Hb level for each of the profiles using a model trained on the Monte Carlo data from Section 2.1.4. Predictions obtained for the different profiles for one patient were then averaged to obtain the final predictions of Hb level; these were used to assess the quality of the method.
All analyses were carried out using custom scripts written in Python 3, using the Numpy, Matplotlib, Pandas, and Scipy libraries.
3. Results
To assess the feasibility of blood Hb level estimation based on the differences in light transmission through large blood vessels and adjacent tissues, a Monte Carlo light transport modeling system was used. The object used for simulation (Figure 1a) consisted of two layers representing the dermis and inner tissues (with a thickness of 9.9 mm) and epidermis (with a thickness of 0.1 mm), with a cylindrical vessel placed at a certain depth and exhibiting optical properties that are characteristic of venous blood. A uniform collimated source was used for illumination, and light detection was performed on the opposite side of the object, thus simulating the detection of light being transmitted through the tissue (Figure 1a). The simulation was carried out for the optical characteristics of tissues at a wavelength of 850 nm—on the one hand, this wavelength falls within the transparency window of biological tissues, and on the other hand, oxy- and deoxy- Hb have sufficient absorption in this spectral range, allowing for sufficient contrast between the blood vessels and adjacent tissues. More details on the modeling conditions are described in the Materials and Methods, Section 2.1.
An example of a simulated light flux and the profile of the intensity detected along the coordinate X (the transverse of the vessel) is presented in Figure 1b for a vessel with r = 2 mm and [Hb] = 150 g/L. As can be seen, there is indeed a decrease in intensity in the region where the vessel is located (Figure 1b). Since the propagation of light in tissues can be approximately described in terms of the modified Bouguer–Lambert–Beer law [37], it can be assumed that the light intensity at the center position of the vessel and the width of the intensity profile will depend on both the size of the blood vessel and the concentration of hemoglobin in it.
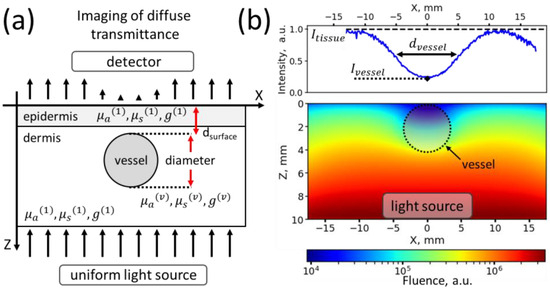
Figure 1.
(a) Schematic representation of the X-Z plane of the modeled object in which a Monte Carlo simulation of light transport was performed. Red arrows denote the distance to the skin surface and the diameter of the vessel, black arrows schematically denote the change in light intensity along the X coordinate. (b) Average fluence in the X-Z plane obtained for the media with a vessel with a radius of 2 mm and a hemoglobin concentration of 150 g/L. The intensity profile along the X coordinate, detected in transmission mode, is indicated at the top.

As a next step, we assessed whether significant changes were observed in the intensity of light passing through a vessel and adjacent tissues upon variations of blood Hb level in the vessel and vessel radius while keeping other modeling parameters constant (Materials and Methods, Section 2.1.3). Figure 2a,b shows examples of intensity maps captured by the transmission detector in the case of a change in the Hb level at a fixed vessel width (Figure 2a, vessel radius 1 mm), and in the case of different vessel radii, at a fixed Hb level (Figure 2b, Hb level 150 g/L). We established that with both an increase in blood Hb level (Figure 2c) and an increase in the vessel radius (Figure 2d), an increase in contrast values was observed from ~0.1 to ~0.6, where the represents the difference in the light intensity, passed through the vessel and the surrounding tissues . Additionally, within the simulated range (with hemoglobin concentrations from 60 to 160 g/L and vessel radii from 0.5 to 3.0 mm), the dependences of the contrast on Hb level and vessel radius were close to linear (see insets in Figure 2c,d).
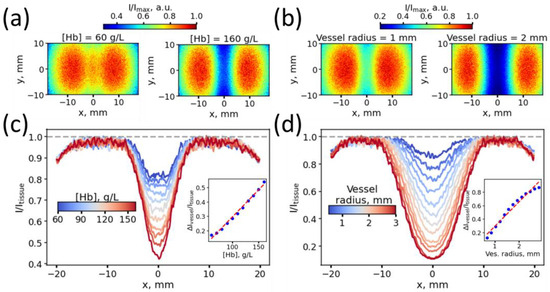
Figure 2.
(a,b) Intensity maps in the X-Y plane, captured by the transmission detector for the case of varying blood Hb levels at a fixed vessel radius of 1 mm (a) and in the case of different vessel radii at a fixed Hb level of 150 g/L (b). (c,d) Intensity profiles along the x-axis in the case of blood vessels with varying Hb levels for a vessel with a radius of 1 mm (c) and in the case of blood vessels with a varying radius (d). The insets in panels (c,d) show the dependency of the light contrast on the blood Hb level and vessel radius.
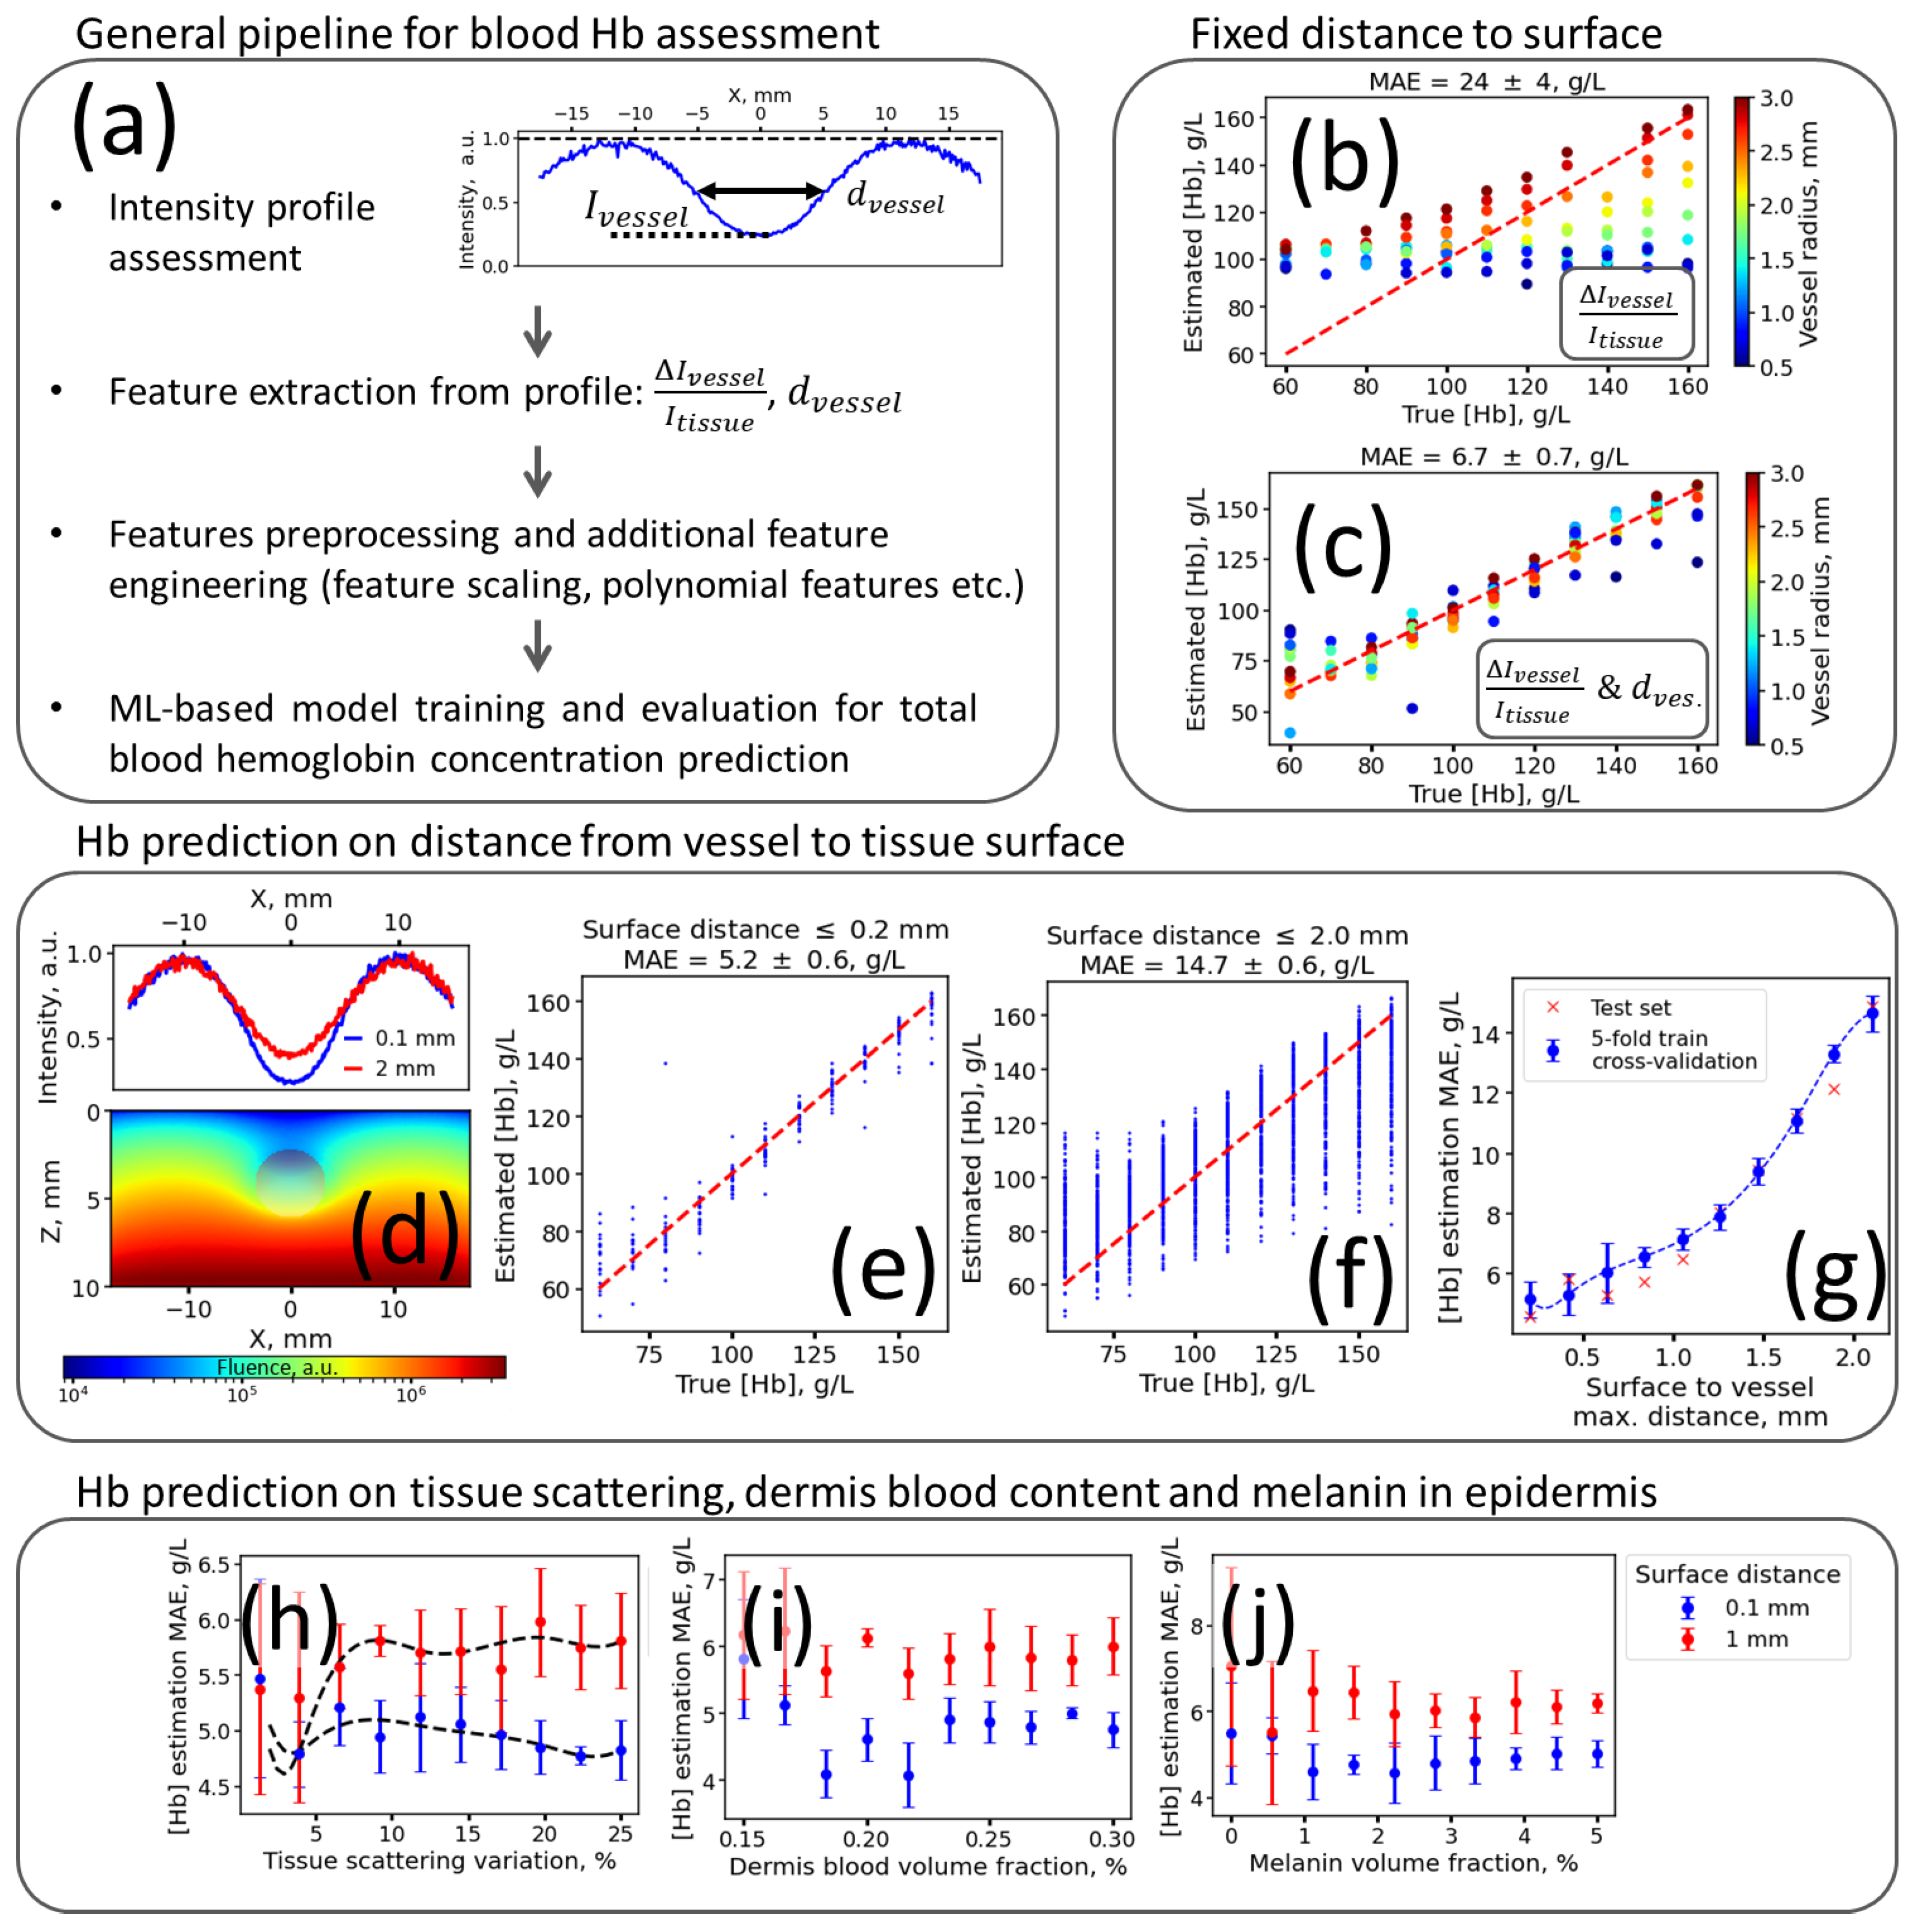
Using the values of the contrast and the blood vessel radius estimated from the intensity profile, one can build models estimating the blood Hb level, including the following steps (Figure 3a): (1) from the diffuse imaging data, the intensity profile transverse to the blood vessel is estimated; (2) utilizing the intensity profile, the contrast and the vessel diameter are estimated and (3) used as an input features to predict blood Hb level. These features can be first scaled, and then transformed, or additional features responsible for feature interaction can be calculated and used in the predictive model training.

Figure 3.
(a) The main steps of the proposed method for optical blood Hb level assessment. (b,c) Scattering diagrams of predicted vs. true blood Hb levels for models trained using feature (b) and both and features (c) for data obtained for vessels located at the fixed distance to the tissue surface ( = 0.1 mm). (d) An example of the light fluence distribution in the X-Z plane for a vessel with a radius of 2 mm, located at a distance of 2 mm from the surface (bottom panel), and an example of transmitted radiation intensity profiles along the X coordinate in the case of a vessel located at a distance of 0.1 mm (blue line) from the surface and one at 2 mm (red line, top panel). (e,f) Scattering diagrams of the predicted vs. true blood Hb levels for models trained and evaluated on the data for vessels located at a surface depth not exceeding 0.2 mm I and 2.0 mm (f). (g) Dependence of the mean absolute error of Hb level prediction on the maximum vessel depth. (h–j) Dependence of the mean absolute error of Hb level prediction on the relative variation of the scattering coefficient of the dermis (h), the blood volume fraction in the dermis (i), and the volume fraction of melanin in the epidermis (j). Dashed red lines in panels (b,c,e,f) correspond to lines with unity of slope and zero intercept.
We employed a dual-feature approach to evaluate the impact of incorporating both contrast and the apparent vessel width in predicting blood Hb levels. Initially, we constructed a basic linear regression model using only the contrast feature and compared its performance to a model that utilized both and . Our findings revealed that when predicting Hb levels within the 60–160 g/L range, the mean absolute error (MAE) when using only as the feature was 24 ± 4 g/L (Figure 3b). However, upon incorporating both and , we achieved a significantly reduced MAE of 6.7 ± 0.7 g/L (Figure 3c), indicating the enhanced predictive accuracy that was gained from the inclusion of vessel diameter as a feature in our model.
The obtained data provided a preliminary estimate of the lower limit for determining Hb levels using the proposed features and method. However, in biological tissues, numerous parameters can vary, potentially increasing the prediction error. Therefore, we sought to identify the main sources of errors that could affect the determination of blood Hb levels using the proposed method. We have identified the following sources of biological variation that could potentially influence the detected optical response. Different veins may be located at different depths from the skin surface, and adjacent tissues may differ in their absorption and scattering parameters, due to the different collagen contents, different blood contents in tissues, or, for example, due to different melanin contents in the upper layers of the skin. Using additional numerical experiments, we assessed the impact of these factors on the final accuracy of determining blood Hb levels.
First of all, we assessed how the depth of the vessels in the tissues influenced the accuracy of Hb level determination. To achieve this, in addition to varying the thickness of the vessel and the concentration of hemoglobin in it, we varied the distance from the vessel to the tissue surface in the range from 0.1 mm (i.e., the vessel was located on the border with the epidermis) to 2.1 mm (the vessel was located deep in the dermis) with a step of 0.2 mm. As can be seen, with increasing distance from the surface to the vessel (Figure 3d), the ratio decreases, so it can be expected that this parameter will significantly affect the determination of hemoglobin content in the blood. Indeed, when assessing the accuracy of the predictive model on data obtained only for the near-surface vessels located at a distance of up to 0.2 mm, we found the blood Hb level MAE equal to 5.2 ± 0.6 g/L; at the same time, upon variation of the vessel depth from 0.1 to 2.1 mm, the MAE of the blood Hb level estimation using the evaluated approach increased up to 14.7 ± 0.6 g/L (Figure 3f). The dependence of the MAE in determining the hemoglobin level with the increasing maximum depth of the vessel is presented in Figure 3g—as can be seen, the Hb assessment MAE increases with the depth of the vessel, does not exceed 10 g/L for depths below 1 mm, and begins to increase rapidly at depths over 1 mm.
Surprisingly, changes in parameters other than depth had less impact on the uncertainty of Hb assessment. We estimated the impact on the accuracy of Hb level prediction by variations in scattering (Figure 3h), the volume fraction of the blood in the dermis (Figure 3i), and melanin in the epidermis (Figure 3j) for those cases when the vessels were in the near-surface layer, at a depth of 0.2 mm, and located deeper in the dermis—at a depth of 1 mm. With an increase in the variation of the scattering coefficient from the average value = 220 cm−1, in the case of a vessel lying near the surface, we observed practically no change in error when predicting the hemoglobin level (shown by the blue dots in Figure 3h), while in the case of vessels located at a depth of 1 mm, we observed a slight increase in the prediction error from 5.4 to 6 g/L, with an increase in the variation of the scattering coefficient from 0 to 25% of the average value (shown by the red dots in Figure 3h).
Furthermore, we assessed the dependence of the error in determining hemoglobin on the volume content of blood in the dermis and melanin in the epidermis in a similar way: we gradually changed the volume fraction of the chromophore from a certain minimum level to a maximum level and monitored how the prediction error changed as the range of variation of this parameter increased. We ascertained that the MAE levels in Hb level prediction were practically independent of the variation of blood volume fraction in the 1.0–3.0% range (Figure 3i, such changes approximately correspond to a ~50% variation in the blood volume fraction in the skin from the mean value). The Hb prediction of MAE was also minimally dependent on the volume fraction of the melanin in the epidermis from 0 to 5% (Figure 3j).
Thus, the most significant factor was the depth of the vessel in the tissues—at depths varying in the range of several millimeters, one can expect an error in hemoglobin prediction at the level of 15–20 g/L, while other factors had little influence on errors in determining hemoglobin in the blood.
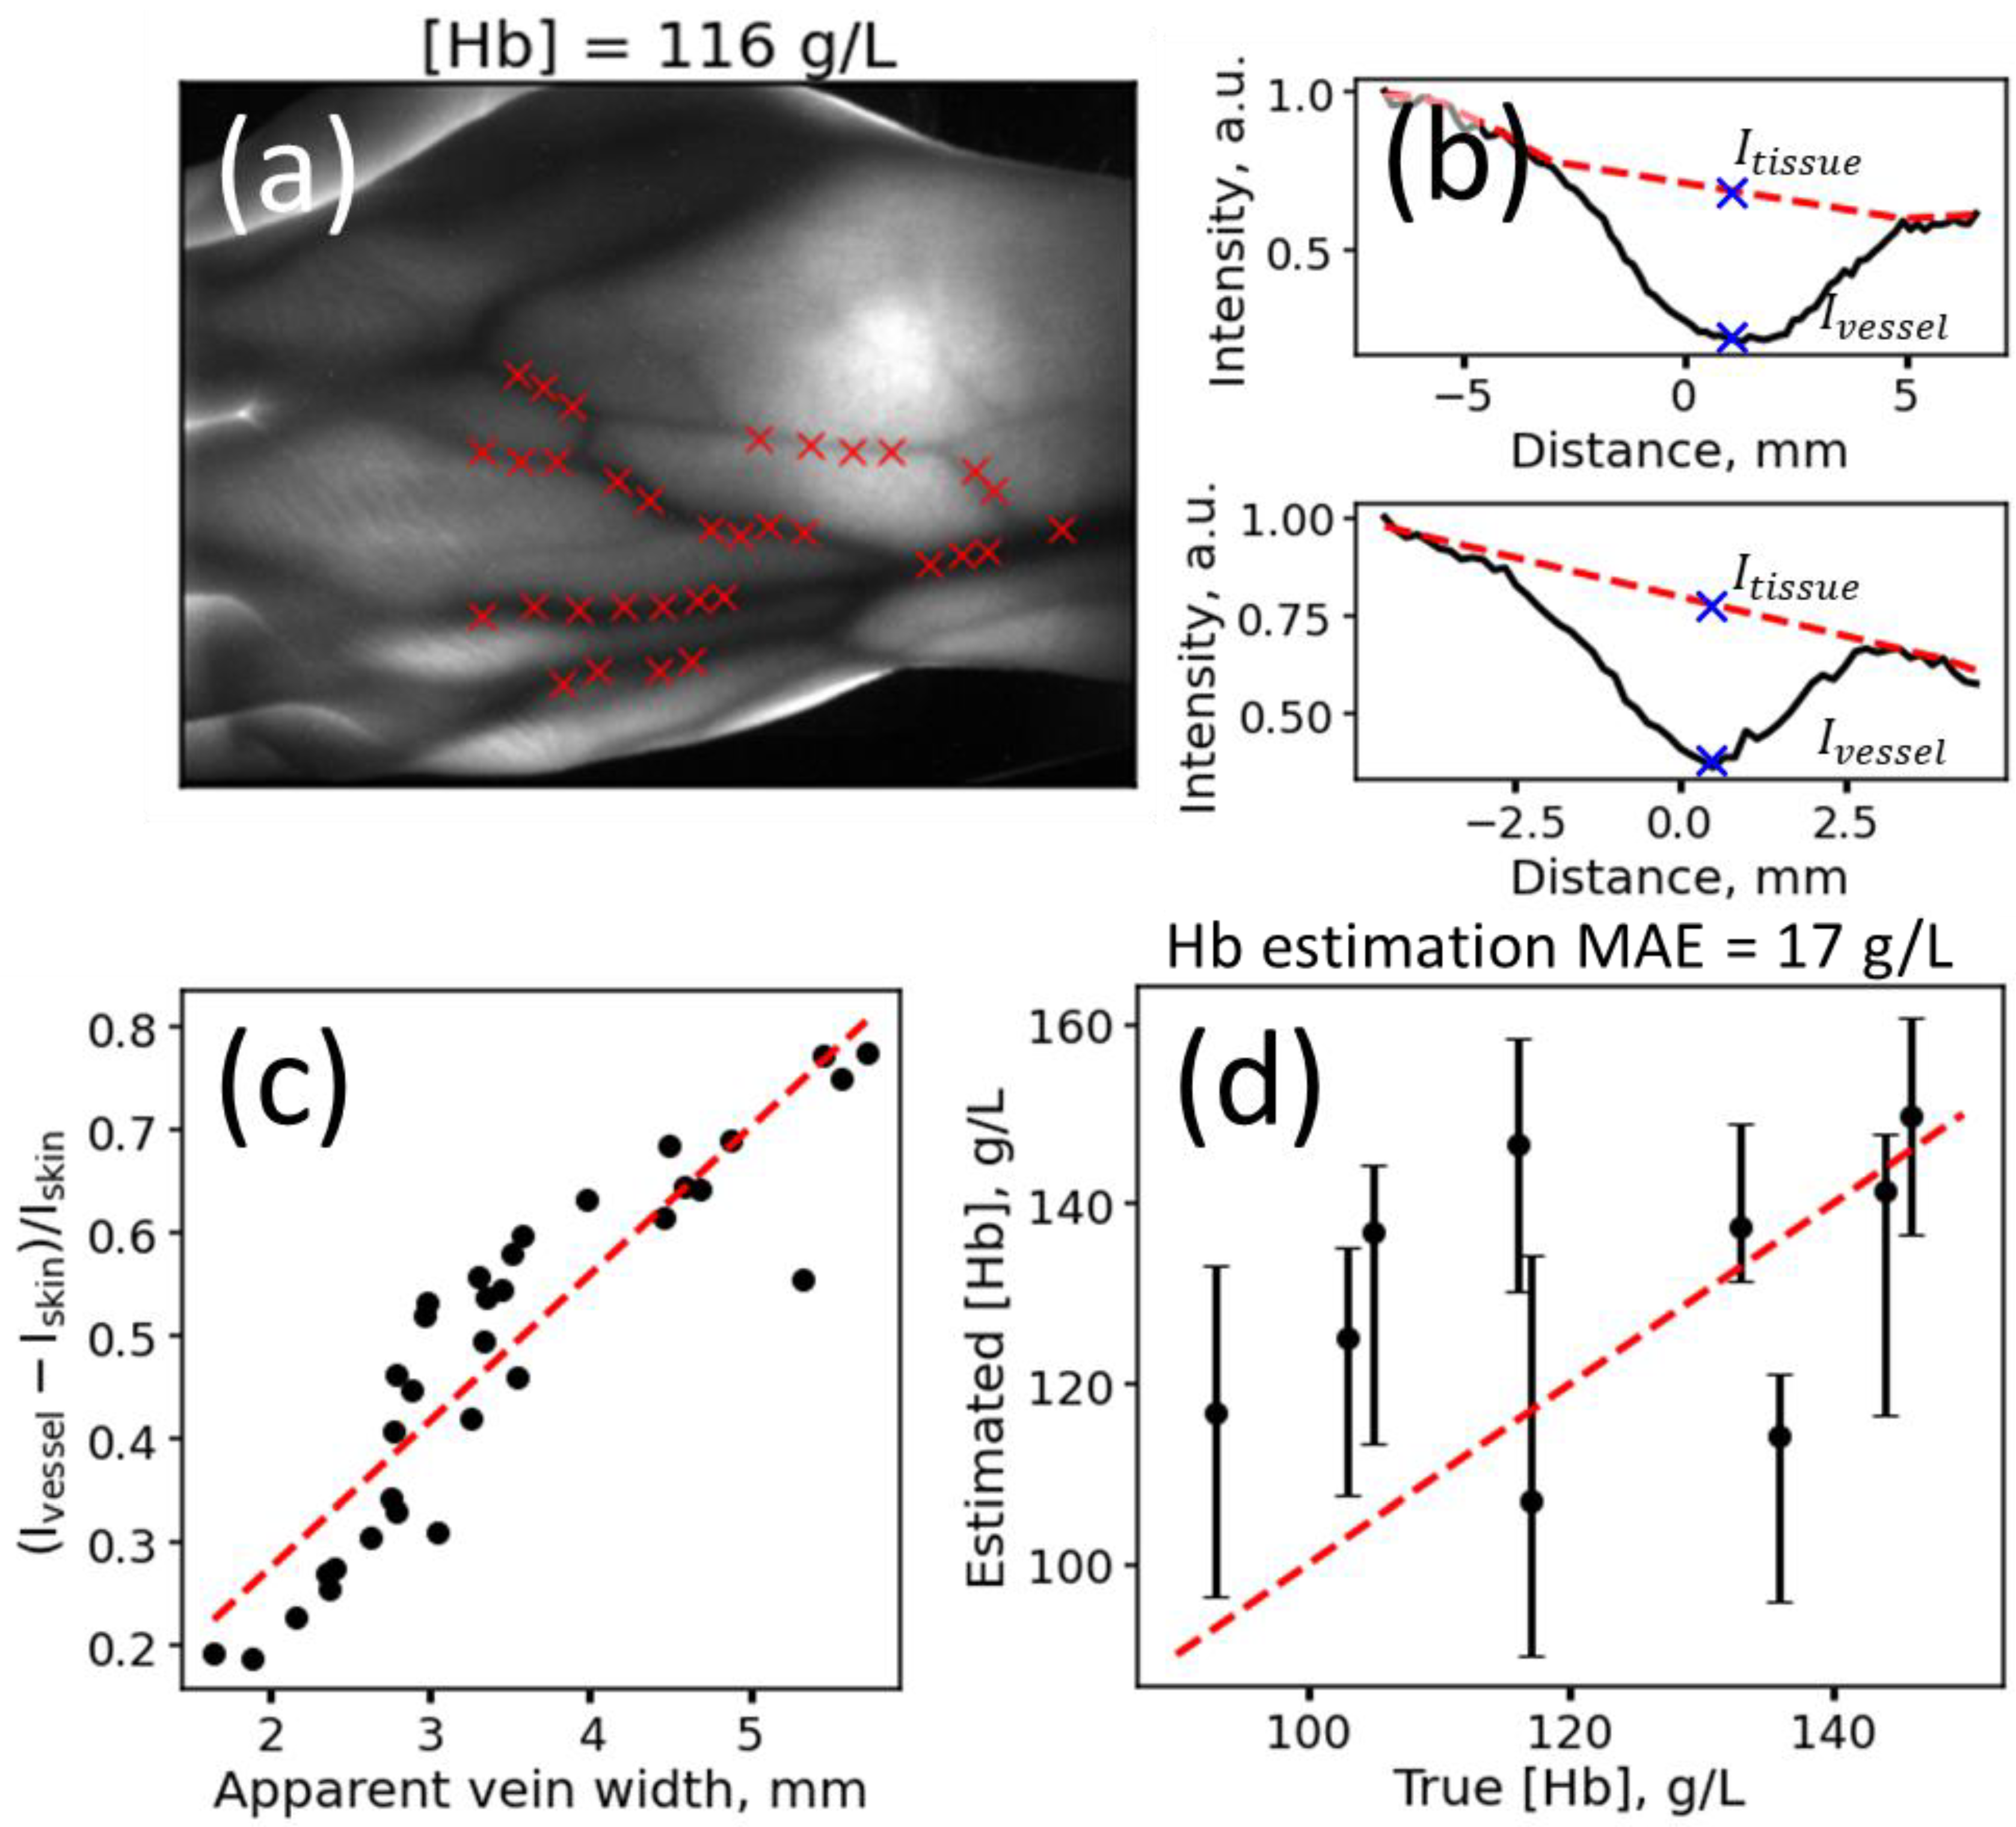
Finally, to verify the concept, we implemented the proposed method experimentally and measured the diffuse transmittance maps of the hands of several patients with different blood Hb levels, which were determined independently using invasive venous blood sampling. We used a LED light source with a central emission wavelength of 850 nm, emitting no more than 100 mW of intensity, located on one side of the palm, and measured the diffuse transmittance maps of the hand using a near-IR-enhanced sensitivity camera (Materials and Methods, Section 2.4). An example of the detected diffuse transmittance through palms is presented in Figure 4a. Regarding veins that were clearly visible in the tissue area (marked by red crosses in Figure 4a), we assessed the profiles of intensity changes in a direction transverse to the venous bed. Representative intensity profiles are shown in Figure 4b. Since the tissues did not look uniform in the real image, we additionally applied a background subtraction procedure, based on the AirPLS method [36], and estimated the values of and only after the described baseline correction (however, other baseline correction procedures, e.g., linear interpolation, can also be used).
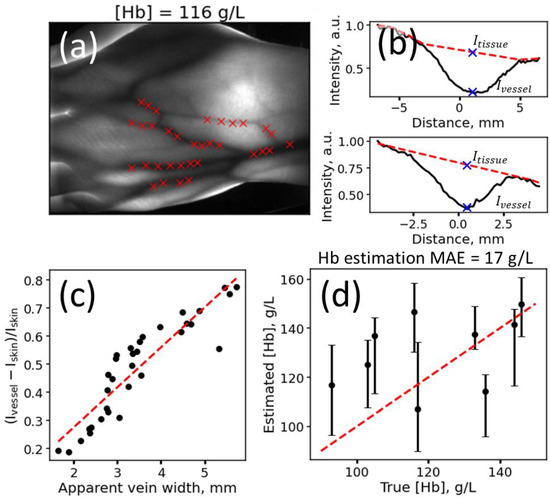
Figure 4.
(a) An example of a diffuse transmittance map for a region of the arm obtained at 850 nm for a volunteer with a total blood Hb concentration of 116 g/L. Red crosses indicate the positions of the profiles used to determine the Hb concentration. (b) Examples of experimental intensity profiles in a direction transverse to the vessel. The red lines denote the baseline, which takes into account the heterogeneity of background illumination obtained using the AirPLS method. Blue crosses indicate the values of the intensities and used for Hb prediction. (c) Dependence of the intensity contrast on the estimated vessel width for the image demonstrated in panel (a). (d) Scatterplot of the predicted vs. true Hb levels obtained for patients using the experimental implementation of the method. The red dotted line shows the line with zero intercept and unity of slope.
Similar to the modeling results (Figure 2d), we first verified that, indeed, the intensity contrast increases with increasing vein width, as estimated from the profile (Figure 4c); furthermore, using the estimated vessel widths and the contrast values , we predicted the hemoglobin content in tissues for patients and compared it to the reference values that were obtained invasively (Figure 4d). To estimate the Hb level, we used the following procedure: diffuse transmittance was measured for the palm of each patient, then multiple intensity profiles were extracted from the image, and the values of and were calculated. The obtained values from each profile were then used for prediction, using a model trained on Monte Carlo simulation data. The Hb level predicted for the different intensity profiles obtained for the same image was averaged and used as a final prediction. Figure 4d presents the median values and interquartile range values of the predictions for 9 patients with reference Hb levels varying from 90 to 150 g/L. The median values of non-invasively predicted Hb levels are also presented in Table S1 in the Supplementary Materials. The Hb level prediction MAE was 17 g/L, which is comparable to the error obtained when the thickness, hemoglobin concentration, and depth of the vessel were simultaneously varied in a range of up to 2 mm.
We compared the absolute residuals between invasive and non-invasive Hb assessment techniques, stratified by sex and age. Our findings revealed no statistically significant differences in Hb prediction error among patients when separated by gender (unpaired t-test, p > 0.05) and no correlations between Hb prediction error and patient age, assessed using both Pearson and Spearman criteria, were observed (p > 0.05). This outcome suggests that the developed method is not substantially affected by physiological parameters such as a patient’s gender and age, although some differences may be observed with a larger sample size.
4. Discussion
The non-invasive determination of biochemical blood parameters, in particular hemoglobin, is in high demand for both clinical and point-of-care diagnostics. Being a convenient target for optics, determining the Hb level in the blood is often proposed as an assessment to be carried out using methods based on assessing the attenuation of light by hemoglobin in tissue areas where Hb is a dominant chromophore, for instance in fingernails [13,14,15] or the conjunctiva [5,6,7,8,9], or by using time resolution to directly measure the light attenuation by the blood using photoplethysmography [2,3,4].
In contrast to these methods, we assessed the possibility of determining hemoglobin concentration “directly” via utilizing relative light attenuation by vessels and the thickness of the vessels, , which were estimated from the obtained images. Through a Monte Carlo simulation of light transport in tissue, we obtained a lower bound estimate of the error for this method, using simple linear regression as a predictive model. Under ideal conditions, a model trained with and values was able to reach the Hb level prediction MAE at the level of 5–6 g/L. However, the Hb prediction error significantly increased, up to 15 g/L in the case of different depths of veins (in our experiments, we varied the depths from 0.1 to 2.1 mm, as in Figure 3e–g). The increase in error could be explained by both the variation of the contrast (Figure 3d) with vessel depth and changes in the apparent vessel width, due to diffuse light propagation through tissues. At the same time, we observed the Hb prediction error to be stable to variations in scattering, the volume fraction of blood, or the volume fraction of melanin in tissues (Figure 3h–j). Presumably, with an increase in melanin to higher levels corresponding to Fitzpatrick skin types III or IV, the influence of melanin will be more pronounced. Potentially, if the depth of the veins in the tissue is known, for example, when estimated using spatial frequency domain imaging [38,39] or other techniques with depth resolution [40], the error of the method could be reduced.
In practice, the error seen in determining hemoglobin in this way may encounter additional problems associated with inhomogeneities in different tissue areas, the absence of superficial veins in humans, more significant changes in the optical density of tissues, and changes in blood oxygenation in the veins, which can increase the error in hemoglobin prediction. Using a model trained on Monte Carlo simulation data from patients with varying levels of hemoglobin in the blood, we observed that the error in hemoglobin estimation was 17 g/L (1.7 g/dL), which is close to the estimate we obtained from the simulation. In a study conducted by [28], a similar non-invasive technique for assessing hemoglobin (Hb) levels was evaluated. The authors utilized an approach that estimated light transmission through blood vessels in the finger to assess blood Hb levels. While it is unclear whether this method incorporated both contrast and vein width measurements to determine Hb levels, the authors obtained promising results from a sample of 309 patients. Specifically, they found a correlation coefficient of r = 0.591 between non-invasive Hb levels and reference values. Considering the variability in reference blood Hb values, this correlation coefficient corresponds to a root mean squared error in Hb prediction of ~18 g/L, which is comparable to our results.
Thus, this method, although based directly on the assessment of light absorption by hemoglobin in blood vessels, has errors similar to those for other methods, putting the method on par with other optical non-invasive methods for predicting hemoglobin. It is likely that the biological variability of the optical and geometric parameters of tissues provides a certain fundamental limit on the error in determining the level of hemoglobin in tissues, and other approaches that do not depend on biological variability, for example, directly determining the absorption of light by hemoglobin in a vessel and cutting off the optical response from tissues, will have higher accuracy when determining blood hemoglobin level.
5. Conclusions
In this work, using a Monte Carlo simulation and experimental validation, we assessed the possibility of determining total blood Hb concentration by using light attenuation by vessels and adjacent tissues in the near-IR range via transmission illumination geometry. We showed that although, in an ideal case, the mean absolute error of Hb could be as low as 5–6 g/L, due to a significant variation in physiological parameters—primarily a variation in the depth of the vessel—the error of Hb level prediction would be at least 15 g/L in the case of vessel depths varying from 0.1 to 2.0 mm from the skin surface and Hb levels varying from 60 to 160 g/L. We assessed the applicability of this method experimentally, detecting and analyzing diffusely transmitted light through volunteers’ palms, and found the experimental Hb level prediction error to be equal to 17 g/L (1.7 g/dL), putting it on par with other optical non-invasive methods for predicting hemoglobin. It is likely that the biological variability of tissue parameters imposes a fundamental limit on the accuracy of optical Hb level assessment when using simple techniques that assess the Hb content via light attenuation by different tissue regions. Possibly, approaches that directly determine the light absorption by hemoglobin in a vessel, without interference from the surrounding tissues, may offer lower errors in the context of non-invasive Hb level assessment.
Supplementary Materials
The following supporting information can be downloaded at: https://www.mdpi.com/2304-6732/11/1/49/s1, Table S1: Summary table for patients involved in study by gender, age, and hemoglobin level assessed invasively using a reference method and using a non-invasive optical method.
Author Contributions
Conceptualization, B.Y., A.S. and A.K.; methodology, B.Y. and A.S.; software, I.B. and V.P. (Vladimir Petrov); validation, G.D., P.S. (Petr Shatalov) and P.S. (Petr Shegai); formal analysis, A.A.; investigation, I.B., G.D., D.K., V.P. (Vladimir Panov) and B.Y.; resources, A.S.; data curation, V.P. (Vladimir Petrov), V.P. (Vladimir Panov) and V.K.; writing—original draft preparation, I.B. and B.Y.; writing—review and editing I.B., B.Y. and G.D.; visualization, I.B. and A.R.; project administration, A.A.; funding acquisition, A.S. All authors have read and agreed to the published version of the manuscript.
Funding
This study was funded by grant No 2212-19/22, experimental part, from the Moscow Government. The publication of this manuscript was sponsored by the Moscow Center for Innovative Technologies in Healthcare. The work on numerical modeling was performed with the support of the MSU Program of Development, Project No. 23A-SCH06-04.
Institutional Review Board Statement
The studies were approved by the Moscow City Ethics Committee, in accordance with the standards of operating procedures (protocol No. 68 of 4 July 2022).
Informed Consent Statement
Informed consent was obtained from all subjects involved in the study.
Data Availability Statement
The data presented in this study are available on request from the corresponding author.
Acknowledgments
This study was sponsored by the Moscow Center for Innovative Technologies in Healthcare. Research was performed according to Academic Leadership Program Priority 2030, proposed by the Federal State Autonomous Educational Institution of Higher Education I.M. Sechenov First Moscow State Medical University of the Ministry of Health of the Russian Federation (Sechenov University).
Conflicts of Interest
The authors declare no conflicts of interest.
Correction Statement
This article has been republished with a minor correction to the Funding statement. This change does not affect the scientific content of the article.
References
- Karakochuk, C.D.; Hess, S.Y.; Moorthy, D.; Namaste, S.; Parker, M.E.; Rappaport, A.I.; Wegmüller, R.; Dary, O.; The HEmoglobin MEasurement (HEME) Working Group. Measurement and Interpretation of Hemoglobin Concentration in Clinical and Field Settings: A Narrative Review. Ann. N. Y. Acad. Sci. 2019, 1450, 126–146. [Google Scholar] [CrossRef] [PubMed]
- Causey, M.W.; Miller, S.; Foster, A.; Beekley, A.; Zenger, D.; Martin, M. Validation of Noninvasive Hemoglobin Measurements Using the Masimo Radical-7 SpHb Station. Am. J. Surg. 2011, 201, 592–598. [Google Scholar] [CrossRef] [PubMed]
- Lychagov, V.V.; Semenov, V.M.; Volkova, E.K.; Chernakov, D.I.; Ahn, J.; Kim, J.Y. Noninvasive Hemoglobin Measurements With Photoplethysmography in Wrist. IEEE Access 2023, 11, 79636–79647. [Google Scholar] [CrossRef]
- Baulig, W.; Seifert, B.; Spahn, D.R.; Theusinger, O.M. Accuracy of Non-Invasive Continuous Total Hemoglobin Measurement by Pulse CO-Oximetry in Severe Traumatized and Surgical Bleeding Patients. J. Clin. Monit. Comput. 2017, 31, 177–185. [Google Scholar] [CrossRef] [PubMed]
- Suner, S.; Rayner, J.; Ozturan, I.U.; Hogan, G.; Meehan, C.P.; Chambers, A.B.; Baird, J.; Jay, G.D. Prediction of Anemia and Estimation of Hemoglobin Concentration Using a Smartphone Camera. PLoS ONE 2021, 16, e0253495. [Google Scholar] [CrossRef] [PubMed]
- Appiahene, P.; Chaturvedi, K.; Asare, J.W.; Donkoh, E.T.; Prasad, M. CP-AnemiC: A Conjunctival Pallor Dataset and Benchmark for Anemia Detection in Children. Med. Nov. Technol. Devices 2023, 18, 100244. [Google Scholar] [CrossRef]
- Chen, Y.; Zhong, K.; Zhu, Y.; Sun, Q. Two-Stage Hemoglobin Prediction Based on Prior Causality. Front. Public Health 2022, 10, 1079389. [Google Scholar] [CrossRef] [PubMed]
- Dimauro, G.; Baldari, L.; Caivano, D.; Colucci, G.; Girardi, F. Automatic Segmentation of Relevant Sections of the Conjunctiva for Non-Invasive Anemia Detection. In Proceedings of the 2018 3rd International Conference on Smart and Sustainable Technologies (SpliTech), Split, Croatia, 26–29 June 2018; pp. 1–5. [Google Scholar]
- Dimauro, G.; Camporeale, M.G.; Dipalma, A.; Guarini, A.; Maglietta, R. Anaemia Detection Based on Sclera and Blood Vessel Colour Estimation. Biomed. Signal Process. Control 2023, 81, 104489. [Google Scholar] [CrossRef]
- Mitani, A.; Huang, A.; Venugopalan, S.; Corrado, G.S.; Peng, L.; Webster, D.R.; Hammel, N.; Liu, Y.; Varadarajan, A.V. Detection of Anaemia from Retinal Fundus Images via Deeplearning. Nat. Biomed. Eng. 2020, 4, 18–27. [Google Scholar] [CrossRef]
- Zhao, X.; Meng, L.; Su, H.; Lv, B.; Lv, C.; Xie, G.; Chen, Y. Deep-Learning-Based Hemoglobin Concentration Prediction and Anemia Screening Using Ultra-Wide Field Fundus Images. Front. Cell Dev. Biol. 2022, 10, 888268. [Google Scholar] [CrossRef]
- Babenko, B.; Traynis, I.; Chen, C.; Singh, P.; Uddin, A.; Cuadros, J.; Daskivich, L.P.; Maa, A.Y.; Kim, R.; Kang, E.Y.-C.; et al. A Deep Learning Model for Novel Systemic Biomarkers in Photographs of the External Eye: A Retrospective Study. Lancet Digit. Health 2023, 5, e257–e264. [Google Scholar] [CrossRef] [PubMed]
- Das, S.; Kesarwani, A.; Dalui, M.; Kisku, D.R.; Sen, B.; Roy, S.; Basu, A. Smartphone-Based Non-Invasive Haemoglobin Level Estimation by Analyzing Nail Pallor. Biomed. Signal Process. Control 2023, 85, 104959. [Google Scholar] [CrossRef]
- Mannino, R.G.; Myers, D.R.; Tyburski, E.A.; Caruso, C.; Boudreaux, J.; Leong, T.; Clifford, G.D.; Lam, W.A. Smartphone App for Non-Invasive Detection of Anemia Using Only Patient-Sourced Photos. Nat. Commun. 2018, 9, 4924. [Google Scholar] [CrossRef] [PubMed]
- Yılmaz, H.; Kızılateş, B.S.; Shaaban, F.; Karataş, Z.R. A Novel Combined Deep Learning Methodology to Non-Invasively Estimate Hemoglobin Levels in Blood with High Accuracy. Med. Eng. Phys. 2022, 108, 103891. [Google Scholar] [CrossRef] [PubMed]
- Shah, N.; Osea, E.A.; Martinez, G.J. Accuracy of Noninvasive Hemoglobin and Invasive Point-of-Care Hemoglobin Testing Compared with a Laboratory Analyzer. Int. J. Lab. Hematol. 2014, 36, 56–61. [Google Scholar] [CrossRef] [PubMed]
- Honnef, G.; Auinger, D.; Eichinger, M.; Eichlseder, M.; Metnitz, P.G.H.; Rief, M.; Zajic, P.; Zoidl, P.; Bornemann-Cimenti, H. Evaluation of the Usefulness of Non-Invasive Serum Haemoglobin Measurement in a Perioperative Setting in a Prospective Observational Study. Sci. Rep. 2022, 12, 9065. [Google Scholar] [CrossRef]
- Hornedo-González, K.D.; Jacob, A.K.; Burt, J.M.; Higgins, A.A.; Engel, E.M.; Hanson, A.C.; Belch, L.; Kor, D.J.; Warner, M.A. Non-Invasive Hemoglobin Estimation for Preoperative Anemia Screening. Transfusion 2023, 63, 315–322. [Google Scholar] [CrossRef]
- Young, M.F.; Raines, K.; Jameel, F.; Sidi, M.; Oliveira-Streiff, S.; Nwajei, P.; McGlamry, K.; Ou, J.; Oladele, A.; Suchdev, P.S. Non-Invasive Hemoglobin Measurement Devices Require Refinement to Match Diagnostic Performance with Their High Level of Usability and Acceptability. PLoS ONE 2021, 16, e0254629. [Google Scholar] [CrossRef]
- Yang, S.; Hu, P.F.; Anazodo, A.; Gao, C.; Chen, H.; Wade, C.; Hartsky, L.; Miller, C.; Imle, C.; Fang, R.; et al. Trends of Hemoglobin Oximetry: Do They Help Predict Blood Transfusion During Trauma Patient Resuscitation? Anesth. Analg. 2016, 122, 115–125. [Google Scholar] [CrossRef]
- Shamah Levy, T.; Méndez-Gómez-Humarán, I.; Morales Ruán, M.D.C.; Martinez Tapia, B.; Villalpando Hernández, S.; Hernández Ávila, M. Validation of Masimo Pronto 7 and HemoCue 201 for Hemoglobin Determination in Children from 1 to 5 Years of Age. PLoS ONE 2017, 12, e0170990. [Google Scholar] [CrossRef]
- Rice, M.J.; Gravenstein, N.; Morey, T.E. Noninvasive Hemoglobin Monitoring: How Accurate Is Enough? Anesth. Analg. 2013, 117, 902–907. [Google Scholar] [CrossRef] [PubMed]
- Juric, S.; Zalik, B. An Innovative Approach to Near-Infrared Spectroscopy Using a Standard Mobile Device and Its Clinical Application in the Real-Time Visualization of Peripheral Veins. BMC Med. Inform. Decis. Mak. 2014, 14, 100. [Google Scholar] [CrossRef] [PubMed]
- Guillon, P.; Makhloufi, M.; Baillie, S.; Roucoulet, C.; Dolimier, E.; Masquelier, A.-M. Prospective Evaluation of Venous Access Difficulty and a Near-Infrared Vein Visualizer at Four French Haemophilia Treatment Centres. Haemophilia 2015, 21, 21–26. [Google Scholar] [CrossRef] [PubMed]
- Miyake, R.K.; Zeman, H.D.; Duarte, F.H.; Kikuchi, R.; Ramacciotti, E.; Lovhoiden, G.; Vrancken, C. Vein Imaging: A New Method of Near Infrared Imaging, Where a Processed Image Is Projected onto the Skin for the Enhancement of Vein Treatment. Dermatol. Surg. 2006, 32, 1031–1038. [Google Scholar] [CrossRef]
- Xie, S.; Fang, L.; Wang, Z.; Ma, Z.; Li, J. Review of Personal Identification Based on near Infrared Vein Imaging of Finger. In Proceedings of the 2017 2nd International Conference on Image, Vision and Computing (ICIVC), Chengdu, China, 2–4 June 2017; pp. 206–213. [Google Scholar]
- Pititheeraphab, Y.; Thongpance, N.; Aoyama, H.; Pintavirooj, C. Vein Pattern Verification and Identification Based on Local Geometric Invariants Constructed from Minutia Points and Augmented with Barcoded Local Feature. Appl. Sci. 2020, 10, 3192. [Google Scholar] [CrossRef]
- Saigo, K.; Imoto, S.; Hashimoto, M.; Mito, H.; Moriya, J.; Chinzei, T.; Kubota, Y.; Numada, S.; Ozawa, T.; Kumagai, S. Noninvasive Monitoring of Hemoglobin: The Effects of WBC Counts on Measurement. Am. J. Clin. Pathol. 2004, 121, 51–55. [Google Scholar] [CrossRef]
- Kanashima, H.; Yamane, T.; Takubo, T.; Kamitani, T.; Hino, M. Evaluation of Noninvasive Hemoglobin Monitoring for Hematological Disorders. J. Clin. Lab. Anal. 2005, 19, 1–5. [Google Scholar] [CrossRef]
- Naglič, P.; Zelinskyi, Y.; Pernuš, F.; Likar, B.; Bürmen, M. Pyxopto: An Open-Source Python Library with Utilities for Fast Light Propagation Modeling in Turbid Media. In Proceedings of the European Conferences on Biomedical Optics 2021 (ECBO), Munich, Germany, 20–24 June 2021; p. EM3C.2. [Google Scholar]
- Omlc.Org. Available online: https://omlc.org/spectra/ (accessed on 20 November 2023).
- van Beest, P.; Wietasch, G.; Scheeren, T.; Spronk, P.; Kuiper, M. Clinical Review: Use of Venous Oxygen Saturations as a Goal—A yet Unfinished Puzzle. Crit. Care 2011, 15, 232. [Google Scholar] [CrossRef]
- Bosschaart, N.; Edelman, G.J.; Aalders, M.C.G.; van Leeuwen, T.G.; Faber, D.J. A Literature Review and Novel Theoretical Approach on the Optical Properties of Whole Blood. Lasers Med. Sci. 2014, 29, 453–479. [Google Scholar] [CrossRef]
- Jacques, S.L. Optical Properties of Biological Tissues: A Review. Phys. Med. Biol. 2013, 58, R37. [Google Scholar] [CrossRef]
- Salomatina, E.V.; Jiang, B.; Novak, J.; Yaroslavsky, A.N. Optical Properties of Normal and Cancerous Human Skin in the Visible and Near-Infrared Spectral Range. J. Biomed. Opt. 2006, 11, 064026. [Google Scholar] [CrossRef] [PubMed]
- Zhang, Z.-M.; Chen, S.; Liang, Y.-Z. Baseline Correction Using Adaptive Iteratively Reweighted Penalized Least Squares. Analyst 2010, 135, 1138–1146. [Google Scholar] [CrossRef] [PubMed]
- Bigio, I.J.; Fantini, S. Quantitative Biomedical Optics: Theory, Methods, and Applications; Cambridge Texts in Biomedical Engineering; Cambridge University Press: Cambridge, UK, 2016; ISBN 978-1-316-46238-6. [Google Scholar]
- Hayakawa, C.K.; Karrobi, K.; Pera, V.; Roblyer, D.; Venugopalan, V. Optical Sampling Depth in the Spatial Frequency Domain. J. Biomed. Opt. 2018, 24, 071603. [Google Scholar] [CrossRef] [PubMed]
- Tseregorodtseva, P.S.; Buiankin, K.E.; Yakimov, B.P.; Kamalov, A.A.; Budylin, G.S.; Shirshin, E.A. Single-Fiber Diffuse Reflectance Spectroscopy and Spatial Frequency Domain Imaging in Surgery Guidance: A Study on Optical Phantoms. Materials 2021, 14, 7502. [Google Scholar] [CrossRef]
- Nawaz Jadoon, R.; Shahzad, A.; Shah, S.A.; Khan, M.A.; Akram, T.; Zhou, W. Veins Depth Estimation Using Diffused Reflectance Parameter. Appl. Sci. 2020, 10, 8238. [Google Scholar] [CrossRef]
Disclaimer/Publisher’s Note: The statements, opinions and data contained in all publications are solely those of the individual author(s) and contributor(s) and not of MDPI and/or the editor(s). MDPI and/or the editor(s) disclaim responsibility for any injury to people or property resulting from any ideas, methods, instructions or products referred to in the content. |
© 2024 by the authors. Licensee MDPI, Basel, Switzerland. This article is an open access article distributed under the terms and conditions of the Creative Commons Attribution (CC BY) license (https://creativecommons.org/licenses/by/4.0/).