Communication

Relative Humidity Optical Sensor Based on Self-Assembled Gold Nanoparticles Covered with Nafion

Dukhov Automatics Research Institute (VNIIA), 127055 Moscow, Russia
*
Author to whom correspondence should be addressed.
Photonics 2023, 10(9), 975; https://doi.org/10.3390/photonics10090975
Submission received: 28 June 2023 / Revised: 23 August 2023 / Accepted: 24 August 2023 / Published: 25 August 2023
(This article belongs to the Special Issue Novel Photonic Devices and Techniques)

Abstract

:
The detection of humidity plays a vital role in healthcare, industrial, and scientific areas, and the development of an ideal sensor is in continuous progress. In this work, a relative humidity (RH) optical sensor based on localized surface plasmon resonance of self-assembled gold nanoparticles formed by thermal dewetting and coated with Nafion fluoropolymer is under study. Sensor performance has been found to substantially depend on Nafion layer thickness. The best sensing element—an array of gold nanoparticles covered with a 300 nm-thick Nafion—has been shown to possess a linear response in a wide dynamic range of 0–85% RH with a limit of detection down to 0.12%. Thus, a simple and low-cost method for high-accuracy RH detection has been demonstrated.

1. Introduction

The detection of relative humidity (RH) is a critical aspect of many industrial, commercial, and scientific applications, including environment monitoring, healthcare, agriculture, transportation, chemical and food processing, etc. Humidity may dramatically affect the performance of gas sensors due to cross-sensitivity [1,2]. This is why, for improving the accuracy of gas sensors, RH detection is very important, particularly for detection in the ppm or ppb range. There are several types of humidity sensors, including quartz crystal microbalance [3,4], capacitive [5,6], resistive [7,8,9,10,11], and optical ones, depending on the measured property. Moreover, self-powered RH sensors have been intensively studied in recent years [12,13,14]. Optical humidity sensors are typically more sensitive and immune to electromagnetic interference compared to their electronic counterparts. To date, a broad variety of optical humidity sensors based on photoluminescence [15,16,17], Brillouin scattering [18,19], Bragg grating [20,21,22], Fabry-Perot interferometer [23,24], photonic crystal [25,26], and plasmon resonance have been proposed. Plasmonic humidity sensors are widely studied because of the possibility of using self-assembled [27] and patterned [28] nanoparticle arrays possessing localized and lattice plasmon resonances, respectively. Moreover, surface plasmon-polariton waves in thin metal films [29] and hybrid plasmonic-photonic approaches [30,31] are suitable for optical RH detection.
Optical humidity sensors, as well as other types, require a functional material that efficiently adsorbs/desorbs water vapor from the atmosphere and changes in some way the properties of the material. The latter results in sensor responses depending on adsorbed water content. There are many functional materials used for optical humidity sensors, both inorganic (for example, ZnO [32], CsPbBr3 [33], and carbon nanomaterials [34,35]) and organic materials (including polyvinyl alcohol (PVA) [36], chitosan [37], polyethylene glycol (PEG) [38], Nafion [39,40,41,42], etc.) Nafion is the trade name for sulfonated tetrafluoroethylene copolymer. It has a hydrophobic main chain and sidechains terminating in hydrophilic sulfonic (−SO3H) groups that give the material its ion-transport properties. Being a fluoropolymer, it has excellent chemical, thermal, and mechanical stability. Nafion membranes are highly conductive for cations, which are transported along the hydrophilic and negatively charged channels made of sulfonic groups. These channels, 3–6 nm wide, penetrate throughout the polymer, interconnect, and compose a significant volume fraction [43]. With these channels, Nafion readily adsorbs water molecules, which leads to an increase in volume (swelling) and conductivity as well as a change in refractive index. According to [24], Nafion’s refractive index is 1.38 in the dry state and lowers as a result of water adsorption. Other reports on Nafion refractive index give 1.36 in the dry state [44] or 1.37–1.39 for sufficiently thick films [45]. The author of [46] observed that the refractive index of a 70-nanometer-thick Nafion film on SiO2 substrate decreases from 1.338 in the dry state to 1.327 in the wet state; the latter is even lower than the water refractive index. Such discrepancies between different studies can be attributed to the method of Nafion film deposition, substrate interactions, and film thickness. Films with thicknesses in the tens of nanometer range differ by their structure from films thicker than 50 nm [43,45,47] and change water uptake amounts.
Electric sensors (resistive and capacitive) dominate the RH sensor market due to their low cost (starting at $1), short response/recovery times (tens of seconds and below), moderate accuracy (typically in the range ±1–4%), and long-term stability. The disadvantages of such sensors are their susceptibility to strong electromagnetic interference, hysteresis (1–3%), and flammability. Requirements for humidity sensors strongly depend on potential applications; however, an ideal sensor should possess fast response/recovery times, a wide dynamic range, a low limit of detection, a linear response without hysteresis caused by different behavior during adsorption/desorption processes, and long-term stability. On the other hand, in real-world applications, there is typically a tradeoff between these parameters. The aim of this work was to develop a simple, low-cost, and robust optical humidity sensor for a wide range of potential applications. For this purpose, self-assembled gold nanoparticle arrays obtained via thermal dewetting of e-beam evaporated gold thin films were used as substrates due to the low-cost and versatile fabrication method and the high sensitivity of plasmonic structures to changes in the refractive index of an environmental medium. Nafion was chosen as a humidity-sensitive cover for the plasmonic gold nanoparticle array because of the large change in its refractive index in dry and humid air, as mentioned above, and its long-term stability.

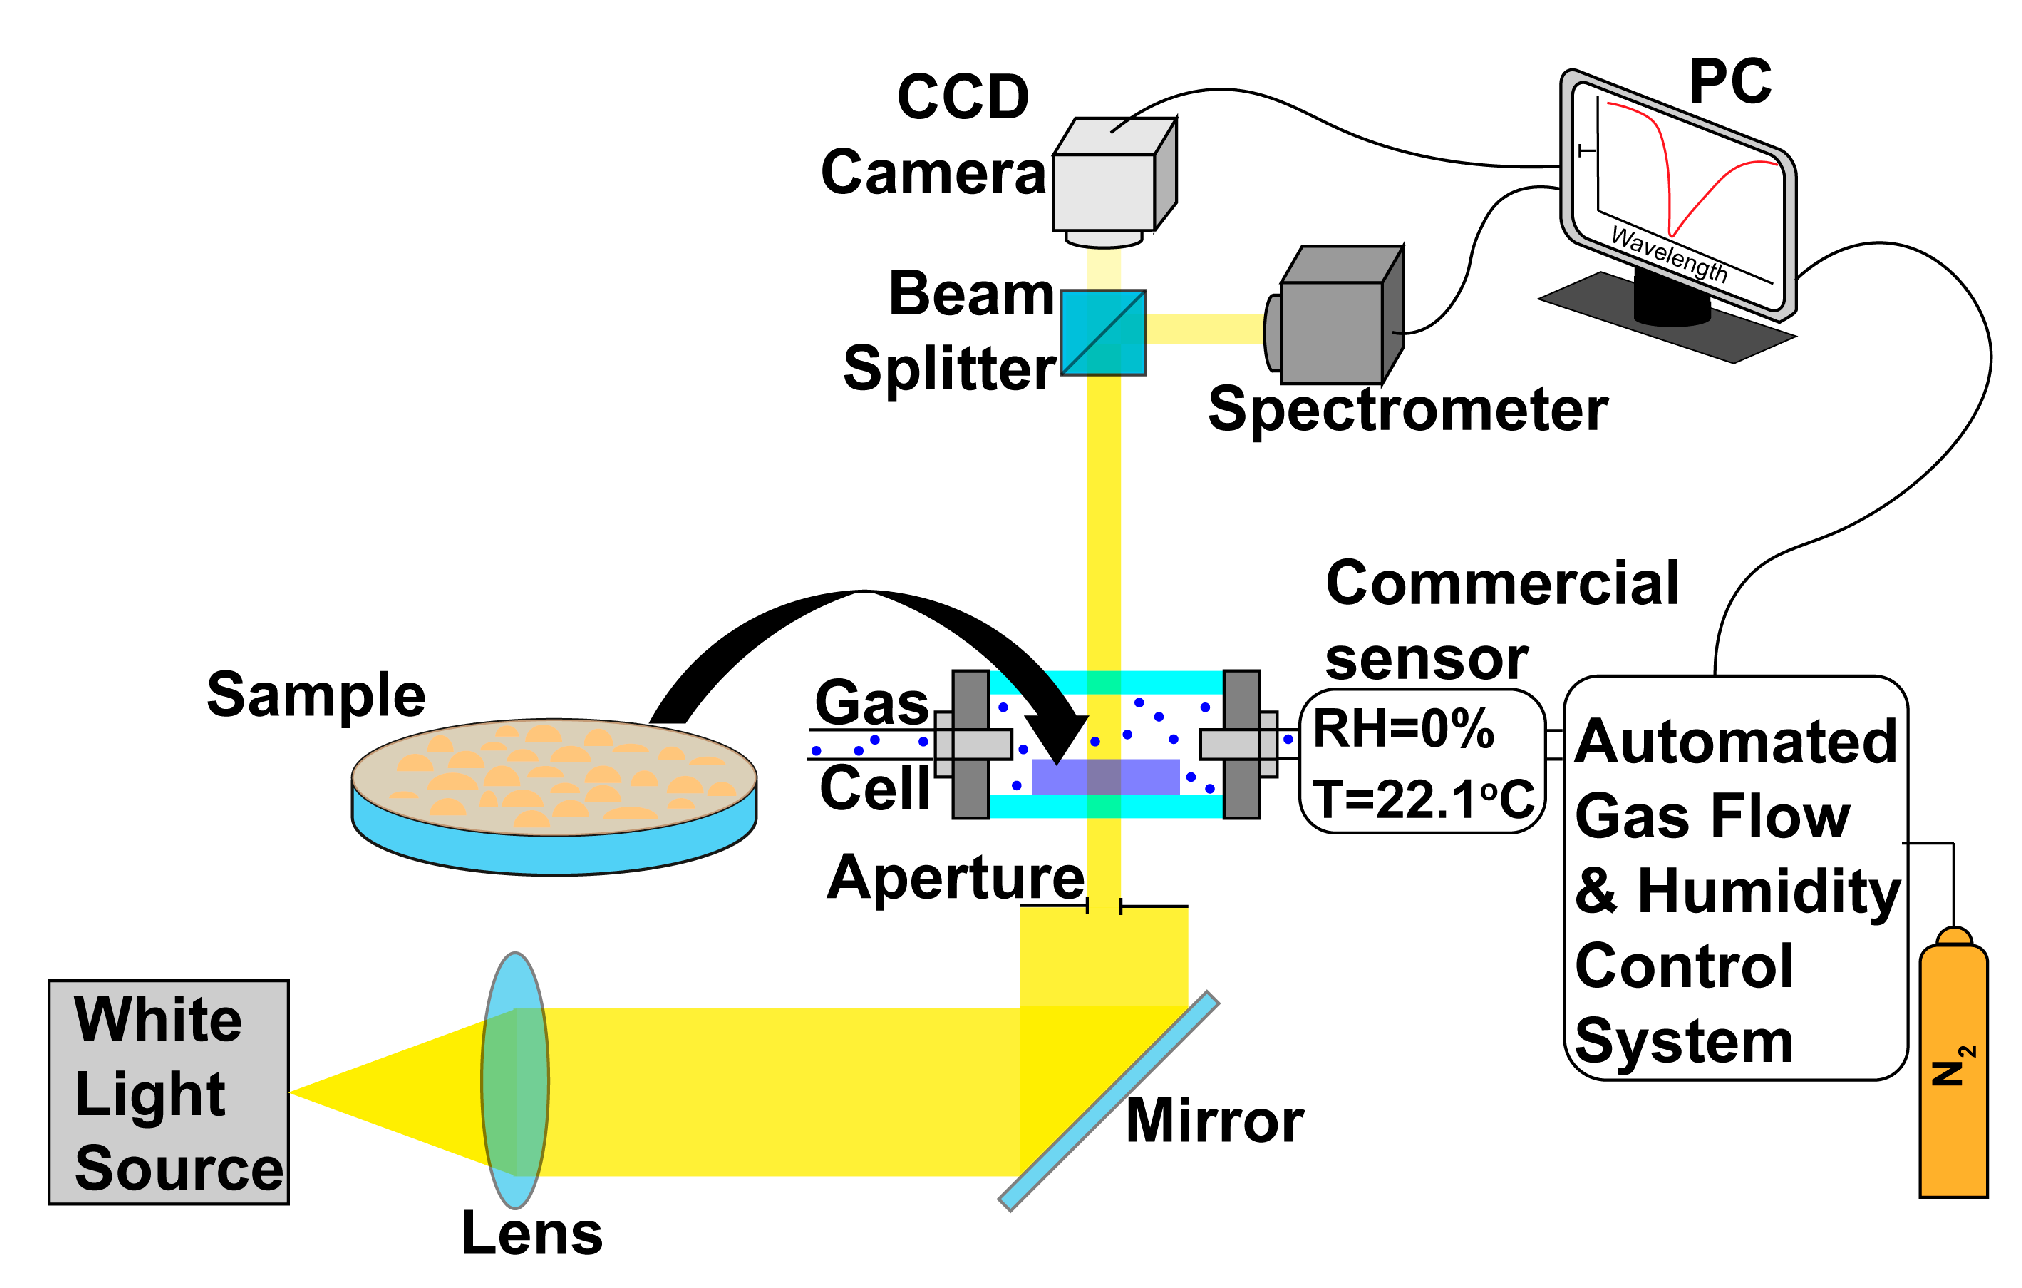
2. Materials and Methods

Fused silica substrates (12 × 12 × 1 mm) from Siegert Wafer were cleaned in Piranha solution, washed with deionized water, and dried with a nitrogen gun. The substrates were then cleaned by corona discharge inside an e-beam evaporator (VATT-700, Ferri Vatt Ltd., Kazan, Russia), and a 6 nm gold thin film was deposited at 5 × 10⁻³ Pa vacuum. The obtained films were then heat-treated in a tube furnace at 400–500 °C to promote the formation of self-assembled gold nanoparticles and were characterized with a double-beam spectrophotometer (UV-3600, Shimadzu, Kyoto, Japan) in the spectral range 350–850 nm. A 5 wt.% Nafion 1100 W solution was purchased from Sigma Aldrich and employed as received. Nafion solution was spin-coated at speeds of 1200–10,000 rpm to obtain 130–300 nm thin films over gold nanoparticle arrays. The thickness of the deposited films was measured with a stylus profilometer (P-7, KLA Tencor, Milpitas, CA, USA). The topography of the samples after gold nanoparticle formation and Nafion coating deposition was measured by an atomic force microscope (NT-MDT).
The transmission spectra of the sample were measured at normal incidence using the setup shown in Figure 1. A collimated beam from a white light source (XWS-65, ISTEQ, Eindhoven, The Netherlands) passed through an aperture and a sample placed in a gas cell with quartz windows and was directed to a spectrometer with a TE-cooled CCD (iDus 401, Andor, Belfast, UK). Transmitted spectra were integrated for 10 s. A constant 400 sccm nitrogen gas flow was humidified with a controlled evaporation and mixing system (W-101A, Bronkhorst, Ruurlo, The Netherlands), injecting a controlled mass of water microdroplets and evaporating them in the nitrogen flow. The mass of injected water and gas flow were controlled with liquid flow and mass flow controllers (Bronkhorst), respectively. The relative humidity of the output nitrogen flow was measured with an IPVT-08-D1 (Eksis, Moscow, Russia) commercial temperature and relative humidity sensor [48].

3. Results and Discussion

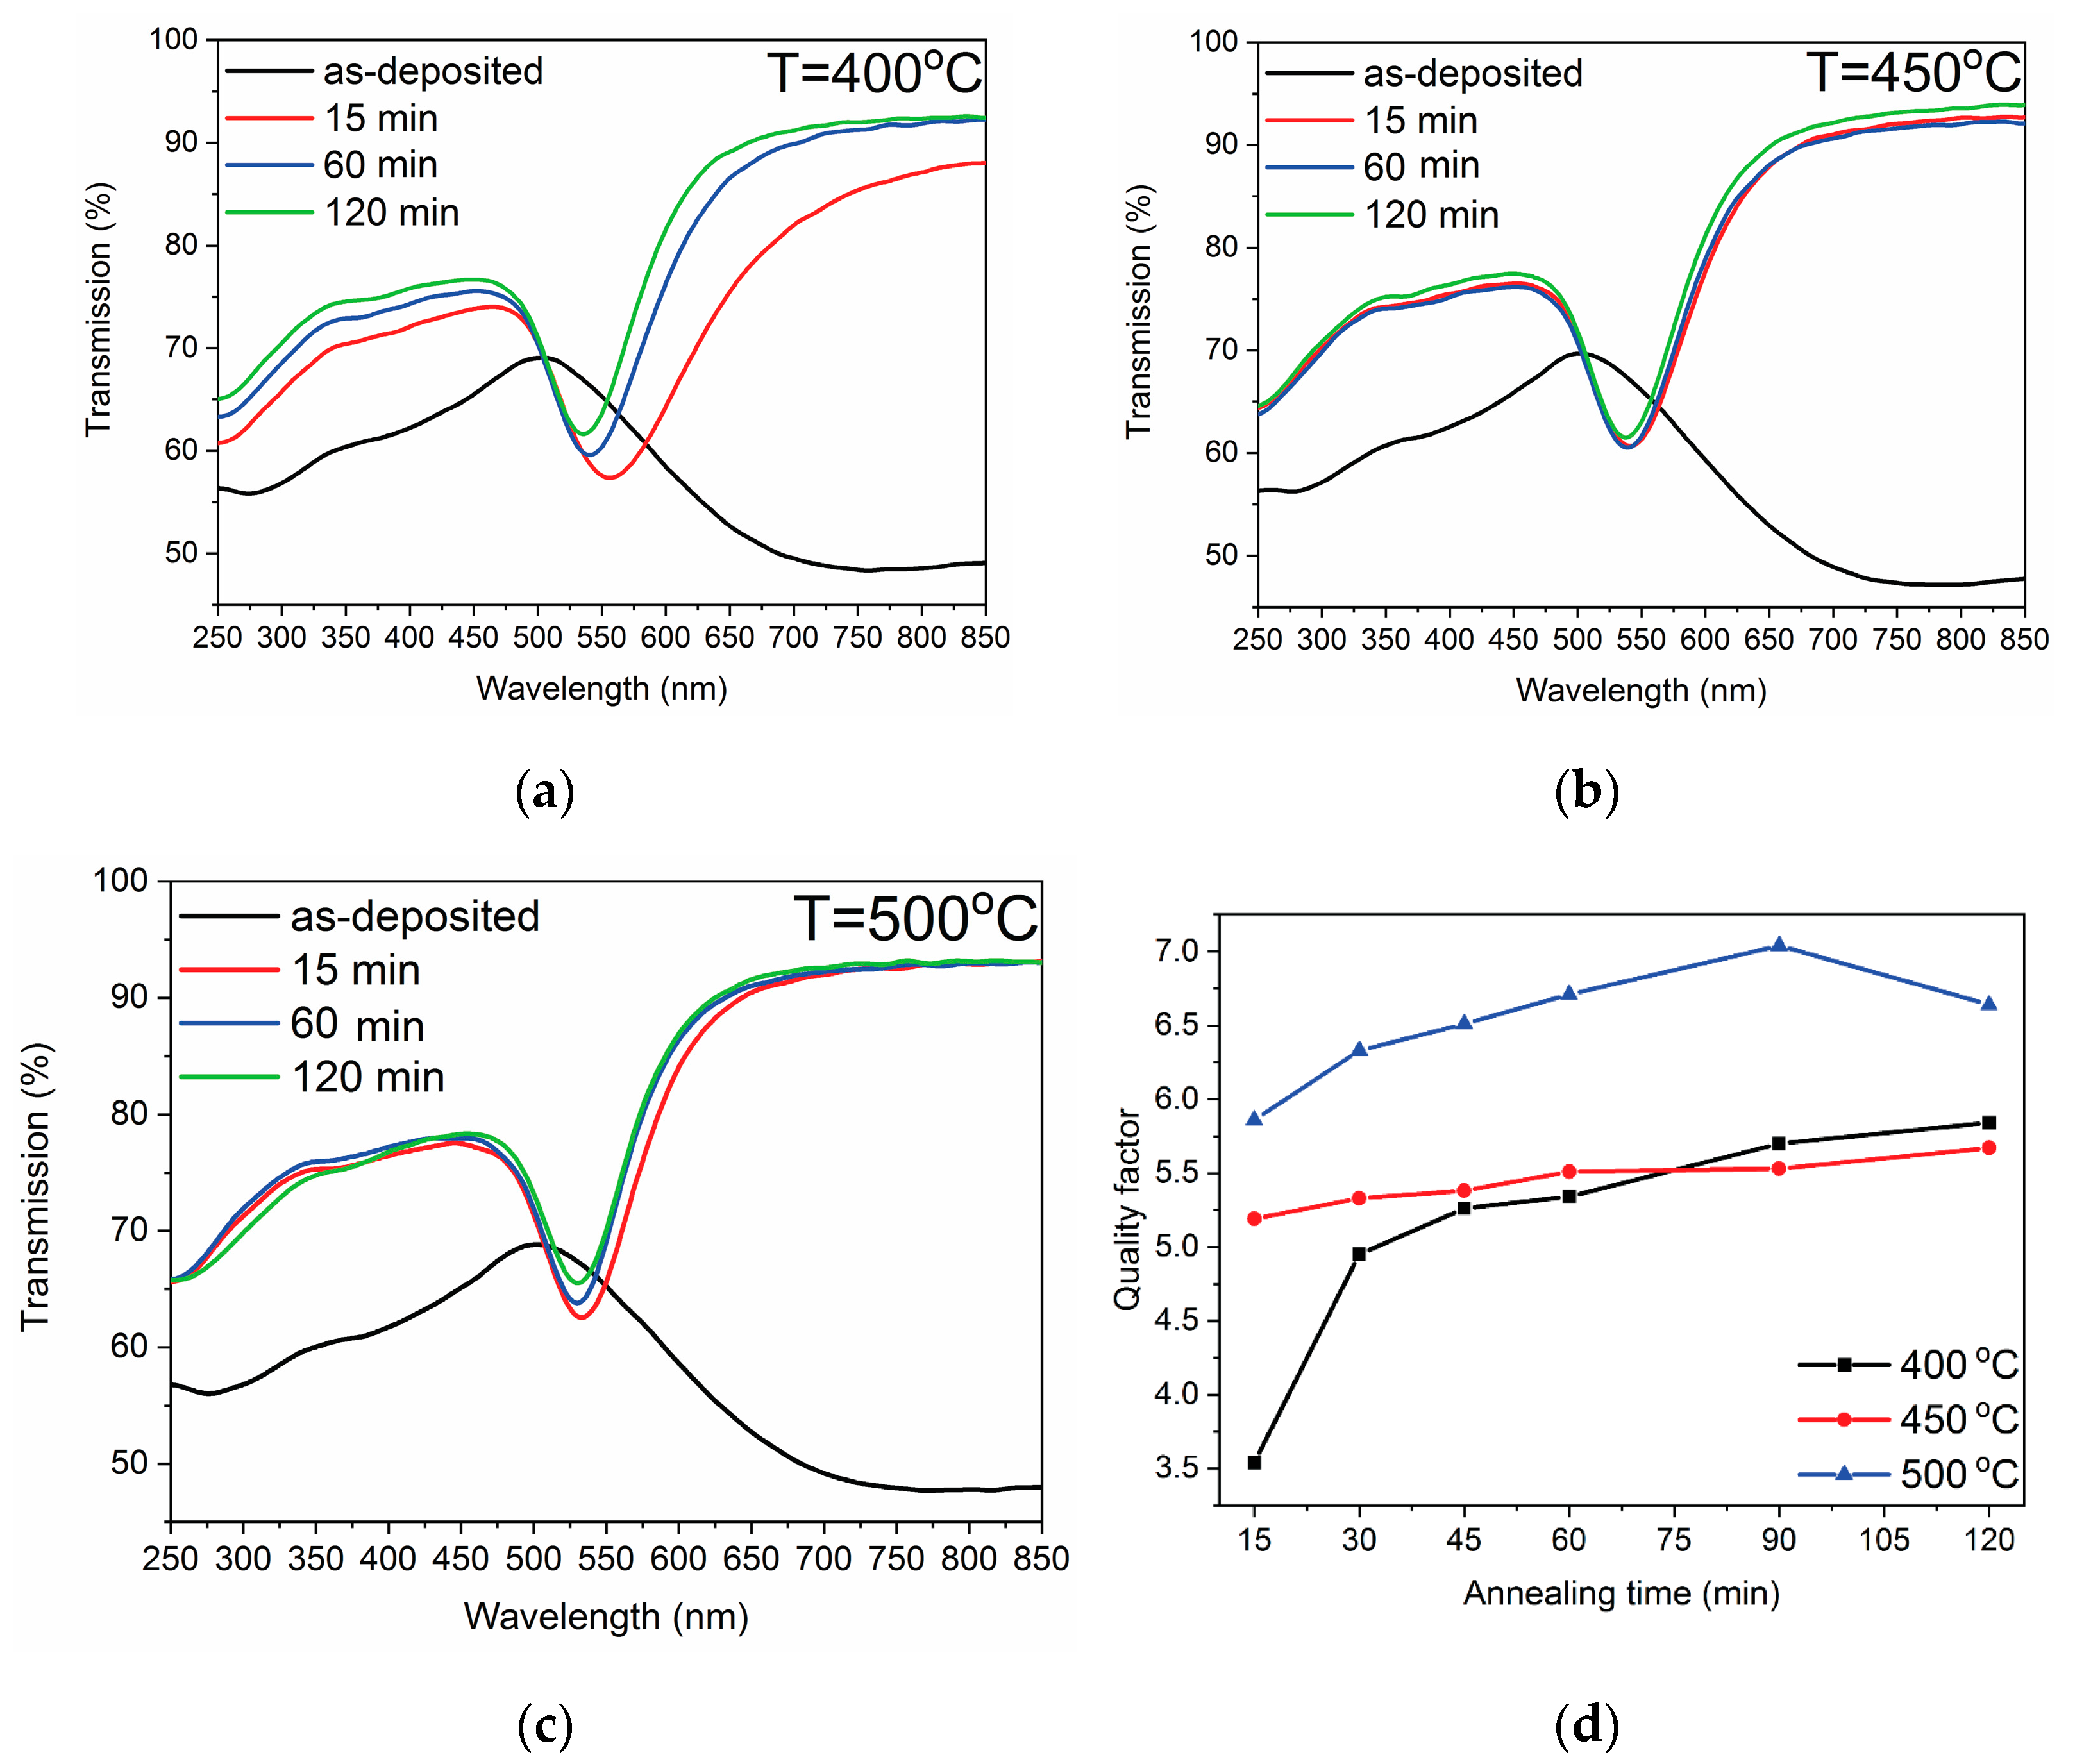
3.1. Optimization of Heat Treatment Parameters

To promote the formation of nanoparticles on quartz substrates, thermal annealing of e-beam-evaporated thin gold films was used. Morphology and optical properties of such dewetted films determined by localized surface plasmon resonance (LSPR) of gold nanoparticles are known to strongly depend on substrate, thickness of the gold film, and thermal treatment parameters [49,50,51]. For optical sensor applications, the quality factor of a sensitive element is a key characteristic. That was why heat treatment parameters were varied to optimize the quality factor of the annealed gold films. The quality factor was calculated as a ratio of the full width at half maximum of the LSPR-related absorption band to its center wavelength. Based on literature data and preliminary experiments, the temperature range of 400–500 °C was chosen for further experiments. Heat treatment at 400 °C for 15 min was found to induce the formation of an LSPR band centered at 558 nm (Figure 2a). Prolonged annealing resulted in the narrowing and blue shift of the LSPR band as well as a decrease in the band amplitude. The same trends were observed for samples annealed at 450 °C and 500 °C (Figure 2b,c).
The full width at half maximum of the LSPR band of dewetted thin gold films substantially depends on particle size distribution, aspect ratio of nanoparticles, and their shape [51,52,53,54]. In our case, the same behavior was observed for all studied temperatures. The aspect ratio of nanoparticles should lower with the rising annealing temperature, resulting in a narrowing of the LSPR band due to a more homogeneous particle size distribution. Growth of average nanoparticle size with continuation of annealing, typical for dewetted gold films [55], led to an increment in the distance between neighboring nanoparticles and a decrease in the area covered with gold nanoparticles [51]. The latter two are reasons for the blue shift of the LSPR band and some increase in transmission, respectively.
Figure 2d shows the dependence of the quality factor on annealing time at different temperatures. The quality factor of thin films annealed at 400 °C and 450 °C did not exceed 6, while it reached 7 after annealing at 500 °C for 90 min, with a slight decrease with further treatment. Due to high optical losses in noble metals, typical quality factor magnitudes of LSPR in such nanostructures are on the order of ten [56,57,58]. Based on the obtained results, gold nanoparticle arrays annealed at 500 °C for 90 min were chosen for further deposition of Nafion films.

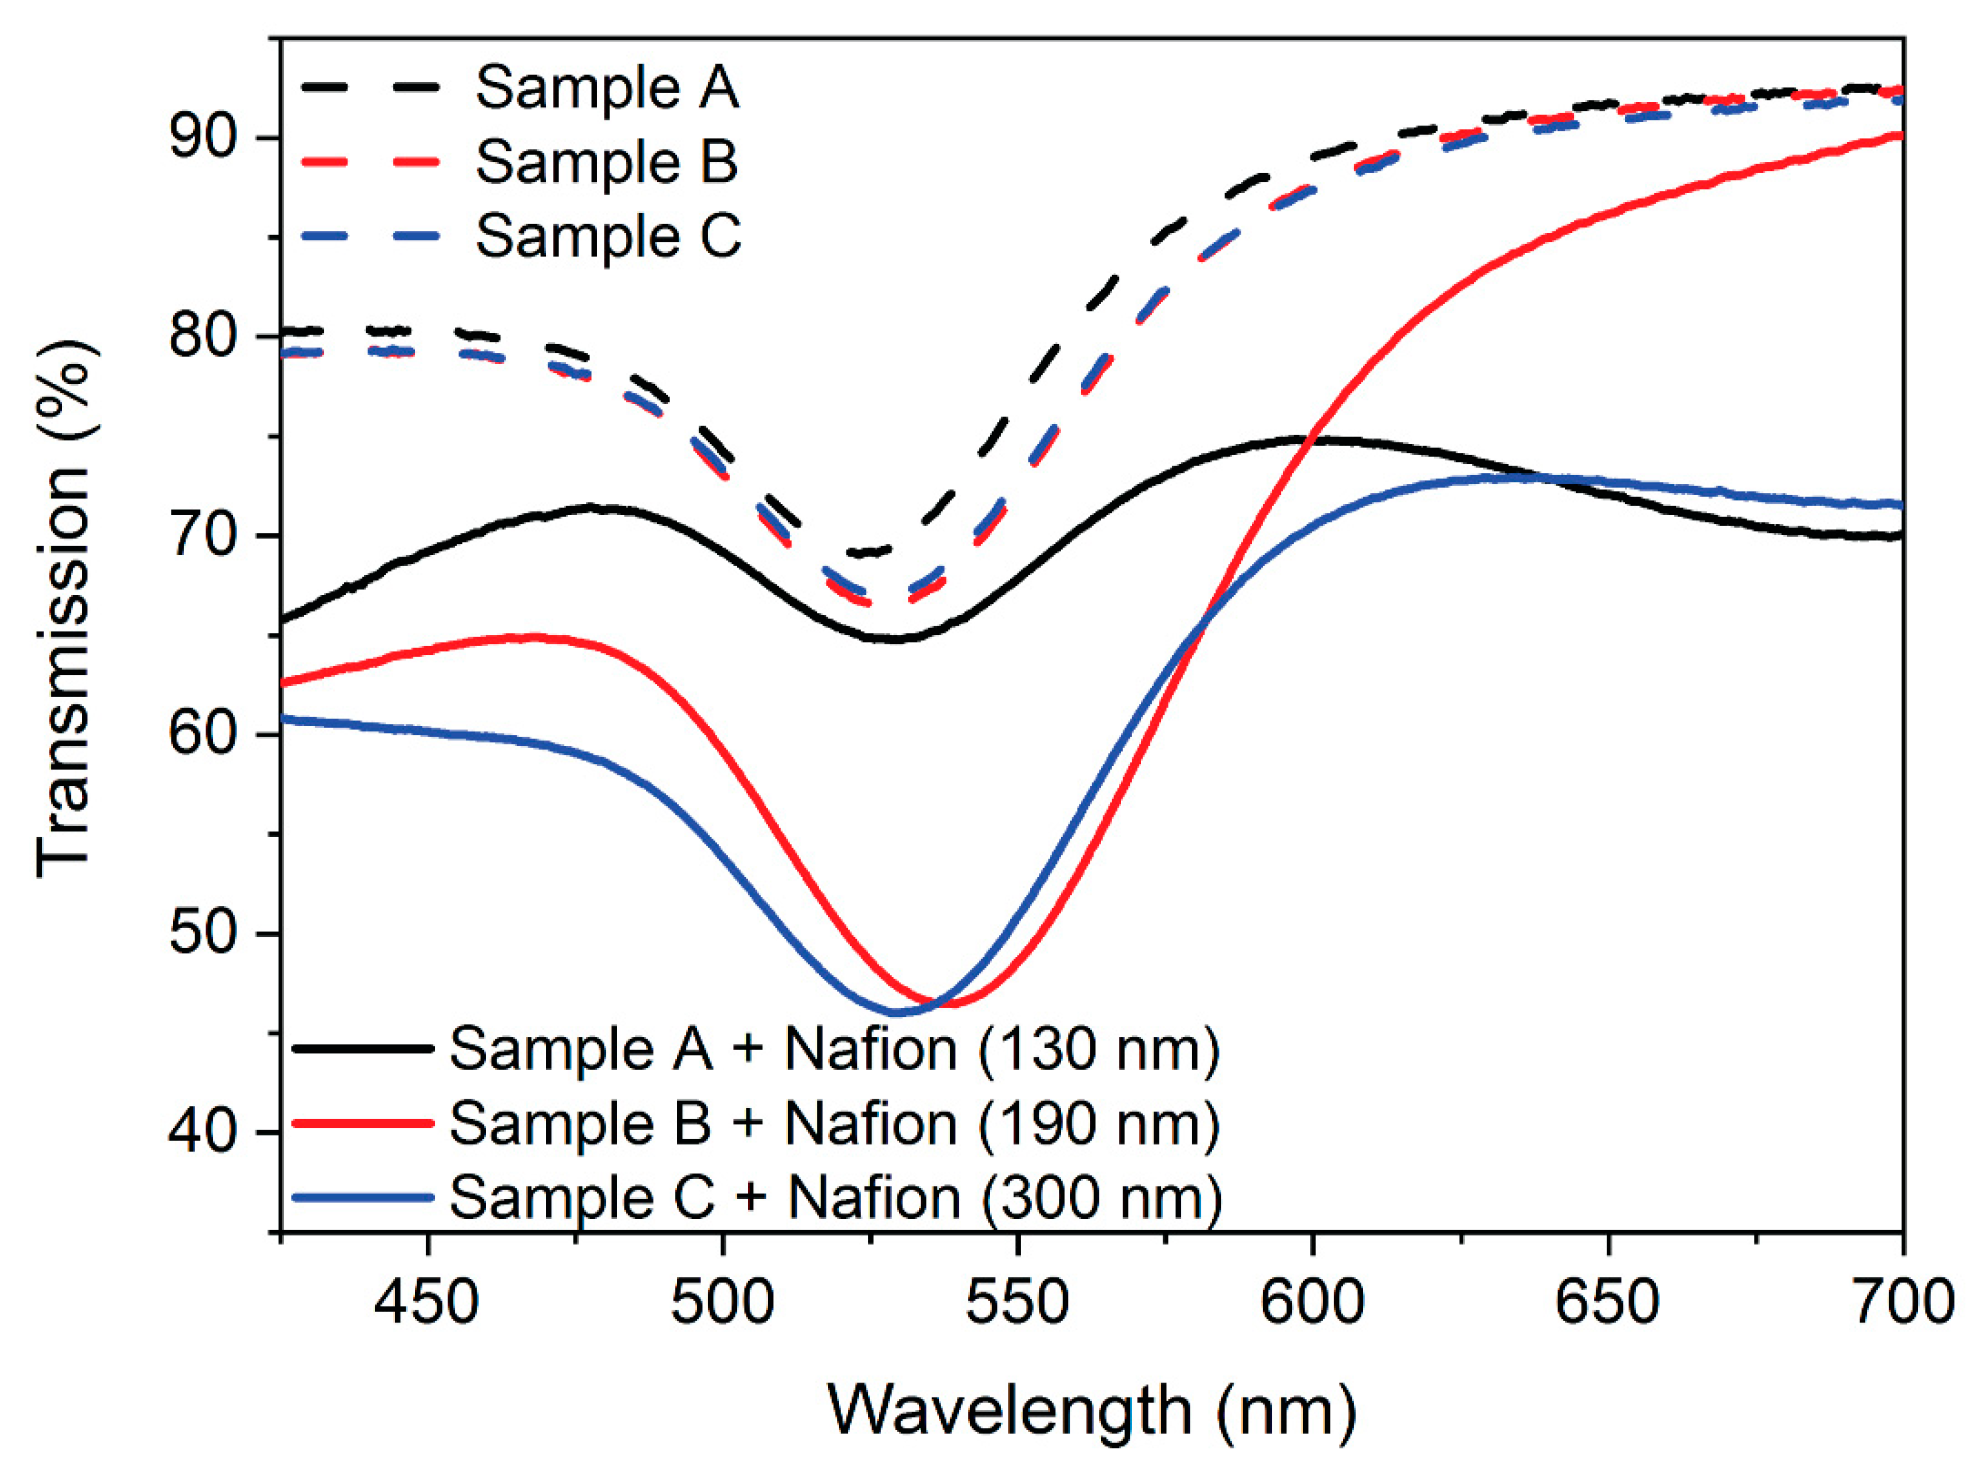
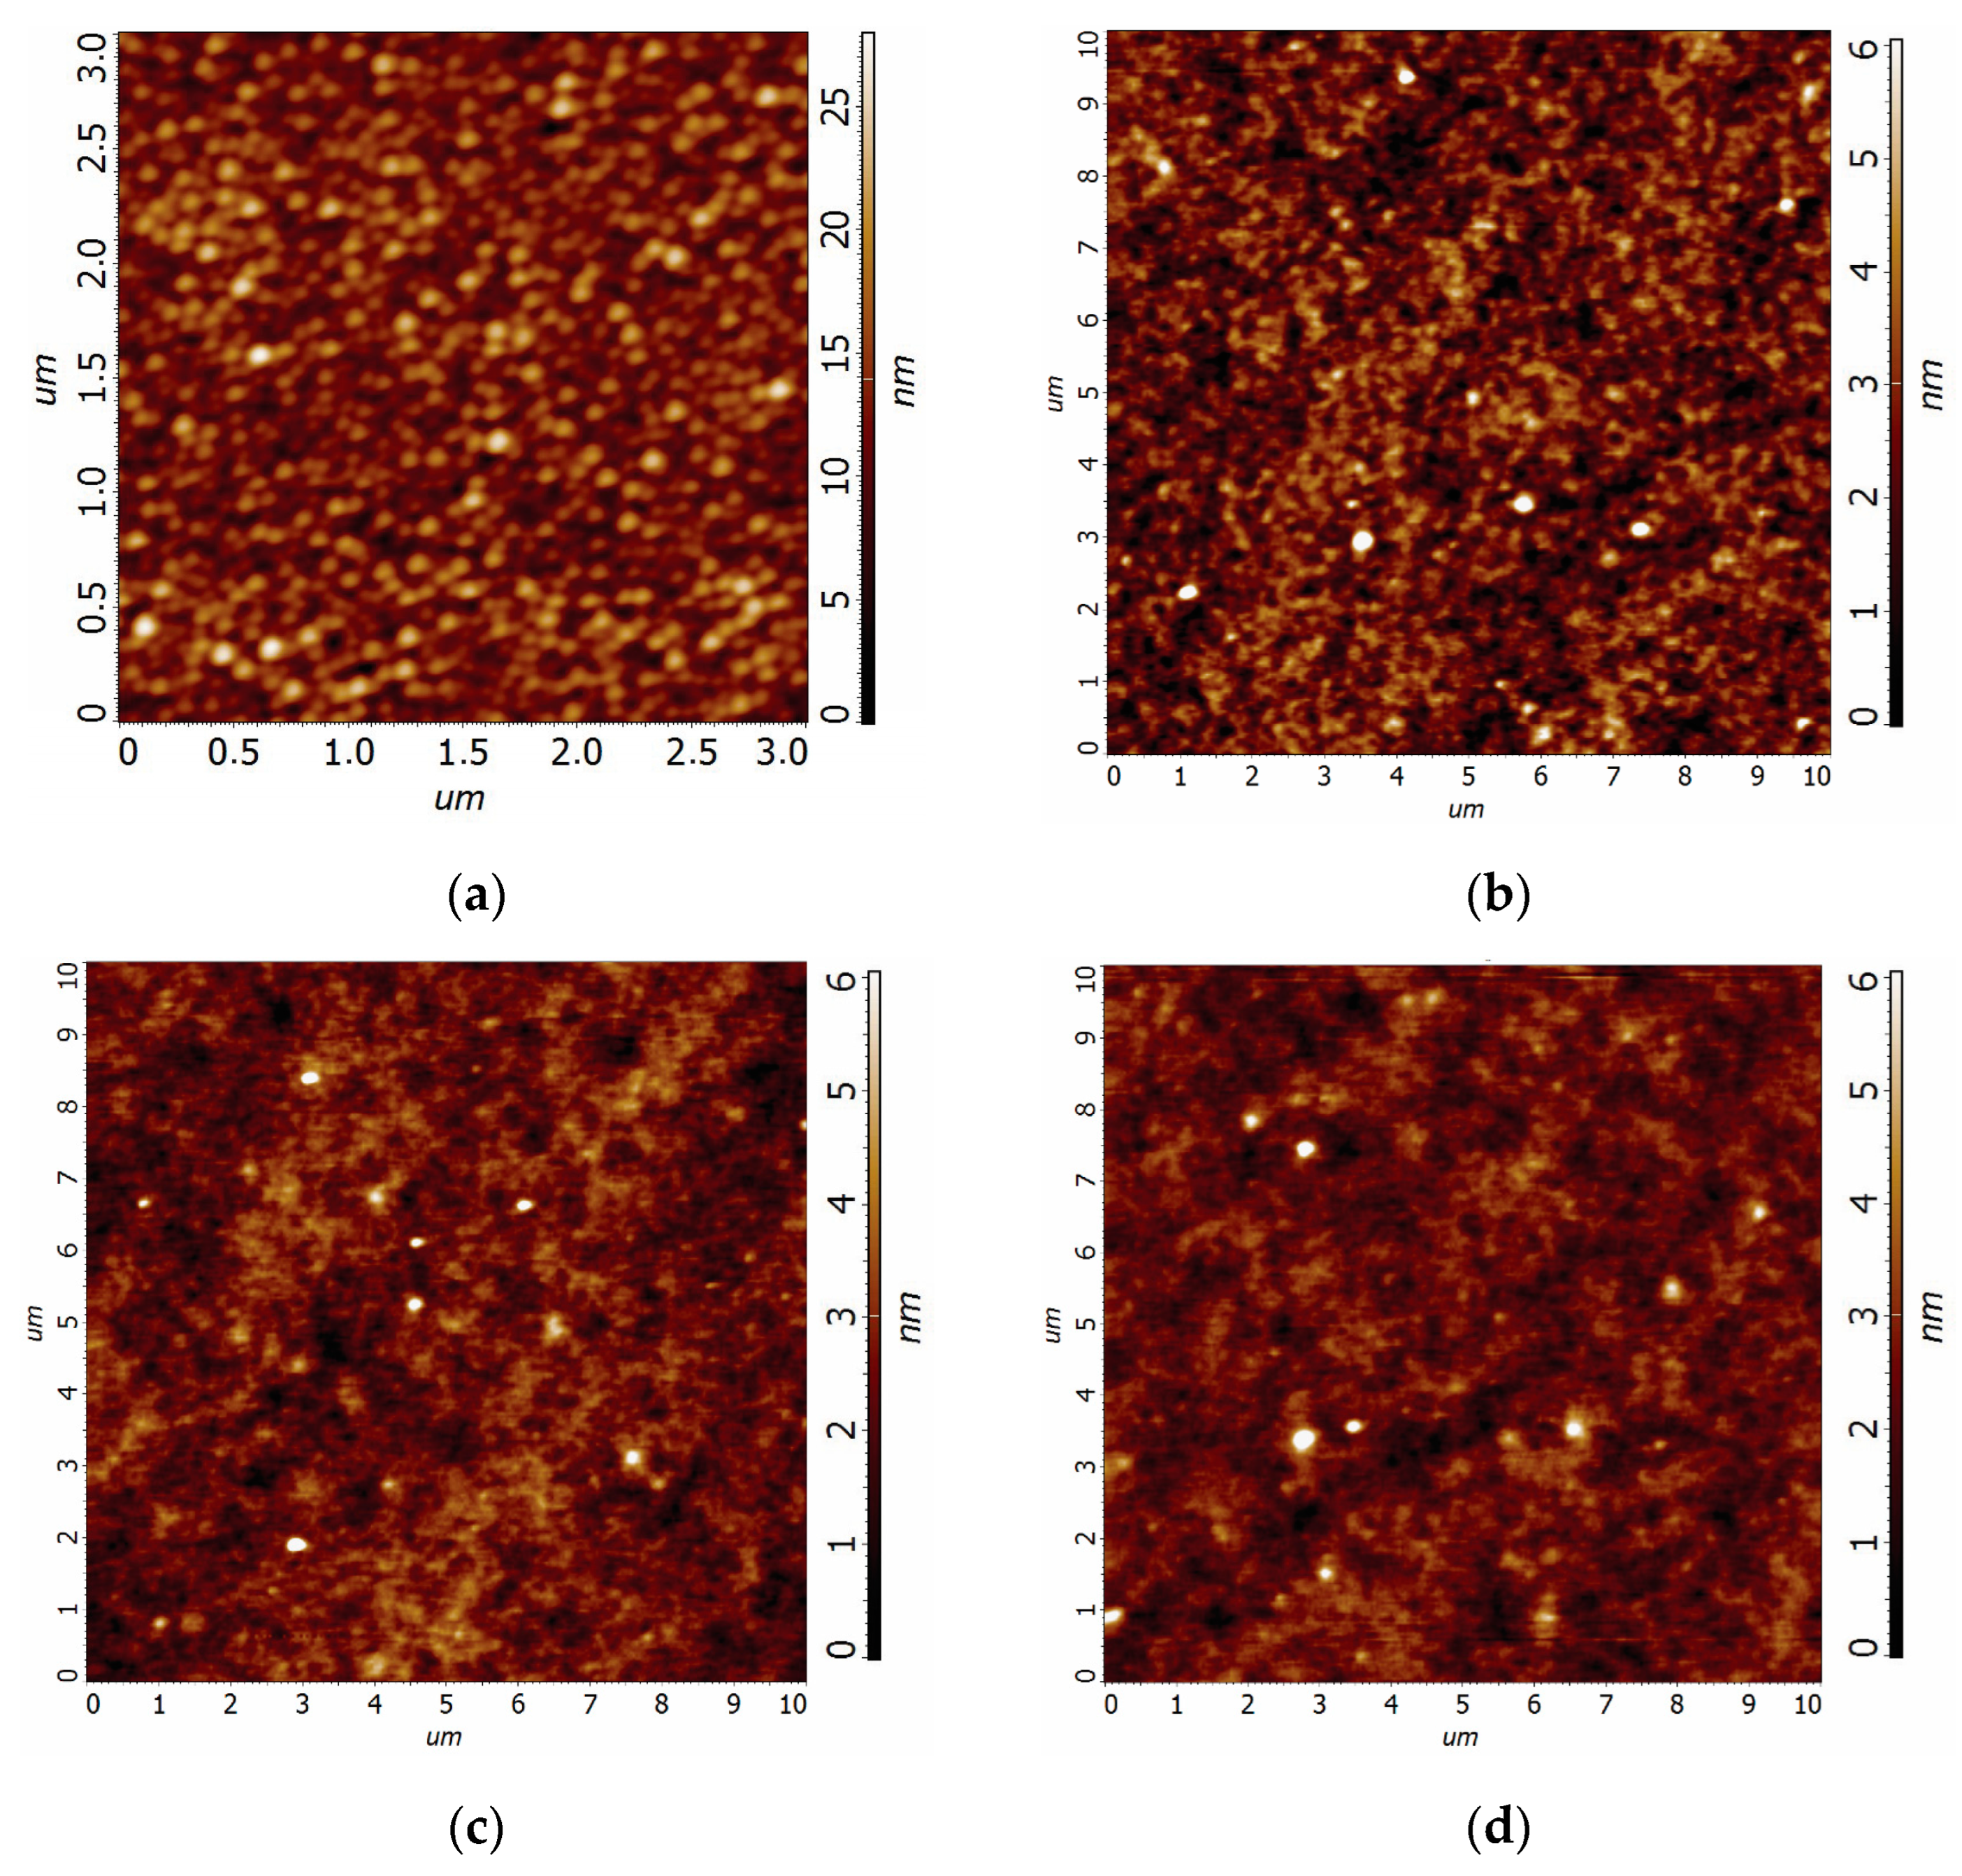
3.2. Nafion Deposition and Characterization

The thickness of humidity-sensitive material has a significant effect on the performance of optical humidity sensors [59,60]. To study the effect of Nafion thickness, three samples annealed under the chosen optimal conditions were prepared for Nafion deposition. The thicknesses of the Nafion films were found to be 130 nm (Sample A), 190 nm (Sample B), and 300 nm (Sample C). Transmission spectra before and after Nafion deposition are shown in Figure 3. Deposition of Nafion led to a long-wavelength shift of the LSPR band due to an increase in the refractive index of the environment. Moreover, enhancement of LSPR band amplitude was also detected for samples B and C covered with 190 and 300 nm Nafion films, respectively. For the thinnest Nafion sample deposited at 10,000 rpm, weakening of the LSPR amplitude was observed. The latter was most likely due to removing some gold nanoparticles during Nafion deposition at such a high rate due to poor adhesion of gold to the quartz substrate.
To study the topology of the samples surfaces, they were characterized with AFM. Figure 4a displays a typical surface profile observed after dewetting of the gold film at 500 °C for 90 min. The surface contains closely packed, self-assembled gold nanoparticles with a height below 25 nm. Very smooth surfaces with RMS roughness below 1 nm were observed after Nafion deposition (Figure 4b–d).

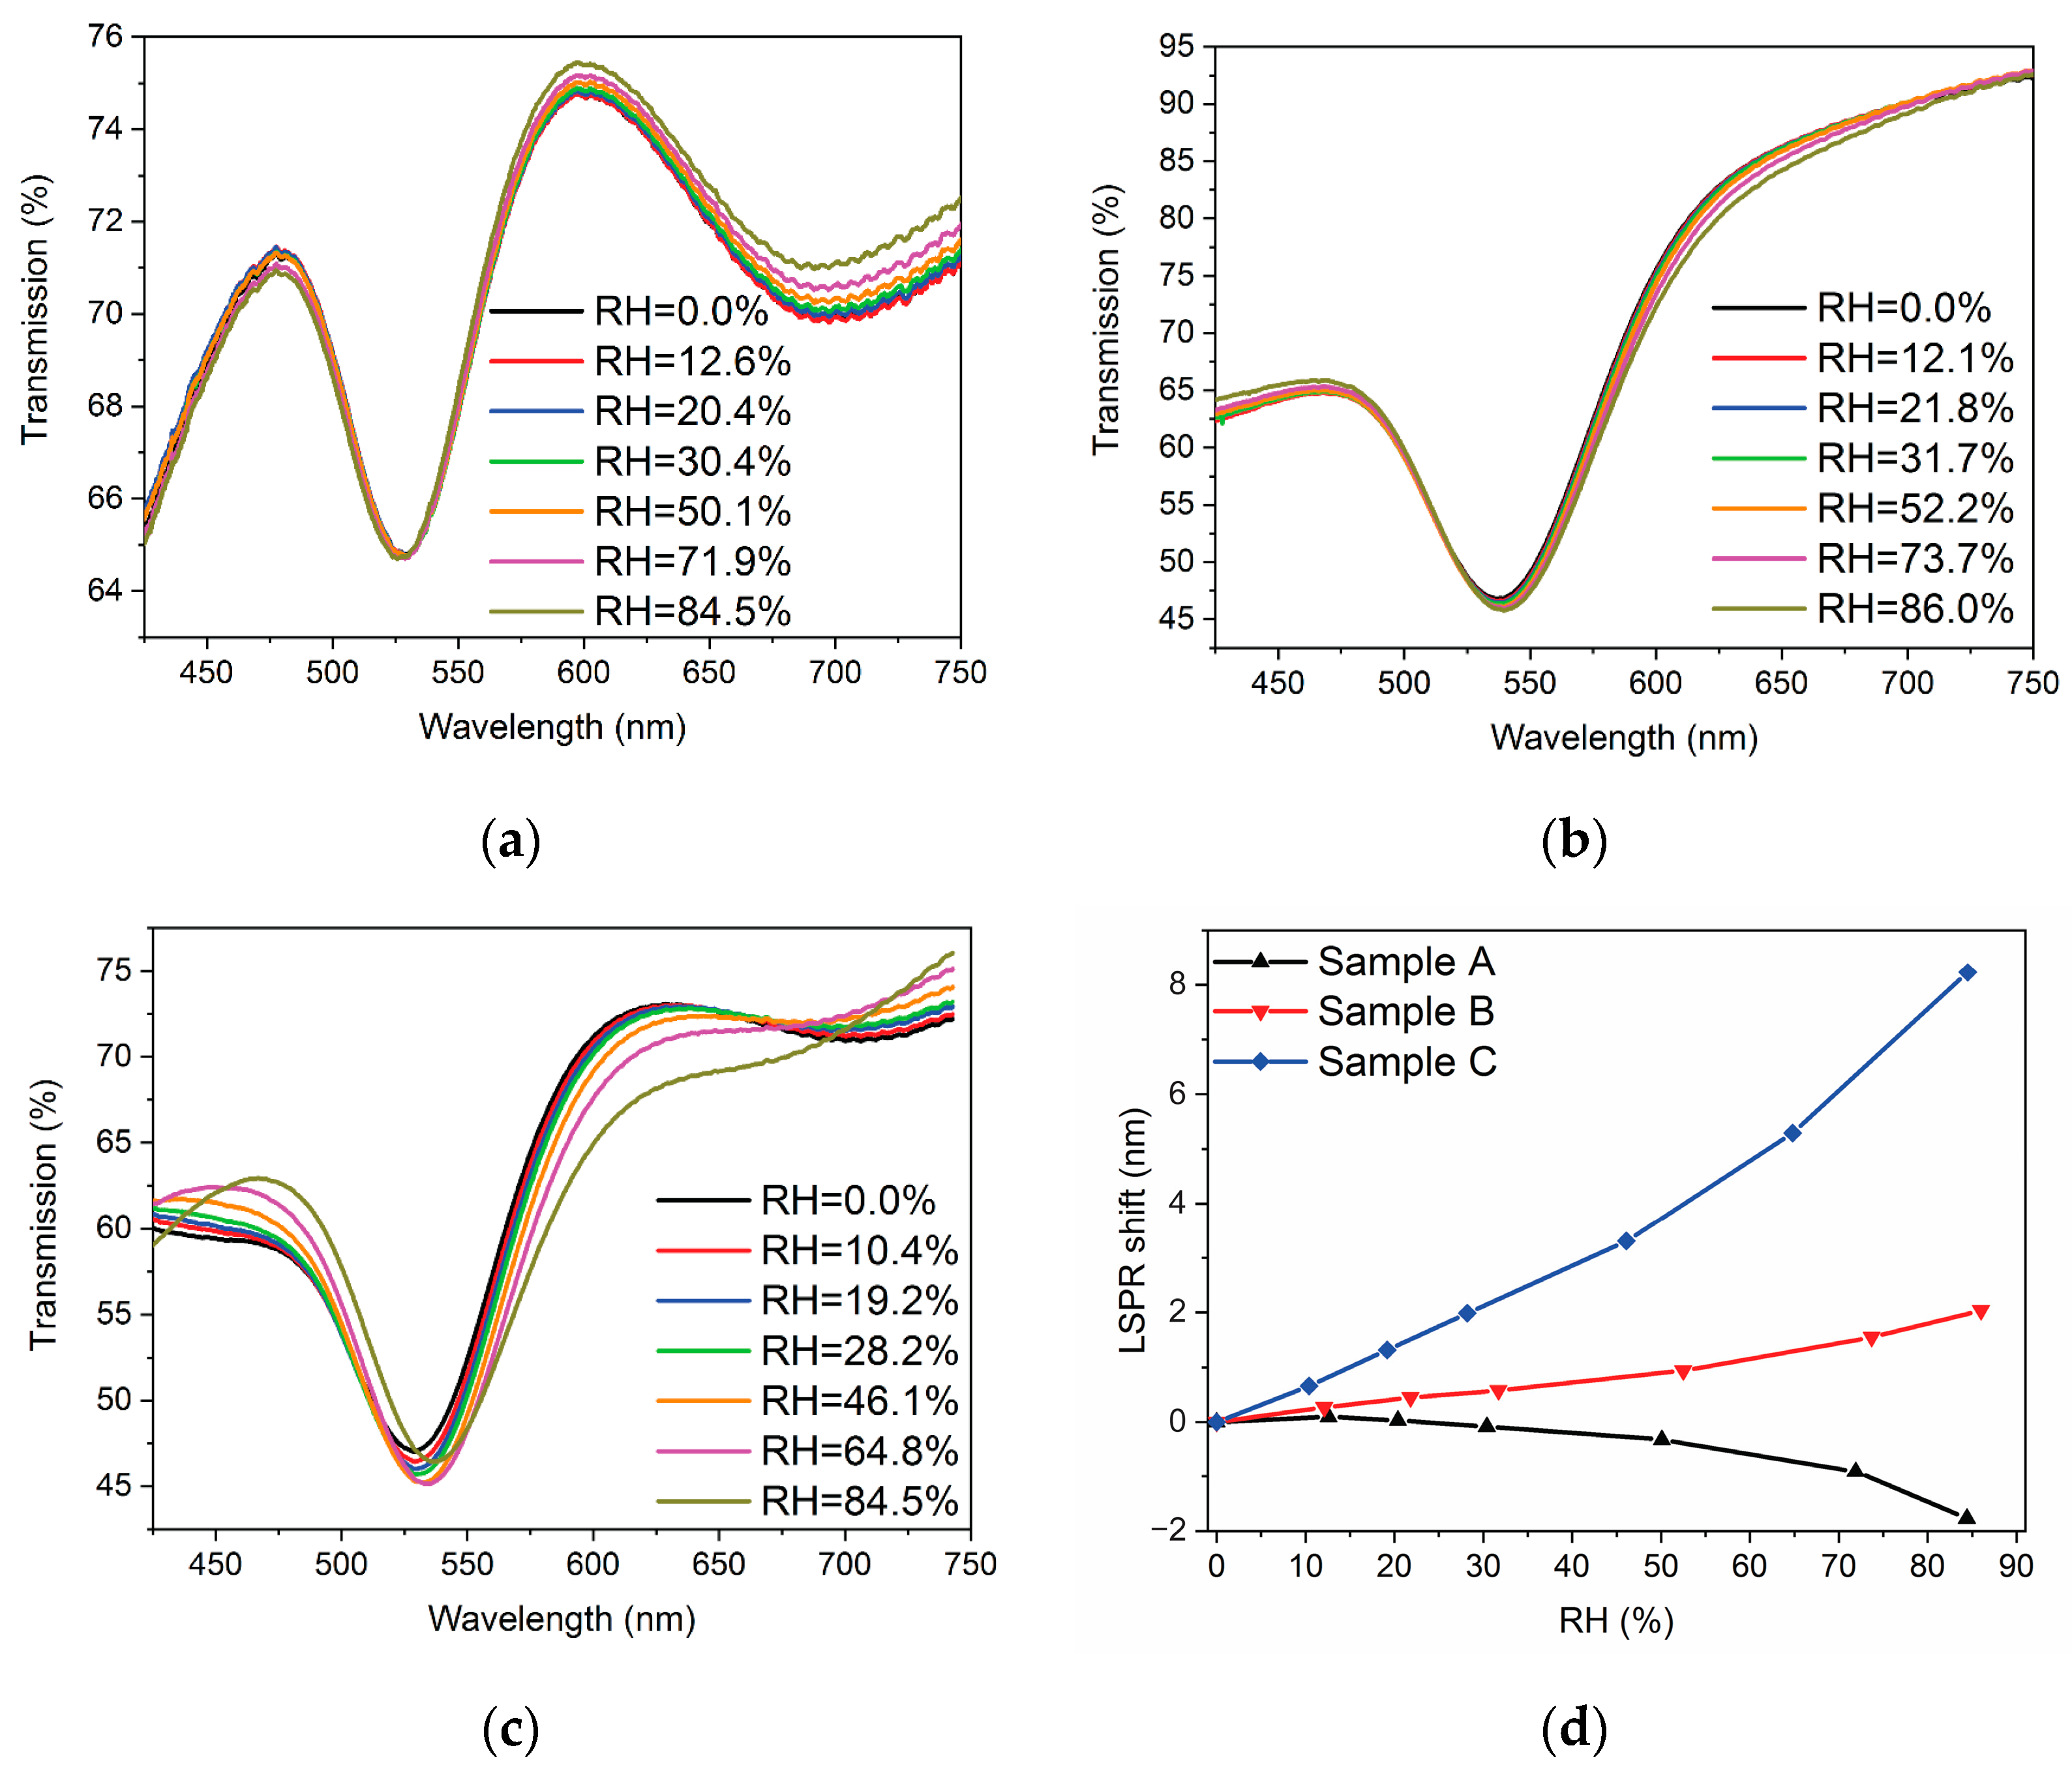
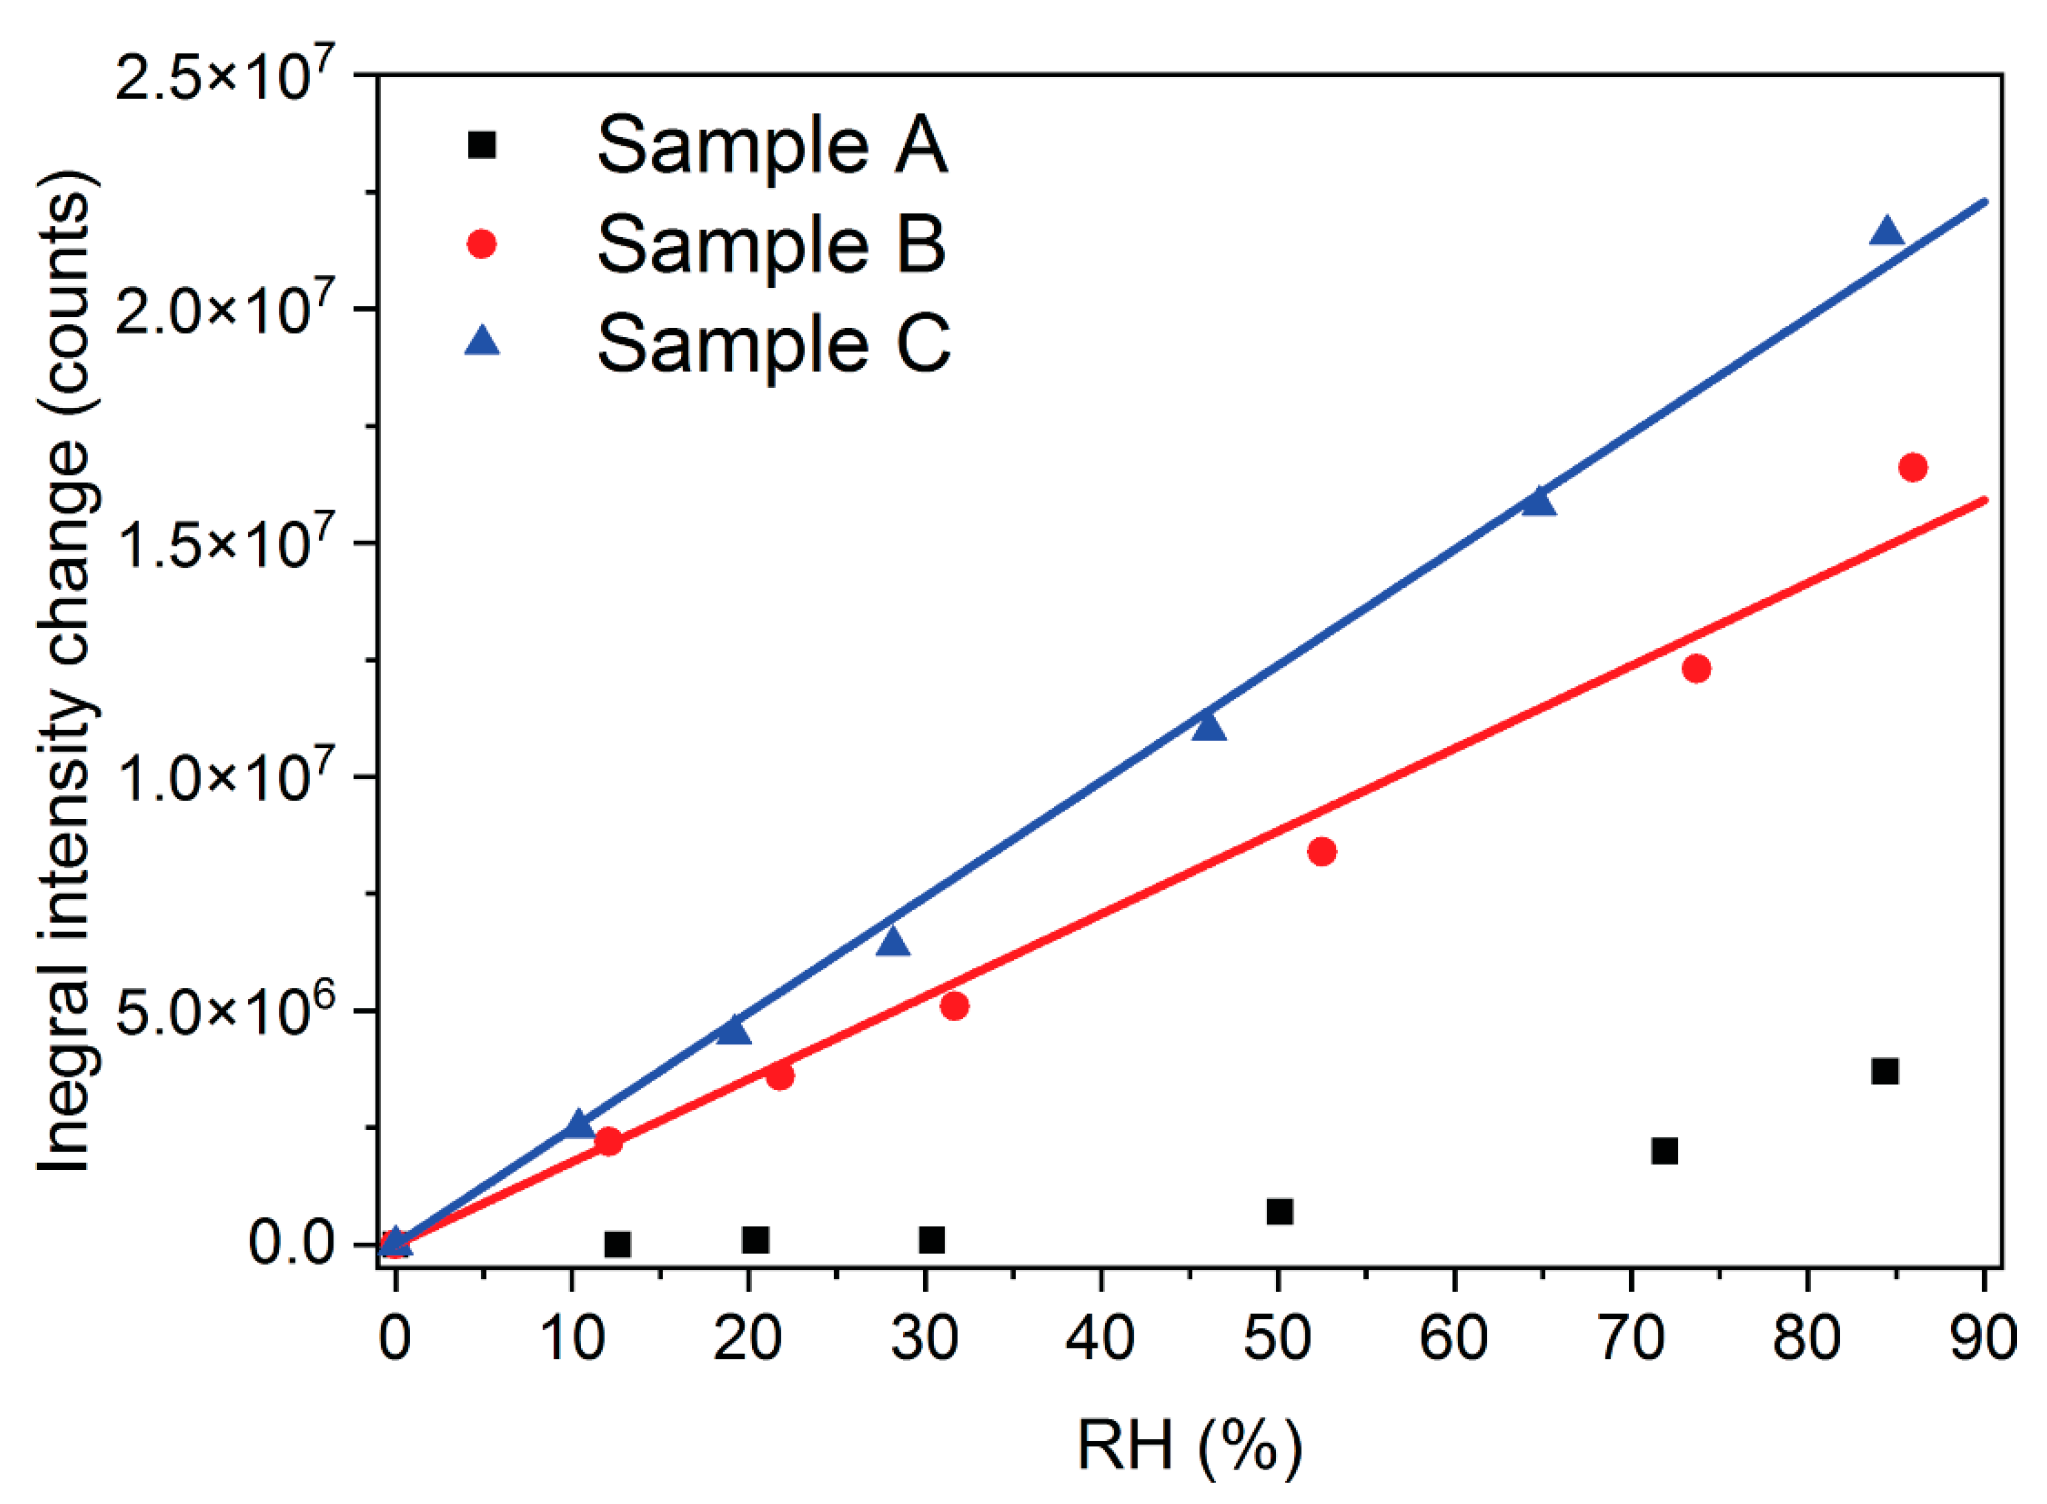
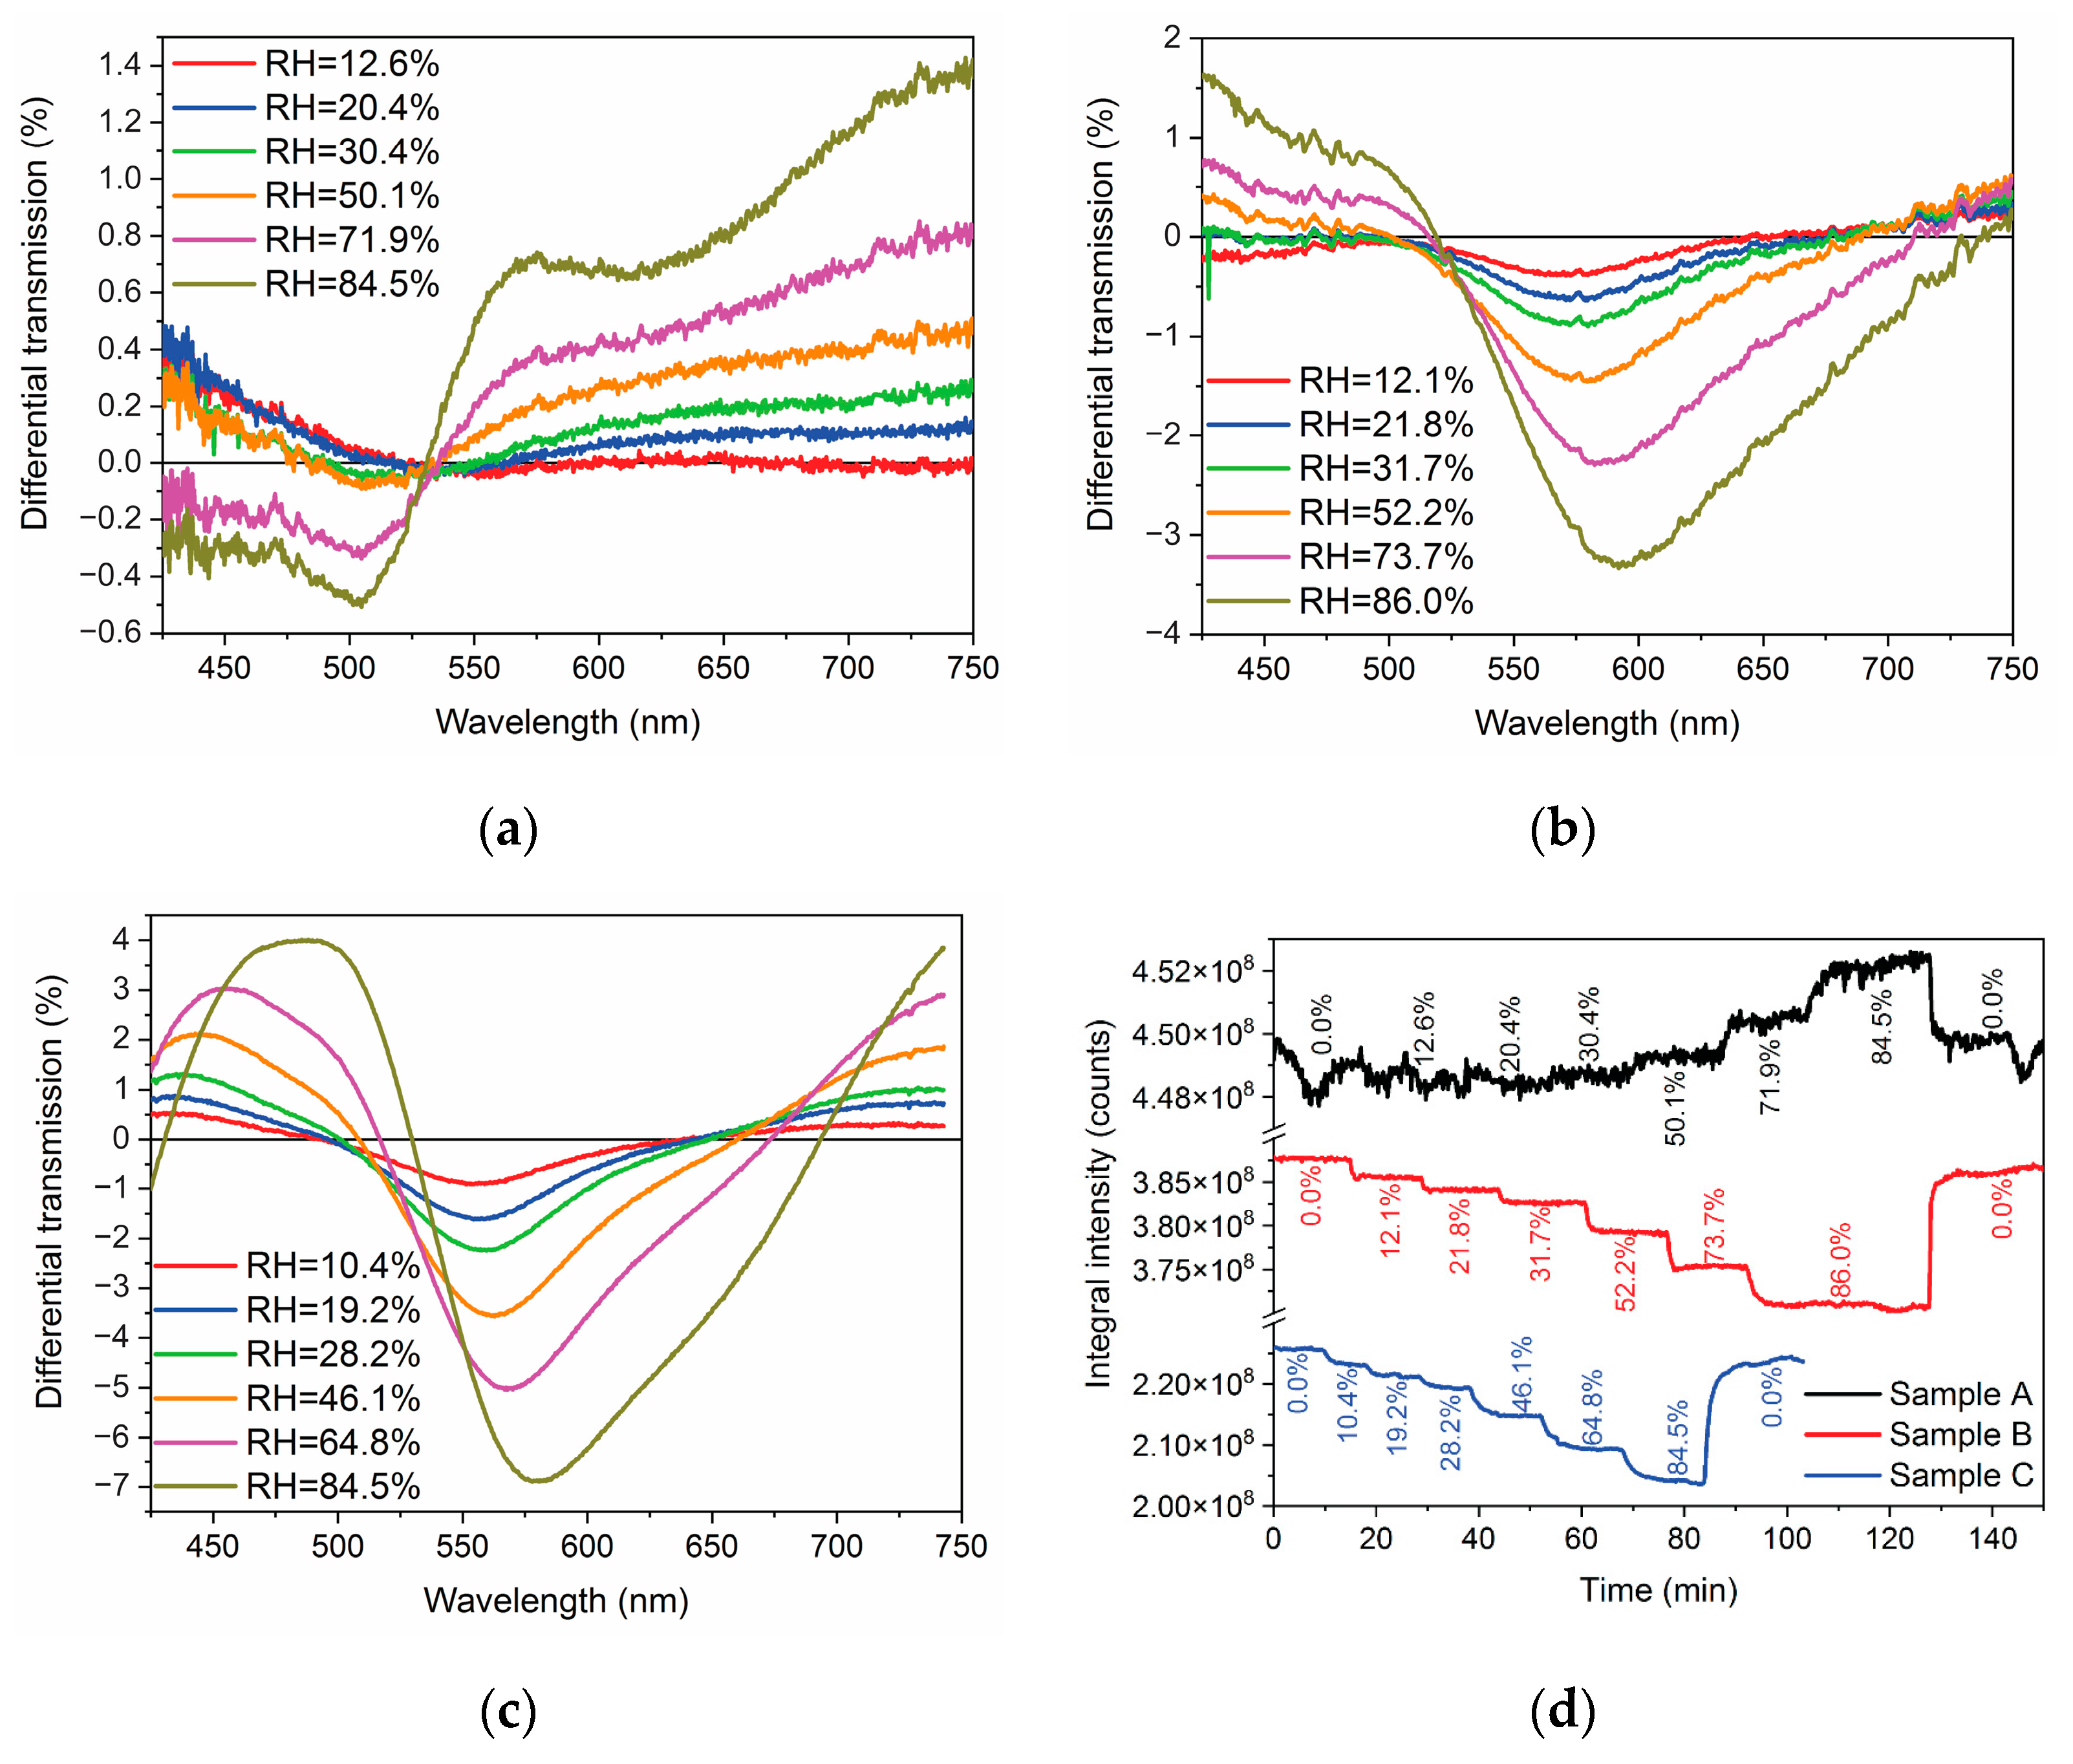
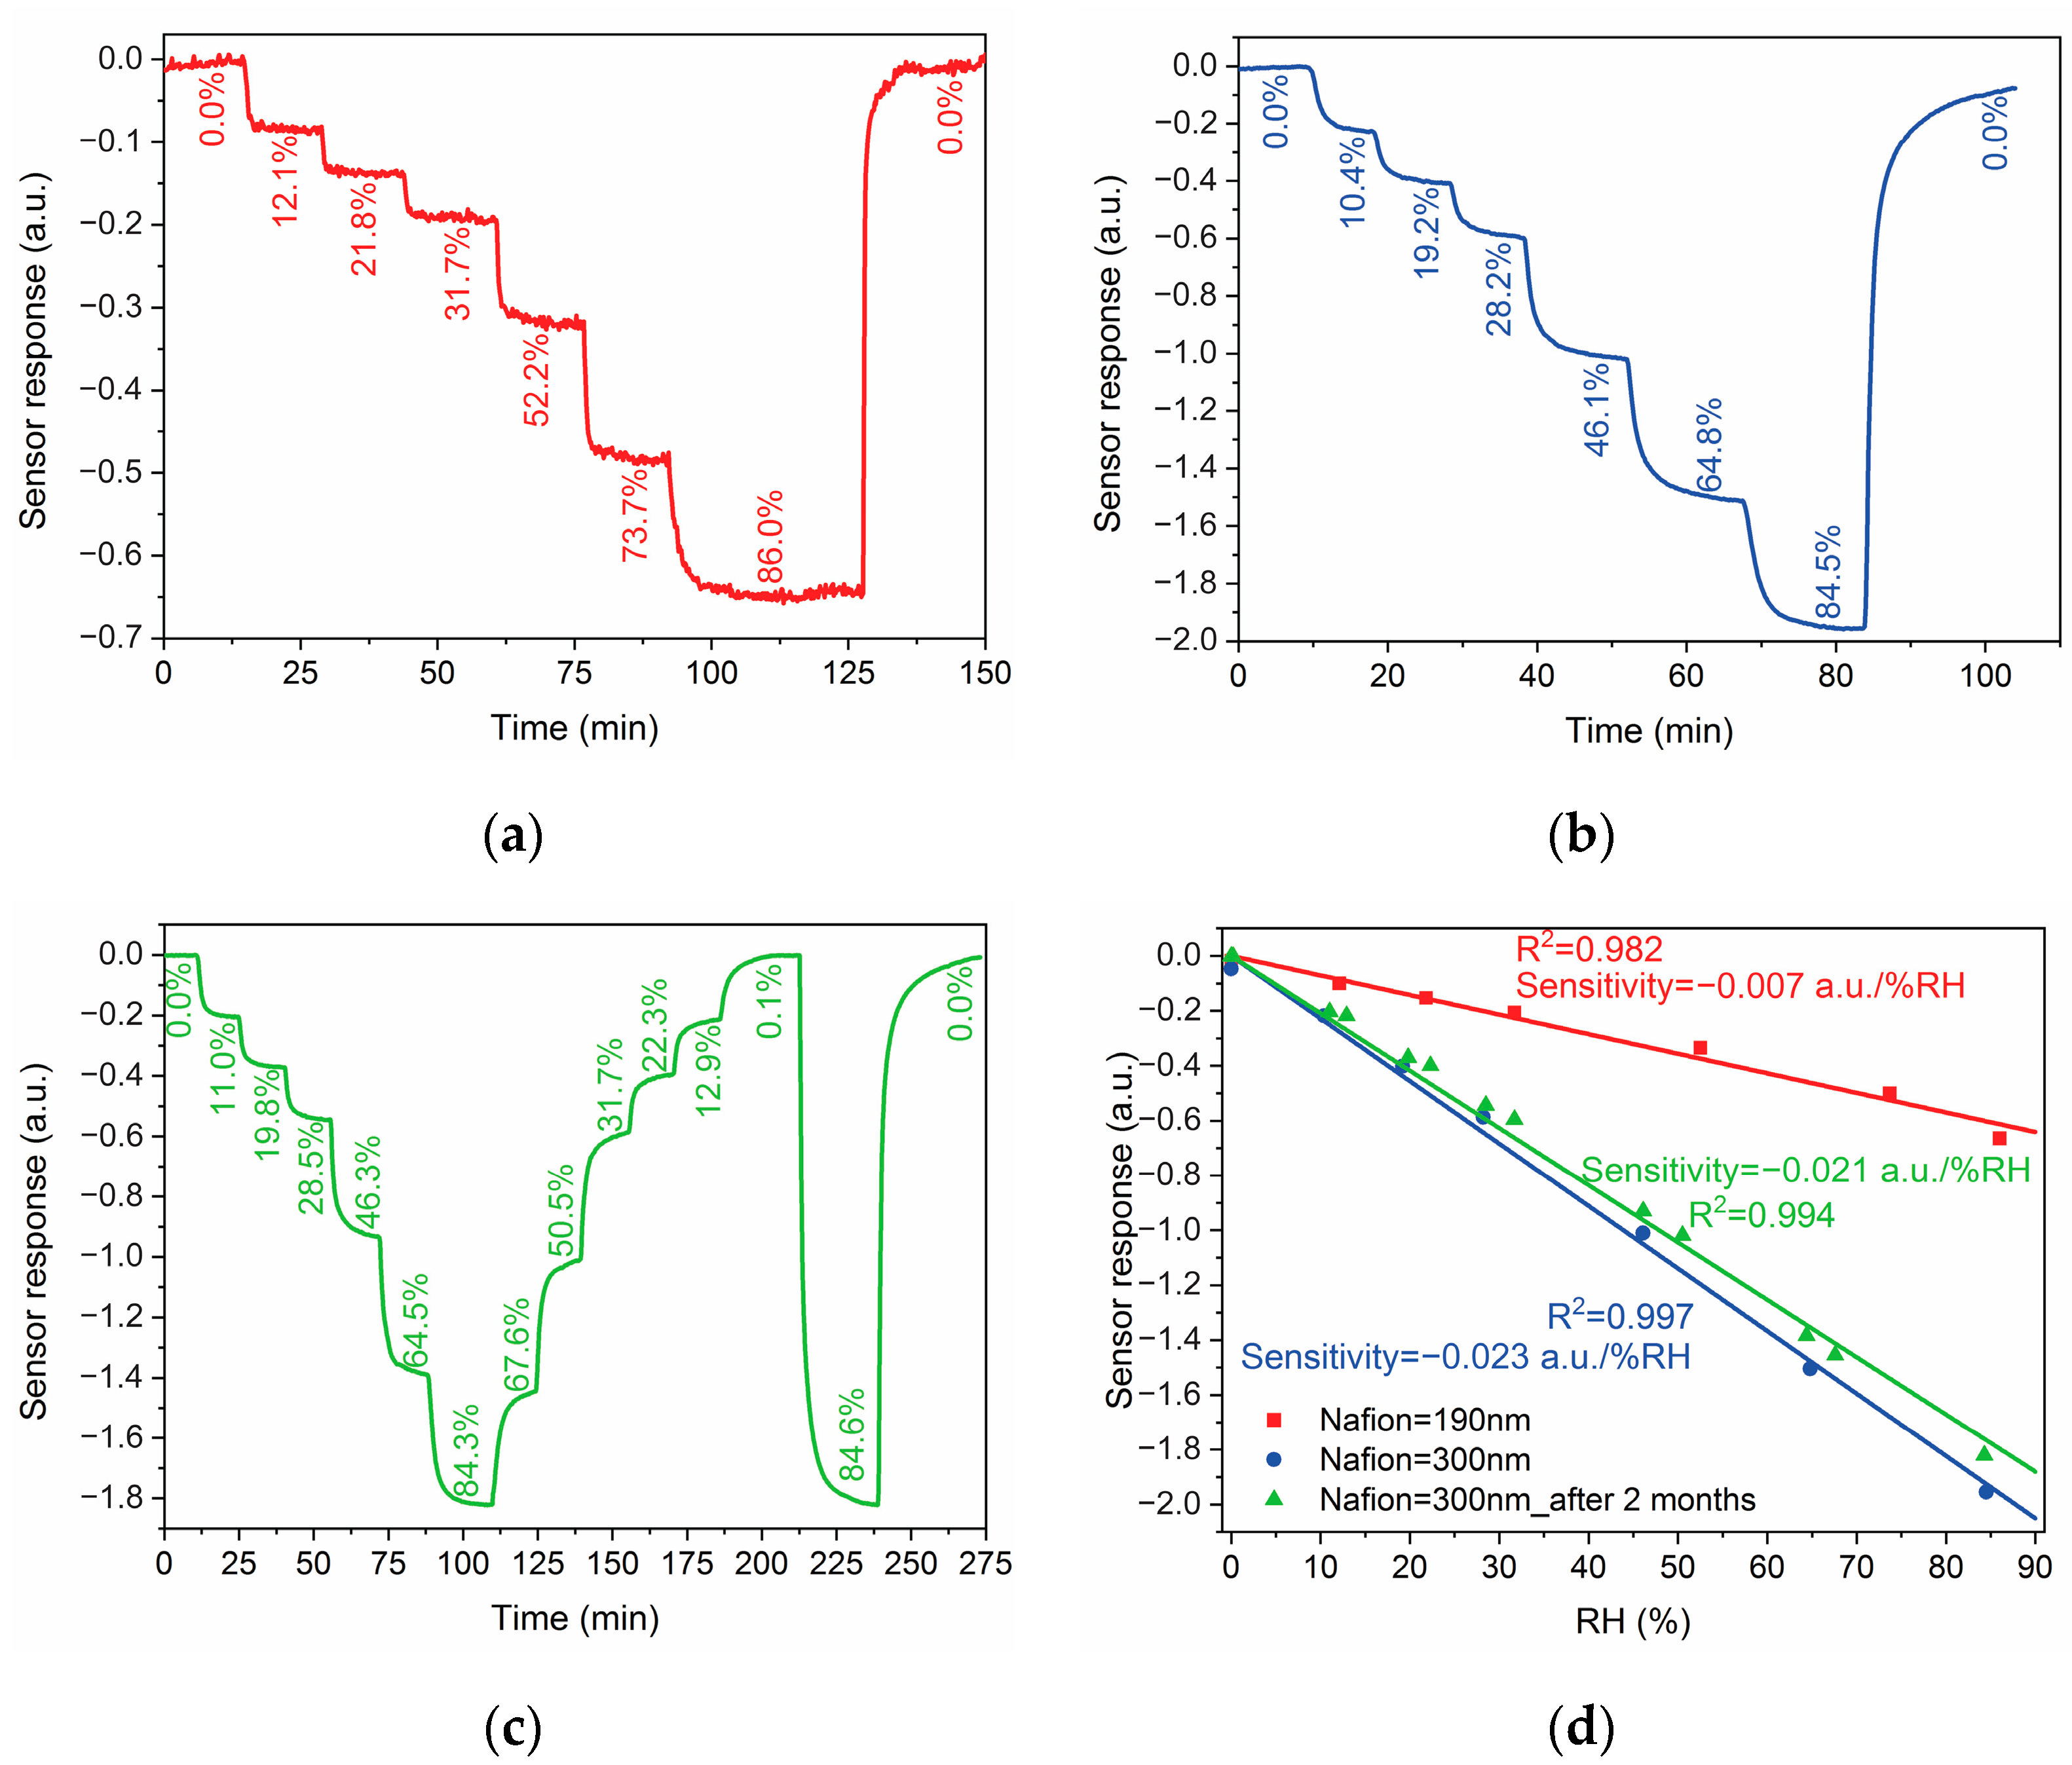
3.3. Relative Humidity Detection

Transmission spectra of the fabricated samples covered with Nafion films of different thicknesses were recorded during a controlled change of humidity in nitrogen gas flow. Selected spectra obtained at varied RH in the range of 0–85% are shown in Figure 5a–c. Sample A possessed a very weak dependence of the LSPR band location on humidity, while the most prominent changes in spectra were observed in the range of 600–750 nm due to a shift of interference fringes resulting from swelling Nafion film with humidity increase. Sample B showed no interference fringes, and only a weak long-wavelength shift of the LSPR band was observed. The LSPR band location in Sample C was also red-shifted with rising humidity levels. A conventional characteristic allowing direct comparison of various plasmonic RH sensors is a shift of the SPR band normalized to RH change. The dependence of the LSPR spectral shift on humidity is shown in Figure 5d, and it reveals a non-linear character for all samples. It should be noted that Sample A showed a blue shift, while the other samples possessed a red shift of the LSPR band with an increase in RH. The absolute average LSPR shifts over the 0–85% RH range were 0.020 nm/% RH, 0.024 nm/% RH, and 0.097 nm/% RH for samples A, B, and C, respectively. The obtained values are comparable with some publications (see [61,62,63,64] and tables therein), but far below the top results exceeding 2 nm/% RH for fiber optic humidity sensors [39,65,66] and reaching 5 nm/% RH for a side-polished SPR-based optical fiber sensor [29]. Most SPR-based sensors require a high-resolution spectrometer for the detection of SPR band shifts with changes in RH. This leads to an increase in fabrication costs and limits the miniaturization of the device.
Another typical method to detect humidity levels is the measurement of transmitted power in some spectral range [67,68]. To identify the spectral range with the most significant changes, differential spectra obtained from transmission spectra at variable RH by subtracting the spectrum of the corresponding sample in dry nitrogen were calculated (Figure 6a–c). In the case of Sample A, characterized by the lowest shift of the LSPR band with humidity, the largest response was observed in the red part of the visible spectrum, reaching an increment of transmission around 1.4% with a growth RH from 0% up to 84.5%. However, the transmission changes were mostly caused by the shift of interference fringes, with additional contributions from the LSPR band in the range between 525 nm and 625 nm. Samples B and C possessed maximal changes in transmission, around 3.5% and 7%, respectively, in the spectral range 550–600 nm associated with the long-wavelength shift of the LSPR band.
Figure 6d shows the temporal dependence of the change in integral intensity registered in the spectral range 550–600 nm (in the case of a sensor prototype, this value would be proportional to the optical power registered with a conventional photodetector). Due to minor changes in the transmission of Sample A, the response was undetectable in the range of RH below 30%. Moreover, the sample did not show a reversible response since the signal at dry nitrogen after being subjected to a wet atmosphere significantly differed from the initial one. On the other hand, the samples covered with thicker Nafion films possessed a linear response in all the studied RH ranges from 0% to 85%, with linearities of 98.3% and 99.7% (Figure 7). The limit of detection for sensors is typically calculated as 3σ/S, where σ is the standard deviation calculated in our case at dry nitrogen over 5 min, and S stands for sensitivity, defined as the slope of the response curve. The limits of detection of the samples were found to be 1.8% and 1.1% for samples B and C, respectively. The amplitude of the response for a change in RH from 0% to 85% was about 20% greater for Sample C compared to Sample B.
The limit of detection of the proposed sensitive elements can be enhanced by increasing the signal-to-noise ratio. The response curves shown in Figure 6d contained noise from the light source, detector, and other factors like mechanical vibration, for example. The noise of the detector was significantly reduced by a relatively long integration time of 10 s. To decrease noise from the light source related to temporal instability of emitted power, the remaining part of light (out of the 550–600 nm range related to the SPR band) transmitted through the sample can be detected in the second optical channel. Thus, the sensor response can be defined through the measured integral intensity (power in the case of a device) of transmitted light detected in two channels with the following expression:
SR = ([I550–600/(I425–550 + I600–750)]RH=Z% − [I550–600/(I425–550 + I600–750)]RH=0%) × 100
where SR is the sensor response, IX–Y is integral intensity of transmitted light in the wavelength range from X to Y nm, Z is the measured RH value.
Temporal dependencies of the sensors response for Samples B and C are shown in Figure 8a,b. Examples of the measured spectra of transmitted light at variable RHs are presented in Figure S1 in the Supplementary Materials. Dependence of the sensors response on humidity level also revealed linear character with sensitivity equaled to −0.007 a.u./% RH and −0.023 a.u./% RH (Figure 8d). Due to increase in the signal to noise ratio, the limit of detection of samples B and C was improved to 1.2% and 0.12% RH respectively.
As mentioned above, the long-term stability and hysteresis-free operation of a humidity sensor are important parameters for real applications. To analyze these characteristics, response of Sample C was measured after being stored for 2 months at ambient conditions. The sensors showed excellent stability as follows from the results presented in Figure 8c,d. Sensitivity of the stored sensor was found to be −0.021 a.u./% RH with limit of detection 0.13% RH that are in agreement with characteristics of as-fabricated sensor. Weak decrease in response amplitude of the Sample C after 2 months may be related to some inhomogeneity of the sample. The results of the experiment also showed almost hysteresis-free work with maximum difference at high humidity around 0.5% between linear fit curves (Figure S2), that below accuracy of the reference sensor.
Response (t90) and recovery (t10) times were estimated with a change in RH from 0% to about 85% and vice versa. Recovery times were calculated to be 150 s and 400 s for as-fabricated samples B and C, respectively. Sample C after 2 months showed a response time of 320 s and a recovery time of 400 s.
The possible implementation of the proposed sensor is presented in Figure S3. The sensor includes a white light source that can be a conventional, low-cost white LED, a gas cell with the sensitive element based on a self-assembled gold nanoparticle array covered with Nafion, a Bragg mirror reflecting light in the 550–650 nm wavelength range, two Si photodetectors, and electronics to divide output signals from the photodetectors to each other. Moreover, optical fiber implementation of the proposed sensor is also possible with the deposition of gold on bare optical fibers with subsequent annealing and deposition of Nafion, similar to other SPR-based optical fiber humidity sensors.
A comparison of the performance characteristics of the developed sensor with those of other optical humidity sensors is presented in Table 1. As mentioned in the introduction, the pursuit of significant improvement in one parameter often results in the worsening of the others. That is why sensors with fast response and a low limit of detection are usually characterized by a narrow dynamic range, and vice versa. Our results show that a very simple and low-cost optical humidity sensor with a wide dynamic range, a linear response, and a low limit of detection can be successfully realized with a low cost of response/recovery time. The proposed sensor may find applications where high accuracy of RH detection is required but there is no need for a fast response; for example, calibration or correction of other gas sensor readouts can be performed. However, it is worth noting that further experiments on the sensor’s deterioration during cycles of humidifying/drying in various atmospheres, studies on its temperature sensitivity, etc. must be performed.

4. Conclusions

Optical humidity sensors based on LSPR of self-assembled gold nanoparticles obtained by thermal annealing of gold thin films and covered with Nafion thin films were fabricated and studied. With simple measurement of transmitted light integral intensity in two optical channels, the proposed sensor was shown to possess a reversible linear response in the wide dynamic range from 0% to 85% RH and an excellent limit of detection down to 0.12%, even with the relatively low absolute spectral shift of LSPR 0.097 nm/% RH. Further improvement of the sensor characteristics is possible with an increase in the quality factor of the gold nanoparticle array by repeated cycles of thin gold deposition and annealing [55] or periodic nanostructures [69,70]. We believe that the results of our study will not only provide a new convenient pathway for the design of gas sensors but also demonstrate a new concept for the development of LSPR-based humidity detection.

Supplementary Materials

The following supporting information can be downloaded at: https://www.mdpi.com/article/10.3390/photonics10090975/s1. Figure S1: Transmitted light spectra measured at different relative humidity levels in a nitrogen atmosphere for Nafion film thicknesses of 130 nm (a), 190 nm (b), and 300 nm (c). The spectra were used to calculate the sensor response. Figure S2: Response of Sample C for 2 months stored in ambient conditions to RH from dry to humidified nitrogen and in the reverse direction. Figure S3: Schema of the proposed optical humidity sensor based on LSPR of self-assembled gold nanoparticles covered with Nafion thin film.

Author Contributions

Conceptualization, Y.S. and A.B.; methodology, P.T., A.S. and G.Y.; validation, Y.S., A.S. and G.Y.; formal analysis, Y.S.; investigation, Y.S. and A.S.; writing—original draft preparation, Y.S., P.T. and A.S.; writing—review and editing, G.Y. and A.B.; supervision, A.B. All authors have read and agreed to the published version of the manuscript.

Funding

This research received no external funding.

Informed Consent Statement

Not applicable.

Data Availability Statement

The data underlying the presented results are not publicly available but may be obtained from the authors upon reasonable request.

Conflicts of Interest

The authors declare no conflict of interest.

References

  1. Wang, Y.; Zhou, Y. Recent Progress on Anti-Humidity Strategies of Chemiresistive Gas Sensors. Materials 2022, 15, 8728. [Google Scholar] [CrossRef] [PubMed]
  2. Tian, H.; Fan, H.; Li, M.; Ma, L. Zeolitic Imidazolate Framework Coated ZnO Nanorods as Molecular Sieving to Improve Selectivity of Formaldehyde Gas Sensor. ACS Sens. 2016, 1, 243–250. [Google Scholar] [CrossRef]
  3. Yao, Y.; Chen, X.; Guo, H.; Wu, Z. Graphene oxide thin film coated quartz crystal microbalance for humidity detection. Appl. Surf. Sci. 2011, 257, 7778–7782. [Google Scholar] [CrossRef]
  4. Fauzi, F.; Rianjanu, A.; Santoso, I.; Triyana, K. Gas and humidity sensing with quartz crystal microbalance (QCM) coated with graphene-based materials—A mini review. Sens. Actuators A Phys. 2021, 330, 112837. [Google Scholar] [CrossRef]
  5. Rivadeneyra, A.; Fernández-Salmerón, J.; Agudo, M.; López-Villanueva, J.A.; Capitan-Vallvey, L.F.; Palma, A.J. Design and characterization of a low thermal drift capacitive humidity sensor by inkjet-printing. Sens. Actuators B Chem. 2014, 195, 123–131. [Google Scholar] [CrossRef]
  6. Boudaden, J.; Steinmaßl, M.; Endres, H.E.; Drost, A.; Eisele, I.; Kutter, C.; Müller-Buschbaum, P. Polyimide-based capacitive humidity sensor. Sensors 2018, 18, 1516. [Google Scholar] [CrossRef]
  7. Smith, A.D.; Elgammal, K.; Niklaus, F.; Delin, A.; Fischer, A.C.; Vaziri, S.; Forsberg, F.; Råsander, M.; Hugosson, H.; Bergqvist, L.; et al. Resistive graphene humidity sensors with rapid and direct electrical readout. Nanoscale 2015, 7, 19099–19109. [Google Scholar] [CrossRef]
  8. Farahani, H.; Wagiran, R.; Hamidon, M.N. Humidity sensors principle, mechanism, and fabrication technologies: A comprehensive review. Sensors 2014, 14, 7881–7939. [Google Scholar] [CrossRef]
  9. Pazniak, H.; Varezhnikov, A.S.; Kolosov, D.A.; Plugin, I.A.; Vito, A.D.; Glukhova, O.E.; Sheverdyaeva, P.M.; Spasova, M.; Kaikov, I.; Kolesnikov, E.A.; et al. 2D Molybdenum Carbide MXenes for Enhanced Selective Detection of Humidity in Air. Adv. Mater. 2021, 33, 2104878. [Google Scholar] [CrossRef] [PubMed]
  10. Li, P.; Yu, S.; Zhang, H. Preparation and performance analysis of ag/zno humidity sensor. Sensors 2021, 21, 857. [Google Scholar] [CrossRef] [PubMed]
  11. Dong, H.; Zhang, L.-X.; Xu, H.; Yin, Y.-Y.; Zhao, X.-B.; Bie, L.-J. H-bonding interactions enable a 3D pillared cobalt (II) coordination polymer for touchless finger moisture detection. Tungsten 2023, 5, 109–117. [Google Scholar] [CrossRef]
  12. Jiang, Y.; Duan, Z.; Fan, Z.; Yao, P.; Yuan, Z.; Jiang, Y.; Cao, Y.; Tai, H. Power generation humidity sensor based on NaCl/halloysite nanotubes for respiratory patterns monitoring. Sens. Actuators B Chem. 2023, 380, 133396. [Google Scholar] [CrossRef]
  13. Qin, J.; Yang, X.; Shen, C.; Chang, Y.; Deng, Y.; Zhang, Z.; Liu, H.; Lv, C.; Li, Y.; Zhang, C.; et al. Carbon nanodot-based humidity sensor for self-powered respiratory monitoring. Nano Energy 2022, 101, 107549. [Google Scholar] [CrossRef]
  14. Guo, Y.; Xi, H.; Gu, Z.; Li, M.; Li, X.; Gao, D. A self-powered PVA-based flexible humidity sensor with humidity-related voltage output for multifunctional applications. Colloids Surf. A Physicochem. Eng. Asp. 2023, 658, 130700. [Google Scholar] [CrossRef]
  15. Chen, M.; Xue, S.; Liu, L.; Li, Z.; Wang, H.; Tan, C.; Yang, J.; Hu, X.; Jiang, X.F.; Cheng, Y.; et al. A highly stable optical humidity sensors based on nano-composite film. Sens. Actuators B Chem. 2019, 287, 329–337. [Google Scholar] [CrossRef]
  16. Xu, W.; Li, F.; Cai, Z.; Wang, Y.; Luo, F.; Chen, X. An ultrasensitive and reversible fluorescence sensor of humidity using perovskite CH3NH3PbBr3. J. Mater. Chem. C 2016, 4, 9651–9655. [Google Scholar] [CrossRef]
  17. Gao, Y.-J.; Romolini, G.; Huang, H.; Jin, H.; Saha, R.A.; Ghosh, B.; De Ras, M.; Wang, C.; Steele, J.A.; Debroye, E.; et al. Ultrasensitive turn-on luminescence humidity sensor based on a perovskite/zeolite composite. J. Mater. Chem. C 2022, 10, 12191–12196. [Google Scholar] [CrossRef]
  18. Xu, Y.; Zhao, X.; Li, Y.; Qin, Z.; Pang, Y.; Liu, Z. Simultaneous measurement of relative humidity and temperature based on forward Brillouin scattering in polyimide-overlaid fiber. Sens. Actuators B Chem. 2021, 348, 130702. [Google Scholar] [CrossRef]
  19. Karapanagiotis, C.; Hicke, K.; Wosniok, A.; Krebber, K. Distributed humidity fiber-optic sensor based on BOFDA using a simple machine learning approach. Opt. Express 2022, 30, 12484. [Google Scholar] [CrossRef]
  20. Kronenberg, P.; Rastogi, P.K.; Giaccari, P.; Limberger, H.G. Relative humidity sensor with optical fiber Bragg gratings. Opt. Lett. 2002, 27, 1385. [Google Scholar] [CrossRef]
  21. Miao, Y.; Liu, B.; Zhang, H.; Li, Y.; Zhou, H.; Sun, H.; Zhang, W.; Zhao, Q. Relative humidity sensor based on tilted fiber Bragg grating with polyvinyl alcohol coating. IEEE Photonics Technol. Lett. 2009, 21, 441–443. [Google Scholar] [CrossRef]
  22. Ascorbe, J.; Corres, J.M.; Arregui, F.J.; Matias, I.R. Recent developments in fiber optics humidity sensors. Sensors 2017, 17, 893. [Google Scholar] [CrossRef]
  23. Wu, S.; Yan, G.; Lian, Z.; Chen, X.; Zhou, B.; He, S. An open-cavity Fabry-Perot interferometer with PVA coating for simultaneous measurement of relative humidity and temperature. Sens. Actuators B Chem. 2016, 225, 50–56. [Google Scholar] [CrossRef]
  24. Santos, J.S.; Raimundo, I.M.; Cordeiro, C.M.B.; Biazoli, C.R.; Gouveia, C.A.J.; Jorge, P.A.S. Characterisation of a Nafion film by optical fibre Fabry-Perot interferometry for humidity sensing. Sens. Actuators B Chem. 2014, 196, 99–105. [Google Scholar] [CrossRef]
  25. Baryshev, A.; Fujikawa, R.; Khanikaev, A.; Granovsky, A.; Shin, K.-H.; Lim, P.-B.; Inoue, M. Mesoporous photonic crystals for sensor applications. In Photonic Crystals and Photonic Crystal Fibers for Sensing Applications II; Du, H.H., Bise, R., Eds.; SPIE: San Diego, CA, USA, 2006; p. 63690B. [Google Scholar]
  26. Kou, D.; Ma, W.; Zhang, S.; Lutkenhaus, J.L.; Tang, B. High-Performance and Multifunctional Colorimetric Humidity Sensors Based on Mesoporous Photonic Crystals and Nanogels. ACS Appl. Mater. Interfaces 2018, 10, 41645–41654. [Google Scholar] [CrossRef] [PubMed]
  27. Liu, L.L.; Korposh, S.; Gomez, D.; Correia, R.; Hayes-Gill, B.R.; Morgan, S.P. Localised plasmonic hybridisation mode optical fibre sensing of relative humidity. Sens. Actuators B Chem. 2022, 353, 131157. [Google Scholar] [CrossRef]
  28. Chen, W.; Wu, G.; Zhang, M.; Greybush, N.J.; Howard-Jennings, J.P.; Song, N.; Stinner, F.S.; Yang, S.; Kagan, C.R. Angle-Independent Optical Moisture Sensors Based on Hydrogel-Coated Plasmonic Lattice Arrays. ACS Appl. Nano Mater. 2018, 1, 1430–1437. [Google Scholar] [CrossRef]
  29. Wang, Y.; Wang, J.; Shao, Y.; Liao, C.; Wang, Y. Highly sensitive surface plasmon resonance humidity sensor based on a polyvinyl-alcohol-coated polymer optical fiber. Biosensors 2021, 11, 461. [Google Scholar] [CrossRef]
  30. Kornienko, V.V.; Nechepurenko, I.A.; Tananaev, P.N.; Chubchev, E.D.; Baburin, A.S.; Echeistov, V.V.; Zverev, A.V.; Novoselov, I.I.; Kruglov, I.A.; Rodionov, I.A.; et al. Machine Learning for Optical Gas Sensing: A Leaky-Mode Humidity Sensor as Example. IEEE Sens. J. 2020, 20, 6954–6963. [Google Scholar] [CrossRef]
  31. Rivero, P.J.; Urrutia, A.; Goicoechea, J.; Arregui, F.J. Optical fiber humidity sensors based on Localized Surface Plasmon Resonance (LSPR) and Lossy-mode resonance (LMR) in overlays loaded with silver nanoparticles. Sens. Actuators B Chem. 2012, 173, 244–249. [Google Scholar] [CrossRef]
  32. Liu, Y.; Zhang, Y.; Lei, H.; Song, J.; Chen, H.; Li, B. Growth of well-arrayed ZnO nanorods on thinned silica fiber and application for humidity sensing. Opt. Express 2012, 20, 19404. [Google Scholar] [CrossRef] [PubMed]
  33. Zhang, X.; Lv, J.; Liu, J.; Xu, S.; Sun, J.; Wang, L.; Xu, L.; Mintova, S.; Song, H.; Dong, B. Stable EMT type zeolite/CsPbBr3 perovskite quantum dot nanocomposites for highly sensitive humidity sensors. J. Colloid Interface Sci. 2022, 616, 921–928. [Google Scholar] [CrossRef] [PubMed]
  34. Yuan, W.; Qian, H.; Liu, Y.; Wang, Z.; Yu, C. Highly sensitive temperature and humidity sensor based on carbon nanotube-assisted mismatched single-mode fiber structure. Micromachines 2019, 10, 521. [Google Scholar] [CrossRef] [PubMed]
  35. Huang, Y.; Zhu, W.; Li, Z.; Chen, G.; Chen, L.; Zhou, J.; Lin, H.; Guan, J.; Fang, W.; Liu, X.; et al. High-performance fibre-optic humidity sensor based on a side-polished fibre wavelength selectively coupled with graphene oxide film. Sens. Actuators B Chem. 2018, 255, 57–69. [Google Scholar] [CrossRef]
  36. Li, T.; Dong, X.; Chan, C.C.; Ni, K.; Zhang, S.; Shum, P.P. Humidity sensor with a PVA-coated photonic crystal fiber interferometer. IEEE Sens. J. 2013, 13, 2214–2216. [Google Scholar] [CrossRef]
  37. Chen, L.H.; Li, T.; Chan, C.C.; Menon, R.; Balamurali, P.; Shaillender, M.; Neu, B.; Ang, X.M.; Zu, P.; Wong, W.C.; et al. Chitosan based fiber-optic Fabry-Perot humidity sensor. Sens. Actuators B Chem. 2012, 169, 167–172. [Google Scholar] [CrossRef]
  38. Acikgoz, S.; Bilen, B.; Muamer Demir, M.; Ziya Menceloglu, Y.; Skarlatos, Y.; Aktas, G.; Inci, M.N. Use of Polyethylene Glycol Coatings for Optical Fibre Humidity Sensing. Opt. Rev. 2008, 15, 84–90. [Google Scholar] [CrossRef]
  39. Liu, S.; Ji, Y.; Yang, J.; Sun, W.; Li, H. Nafion film temperature/humidity sensing based on optical fiber Fabry-Perot interference. Sens. Actuators A Phys. 2018, 269, 313–321. [Google Scholar] [CrossRef]
  40. Maciak, E. Low-coherence interferometric fiber optic sensor for humidity monitoring based on nafion® thin film. Sensors 2019, 19, 629. [Google Scholar] [CrossRef]
  41. Li, L.; Tian, X.; Meng, D.; Collins, M.; Wang, J.; Patterson, R.; Nguyen, L.; Yi, X. Processing, Characterization, and Impact of Nafion Thin Film on Photonic Nanowaveguides for Humidity Sensing. Adv. Photonics Res. 2022, 3, 2100181. [Google Scholar] [CrossRef]
  42. Powell, A.W.; Coles, D.M.; Taylor, R.A.; Watt, A.A.R.; Assender, H.E.; Smith, J.M. Plasmonic Gas Sensing Using Nanocube Patch Antennas. Adv. Opt. Mater. 2016, 4, 634–642. [Google Scholar] [CrossRef]
  43. Peltonen, A.; Etula, J.; Seitsonen, J.; Engelhardt, P.; Laurila, T. Three-Dimensional Fine Structure of Nanometer-Scale Nafion Thin Films. ACS Appl. Polym. Mater. 2021, 3, 1078–1086. [Google Scholar] [CrossRef]
  44. Pantelić, N.; Wansapura, C.M.; Heineman, W.R.; Seliskar, C.J. Dynamic in situ spectroscopic ellipsometry of the reaction of aqueous iron(II) with 2,2′-bipyridine in a thin nafion film. J. Phys. Chem. B 2005, 109, 13971–13979. [Google Scholar] [CrossRef] [PubMed]
  45. Paul, D.K.; Karan, K.; Docoslis, A.; Giorgi, J.B.; Pearce, J. Characteristics of self-assembled ultrathin Nafion films. Macromolecules 2013, 46, 3461–3475. [Google Scholar] [CrossRef]
  46. Petrina, S.A. Water Sorption, Viscoelastic, and Optical Properties of Thin NafionRTM Films; Pennsylvania State University: State College, PA, USA, 2013. [Google Scholar]
  47. Modestino, M.A.; Paul, D.K.; Dishari, S.; Petrina, S.A.; Allen, F.I.; Hickner, M.A.; Karan, K.; Segalman, R.A.; Weber, A.Z. Self-assembly and transport limitations in confined nafion films. Macromolecules 2013, 46, 867–873. [Google Scholar] [CrossRef]
  48. Available online: https://www.eksis.ru/catalog/izmeritelnye-preobrazovateli-ipvt-08/product4076.php (accessed on 23 August 2023).
  49. Badilescu, S.; Raju, D.; Bathini, S.; Packirisamy, M. Gold nano-island platforms for localized surface plasmon resonance sensing: A short review. Molecules 2020, 25, 4661. [Google Scholar] [CrossRef]
  50. Łapiński, M.; Kozioł, R.; Cymann, A.; Sadowski, W.; Kościelska, B. Substrate Dependence in the Formation of Au Nanoislands for Plasmonic Platform Application. Plasmonics 2020, 15, 101–107. [Google Scholar] [CrossRef]
  51. Sun, H.; Yu, M.; Wang, G.; Sun, X.; Lian, J. Temperature-dependent morphology evolution and surface plasmon absorption of ultrathin gold island films. J. Phys. Chem. C 2012, 116, 9000–9008. [Google Scholar] [CrossRef]
  52. Zhang, X.; Zhang, J.; Wang, H.; Hao, Y.; Zhang, X.; Wang, T.; Wang, Y.; Zhao, R.; Zhang, H.; Yang, B. Thermal-induced surface plasmon band shift of gold nanoparticle monolayer: Morphology and refractive index sensitivity. Nanotechnology 2010, 21, 465702. [Google Scholar] [CrossRef]
  53. Karakouz, T.; Holder, D.; Goomanovsky, M.; Vaskevich, A.; Rubinstein, I. Morphology and refractive index sensitivity of gold island films. Chem. Mater. 2009, 21, 5875–5885. [Google Scholar] [CrossRef]
  54. Myroshnychenko, V.; Rodríguez-Fernández, J.; Pastoriza-Santos, I.; Funston, A.M.; Novo, C.; Mulvaney, P.; Liz-Marzán, L.M.; García de Abajo, F.J. Modelling the optical response of gold nanoparticles. Chem. Soc. Rev. 2008, 37, 1792–1805. [Google Scholar] [CrossRef] [PubMed]
  55. Kang, M.; Park, S.G.; Jeong, K.H. Repeated Solid-state Dewetting of Thin Gold Films for Nanogap-rich Plasmonic Nanoislands. Sci. Rep. 2015, 5, 14790. [Google Scholar] [CrossRef] [PubMed]
  56. Pelton, M. Modified spontaneous emission in nanophotonic structures. Nat. Photonics 2015, 9, 427–435. [Google Scholar] [CrossRef]
  57. Fu, Y.; Qing, Y.M.; Li, Z.; Zayats, A.V.; Lei, D. Tale of Two Resonances: Waveguide–Plasmon Coupling and High Q-Factor Engineering on the Nanoscale. ACS Photonics 2023, 10, 2–12. [Google Scholar] [CrossRef]
  58. Lilley, G.; Messner, M.; Unterrainer, K. Improving the quality factor of the localized surface plasmon resonance. Opt. Mater. Express 2015, 5, 2112. [Google Scholar] [CrossRef]
  59. Lo Presti, D.; Massaroni, C.; Piemonte, V.; Saccomandi, P.; D’Amato, R.; Caponero, M.A.; Schena, E. Agar-Coated Fiber Bragg Grating Sensor for Relative Humidity Measurements: Influence of Coating Thickness and Polymer Concentration. IEEE Sens. J. 2019, 19, 3335–3342. [Google Scholar] [CrossRef]
  60. Lazarova, K.; Christova, D.; Georgiev, R.; Georgieva, B.; Babeva, T. Optical sensing of humidity using polymer top-covered bragg stacks and polymer/metal thin film structures. Nanomaterials 2019, 9, 875. [Google Scholar] [CrossRef]
  61. Kolpakov, S.A.; Gordon, N.T.; Mou, C.; Zhou, K. Toward a new generation of photonic humidity sensors. Sensors 2014, 14, 3986–4013. [Google Scholar] [CrossRef]
  62. Gan, X.; Zhao, C.; Yuan, Q.; Fang, L.; Li, Y.; Yin, J.; Ma, X.; Zhao, J. High performance graphene oxide-based humidity sensor integrated on a photonic crystal cavity. Appl. Phys. Lett. 2017, 110, 151107. [Google Scholar] [CrossRef]
  63. Rao, X.; Zhao, L.; Xu, L.; Wang, Y.; Liu, K.; Wang, Y.; Chen, G.Y.; Liu, T.; Wang, Y. Review of optical humidity sensors. Sensors 2021, 21, 8049. [Google Scholar] [CrossRef]
  64. Zhong, Y.; Xu, P.; Yang, J.; Dong, X. Optical Fiber Interferometric Humidity Sensor by Using Hollow Core Fiber Interacting with Gelatin Film. Sensors 2022, 22, 4514. [Google Scholar] [CrossRef] [PubMed]
  65. Guo, H.; Zhang, Y.; Ning, Y.; Zhang, M.; Li, S.; Liu, Z.; Zhang, Y.; Zhang, J.; Yuan, L. Fiber Humidity Sensor Based on SF-LiBr Composite Film. IEEE Sens. J. 2022, 22, 16886–16891. [Google Scholar] [CrossRef]
  66. Wang, N.; Li, Y.; Yin, X.; Liu, W.; Liu, S.; Xu, L.; Zhao, X.; Zhong, Y. Highly Sensitive Optical-fiber Humidity Sensor Based on Nafion-PVA Sol-gel. Curr. Opt. Photonics 2023, 7, 21–27. [Google Scholar] [CrossRef]
  67. Gao, R.; Lu, D.F.; Cheng, J.; Jiang, Y.; Jiang, L.; Qi, Z.M. Humidity sensor based on power leakage at resonance wavelengths of a hollow core fiber coated with reduced graphene oxide. Sens. Actuators B Chem. 2016, 222, 618–624. [Google Scholar] [CrossRef]
  68. Liu, Y.; Zhou, A.; Yuan, L. Sensitivity-enhanced humidity sensor based on helix structure-assisted Mach-Zehnder interference. Opt. Express 2019, 27, 35609. [Google Scholar] [CrossRef]
  69. Chen, G.Y.; Wu, X.; Codemard, C.A.; Yu, L.; Liu, X.; Xu, H.; Monro, T.M.; Lancaster, D.G. Optical hygrometer using light-sheet skew-ray probed multimode fiber with polyelectrolyte coating. Sens. Actuators B Chem. 2019, 296, 126685. [Google Scholar] [CrossRef]
  70. Zhang, Y.; Hou, Y.; Liu, W.; Zhang, H.; Zhang, Y.; Zhang, Z.; Guo, J.; Liu, J.; Zhang, L.; Tan, Q.L. A cost-effective relative humidity sensor based on side coupling induction technology. Sensors 2017, 17, 944. [Google Scholar] [CrossRef]
  71. Eryürek, M.; Tasdemir, Z.; Karadag, Y.; Anand, S.; Kilinc, N.; Alaca, B.E.; Kiraz, A. Integrated humidity sensor based on SU-8 polymer microdisk microresonator. Sens. Actuators B Chem. 2017, 242, 1115–1120. [Google Scholar] [CrossRef]
  72. Xie, Z.; Yan, H.; Li, Y.; Zhao, X. A humidity fiber sensor based on both end-sides of a fiber Bragg grating coated with polyimide. Opt. Fiber Technol. 2020, 57, 102220. [Google Scholar] [CrossRef]
  73. Zain, H.A.; Batumalay, M.; Johari, M.A.M.; Dimyat, K.; Harun, W.S. Agarose coated micro-bottle sensor for relative humidity detection. Optoelectron. Lett. 2021, 17, 328–333. [Google Scholar] [CrossRef]
  74. Lopez Aldaba, A.; Lopez-Torres, D.; Elosua, C.; Auguste, J.-L.; Jamier, R.; Roy, P.; Arregui, F.J.; Lopez-Amo, M. SnO2-MOF-Fabry-Perot optical sensor for relative humidity measurements. Sens. Actuators B Chem. 2018, 257, 189–199. [Google Scholar] [CrossRef]
  75. Torabi-Monfared, H.; Sherafat, L.; Doroodmand, M.M.; Eshghi, F. Fluorescent lamp tungsten filament thermionic emission gun as a novel humidity optical sensor. Sci. Rep. 2021, 11, 18103. [Google Scholar] [CrossRef] [PubMed]
Figure 1. Scheme of the measurement setup. Transmission spectra of the samples were recorded in nitrogen gas flow with controlled RH.
Photonics 10 00975 g001
Figure 2. Transmission spectra of gold thin films heat-treated at (a) 400 °C, (b) 450 °C, and (c) 500 °C for different times. (d) Dependence of the LSPR quality factor on heat treatment time at different temperatures.
Photonics 10 00975 g002
Figure 3. Transmission spectra of gold thin films annealed at 500 °C for 90 min (dash lines) and covered with Nafion (solid lines).
Photonics 10 00975 g003
Figure 4. (a) Typical AFM image of gold self-assembled nanoparticles after heat treatment at 500 °C for 90 min; AFM images of the samples A (b), B (c), and C (d).
Photonics 10 00975 g004
Figure 5. Transmission spectra of the samples with Nafion thicknesses of 130 nm (a), 190 nm (b), and 300 nm (c) measured at different RHs. (d) Dependence of the LSPR shift on RH for samples covered with different Nafion thicknesses.
Photonics 10 00975 g005
Figure 6. Differential transmission spectra of samples A (a), B (b), and C (c) measured at different RHs. (d) Temporal evolution of integral intensity in the spectral range 550–600 nm for the samples.
Photonics 10 00975 g006
Figure 7. Dependence of absolute changes in integral intensity of transmitted light in the spectral range 550–600 nm on RH. Lines represent a linear fitting of the experimental data for samples B and C.
Photonics 10 00975 g007
Figure 8. Sensor response vs. time with change of RH for samples B (a), C (b), and C after 2 months (c). (d) Dependence of the response amplitude on RH.
Photonics 10 00975 g008
Table 1. Comparison of the obtained results with the selected published works on optical humidity sensors.
Functional MaterialDynamic RangeLimit of DetectionResponse/Recovery Time (RH Range)Reference
PDDA/PSS60–80%0.007%115 ms (50→90%)
200 ms (90→50%)
[69]
Nafion45–80%1%200 ms (50→67%)[42]
Agarose40–80%0.7%1 s/4 s[70]
SU-80–50%0.03%140 s (0→1%)
40 s (1→0%)
[71]
Polyimide20–95%5%180 s (55→60%)[72]
Agarose35–85%2.6%7.4 s (35→85%)
8.0 s (85→35%)
[73]
SnO220–90%0.04%370 ms (50→90%)
380 ms (90→50%)
[74]
Tungsten filament2–98%5%4.5 s (20→80%)
5.0 s (80→20%)
[75]
Nafion0–85%1.2%150 s (85→0%)This work
Nafion0–85%0.12%320 s (0→85%)
400 s (85→0%)
This work
Disclaimer/Publisher’s Note: The statements, opinions and data contained in all publications are solely those of the individual author(s) and contributor(s) and not of MDPI and/or the editor(s). MDPI and/or the editor(s) disclaim responsibility for any injury to people or property resulting from any ideas, methods, instructions or products referred to in the content.

