A Wide-Range High-Resolution X-ray Crystal Spectrometer for Laser–Plasma Diagnostics


Abstract
:1. Introduction
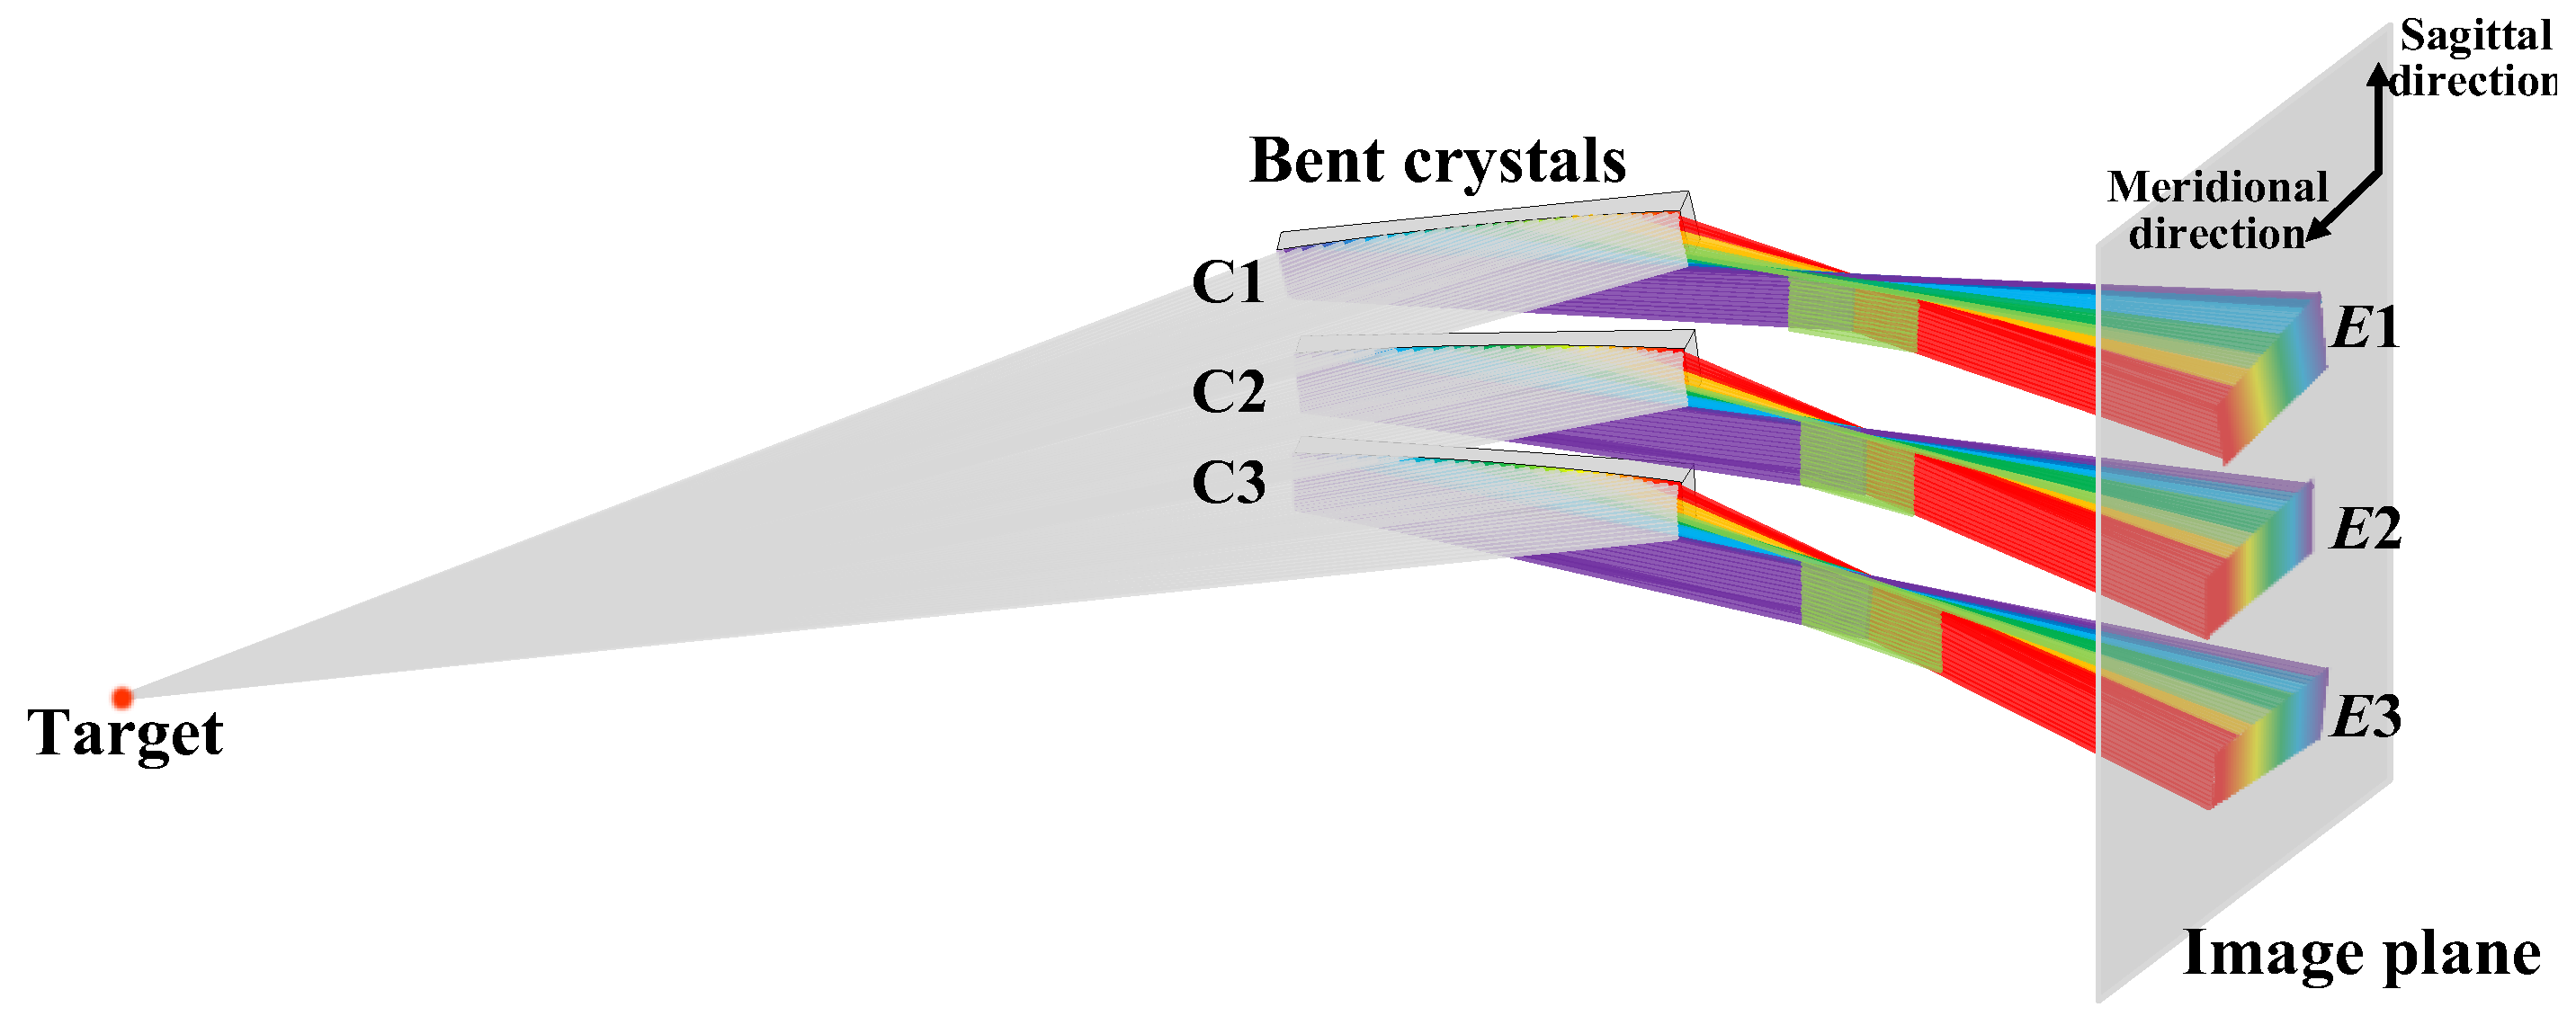
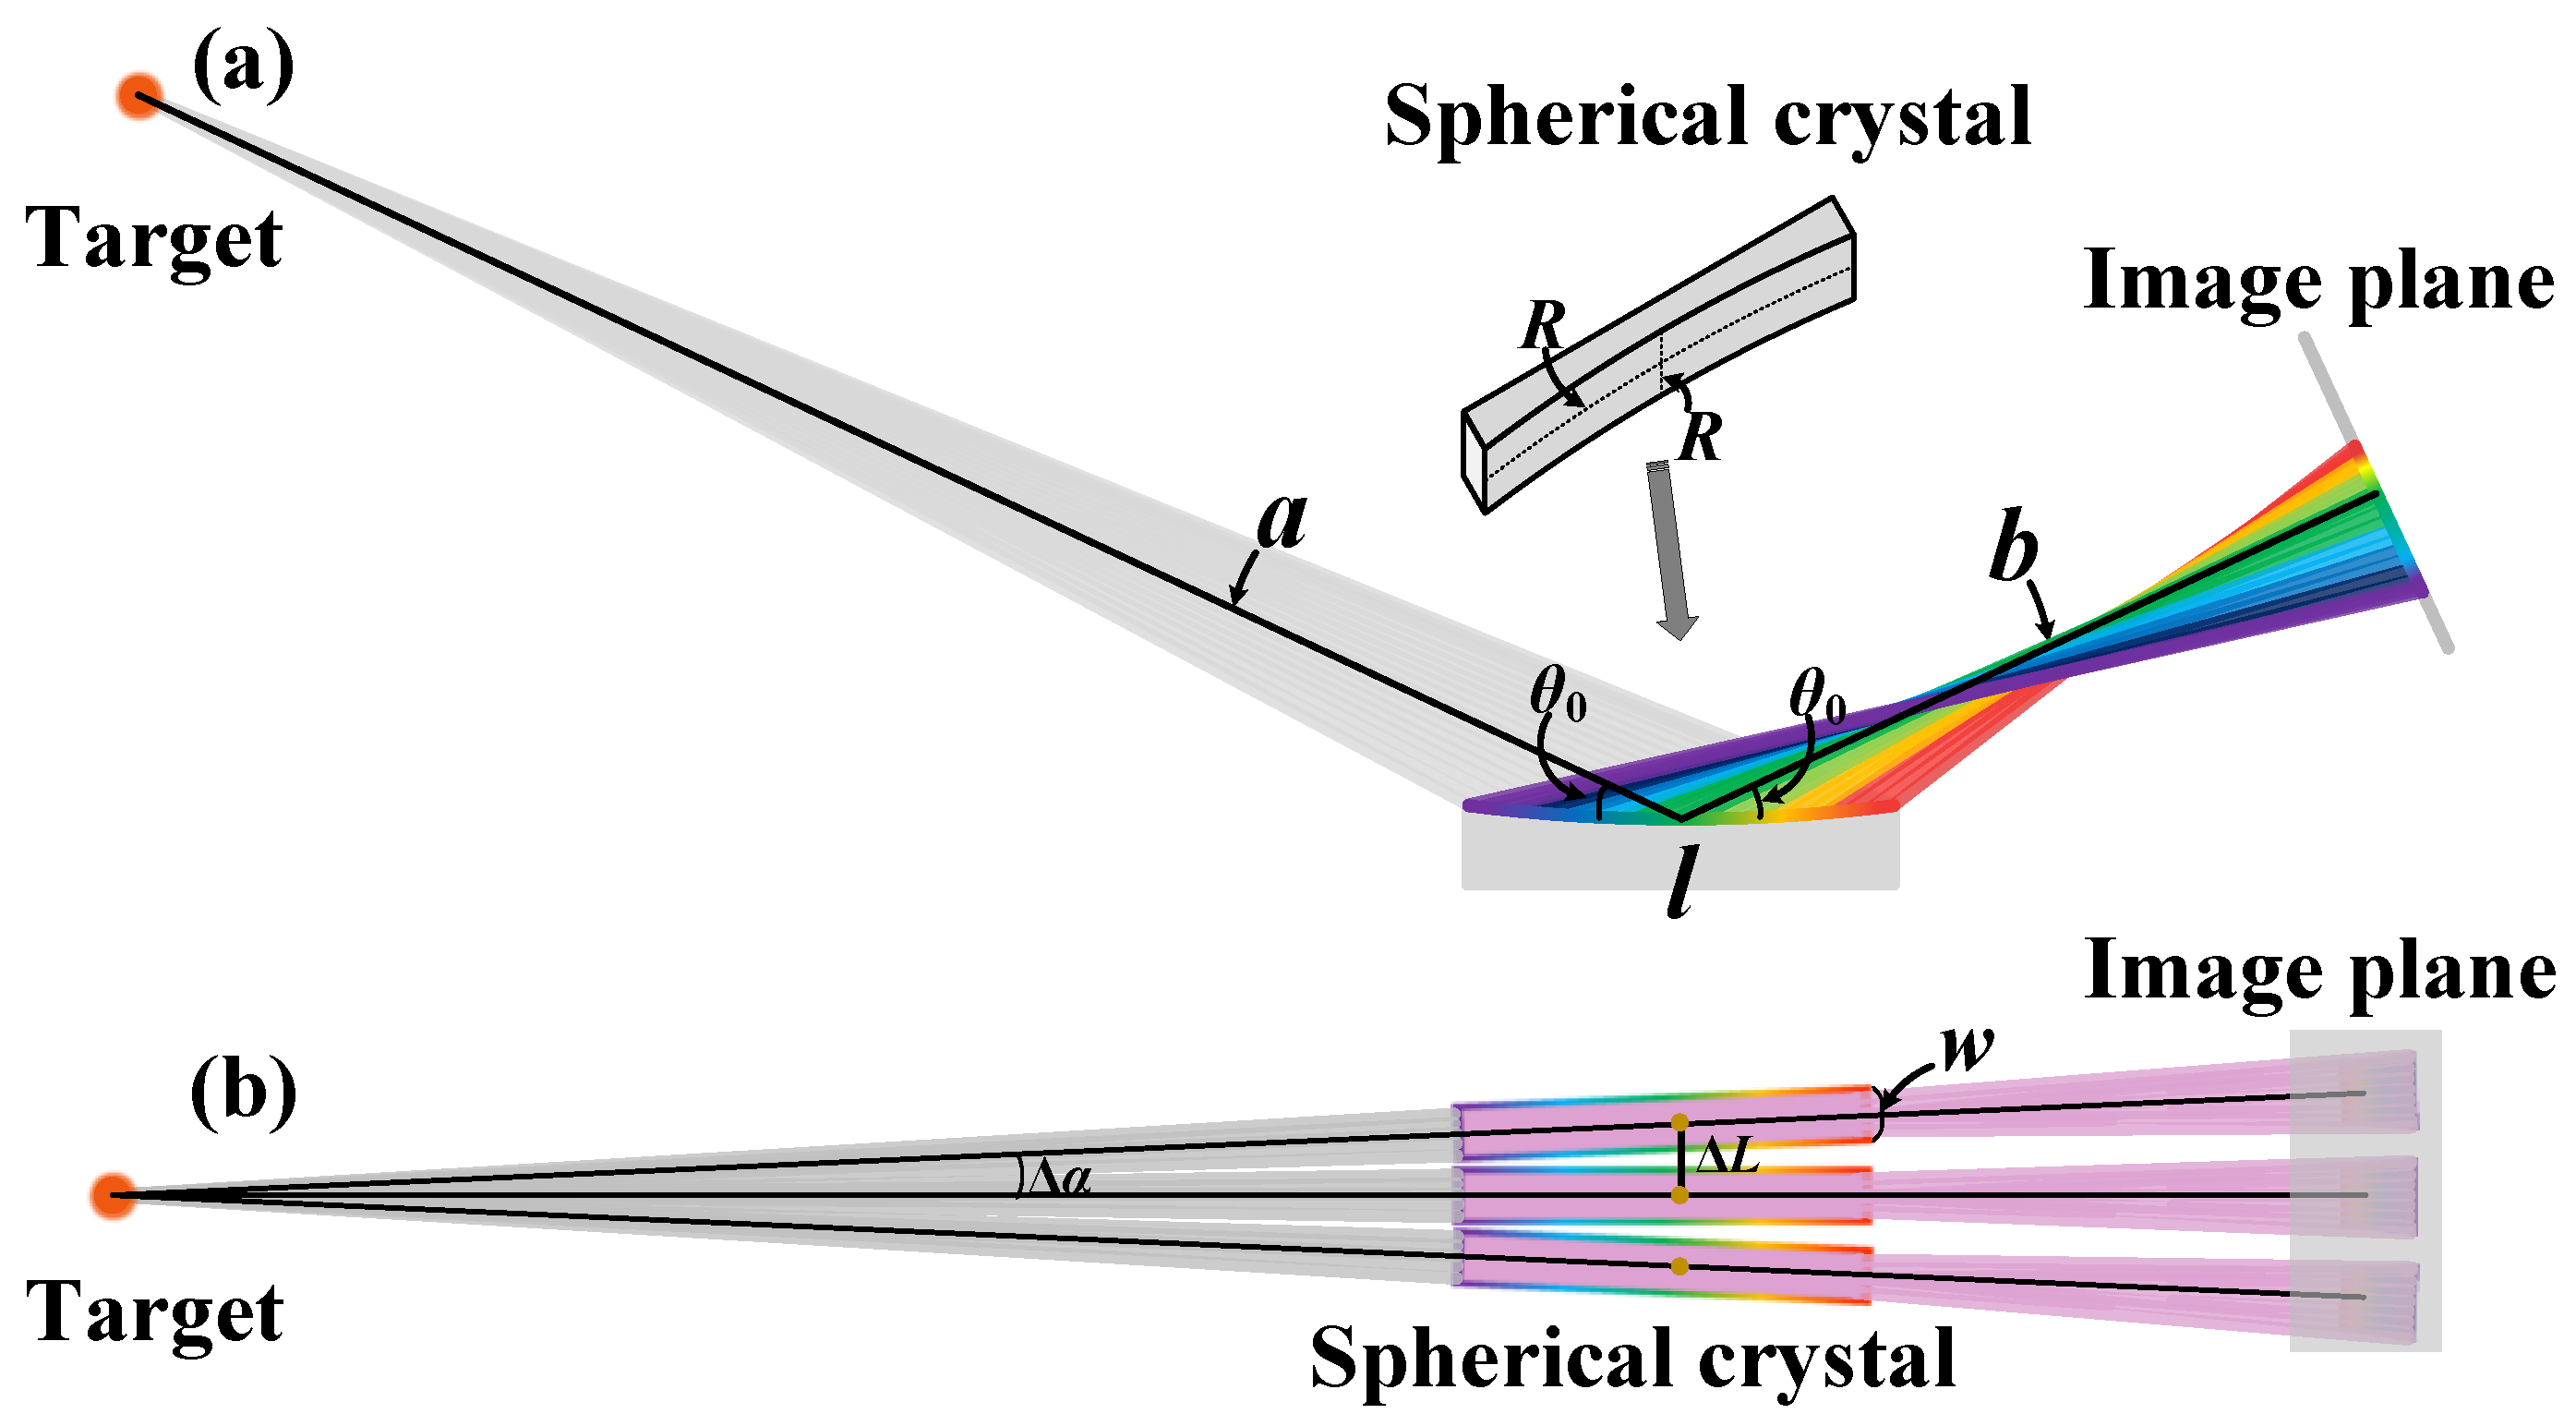
2. Optical Design
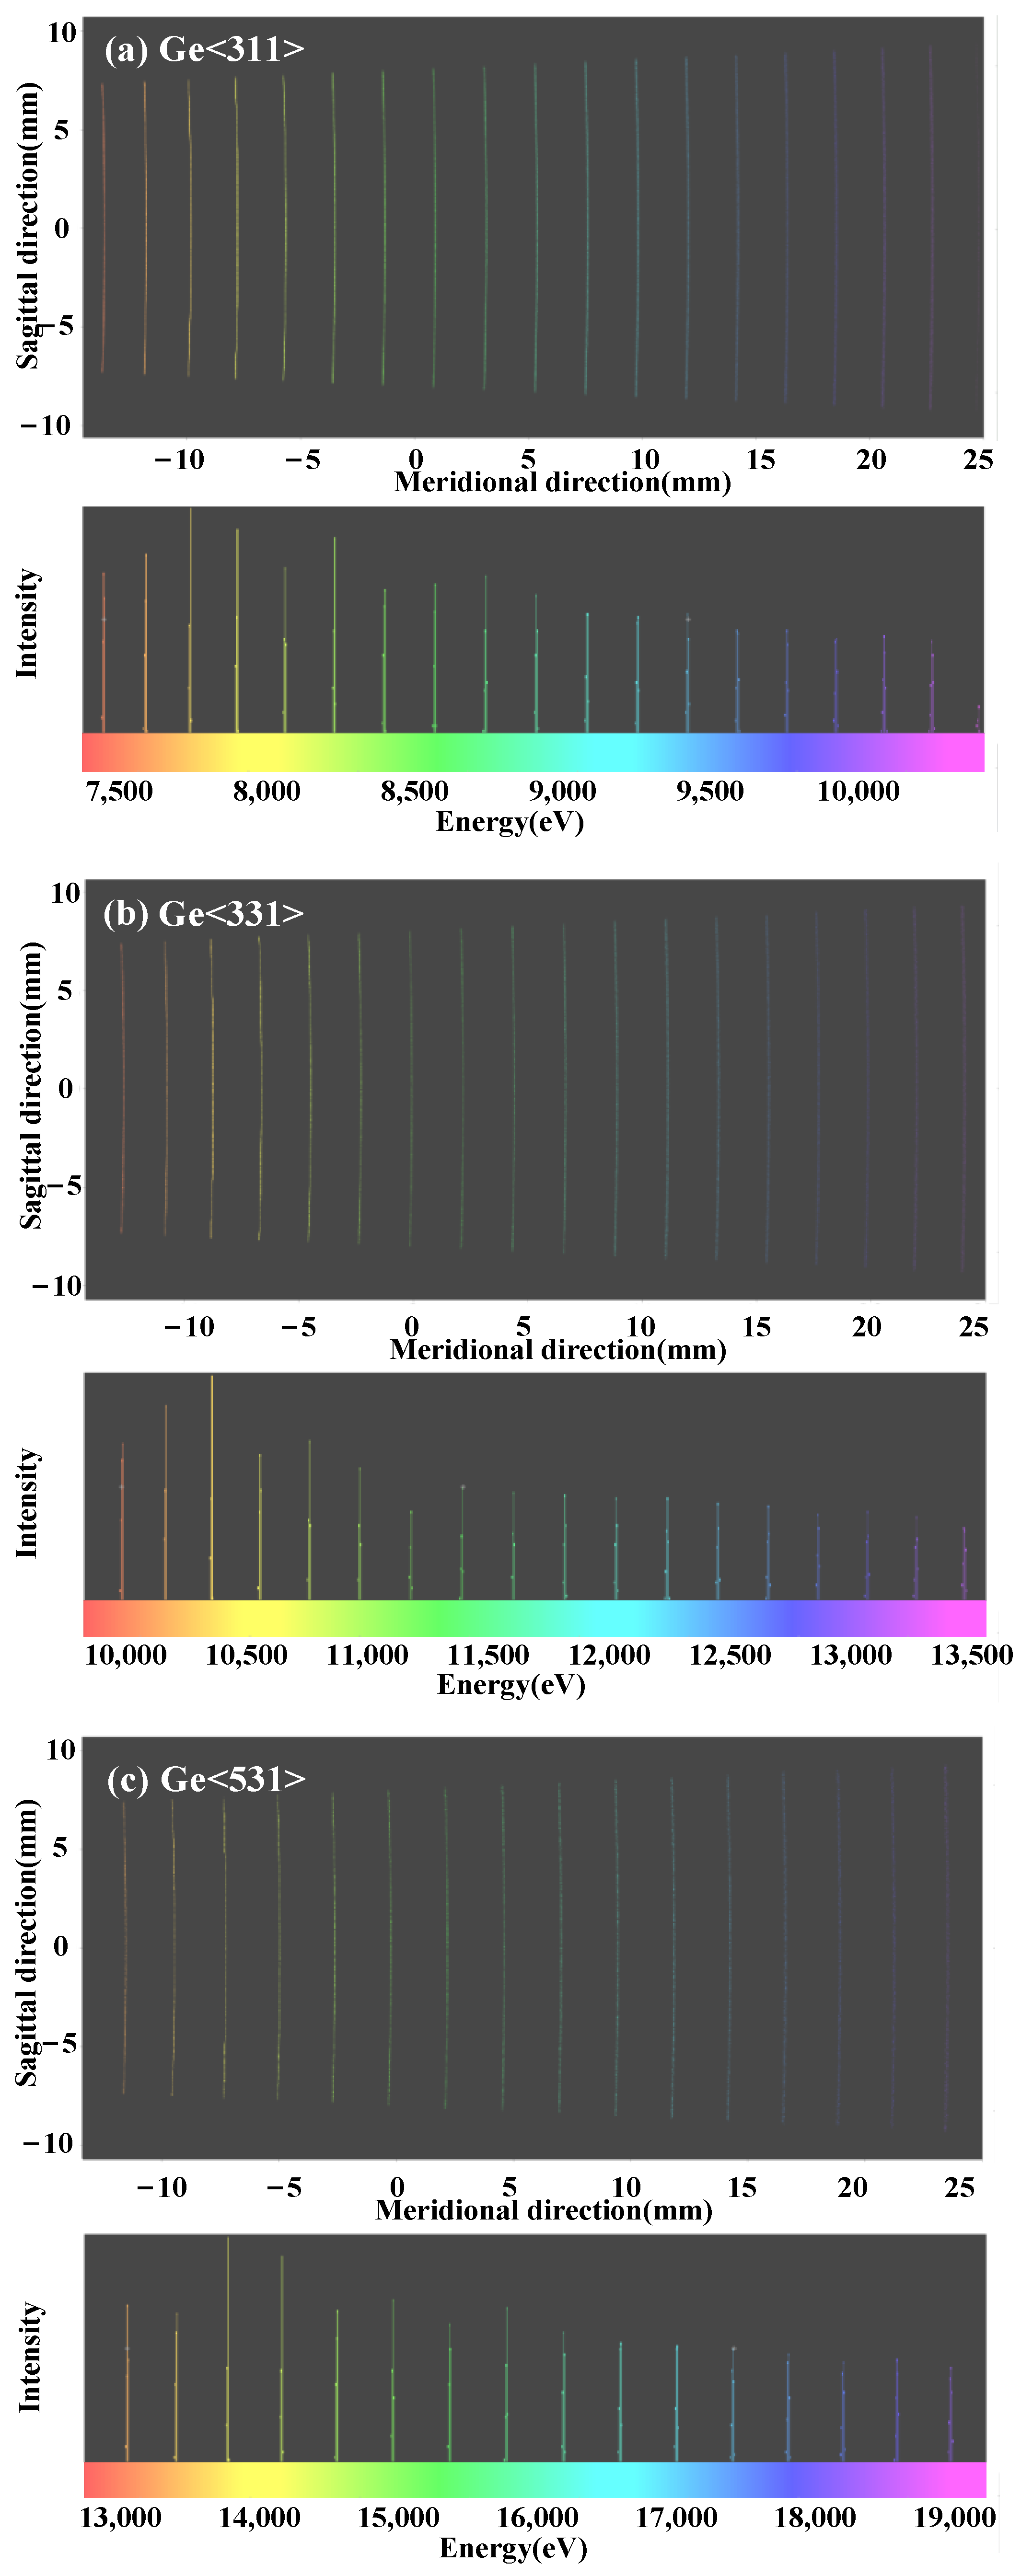
3. Optical Simulations
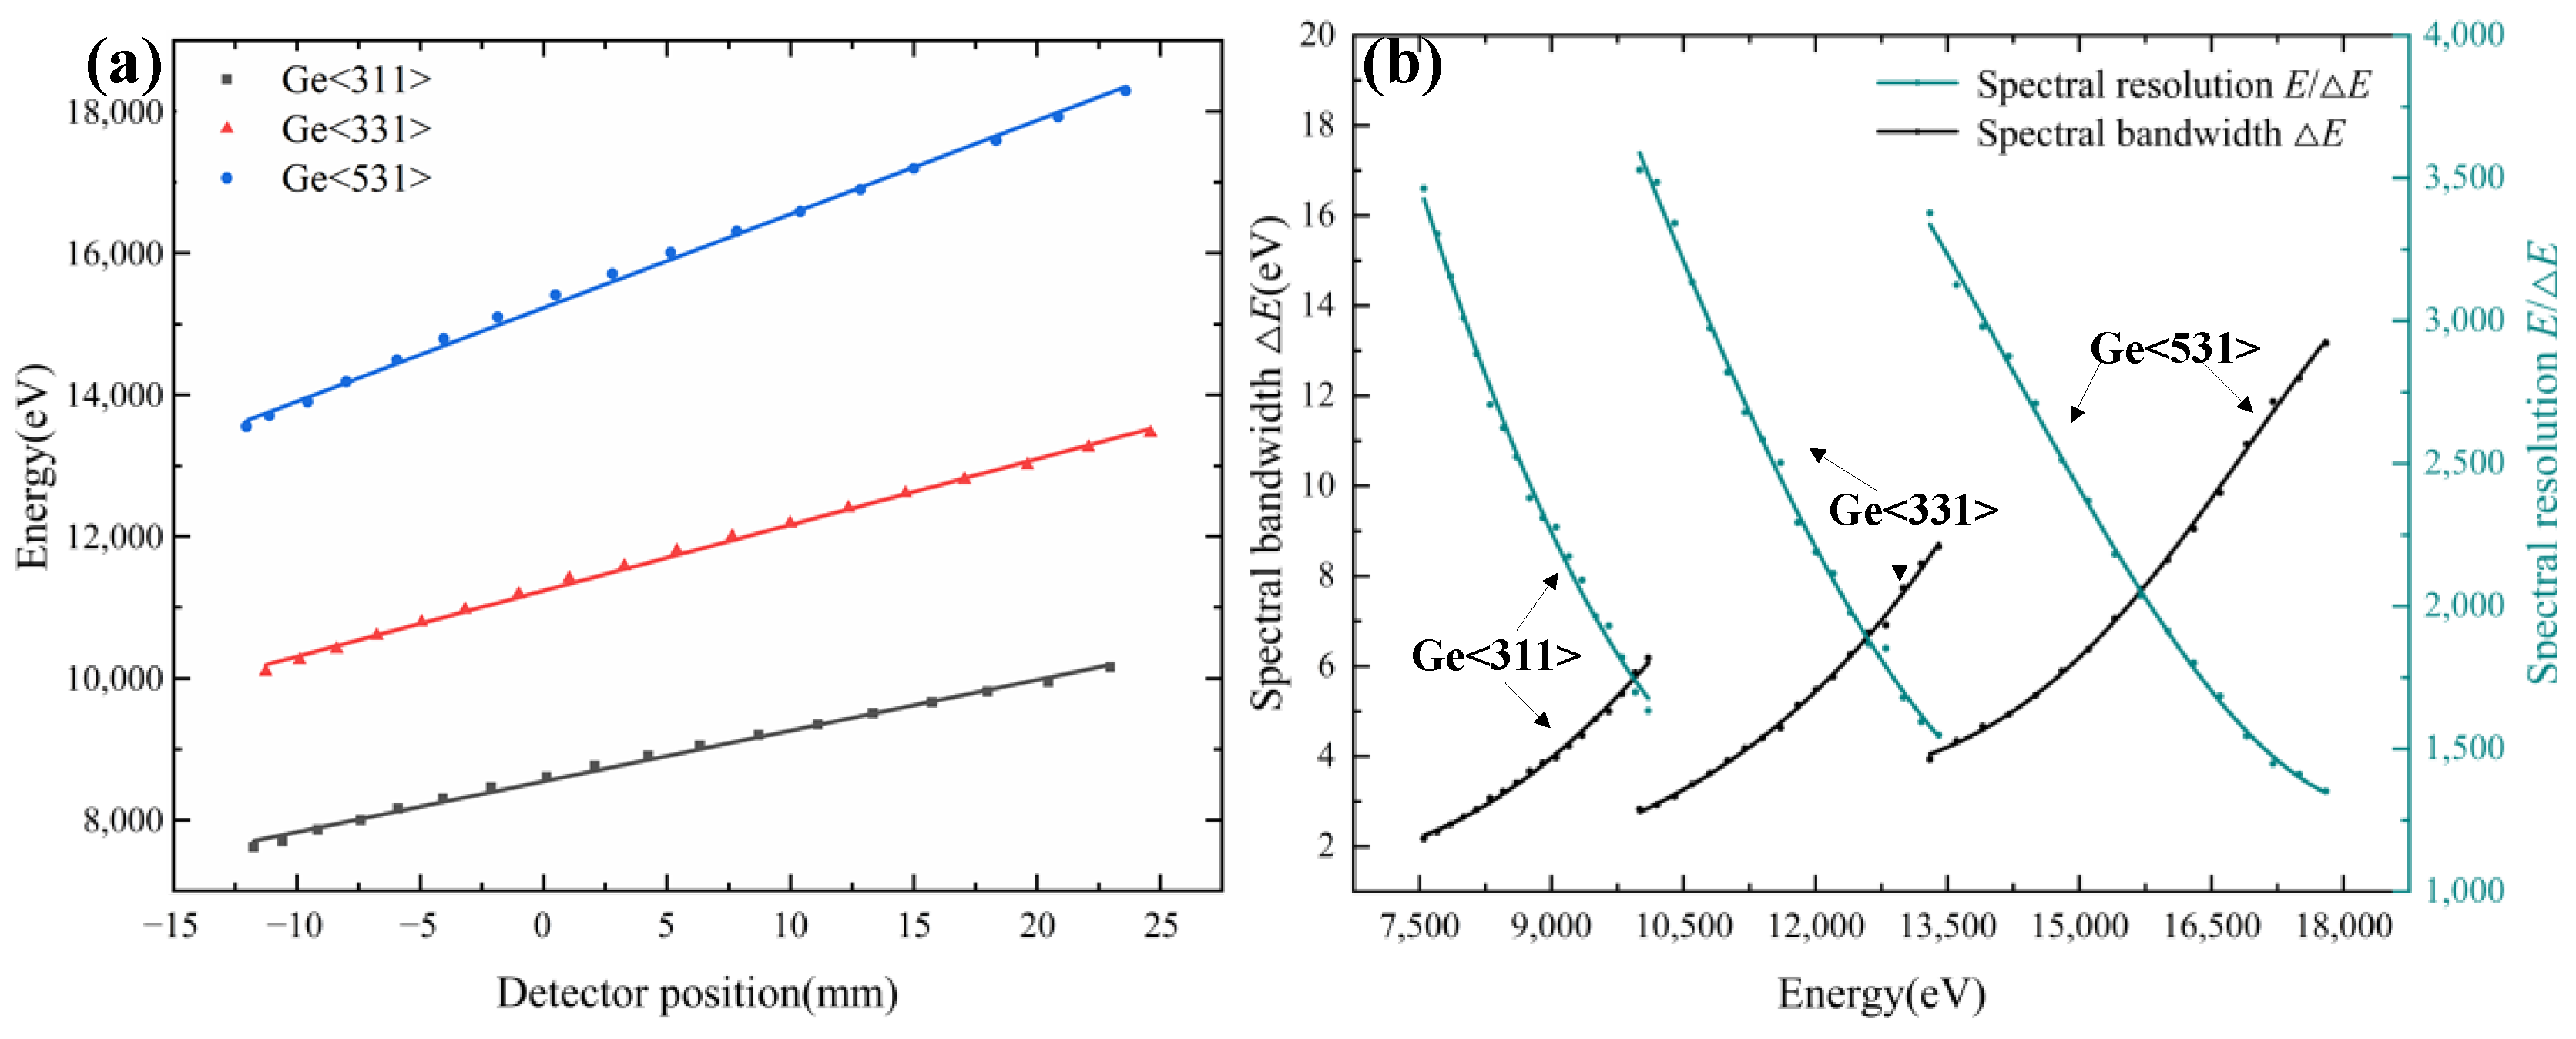
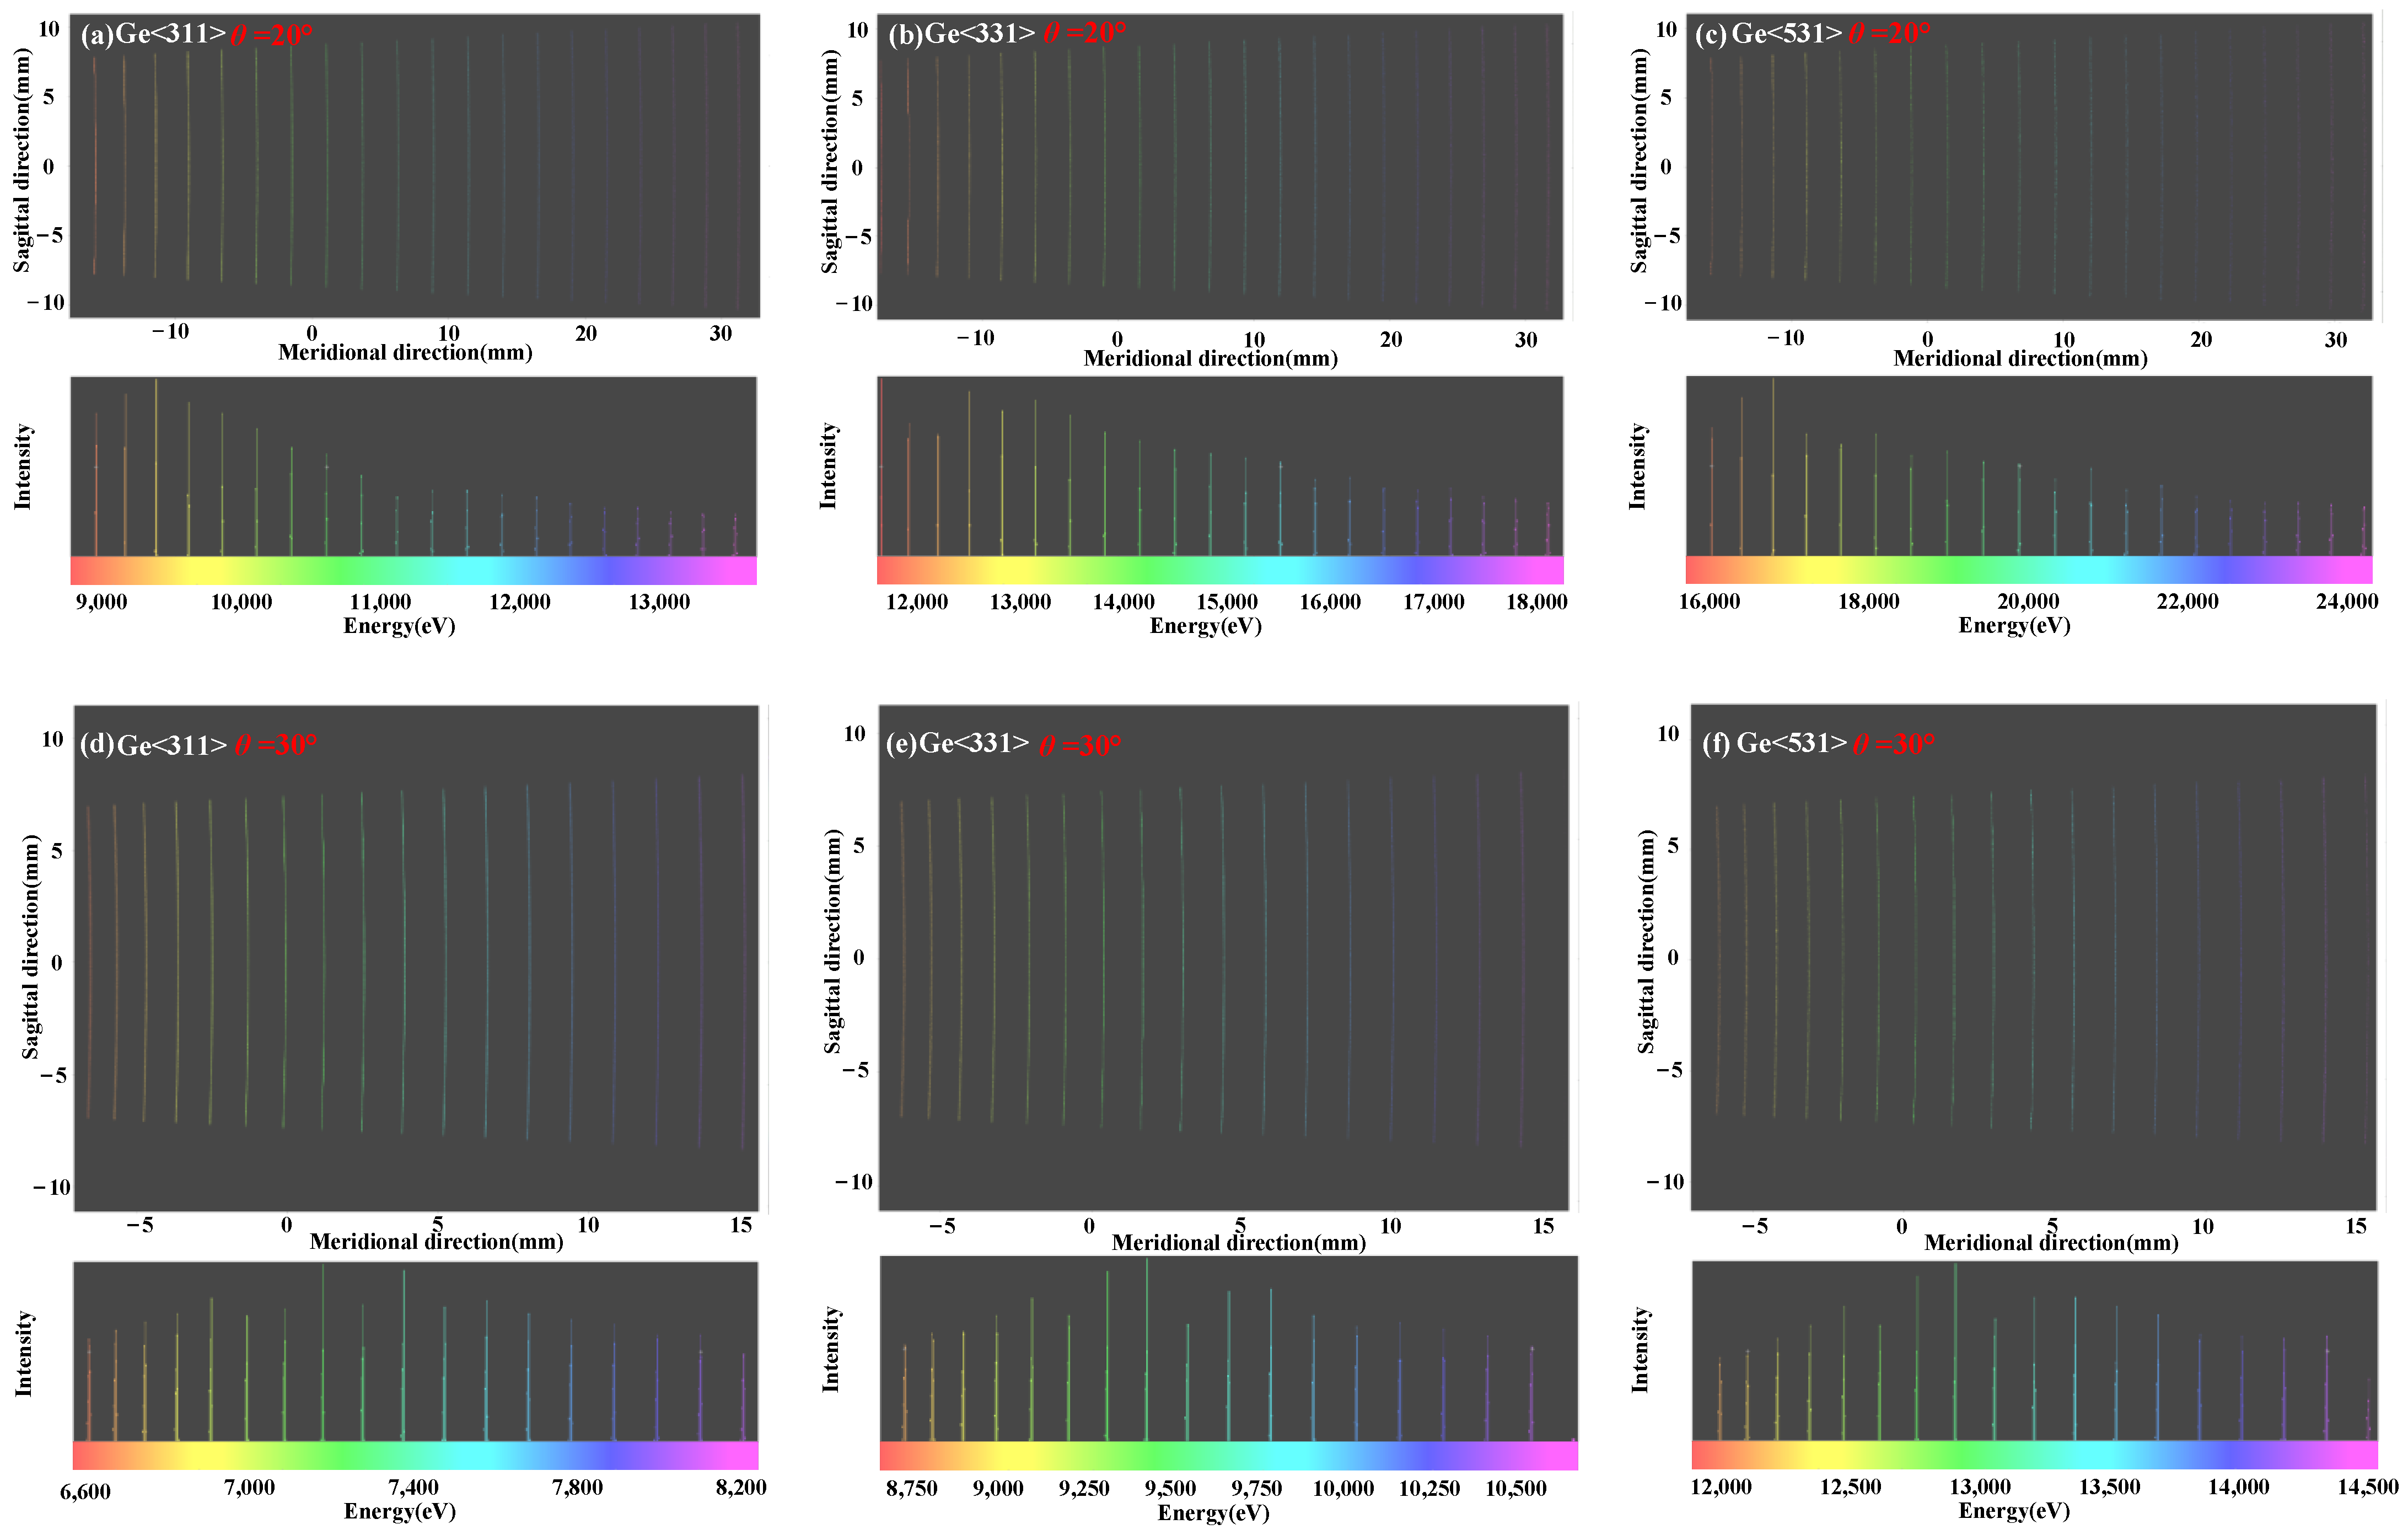
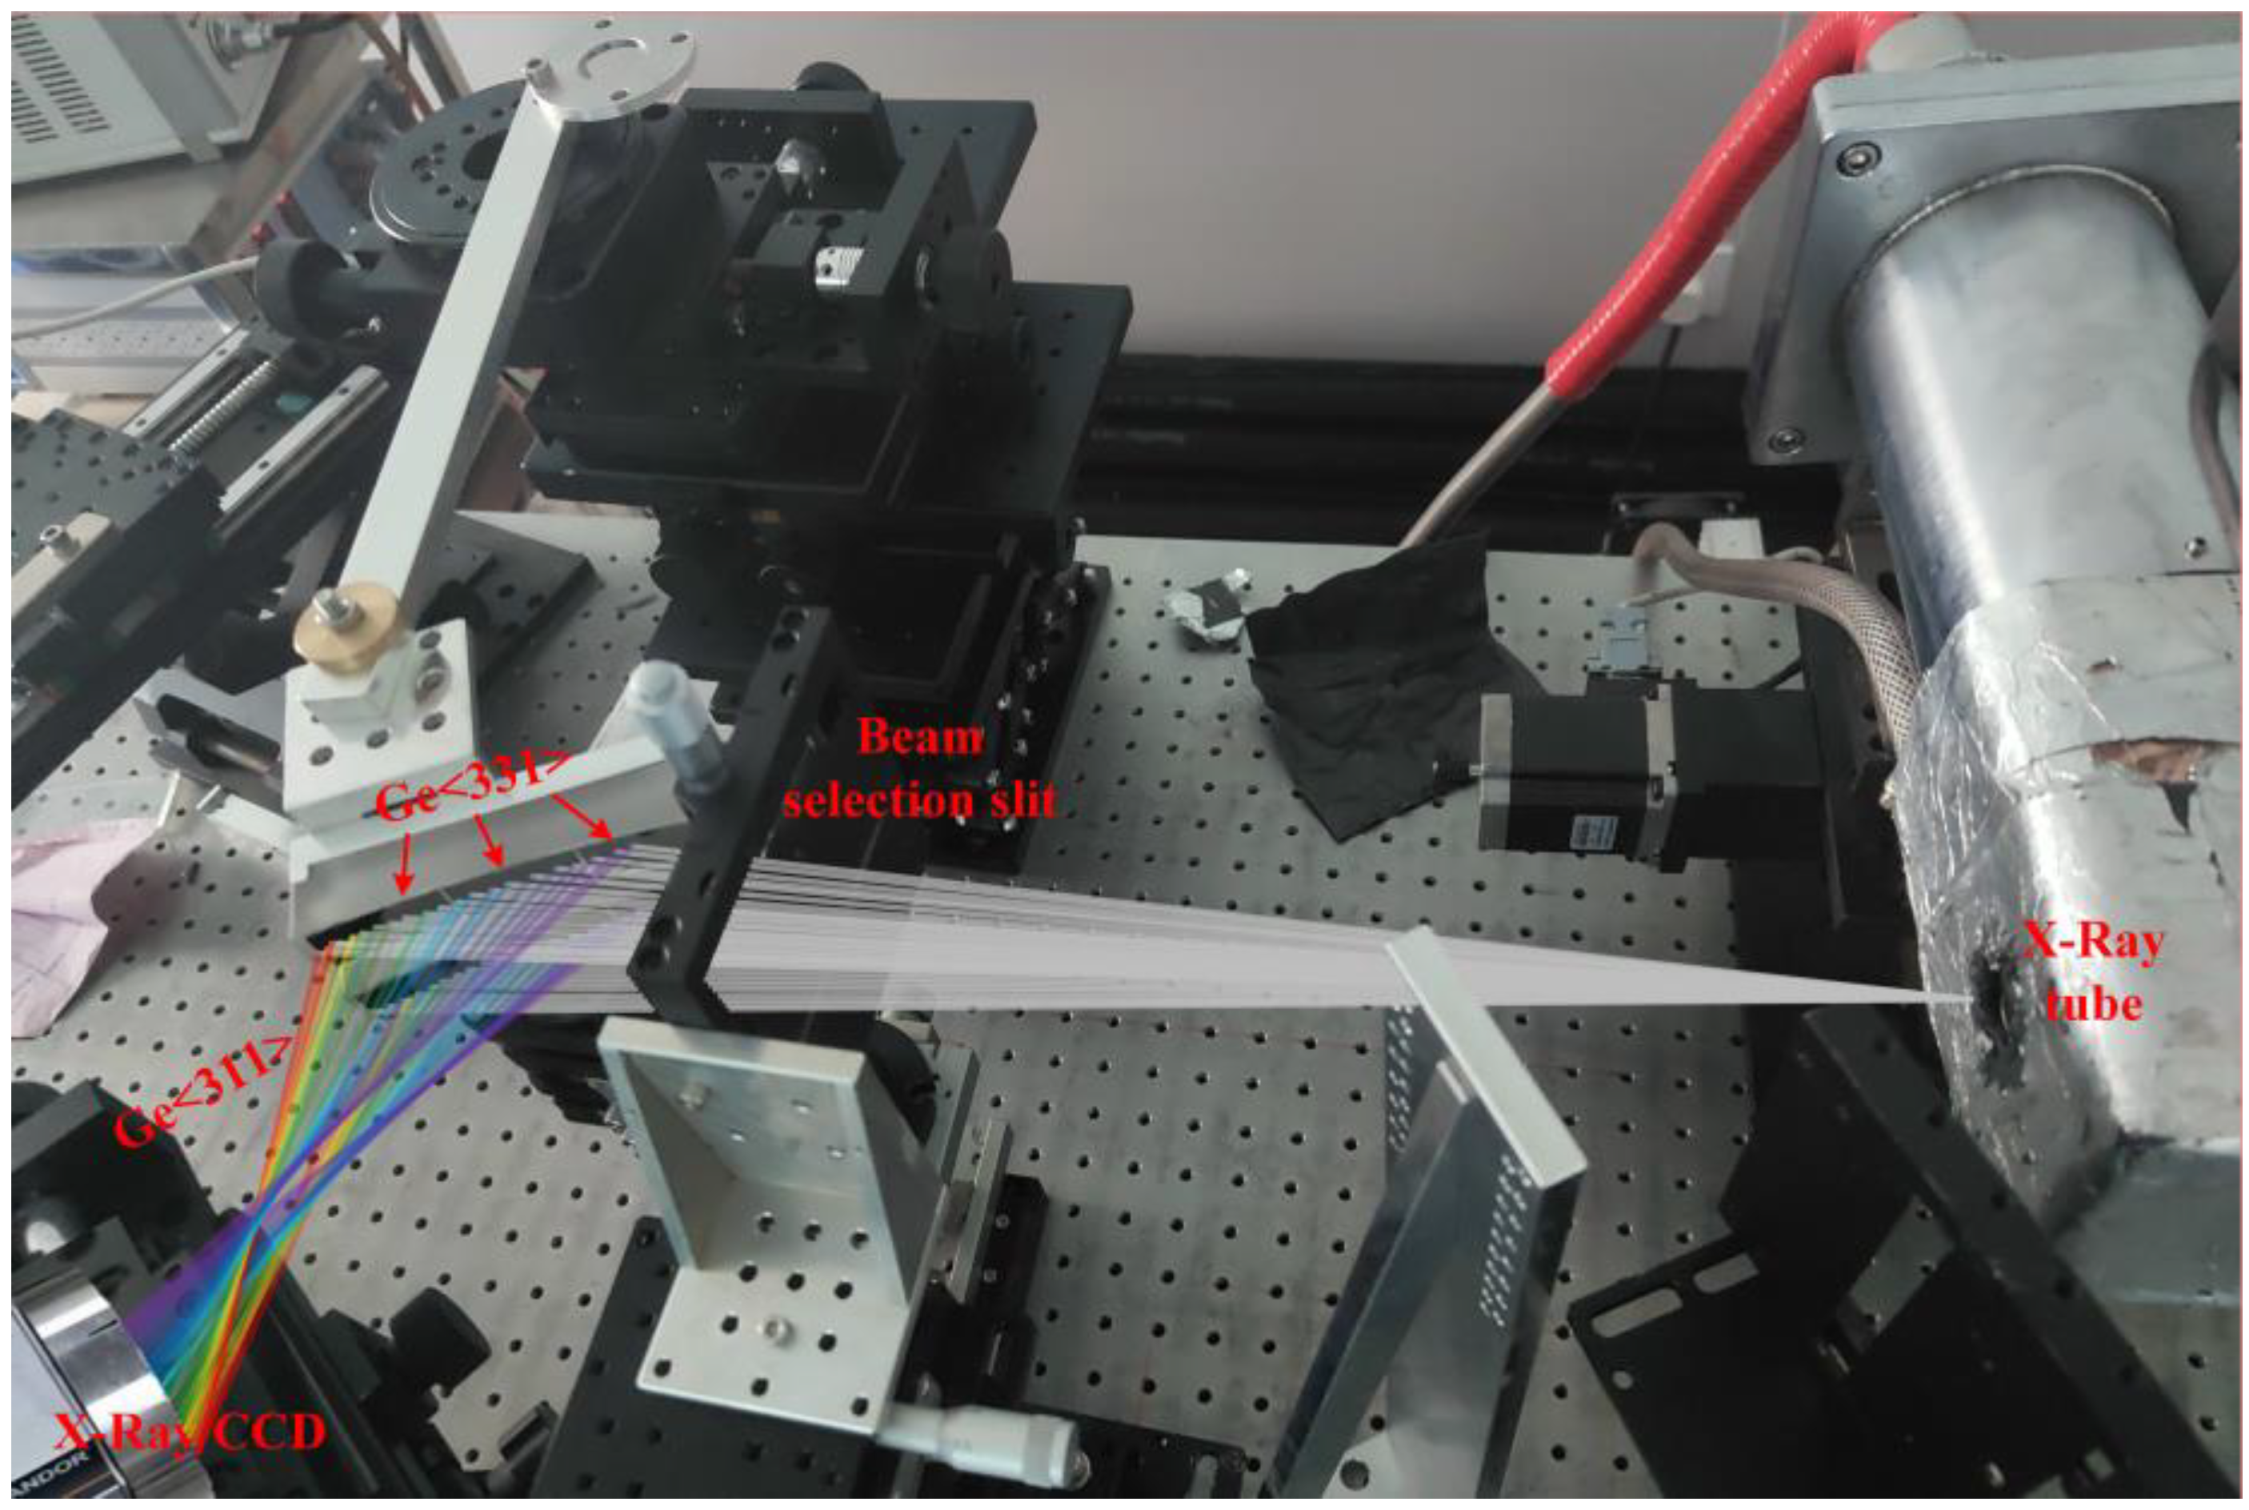
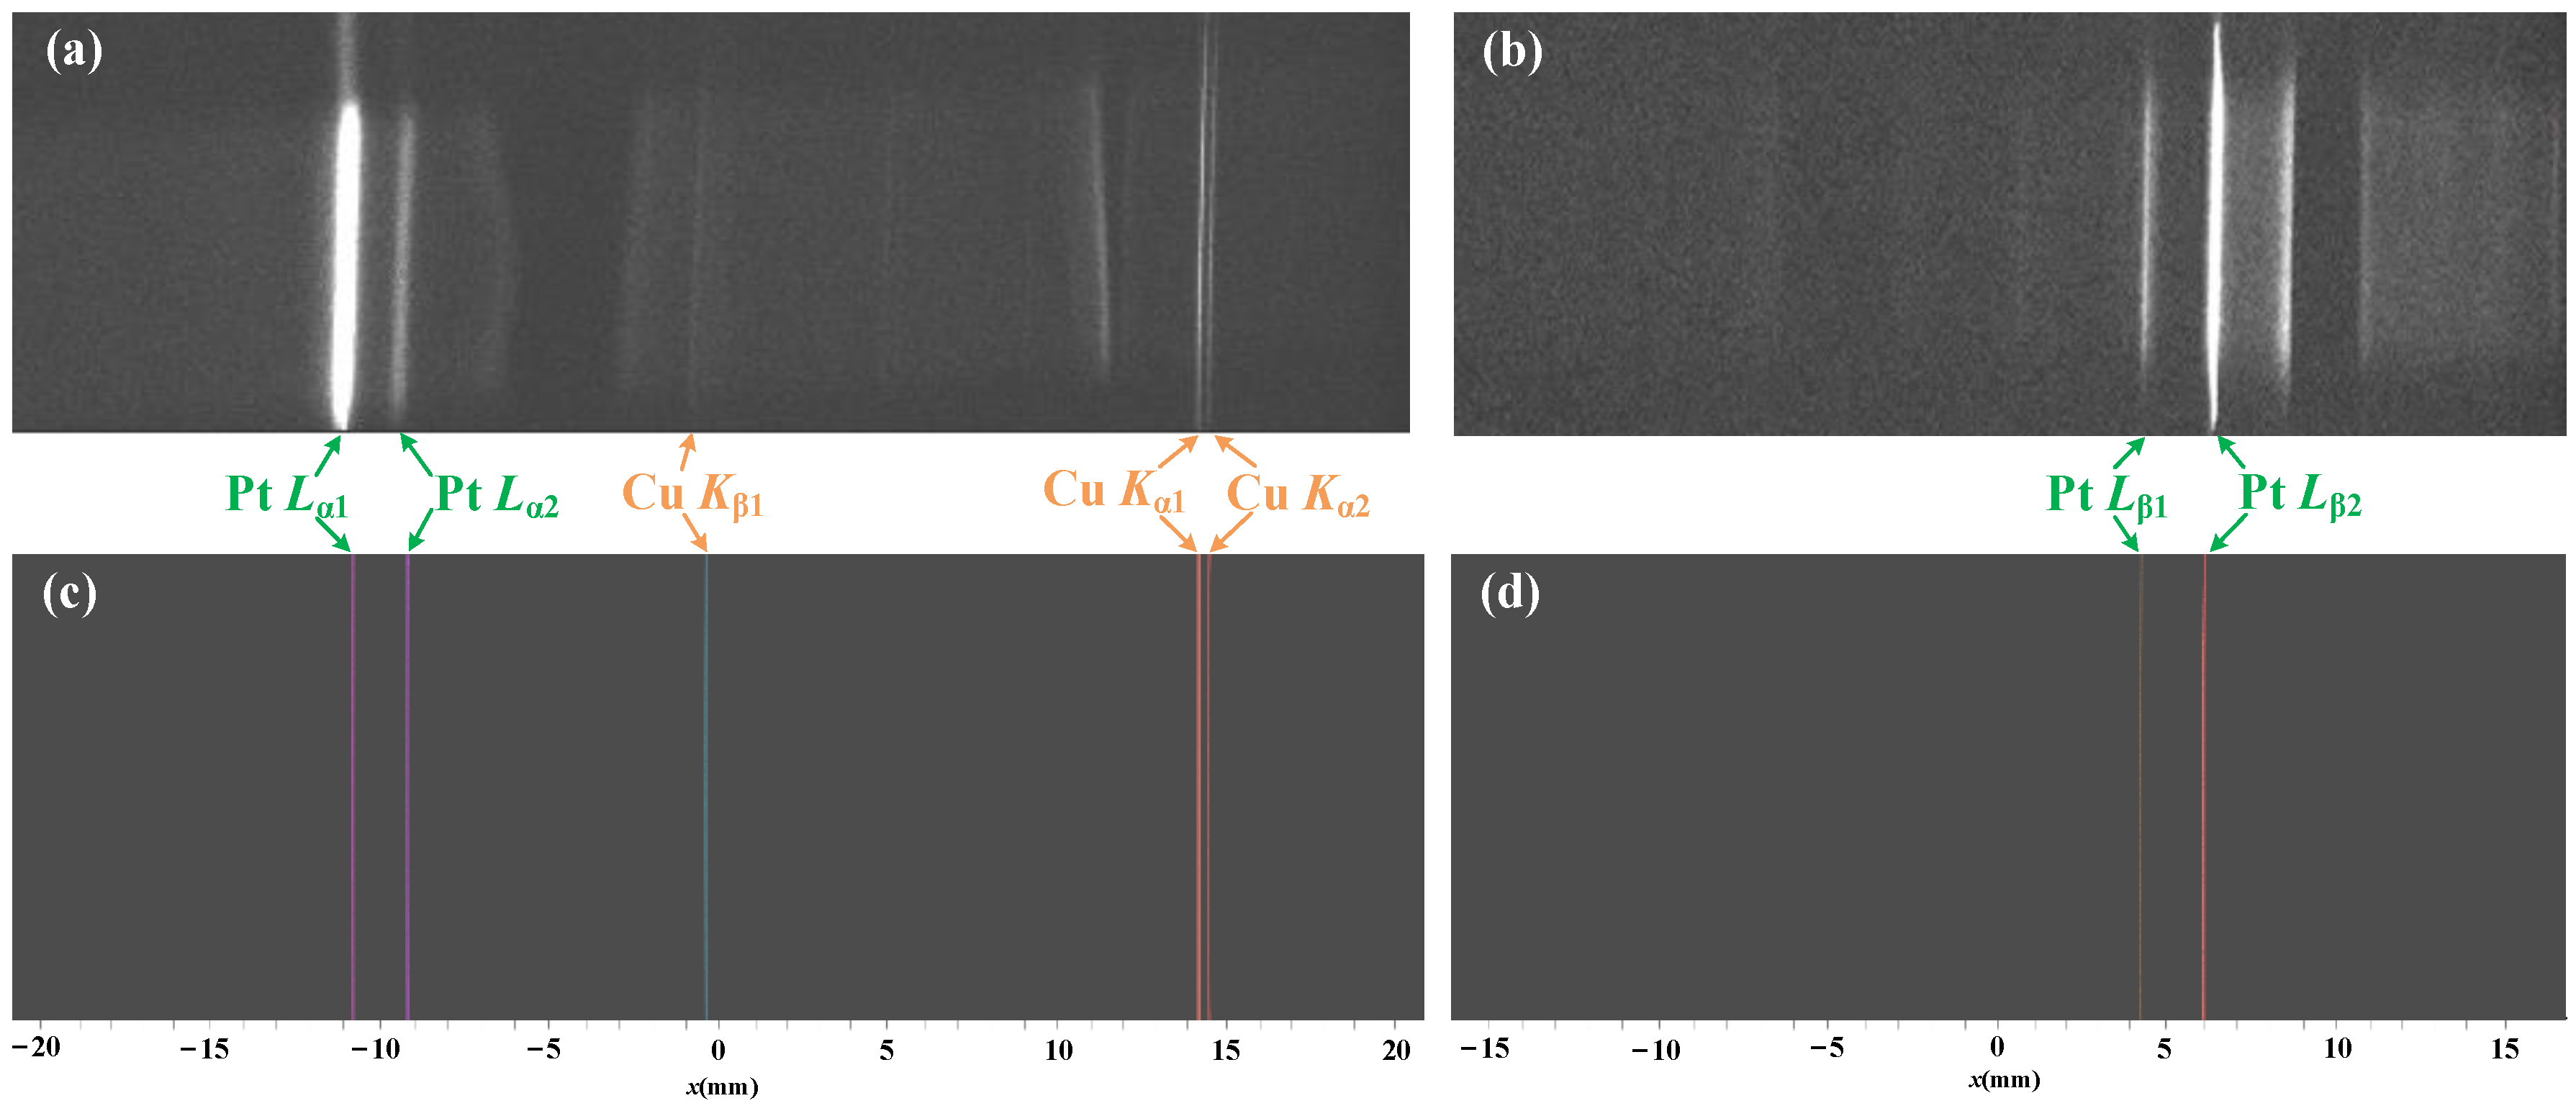
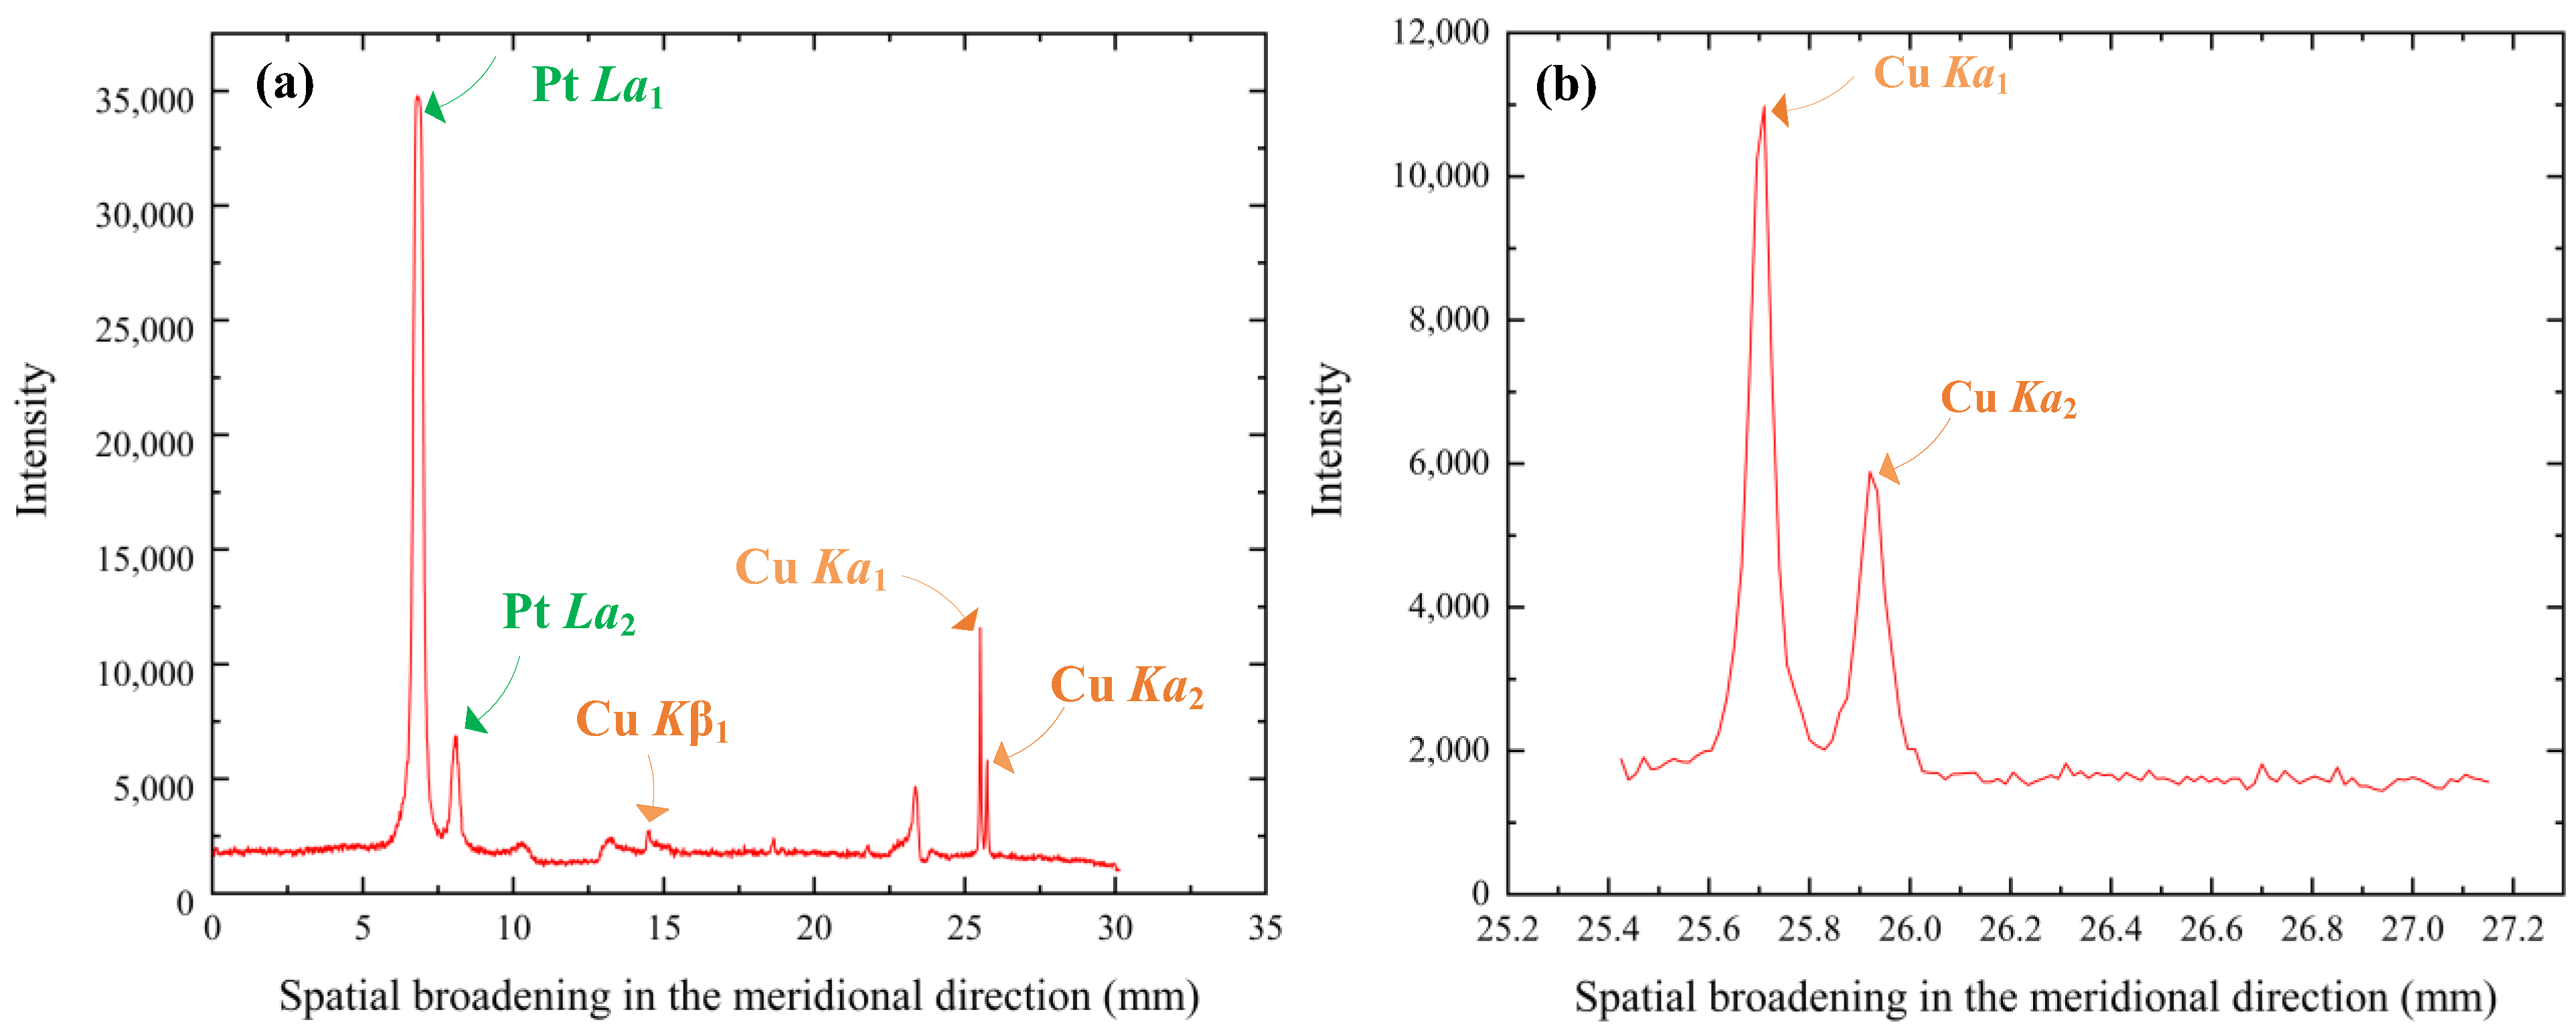
4. Experiments and Analysis
5. Discussion
6. Conclusions
Author Contributions
Funding
Institutional Review Board Statement
Informed Consent Statement
Data Availability Statement
Conflicts of Interest
References
- Kritcher, A.L.; Young, C.V.; Robey, H.F.; Weber, C.R.; Zylstra, A.B.; Hurricane, O.A.; Callahan, D.A.; Ralph, J.E.; Ross, J.S.; Baker, K.L.; et al. Design of inertial fusion implosions reaching the burning plasma regime. Nat. Phys. 2022, 18, 251–258. [Google Scholar] [CrossRef]
- Sciortino, F.; Howard, N.T.; Reksoatmodjo, R.; Foster, A.R.; Hughes, J.W.; Marmar, E.S.; Miller, M.A.; Mordijck, S.; Odstrčil, T.; Pütterich, T.; et al. Experimental inference of neutral and impurity transport in Alcator C-Mod using high-resolution X-ray and ultra-violet spectra. Nucl. Fusion 2021, 61, 126060. [Google Scholar] [CrossRef]
- Si, H.; Dong, J.; Fang, Z.; Jiang, L.; Yi, S.; Wang, Z. High-resolution X-ray monochromatic imaging for laser plasma diagnostics based on toroidal crystal. Plasma Sci. Technol. 2022, 25, 015601. [Google Scholar] [CrossRef]
- Yi, S.; Zhang, F.; Huang, Q.; Wei, L.; Gu, Y.; Wang, Z. High-resolution X-ray flash radiography of Ti characteristic lines with multilayer Kirkpatrick–Baez microscope at the Shenguang-II Update laser facility. High Power Laser Sci. Eng. 2021, 9, e42. [Google Scholar] [CrossRef]
- Li, M.; Yao, T.; Yang, Z.; Shi, J.; Wang, F.; Yang, G.; Wei, M.; Sun, A.; Li, Y. Designing a toroidal crystal for monochromatic X-ray imaging of a laser-produced He-like plasma. High Power Laser Sci. Eng. 2022, 10, e37. [Google Scholar] [CrossRef]
- Yi, S.Z.; Dong, J.Q.; Jiang, L.; Huang, Q.S.; Guo, E.F.; Wang, Z.S. Simultaneous high-resolution X-ray backlighting and self-emission imaging for laser-produced plasma diagnostics using a two-energy multilayer Kirkpatrick–Baez microscope. Matter Radiat. Extrem. 2021, 7, 015902. [Google Scholar] [CrossRef]
- Casey, D.T.; MacGowan, B.J.; Sater, J.D.; Zylstra, A.B.; Landen, O.L.; Milovich, J.; Hurricane, O.A.; Kritcher, A.L.; Hohenberger, M.; Baker, K.; et al. Evidence of Three-Dimensional Asymmetries Seeded by High-Density Carbon-Ablator Nonuniformity in Experiments at the National Ignition Facility. Phys. Rev. Lett. 2021, 126, 025002. [Google Scholar] [CrossRef]
- Hauer, A.A.; Delamater, N.D.; Koenig, Z.M. High-resolution X-ray spectroscopic diagnostics of laser-heated and ICF plasmas. Laser Part. Beams 1991, 9, 3–48. [Google Scholar] [CrossRef]
- Si, H.; Shan, L.; Du, H.; Jiang, L.; Yi, S.; Zhou, W.; Wang, Z. High-resolution Mo Kα X-ray monochromatic backlight imaging using a toroidal crystal. Chin. Opt. Lett. 2023, 21, 103401. [Google Scholar] [CrossRef]
- Gohshi, Y.; Kamada, H.; Kohra, K.; Utaka, T.; Arai, T. Wide Range Two-Crystal Vacuum X-ray Spectrometer for Chemical State Analysis. Appl. Spectrosc. 1982, 36, 171–174. [Google Scholar] [CrossRef]
- Seely, J.F.; Back, C.A.; Constantin, C.; Lee, R.W.; Chung, H.K.; Hudson, L.T.; Szabo, C.I.; Henins, A.; Holland, G.E.; Atkin, R. Hard X-ray spectra from laser-generated plasmas recorded by the HENEX spectrometer in the 1 keV–40 keV energy range. In Proceedings of the Optics and Photonics 2005, San Diego, CA, USA, 31 August 2005. [Google Scholar]
- Martin, D.F.; Meadowcroft, A.L. A high-energy resolution X-ray spectrometer with interchangeable detectors (HEX-ID) for short-pulse laser-plasma experiments. In Proceedings of the 2011 Abstracts IEEE International Conference on Plasma Science, Chicago, IL, USA, 26–30 June 2011. [Google Scholar] [CrossRef]
- Wang, R.; An, H.; Xie, Z.; Wang, W. Performance of an elliptical crystal spectrometer for SGII X-ray opacity experiments. High Power Laser Sci. Eng. 2018, 6, e3. [Google Scholar] [CrossRef]
- Anderson, S.G.; Heeter, R.F.; Booth, R.; Emig, J.; Fulkerson, S.; McCarville, T.; Norman, D.; Young, B.K.F. Broadband high-resolution elliptical crystal X-ray spectrometer for high energy density physics experiments. Rev. Sci. Instrum. 2006, 77, 063115. [Google Scholar] [CrossRef]
- Heeter, R.F.; Anderson, S.G.; Booth, R.; Brown, G.V.; Emig, J.; Fulkerson, S.; McCarville, T.; Norman, D.; Schneider, M.B.; Young, B.K.F. OZSPEC-2: An improved broadband high-resolution elliptical crystal X-ray spectrometer for high-energy density physics experiments (invited). Rev. Sci. Instrum. 2008, 79, 10E303. [Google Scholar] [CrossRef]
- Haugh, M.J.; Regan, S.P.; Jacoby, K.D.; Ross, P.W.; Magoon, J.; Barrios, M.A.; Emig, J.A.; Shoup, M.J., 3rd; Fournier, K.B. Integrated X-ray reflectivity measurements of elliptically curved pentaerythritol crystals. Rev. Sci. Instrum. 2012, 83, 10E122. [Google Scholar] [CrossRef]
- Stoupin, S.; MacPhee, A.G.; Bitter, M.L.; Ose, N.; MacDonald, M.J.; Schneider, M.B. A variable-sagittal-radius elliptical X-ray crystal spectrometer for time-resolved diagnostics of laser-generated plasmas. In Proceedings of the 63rd APS Division of Plasma Physics Meeting Abstracts, Pittsburgh, PA, USA, 8–12 November 2021. [Google Scholar]
- Seely, J.F.; Galtier, E.; Hudson, L.T.; Henins, A.; Feldman, U. High X-ray resolving power utilizing asymmetric diffraction from a quartz transmission crystal measured in the 6 keV to 22 keV energy range. Appl. Opt. 2019, 58, 5225–5232. [Google Scholar] [CrossRef]
- Ren, L.; Shao, P.; Zhao, D.; Zhou, Y.; Cai, Z.; Hua, N.; Jiao, Z.; Xia, L.; Qiao, Z.; Wu, R.; et al. Target alignment in the Shen-Guang II Upgrade laser facility. High Power Laser Sci. Eng. 2018, 6, e10. [Google Scholar] [CrossRef]
- Harding, E.C.; Ao, T.; Bailey, J.E.; Loisel, G.; Sinars, D.B.; Geissel, M.; Rochau, G.A.; Smith, I.C. Analysis and implementation of a space resolving spherical crystal spectrometer for X-ray Thomson scattering experiments. Rev. Sci. Instrum. 2015, 86, 043504. [Google Scholar] [CrossRef]
- Brown, G.V.; Beiersdorfer, P.; Hell, N.; Magee, E. Experimentally determining the relative efficiency of spherically bent germanium and quartz crystals. Rev. Sci. Instrum. 2016, 87, 11D620. [Google Scholar] [CrossRef]
- Bitter, M.; Hill, K.W.; Gao, L.; Kraus, B.F.; Efthimion, P.C.; Delgado-Aparicio, L.; Pablant, N.; Stratton, B.; Schneider, M.; Coppari, F.; et al. A new toroidal X-ray crystal spectrometer for the diagnosis of high energy density plasmas at the National Ignition Facility. Rev. Sci. Instrum. 2018, 89, 10F118. [Google Scholar] [CrossRef]
- Klementiev, K.; Chernikov, R. Powerful scriptable ray tracing package xrt. In Proceedings of the Advances in Computational Methods for X-ray Optics III, San Diego, CA, USA, 18–21 August 2014. [Google Scholar] [CrossRef]
- Yang, Q.; Ye, Y.; Chen, G.; Li, Z.; Yang, L.; Peng, Q.; Huang, X.; Cai, H.; Li, J. Focusing X-ray spectrograph with spatial resolution and uniform dispersion. Nucl. Instrum. Methods Phys. Res. Sect. A 2011, 634, 52–58. [Google Scholar] [CrossRef]
- Lu, J.; Xiao, S.; Yang, Q.; Liu, L.; Wu, Y. Spatially-resolved spectra from a new uniform dispersion crystal spectrometer for characterization of Z-pinch plasmas. J. Quant. Spectrosc. Radiat. Transf. 2013, 116, 41–48. [Google Scholar] [CrossRef]
- Pan, X.; Šmíd, M.; Štefaníková, R.; Donat, F.; Baehtz, C.; Burian, T.; Cerantola, V.; Gaus, L.; Humphries, O.S.; Hajkova, V.; et al. Imaging X-ray spectrometer at the high energy density instrument of the European X-ray free electron laser. Rev. Sci. Instrum. 2023, 94, 033501. [Google Scholar] [CrossRef]
- Henke, B.L.; Gullikson, E.M.; Davis, J.C. X-ray Interactions: Photoabsorption, Scattering, Transmission, and Reflection at E = 50–30,000 eV, Z = 1–92. At. Data Nucl. Data Tables 1993, 54, 181–342. [Google Scholar] [CrossRef]


| Material | 2d/Å | a/mm | b/mm | R/mm | θ0 | E0/keV | E/keV | l/mm | w/mm | ΔL/mm |
|---|---|---|---|---|---|---|---|---|---|---|
| Ge<311> | 3.41 | 25° | 8.60 | 7.48–10.24 | 100 | 15 | 18 | |||
| Ge<331> | 2.60 | 400 | 180 | 400 | 11.30 | 9.82–13.46 | ||||
| Ge<531> | 1.91 | 15.34 | 13.33–18.27 |
| Material | θ0 | E0/keV | E/keV | ∆E/eV | E/∆E |
|---|---|---|---|---|---|
| Ge<311> | 20 | 10.63 | 8.72–13.94 | 3.50–6.64 | 2100–2500 |
| Ge<331> | 13.97 | 11.47–18.19 | 4.35–9.25 | 2000–2600 | |
| Ge<531> | 15.57 | 18.95–24.85 | 6.30–11.83 | 2100–3000 | |
| Ge<311> | 30 | 7.27 | 6.57–8.17 | 3.18–6.75 | 1200–2100 |
| Ge<331> | 8.63 | 8.63–10.74 | 4.12–8.51 | 1300–2100 | |
| Ge<531> | 12.97 | 11.72–14.56 | 5.98–12.41 | 1200–2000 |
Disclaimer/Publisher’s Note: The statements, opinions and data contained in all publications are solely those of the individual author(s) and contributor(s) and not of MDPI and/or the editor(s). MDPI and/or the editor(s) disclaim responsibility for any injury to people or property resulting from any ideas, methods, instructions or products referred to in the content. |
© 2023 by the authors. Licensee MDPI, Basel, Switzerland. This article is an open access article distributed under the terms and conditions of the Creative Commons Attribution (CC BY) license (https://creativecommons.org/licenses/by/4.0/).
Share and Cite
Yi, S.; Du, H.; Si, H.; Yu, Y.; Xiong, J.; Wang, Z. A Wide-Range High-Resolution X-ray Crystal Spectrometer for Laser–Plasma Diagnostics. Photonics 2023, 10, 1054. https://doi.org/10.3390/photonics10091054
Yi S, Du H, Si H, Yu Y, Xiong J, Wang Z. A Wide-Range High-Resolution X-ray Crystal Spectrometer for Laser–Plasma Diagnostics. Photonics. 2023; 10(9):1054. https://doi.org/10.3390/photonics10091054
Chicago/Turabian StyleYi, Shengzhen, Huiyao Du, Haoxuan Si, Yue Yu, Jun Xiong, and Zhanshan Wang. 2023. "A Wide-Range High-Resolution X-ray Crystal Spectrometer for Laser–Plasma Diagnostics" Photonics 10, no. 9: 1054. https://doi.org/10.3390/photonics10091054
APA StyleYi, S., Du, H., Si, H., Yu, Y., Xiong, J., & Wang, Z. (2023). A Wide-Range High-Resolution X-ray Crystal Spectrometer for Laser–Plasma Diagnostics. Photonics, 10(9), 1054. https://doi.org/10.3390/photonics10091054