Article

Miniaturized Dual-Beam Optical Trap Based on Fiber Pigtailed Focuser

State Key Laboratory of Extreme Photonics and Instrumentation, Institute for Quantum Sensing, College of Optical Science and Engineering, Zhejiang University, Hangzhou 310027, China
*
Authors to whom correspondence should be addressed.
Photonics 2023, 10(9), 1007; https://doi.org/10.3390/photonics10091007
Submission received: 16 August 2023 / Revised: 30 August 2023 / Accepted: 1 September 2023 / Published: 3 September 2023
(This article belongs to the Special Issue Levitated Optomechanics)

Abstract

:
Optical traps, utilizing a laser to confine and manipulate microscopic particles, are widely employed in various scientific applications. We propose a miniaturized dual-beam fiber optical trap for acceleration sensing. It comprises two counter-propagating beams’ output from a customized pair of single-mode fiber pigtailed focusers (SMFPF). We investigate the correlation between the misalignment and the coupling efficiency of the SMFPF pair. By maximizing the coupling efficiency, the optimal alignment is achieved. A multimode fiber (MMF) is introduced to collect and transmit side-scattered light of a trapped microsphere for motion detection. By analyzing the experimental output signal, we acquire displacement information of the trapped microspheres under both aligned and misaligned conditions. This paper provides a simple and practical solution for the alignment of dual beams and the integration of the optical traps’ levitation and detection structure, which lay a solid foundation for the further miniaturization of dual-beam optical traps.

1. Introduction

Optical traps, also known as optical tweezers, are versatile tools that employ the radiation pressure of focused laser beams to manipulate microscopic particles. They were first demonstrated by Ashkin in the 1970s [1]. Since then, optical traps have been extensively applied in various fields, such as biology [2,3,4], fundamental physics [5,6], and precision force measurements [7,8].
In acceleration sensing [9,10,11], particles trapped in optical traps serve as acceleration-sensitive units. Various types of optical traps have been developed for acceleration sensing, including single-beam optical traps [11,12] and dual-beam optical traps [13,14]. Compared to the former one, dual-beam optical traps exhibit advantages such as higher resonant frequencies, a larger measurement range, and improved stability, making them more suitable for acceleration sensing. However, the dual-beam scheme requires a quite critical alignment between counter-propagating beams, both in the radial and axial directions, which gains the complexity of the system; increased complexity leads to a larger overall system volume. In addition to the levitation structure, motion detection of the trapped particles is also a crucial component of optical tweezers research. Conventional detection schemes include microscopic image processing [15] and photoelectric detection [16,17,18]. These usually need extra optical elements, such as the objective, to process trapped particles’ scattered light.
Miniaturizing dual-beam optical traps is crucial for integrating them into compact engineering and scientific research systems. But, the levitation and detection structures require multiple optical components, hindering the miniaturization of conventional optical traps mentioned above. Many research works propose chip-scaled optical traps, which attain nanoscale dimensions through microfabrication techniques [19,20,21]. In addition to on-chip optical traps, fiber optical traps are also a direction for miniaturization. Dual-beam optical traps can be easily built by two counter-propagating beams’ direct output from two single-mode fibers [22,23]. To further enhance the stability of optical traps, fiber end faces have been coupled with many nanofabricated structures to generate tightly focused laser beams [24,25]. In dual-beam fiber optical traps, side-scattered light is usually used for detection. There are also some novel fiber-based detection schemes, such as detection based on laser Doppler velocimetry [26] and detection based on the multimode fiber (MMF) [27,28].
In this study, we develop a compact dual-beam fiber optical trap with both levitation and detection structures composed of fibers to realize miniaturization. The relationship between the coupling efficiency of the dual beams and misalignment is simulated to evaluate the misalignment and achieve optimal alignment easily. Furthermore, a ray optics model is established to depict the response of the coupled-in-MMF scattered light power with respect to the microsphere displacement. In the experiment, we acquire displacement information of the trapped microspheres under both the aligned and misaligned conditions.

2. Coupling Simulation

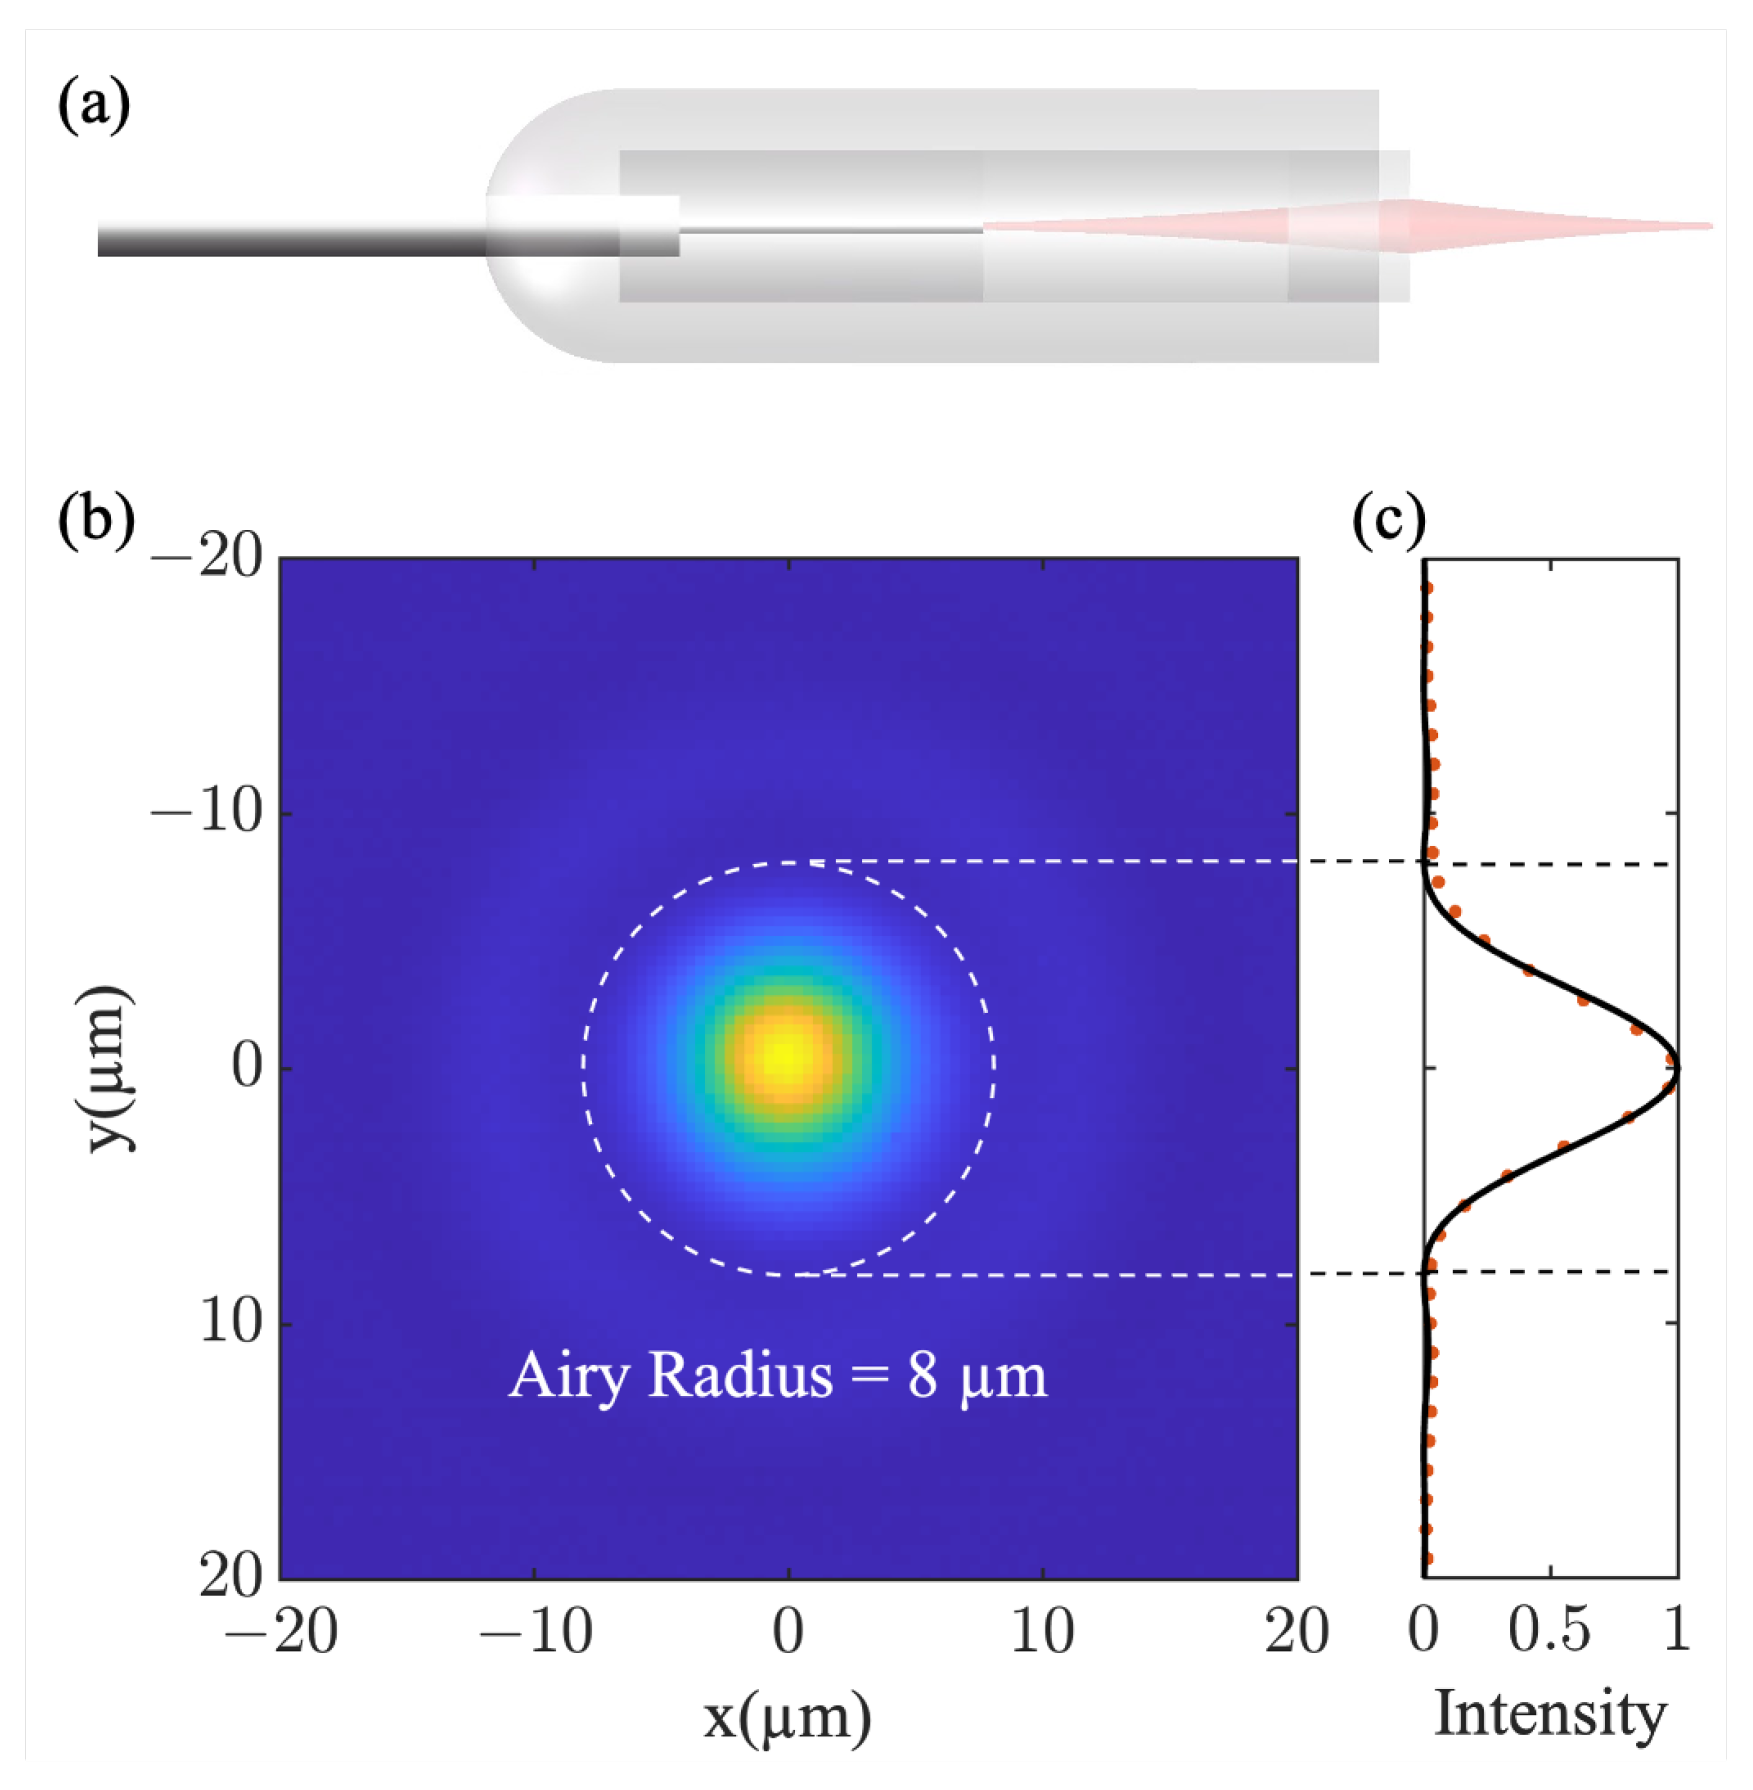
2.1. Coupling Efficiency and Alignment

We customize a pair of 1064 nm single-mode fiber pigtailed focusers (SMFPF) to miniaturize the core sensing component of optical tweezers. As shown in Figure 1a, the SMFPF comprises a glass tube. A lens and single-mode fiber pigtail are glued inside the tube. The SMFPF’s packaging dimensions are 2.78 mm in diameter and 9 mm in length. A laser will be the output from the fiber pigtail and focused by the lens after beam expansion in the glass tube. The outgoing beam of the SMFPF is a focused standard Gaussian beam. The testing experiment shows that the SMFPF has a focal length of 3.5 mm with the focused laser profile presented in Figure 1b. The numerical aperture (NA) of the SMFPF can be calculated as 0.08 by fitting the Airy disk.
The SMFPF pair is applied to build a dual-beam fiber optical trap. Based on the SMFPF pair, we propose a simple and convenient method for alignment, which is maximizing one SMFPF coupling efficiency from the other one. The coupling efficiency refers to the proportion of light transmitted from one SMFPF to another. Once the highest coupling efficiency is achieved, the best alignment of the SMFPF pair is accomplished, in both radial and axial directions. In order to acquire alignment accuracy, we study the relationship between the coupling efficiency and misalignment.
The dual beams coupling model is shown in Figure 2. Two Gaussian beams are the output from the left and right SMFPF, respectively, propagated in opposite directions, and then converged near a specific point. We consider three misalignment parameters of the two beams: axial offset d, radial offset r, and angular offset θ . The radial offset r is only investigated in the y-direction due to the radial symmetry.
Denote the left beam’s wave function as:
E 1 ( d , r , θ ) = 2 π ω 0 2 ω 0 ω ( d ) Exp ρ 2 ( r ) ω 2 ( d ) Exp i k d i k ρ 2 ( r ) 2 R ( d ) + i ζ ( d ) Exp ( i k θ )
where ω 0 = 0.61 λ /NA is the beam’s waist radius, ω ( d ) = ω 0 1 + d / z 0 2 is the beam radius, ρ 2 r = y r 2 is the radial distance, k = 2 π / λ is the wave number, R d = d 1 + d / z 0 2 is the curvature radius of the beam, ζ d = t a n 1 d / z 0 is a phase factor, z 0 = π ω 0 2 / λ is the beam’s Rayleigh range, and λ is the beam’s wavelength. Meanwhile, the right beam’s wave function can be simplified as E 2 ( y ) = 2 π ω 0 2 Exp y 2 / ω 0 2 .
To simplify the calculation, both the left and right beams’ power is set to 1 W, calculated as P 1 = + E 1 2 d x d y for the left beam and similarly for the right. By using the overlap integral, the left laser power coupled into the right can be described as [29,30]:
P η = + E 1 * · E 2 d x d y 2 .
The coupling efficiency η of the left beam coupling into the right is defined as:
η = P η P 1 = + E 1 * · E 2 d x d y 2 .
In our experiment, λ = 1064 nm and ω 0 = 0.61 λ /NA = 8 μ m. According to Equations (1)–(3), the coupling efficiency η varies with the axial offset d, radial offset r, and angular offset θ , as shown in Figure 3. Focusing solely on the variation of coupling efficiency η with a specific offset, simulation results indicate that when the axial offset d = 1 mm, or the radial offset r = 12 μ m, or the angular offset θ = 60 mrad, the coupling efficiency η will decrease from 1 to 0.1. The simulation indicates that the coupling efficiency η with respect to the axial offset d, radial offset r, and angular offset θ is symmetric. Therefore, we only present the region where three misalignment parameters are positive. It shows that the coupling efficiency η is more sensitive to the radial offset r than the axial offset d. Therefore, the radial alignment is the easiest to be achieved. Considering the experiment’s limitations (the resolution of the translation stage), the axial alignment accuracy can reach 3 μ m, the radial alignment accuracy can reach 60 nm, and the angular alignment accuracy can reach 0.5 mrad under ideal conditions.

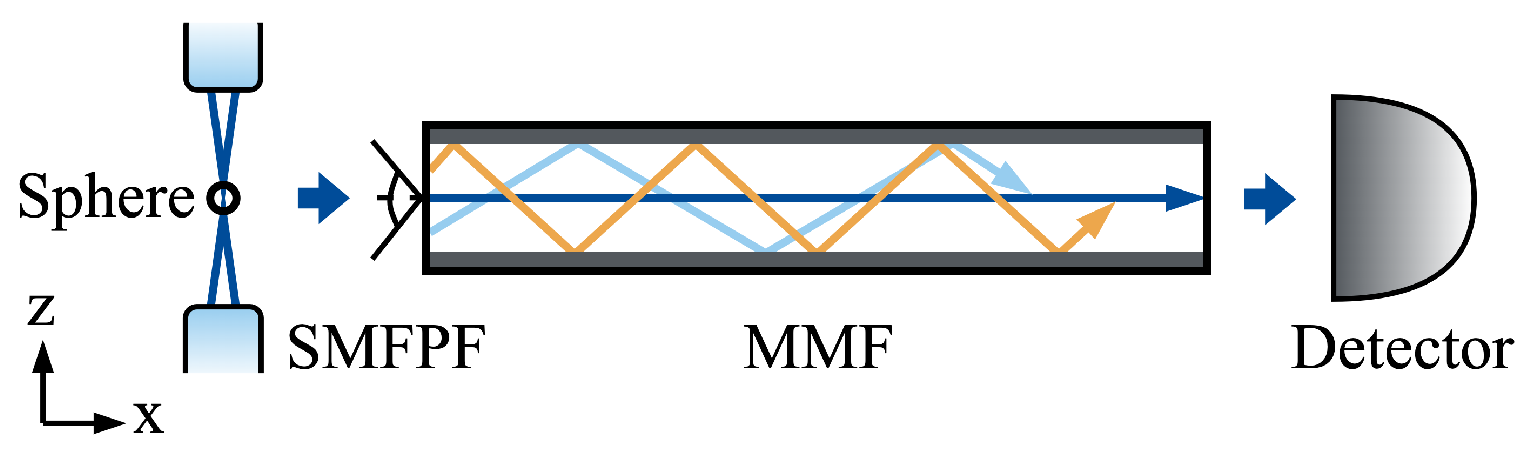
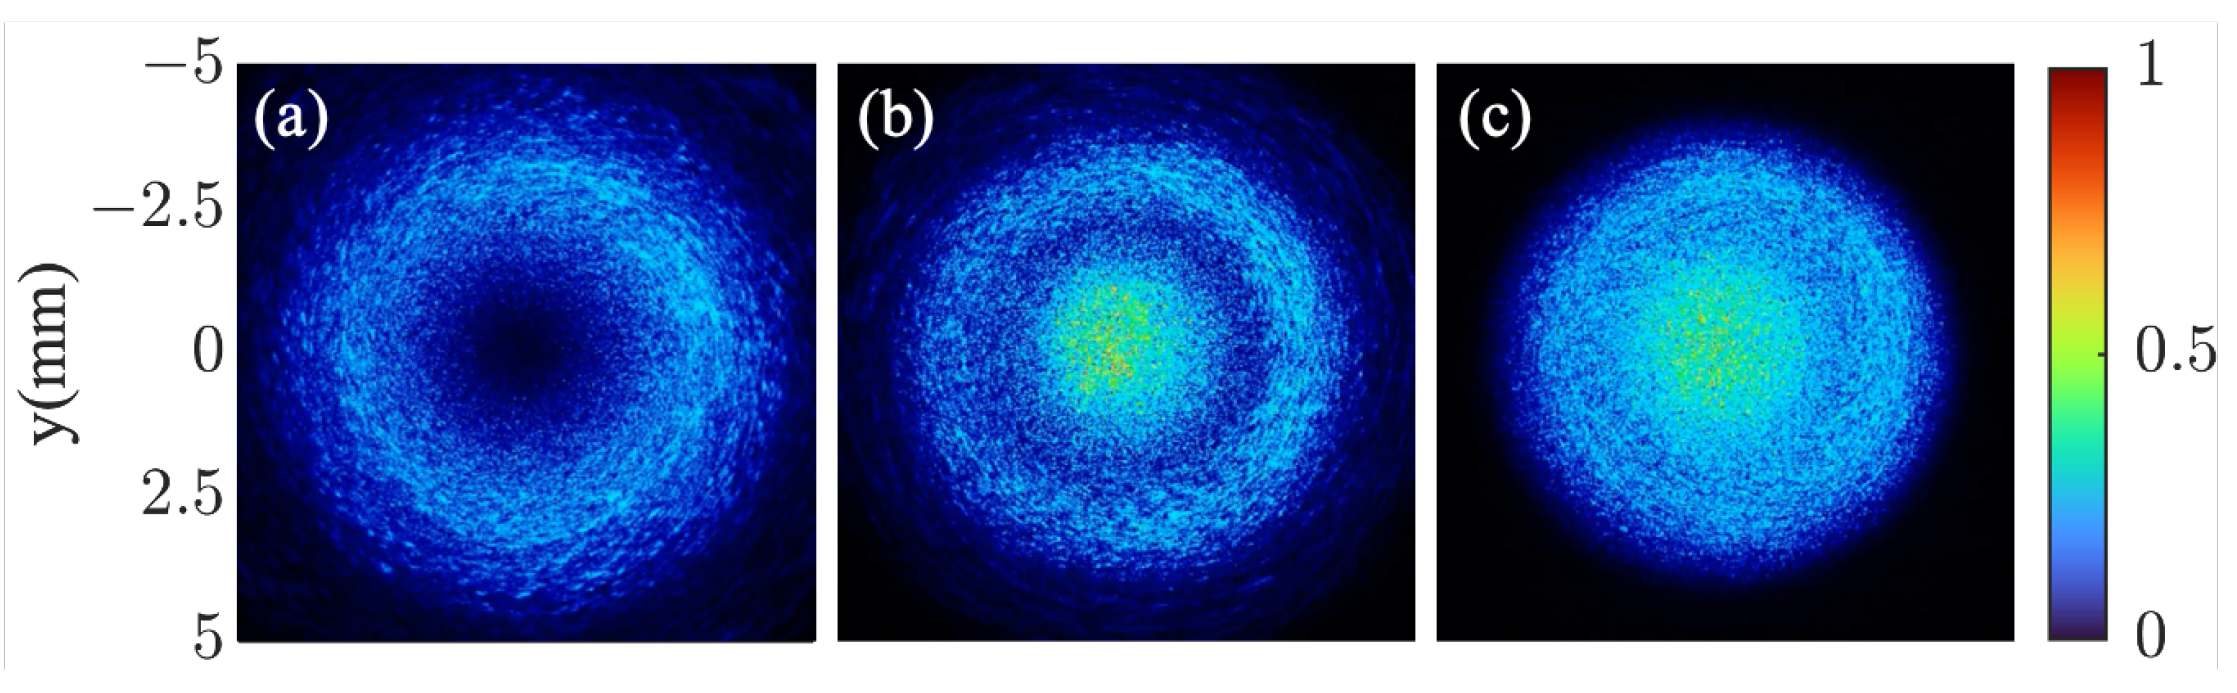
2.2. Side-Scattered Light Tracking and Coupling in MMF

We build a ray optics model to track the scattering light of a 10- μ m-diameter silica microsphere (refractive index is 1.46), which is trapped in the dual-beam optical trap in air. In the experiment, we apply a step-index MMF with a core diameter of 1 mm, a cladding diameter of 1.1 mm, and an NA of 0.22. Since the core diameter of the MMF is much larger than the laser wavelength, the transmission of light in the step-index MMF can be analyzed by ray optics [31]. The MMF core index is set to be 1.46 and the cladding index is 1.44.
As shown in Figure 4, the single incident laser beam is decomposed into thousands of optic rays, each carrying different energy, and then hits the sphere. It is assumed that the sphere is levitated at the optical trap center. Since the surface of the sphere is not perfectly smooth, the incident light will be diffused and reflected in a random direction, leading to energy loss as it scatters in various directions. Part of the side-scattered light will couple into the MMF, and those that meet MMF’s total internal reflection will be successfully transmitted to the detector. By integrating all the rays that hit the detector, it is possible to simulate the laser profile and power of the MMF’s outgoing beam.
The side-scattered light that can be collected and transmitted is influenced by the MMF’s relative position with the center of the optical trap. Maintain the sphere’s position and the relative position of the detector and the MMF as unchanged. Figure 5 shows the varying output beam profile of the detector when the MMF is moved to a new position. As the distance between the MMF’s incident end face and the center of the trap increases along the x-axis, the size of the output light diminishes. Additionally, when the MMF deviates from the center of the trap in the z-axis, the output beam profile is presented as a donut profile.
To detect the trapped microsphere’s motion, we need to obtain the laser power on the detector, which changes with the microsphere displacement. Fix the center of the MMF’s incident end face at (1, 0, 0) (Unit: mm). Specifically, when the sphere is located at (0, 0, 0), the calculated power is considered the reference power P R . The normalized power difference is denoted as Δ P / P R = P P R / P R to quantify how the power varies with the sphere position, where P is the calculated power.
Based on simulation calculations and experimental experience [13], it is necessary to ensure the existence of a monotonically increasing interval of at least 0.1 μ m for this experiment. As shown in Figure 6, the fitted curves of the normalized power difference conform to a quadratic polynomial pattern. But in the range of ± 0.1 μ m, the fitted curve can be approximately regarded as linear.
In actuality, the equilibrium position of the trapped sphere will not be completely located in the center of the optical trap. According to the calculation results, due to the microsphere gravity, the authentic equilibrium point of the microsphere will be approximately one hundred nanometers below the center of the optical trap. The simulation results in this case are very similar to Figure 6. Hence, it is reasonable to conclude that the effect of microsphere gravity on the experimental measurements is relatively negligible. Therefore, it is feasible to use the MMF for displacement detection.

3. Experiment

3.1. Experimental Setup

The schematic of the experimental setup is shown in Figure 7. The dual-beam fiber optical trap is constructed by two counter-propagating beams’ output from a customized SMFPF pair. The packaging volume of the core sensing component of the trap is Φ 2.78 mm × 25 mm. Using a 50:50 fiber coupler (Thorlabs Inc., NJ, USA, PNH1064R5A1) to connect the SMFPF pair, respectively, ensures that the power of two outgoing beams is equal. An objective (Nikon, Tokyo, Japan, CFI Apo NIR 60X 1.0W) and CCD (OMRON SENTECH Co. Ltd., Ebina-shi, STC-MCA5MUSB3) are additionally set up to assist in observing the trapped microsphere. The filter (Thorlabs TF1) blocks 1064 nm of wavelength light, while preserving the white light emitted by the LED.
We introduce a step-index MMF (LBTEK, Shenzhen, China, MMC1000L-0.22-PC-1) aligning to the trap’s center for motion detection. It has a core diameter of 1 mm, and an NA of 0.22. It collects side-scattered light of the trapped microsphere at a distance of nearly 1 mm from the trap’s center. Due to the MMF’s aperture limitation, only a small amount of side-scattered light can be collected and transmitted to the photodetector. The photodetector outputs a time-domain voltage signal, which can be further converted into power spectral density (PSD) to extract the displacement information from the side-scattered light.
The right SMFPF is fixed, while the left one is mounted on a 5-axis stage that enables three degrees of translation and two degrees of rotation. The 5-axis stage is composed of a 3-axis translation stage with an accuracy of 1 μ m (Thorlabs NanoMax 300) and an angular adjustment mount (Thorlabs KS1). We need to maximize the power of the laser output from the right SMFPF by moving the left SMFPF. Optimal alignment is achieved when the measured coupled power is maximum. The maximum coupling efficiency achieved in the experiment is 53%, about two times larger than ordinary dual-fiber coupling. Since the coupling efficiency η is very sensitive to the radial offset r, we assume that the radial offset r is only at the nanoscale level, as shown in Figure 3.

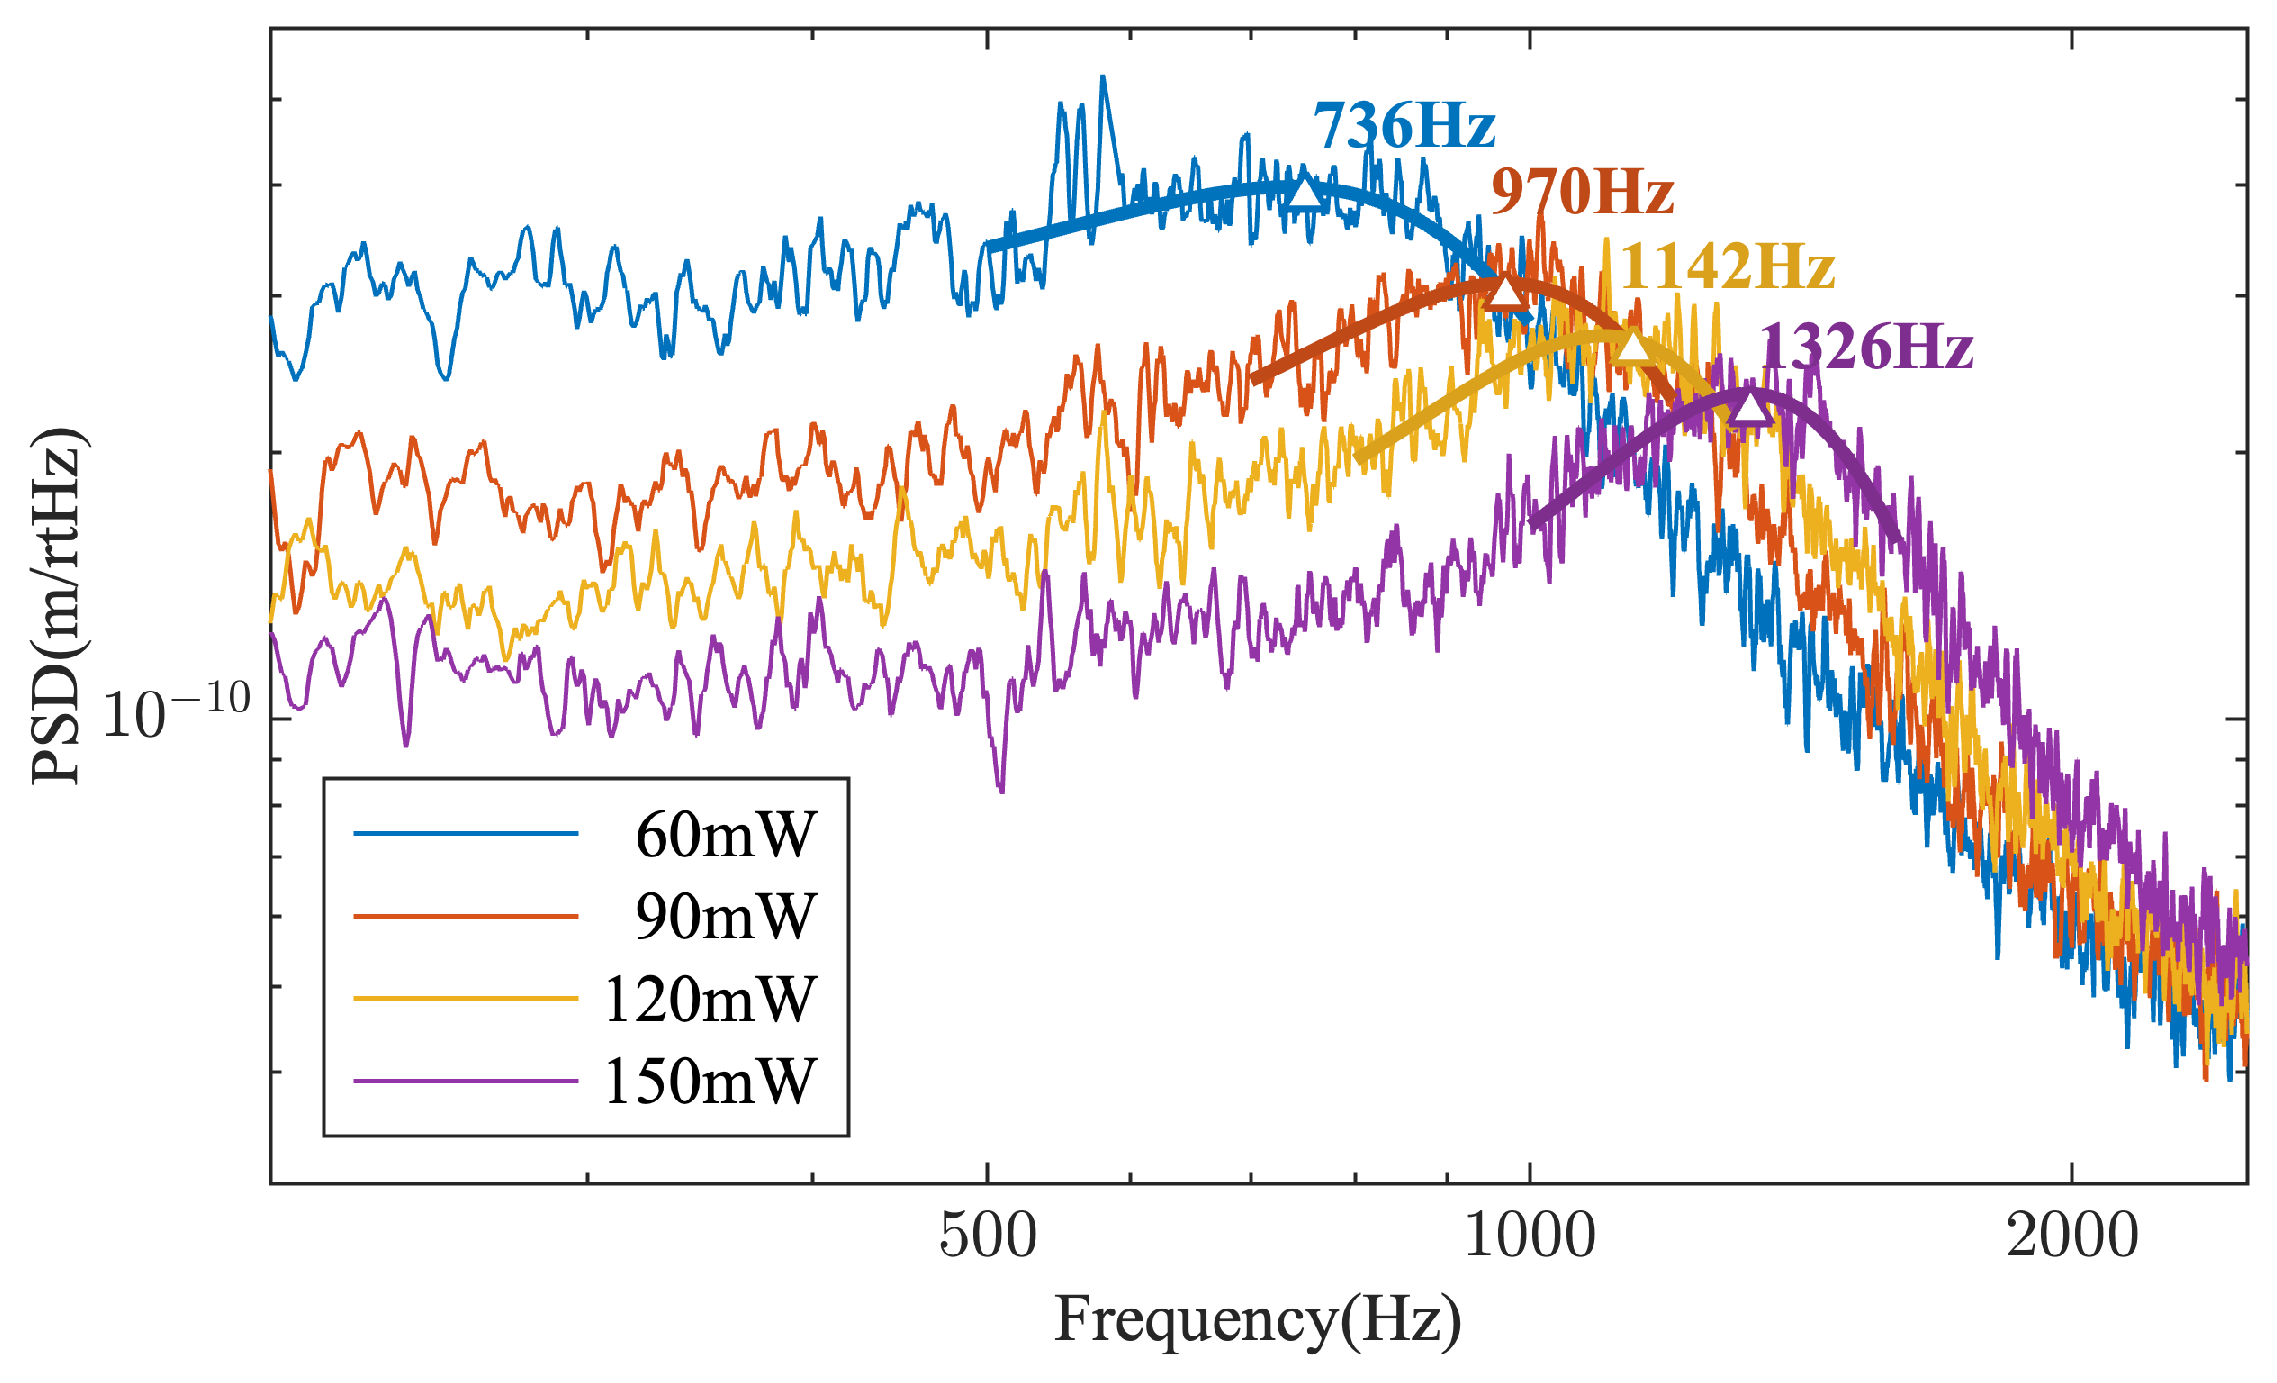
3.2. Trapping Performance

As shown in Figure 8, a 10- μ m-diameter silica microsphere is successfully trapped in the dual-beam fiber optical trap in air.
The single outgoing beam has a power P 0 of 150 mW and a wavelength of 1064 nm. The experiment shows that when the laser power P 0 is 150 mW, this optical trap can stably trap silica microspheres with a diameter of 10 μm for at least six hours. The trapped microsphere is observed to escape when the laser power reduces to 18 mW, consistent with the calculation results. The experiment shows that the microsphere can also be trapped with a coupling efficiency as low as 18%.
The MMF’s outgoing beam has a power of about 100 μ W. Figure 9 shows varying normalized laser profiles of the MMF’s outgoing light as the relative position of the MMF and the trap’s center changes, which is consistent with the simulated result (Figure 5).
The sampling frequency of the photodetector is 58.6 kHz, and the sampling time is about 1 s. The time-domain output signal is converted to PSD to evaluate the trap stiffness. The microsphere centroid displacement’s PSD is described by the following equation [14]:
S x ( ω ) = 2 k B T γ κ m ω 2 2 ω 2 γ 2
where k B is the Boltzmann constant, T is the environment temperature, κ is the trap stiffness, γ = 6 π R μ is the Stokes damping coefficient, R is the radius of the trapped microsphere, μ is the dynamic viscosity, and m is the trapped particle’s mass. Since our experiment is at atmospheric pressure and the environment temperature T is 297 K, the dynamic viscosity μ is 1.85 × 10 5 Pa·s. Therefore, when the microsphere’s radius R is 5 μ m, the damping coefficient γ equals 1.74 × 10 9 N·s/m in air.
The signal that can be measured directly is the voltage converted from the microsphere’s displacement by the photodetector. By fitting the measured data with Equation (4), we can obtain the voltage-displacement conversion factor and then calibrate the displacement signal of the microsphere [32].
Figure 10 shows the voltage PSD of the photodetector and the corresponding time-domain displacement signal of the microsphere when the microsphere is trapped by a beam with a power P 0 of 150 mW.
The calculated voltage-displacement conversion factor is about 8.4 × 10 5 V/m. We can obtain the radial resonant frequency f 0 = 1326 Hz and the trap stiffness κ = m · ( 2 π f ) 2 80 pN/ μ m.
Under the aligned conditions, we change the beam power P 0 to observe the displacement PSD changes. Figure 11 displays that the different displacement PSDs as the beam power P 0 are 60, 90, 120, and 150 mW under an alignment condition. After fitting, the corresponding radial resonance frequencies f 0 can be obtained as 736, 970, 1142, and 1326 Hz. The resonant frequency f 0 is proportional to the root sign of the beam power P 0 . At the same time, as the beam power P 0 increases, the Brownian motion displacement of the microsphere exhibits a decremental trend and the resonance peak narrows. That is because increasing the laser power enhances the radial force of the optical trap, leading to an increase in trap stiffness.
We further investigate the motion of the microsphere under different dual-beams’ radial offset r. When r = 10 μ m, it can be observed through CCD that the microsphere begins to rotate obviously, with a displacement range of about 10 μ m. When r = 13 μ m, the microsphere escapes, and the coupling efficiency reduces to around 5%. Figure 12 shows the voltage PSD when the dual beams’ radial offset r is 4, 8, 10, and 12 μ m.
As the microsphere begins to rotate obviously, the PSD changes a lot. The radial resonance peak of the microsphere is submerged, and the rotation peak of the microsphere appears. The PSD has an arched shape and becomes steeper at a high frequency as the misalignment intensifies. This is a typical PSD that appears when severe misalignment occurs.

4. Discussion

The above experiment detects the trapped microsphere’s motion by monitoring the MMF’s outgoing beam power. Compared to single-mode fibers, larger core sizes and the NA of MMFs enhance side-scattered light collection. However, several factors, such as the incident angles [33,34], can impact the mode of the MMF’s output light, consequently influencing the actual detection results to varying degrees. If more precise and detailed simulation results of side-scattered light coupled in the MMF are needed, calculations should be based on wave optics rather than ray optics.
Furthermore, the alignment of dual beams in the dual-beam optical trap holds significant importance, because the trapped particle may rotate or escape when misalignment happens [22,35]. Our experimental results based on different radial offsets also prove it. The micron pinhole is commonly used to help align, but it requires an extra stage, which is incompatible with our compact setup. Meanwhile, the operational steps of that method are relatively complex and time-consuming. However, based on the calculated coupling efficiency model, it is possible to realize the alignment of dual beams automatically and evaluate three misalignment parameters. In subsequent work, with algorithms and sensing technology, an automated alignment system has the hope of attaining heightened precision in alignment while reducing operational time and complexity.
Previous efforts in on-chip and fiber optical traps have successfully reduced the size of the optical traps to the micro and even the nanoscale levels [20,23]. However, trapped particles of low mass and a liquid environment with a high damping coefficient pose challenges in meeting the requirements for acceleration sensing. In the meantime, their tiny dimensions make it difficult to offer sufficient space for trapping large-sized microspheres in air. Compared to them, our millimeter-sized dual-beam fiber optical trap composed of fibers provides a different solution of miniaturization for acceleration sensing. In addition to the characteristics of miniaturization, it can provide adequate trapping stiffness for microspheres around ten micrometers in size. According to calculations based on our design, the maximum acceleration of the trapped microsphere is about 13 g. It also has the capability for straightforward dual-beam alignment and trapped microsphere motion detection. The attributes of miniaturization render it more adaptable to constrained spaces, promoting portability and cost-effectiveness.

5. Conclusions

In this study, we develop a compact dual-beam fiber optical trap with both levitation and detection structures composed of fibers, with the core sensing compnent’s volume of Φ 2.78 mm × 25 mm. The trap is constructed by two counter-propagating beams’ output from a customized SMFPF pair. We study the correlation between the coupling efficiency of the SMFPF pair’s outgoing dual beams and three misalignment parameters, namely the axial offset, radial offset, and angular offset. The simulation result shows that the coupling efficiency is sensitive to the radial offset, which facilitates achieving precise radial alignment. Based on the simulation results, we achieved optimal alignment in the experiment. Under an alignment condition, the 10- μ m-diameter silica microspheres can be easily trapped in air.
We introduce an MMF with a core diameter of 1 mm and an NA of 0.22 for the detection scheme. It is applied to collect the side-scattered light of a trapped microsphere and transmit it to a photodetector. A ray optics model is built to characterize how the microsphere’s displacement affects the coupled-in side-scattered light power in the MMF. It shows a linear detection range of at least ± 0.1 μ m, rendering it suitable for experimental applications. By monitoring the photodetector output signal, the resonant frequency and displacement information of the microsphere can be extracted from the PSD. We measured the PSD under various laser power conditions and radial misalignment offsets.
Overall, this article’s alignment and detection schemes have proven their feasibility in the simulation and experiments. Combined with the SMFPF pair, it can provide a simple and practical solution for the alignment of dual beams and the integration of optical traps. It serves as a new method for the miniaturization of dual-beam optical traps.

Author Contributions

Conceptualization, N.L.; software, Q.X.; validation, Q.X., N.L. and X.C.; formal analysis, Q.X. and N.L.; investigation, Q.X. and N.L.; resources, C.L. and H.H.; writing—original draft preparation, Q.X.; writing—review and editing, N.L.; visualization, Q.X.; supervision, N.L.; funding acquisition, N.L. and H.H. All authors have read and agreed to the published version of the manuscript.

Funding

This research was supported by the National Natural Science Foundation of China (No. 62205290, No. 62075193, No. 62005248), Major Scientific Research Project of Zhejiang Lab, China (No. 2019MB0AD01), National Program for Special Support of Top-Notch Young Professionals, China (No. W02070390), and Center-initiated Research Project of Zhejiang Lab, China (2022MB0AL02).

Institutional Review Board Statement

Not applicable.

Informed Consent Statement

Not applicable.

Data Availability Statement

Not applicable.

Conflicts of Interest

The authors declare no conflict of interest. The funders had no role in the design of the study; in the collection, analyses, or interpretation of data; in the writing of the manuscript; or in the decision to publish the results.

Abbreviations

The following abbreviations are used in this manuscript:
SMFPFsingle-mode fiber pigtailed focuser
MMFmultimode fiber
NAnumerical aperture
PSDpower spectral density

References

  1. Ashkin, A. Acceleration and Trapping of Particles by Radiation Pressure. Phys. Rev. Lett. 1970, 24, 156–159. [Google Scholar] [CrossRef]
  2. Constable, A.; Kim, J.; Mervis, J.; Zarinetchi, F.; Prentiss, M. Demonstration of a Fiber-Optical Light-Force Trap. Opt. Lett. 1993, 18, 1867. [Google Scholar] [CrossRef]
  3. Kim, J.D.; Lee, Y.G. Trapping of a Single DNA Molecule Using Nanoplasmonic Structures for Biosensor Applications. Biomed. Opt. Express 2014, 5, 2471. [Google Scholar] [CrossRef] [PubMed]
  4. Guck, J.; Ananthakrishnan, R.; Mahmood, H.; Moon, T.J.; Cunningham, C.C.; Käs, J. The Optical Stretcher: A Novel Laser Tool to Micromanipulate Cells. Biophys. J. 2001, 81, 767–784. [Google Scholar] [CrossRef]
  5. Chu, S.; Bjorkholm, J.E.; Ashkin, A.; Cable, A. Experimental Observation of Optically Trapped Atoms. Phys. Rev. Lett. 1986, 57, 314–317. [Google Scholar] [CrossRef] [PubMed]
  6. Rider, A.D.; Moore, D.C.; Blakemore, C.P.; Louis, M.; Lu, M.; Gratta, G. Search for Screened Interactions Associated with Dark Energy below the 100 μm Length Scale. Phys. Rev. Lett. 2016, 117, 101101. [Google Scholar] [CrossRef]
  7. Ranjit, G.; Atherton, D.P.; Stutz, J.H.; Cunningham, M.; Geraci, A.A. Attonewton Force Detection Using Microspheres in a Dual-Beam Optical Trap in High Vacuum. Phys. Rev. A 2015, 91, 051805. [Google Scholar] [CrossRef]
  8. Ranjit, G.; Cunningham, M.; Casey, K.; Geraci, A.A. Zeptonewton Force Sensing with Nanospheres in an Optical Lattice. Phys. Rev. A 2016, 93, 053801. [Google Scholar] [CrossRef]
  9. Monteiro, F.; Ghosh, S.; Fine, A.G.; Moore, D.C. Optical Levitation of 10-Ng Spheres with Nano-g Acceleration Sensitivity. Phys. Rev. A 2017, 96, 063841. [Google Scholar] [CrossRef]
  10. Rider, A.D.; Blakemore, C.P.; Gratta, G.; Moore, D.C. Single-Beam Dielectric-Microsphere Trapping with Optical Heterodyne Detection. Phys. Rev. A 2018, 97, 013842. [Google Scholar] [CrossRef]
  11. Monteiro, F.; Li, W.; Afek, G.; Li, C.l.; Mossman, M.; Moore, D.C. Force and Acceleration Sensing with Optically Levitated Nanogram Masses at Microkelvin Temperatures. Phys. Rev. A 2020, 101, 053835. [Google Scholar] [CrossRef]
  12. Gieseler, J.; Novotny, L.; Quidant, R. Thermal Nonlinearities in a Nanomechanical Oscillator. Nat. Phys. 2013, 9, 806–810. [Google Scholar] [CrossRef]
  13. Zhu, X.; Li, N.; Yang, J.; Chen, X.; Hu, H. Revolution of a Trapped Particle in Counter-Propagating Dual-Beam Optical Tweezers under Low Pressure. Opt. Express 2021, 29, 11169. [Google Scholar] [CrossRef] [PubMed]
  14. Li, T.; Kheifets, S.; Raizen, M.G. Millikelvin Cooling of an Optically Trapped Microsphere in Vacuum. Nat. Phys. 2011, 7, 527–530. [Google Scholar] [CrossRef]
  15. Otto, O.; Gutsche, C.; Kremer, F.; Keyser, U.F. Optical Tweezers with 2.5kHz Bandwidth Video Detection for Single-Colloid Electrophoresis. Rev. Sci. Instrum. 2008, 79, 023710. [Google Scholar] [CrossRef]
  16. Li, T.; Kheifets, S.; Medellin, D.; Raizen, M.G. Measurement of the Instantaneous Velocity of a Brownian Particle. Science 2010, 328, 1673–1675. [Google Scholar] [CrossRef] [PubMed]
  17. Taylor, M.A.; Bowen, W.P. A Computational Tool to Characterize Particle Tracking Measurements in Optical Tweezers. J. Opt. 2013, 15, 085701. [Google Scholar] [CrossRef]
  18. Xu, Z.; Song, W.; Crozier, K.B. Direct Particle Tracking Observation and Brownian Dynamics Simulations of a Single Nanoparticle Optically Trapped by a Plasmonic Nanoaperture. ACS Photonics 2018, 5, 2850–2859. [Google Scholar] [CrossRef]
  19. Kotnala, A.; DePaoli, D.; Gordon, R. Sensing Nanoparticles Using a Double Nanohole Optical Trap. Lab Chip 2013, 13, 4142. [Google Scholar] [CrossRef]
  20. Brunetti, G.; Sasanelli, N.; Armenise, M.N.; Ciminelli, C. Nanoscale Optical Trapping by Means of Dielectric Bowtie. Photonics 2022, 9, 425. [Google Scholar] [CrossRef]
  21. Conteduca, D.; Brunetti, G.; Pitruzzello, G.; Tragni, F.; Dholakia, K.; Krauss, T.F.; Ciminelli, C. Exploring the Limit of Multiplexed Near-Field Optical Trapping. ACS Photonics 2021, 8, 2060–2066. [Google Scholar] [CrossRef]
  22. Li, W.; Li, N.; Shen, Y.; Fu, Z.; Su, H.; Hu, H. Dynamic Analysis and Rotation Experiment of an Optical-Trapped Microsphere in Air. Appl. Opt. 2018, 57, 823. [Google Scholar] [CrossRef] [PubMed]
  23. Delabre, U.; Feld, K.; Crespo, E.; Whyte, G.; Sykes, C.; Seifert, U.; Guck, J. Deformation of Phospholipid Vesicles in an Optical Stretcher. Soft Matter 2015, 11, 6075–6088. [Google Scholar] [CrossRef] [PubMed]
  24. Hu, Z.; Wang, J.; Liang, J. Manipulation and Arrangement of Biological and Dielectric Particles by a Lensed Fiber Probe. Opt. Express 2004, 12, 4123. [Google Scholar] [CrossRef] [PubMed]
  25. Plidschun, M.; Ren, H.; Kim, J.; Förster, R.; Maier, S.A.; Schmidt, M.A. Ultrahigh Numerical Aperture Meta-Fibre for Flexible Optical Trapping. Light. Sci. Appl. 2021, 10, 57. [Google Scholar] [CrossRef]
  26. Xiong, W.; Xiao, G.; Han, X.; Chen, X.; Yang, K.; Luo, H. All-Fiber Interferometer for Displacement and Velocity Measurement of a Levitated Particle in Fiber-Optic Traps. Appl. Opt. 2019, 58, 2081. [Google Scholar] [CrossRef]
  27. Jensen-McMullin, C.; Lee, H.P.; Lyons, E.R. Demonstration of Trapping, Motion Control, Sensing and Fluorescence Detection of Polystyrene Beads in a Multi-Fiber Optical Trap. Opt. Express 2005, 13, 2634. [Google Scholar] [CrossRef]
  28. Kuhn, S.; Stickler, B.A.; Kosloff, A.; Patolsky, F.; Hornberger, K.; Arndt, M.; Millen, J. Optically Driven Ultra-Stable Nanomechanical Rotor. Nat. Commun. 2017, 8, 1670. [Google Scholar] [CrossRef] [PubMed]
  29. Cao, B.; Qiu, Z.; Huang, K.; Lü, D.; Zhang, X.; Lu, X. Single-Mode Fiber Auto-Coupling System with Wedges. Opt. Fiber Technol. 2021, 61, 102433. [Google Scholar] [CrossRef]
  30. Okamoto, K. Coupled Mode Theory. In Fundamentals of Optical Waveguides, 2nd ed.; Okamoto, K., Ed.; Academic Press: Burlington, MA, USA, 2006; pp. 159–207. [Google Scholar] [CrossRef]
  31. Doya, V.; Legrand, O.; Mortessagne, F.; Miniatura, C. Speckle Statistics in a Chaotic Multimode Fiber. Phys. Rev. E 2002, 65, 056223. [Google Scholar] [CrossRef]
  32. Berg-Sørensen, K.; Flyvbjerg, H. Power Spectrum Analysis for Optical Tweezers. Rev. Sci. Instrum. 2004, 75, 594–612. [Google Scholar] [CrossRef]
  33. Apriyanto, H.; Ravet, G.; Bernal, O.D.; Cattoen, M.; Seat, H.C.; Chavagnac, V.; Surre, F.; Sharp, J.H. Comprehensive Modeling of Multimode Fiber Sensors for Refractive Index Measurement and Experimental Validation. Sci. Rep. 2018, 8, 5912. [Google Scholar] [CrossRef] [PubMed]
  34. Ghatak, A.; Thyagarajan, K. An Introduction to Fiber Optics; Cambridge University Press: Cambridge, UK, 1998. [Google Scholar] [CrossRef]
  35. Hu, M.; Li, N.; Li, W.; Wang, X.; Hu, H. FDTD Simulation of Optical Force under Non-Ideal Conditions. Opt. Commun. 2022, 505, 127586. [Google Scholar] [CrossRef]
Figure 1. (a) Schematic of an SMFPF. (b) Measured laser profile in focus. The dashed line indicates the first dark ring of the Airy disk. The fitted Airy radius is 8 μ m. (c) The laser intensity along the x-axis. The red dots represent the measured intensity distribution along the x-axis, and the black curve represents the fitted curve.
Photonics 10 01007 g001
Figure 2. The dual beams coupling model. Take the focus of the right beam (represented in red) as the origin, and the opposite direction of the right beam’s propagation as positive along the z-axis to establish a coordinate system. The deviation of the two beams’ focus is decomposed into axial offset d along the z-axis and radial offset r along the y-axis, while the angular deviation of their propagation directions is denoted as the angular offset θ .
Photonics 10 01007 g002
Figure 3. The calculated coupling efficiency η varies with the axial offset d, radial offset r, and angular offset θ . The color gradient represents variations of the coupling efficiency η . The contour lines corresponding to η values of 0.2, 0.4, 0.6, and 0.8 are marked.
Photonics 10 01007 g003
Figure 4. The ray optics model of the microsphere’s side-scattered light coupled and transmitted in MMF. The side-scattered light is guided via total internal reflection within the core of MMF. Take the optical trap’s center as the origin of the coordinate axis, with the direction toward the fiber end face considered as the positive x-axis. Abbreviations: single-mode fiber pigtailed focuser (SMFPF), and multimode fiber (MMF).
Photonics 10 01007 g004
Figure 5. Simulated output beam profile on the detector when the center of the MMF’s incident end face is located at (a) (1, 0, 1); (b) (0.2, 0, 0); (c) (1, 0, 0) (Unit: mm).
Photonics 10 01007 g005
Figure 6. The normalized power difference changes with sphere displacement along the x-axis. P is the calculated power on the detector when the trapped microsphere is at different positions. P R refers to the calculated power when the microsphere is positioned at the center of the trap. Δ P = P P R is denoted as the difference between the two. The black solid line represents the fitted curve.
Photonics 10 01007 g006
Figure 7. Diagram of the experimental setup. Abbreviations: 1064 nm 1 × 2 polarization-maintaining fiber optic coupler with a 50:50 coupling ratio (“50:50”), 1064 nm single-mode fiber pigtailed focuser (SMFPF), multimode fiber (MMF), photodetector (PD), and power spectral density (PSD).
Photonics 10 01007 g007
Figure 8. Images of a stable trapped microsphere. (a) Overall view of the dual-beam fiber optical trap. The bright dot in the center of the photo is the trapped microsphere. (b) Microphotography of the trapped microsphere.
Photonics 10 01007 g008
Figure 9. Measured laser profile of the MMF’s outgoing beam, when the MMF’s incident end face is: (a) Axially away from 1 mm; (b) Radially away from 0.5 mm; (c) Radially away from 3 mm.
Photonics 10 01007 g009
Figure 10. Measured results of the trapped microsphere’s motion when P 0 = 150 mW. (a) Voltage PSD. The solid black line represents the partially fitted curve, and the frequency corresponding to its peak is the microsphere resonance frequency f 0 = 1326 Hz. (b) Time-domain displacement signal.
Photonics 10 01007 g010
Figure 11. Measured displacement PSD changes with laser power P 0 . The solid lines represent fitted curves of experimental data corresponding to their respective colors. Different triangles indicate resonant frequencies and peaks under different laser powers P 0 .
Photonics 10 01007 g011
Figure 12. Measured voltage PSD under different dual beams’ radial offset r conditions. When r = 10 μ m, the microsphere begins to rotate. When r = 13 μ m, the microsphere escapes from the trap.
Photonics 10 01007 g012
Disclaimer/Publisher’s Note: The statements, opinions and data contained in all publications are solely those of the individual author(s) and contributor(s) and not of MDPI and/or the editor(s). MDPI and/or the editor(s) disclaim responsibility for any injury to people or property resulting from any ideas, methods, instructions or products referred to in the content.

