1. Introduction
Photoacoustic imaging systems for biomedical applications combine the advantages of both optical and acoustical imaging methods and have thus been attracting researchers’ attention in recent decades [
1,
2,
3,
4,
5]. Many attempts have been made to improve the Signal-to-Noise Ratio (SNR) of a photoacoustic imaging system [
6,
7,
8,
9,
10,
11,
12,
13,
14]. However, in the context of the selection of the transmitted waveform, most recent studies are still based on either chirps or square pulses, and occasionally Gaussian pulses [
15,
16] or pulse trains similar to pulsed sinusoids with a high-carrier frequency [
17]. In previous work, a method of finding the input waveform for the optimal SNR under certain constraints was investigated [
10]. The waveform found in this way (the optimal input waveform) can provide a high SNR compared to other waveforms, especially when the waveform duration is comparable with the absorber-characteristic duration. However, finding the optimal waveform requires solving a Fredholm integral eigenproblem for each distinct photoacoustic absorber profile, which requires prior knowledge of the absorber and is not easy to implement.
An important result of this paper is to present a Fourier series expansion approach to solving the Fredholm integral with various photoacoustic absorbers. The traditional methods of solving Fredholm’s integral equations require large amounts of calculation and the computational efficiency is low [
18]. Many other available approaches can also be used, such as the B-spline wavelet method [
19], Taylor’s expansion method [
20], the sampling theory method [
21], and others [
22,
23,
24]. However, these approaches either require large amounts of computation or are inconvenient for solving the eigenvalue problem. The proposed Fourier series approach in this paper converts the Fredholm integral eigenvalue problem to a finite dimensional matrix eigenvalue problem, which is straightforward to compute. It also provides insight into the effect of the absorber in the eigenvalue problem.
This paper also proposes a method of directly using the Discrete Prolate Spheroidal Sequences (DPSSs), a discrete relative of the Prolate Spheroidal Wave Functions (PSWFs) [
25], as an input waveform for unknown absorbers with only limited prior information about the absorber. PSWFs and DPSSs are reported to have many advantages in signal processing applications, mainly due to their band-limited and time or index concentrated properties [
25,
26,
27]. The use of the PSWF as an input waveform can be motivated from solving an optimization problem for the SNR [
28]. It has previously been shown that the photoacoustic SNR optimization problem for band-limited absorbers can be modelled as an eigenvalue problem of a Fredholm integral of the second kind with a sinc kernel, where the sinc kernel represents the absorber that has a band-limited transfer function [
10]. The PSWF is then shown to be the optimal input waveform for band-limited absorbers.
The Discrete Prolate Spheroidal Sequences (DPSSs) are known to be a discrete relative of PSWFs. In this paper, we use the term DPSSs to refer to a set of vectors that are index limited to
and whose Discrete Time Fourier Transform (DTFT) is maximally concentrated in a frequency band [
27]. Other authors often use the term ‘Slepian Basis’. The DPSS (Slepian basis) is convenient to use since it is easy to compute in comparison to the PSWF. For example, the Matlab signal-processing toolbox provides a built-in function
dpss that returns the DPSS by solving the eigenproblem for the prolate matrix [
29]. Simulation results in
Section 5 show that, by directly using the DPSSs as the input waveforms instead of the exact optimal input waveforms, the same or similar SNR can be achieved. However, using the DPSS is simple to compute and does not require prior knowledge of the exact functional form of the absorber. Hence, the DPSS can provide near-optimal SNR with limited prior information and computation. The remaining question to address is how to choose appropriate DPSS parameters for near-optimal SNR. The proposed method of choosing the parameters of the DPSSs is to choose the longest allowable duration and the time-bandwidth product
c to be equal to 1. Detailed explanations of this approach will be discussed in the following sections.
2. Mathematical Modelling
Typical photoacoustic detection or imaging systems have similar mathematical structures and can be modelled as input and output problems from a signal-processing point of view, as shown in
Figure 1 [
28,
30,
31,
32,
33,
34].
In
Figure 1,
is the input waveform,
is the absorber impulse response,
is the pressure signal output of the impulse response,
represents the noise in the system and is added to
prior to being input to
, which is the receiver-filter impulse response. Finally,
is the output of the receiver filter that is the final output after the signal processing of the received waveform. Here,
denotes time.
It was shown in [
10] that the input waveform for optimal SNR (optimal waveform) under constraints on the waveform energy (
E) and duration (2
T) given by
is given by the solution to the Fredholm integral eigenvalue problem as
where
is the auto-correlation of the absorber impulse response
. The waveform for optimal SNR is the eigenfunction of Equation (2) associated with the maximum eigenvalue
, and the maximum SNR is given by
.
3. Fourier Series Expansion Method for Optimal Waveform
We assume that the absorber is finite and compactly supported, which implies a time-limited kernel in Equation (2). Fourier series allow us to express a kernel
in Equation (2) that is time limited in the interval
as a series of sinusoidal functions given by
where
and the Fourier coefficients are given by
However, the convolution in Equation (2) involves a time shift related with the input waveform
that is time limited in the interval
. Hence, the kernel
may be expanded on a larger interval as
where
and
The interval
is chosen to ensure coverage of both intervals, and yields a finer frequency resolution than using one interval or the other. Then, we also write the input waveform
as Fourier series in the time interval
as
where
Substituting Equations (5) and (7) into Equation (2) and rearranging the order of summation and integration gives
We now define a matrix A with elements
given by
Substituting (10) into (9) gives
which can be rewritten as
We define another matrix Q as
We note that Equation (13) demonstrates that matrix
Q is the result of a convolution of the kernel
L along the row dimension of matrix
A, since multiplication in the frequency domain represents a convolution in the time domain. The above notation allows us to write Equation (12) as an (infinite) eigenvalue problem given by
Hence, the Fredholm integral eigenvalue problem in (2) is discretized and simplified to the (infinite) matrix eigenvalue problem shown in Equation (14). For numerical simulations, the problem in Equation (14) needs to be truncated to a finite dimension. The terms in eventually go to zero for sufficiently large indices. Hence, it is always possible to truncate the matrix to a square matrix of dimension , such that all the off-diagonal terms are as close to zero as required for , . Once the eigenvectors of (now finite dimensional) are found, the eigenvectors provide the Fourier coefficients for the input waveform. The zeroth order eigenvector is selected since it has the largest eigenvalue, that is, it maximizes SNR. This zeroth order eigenvector must then be put back into the Fourier series in Equation (14) to give the optimal waveform function.
Equations (13) and (14) permit good insights into the problem. The classical sinc kernel integral equation eigenproblem (with the result of the PSWF as the optimal waveform) is obtained by replacing with in Equation (14). This is the ‘base’ problem that results from assuming a purely band-limited absorber, which results in a sinc kernel integral equation (with the result of the PSWF as the optimal waveform). Hence, is our Fourier series approximation to the PSWF and Equation (13) captures how the effect of the kernel causes a deviation in the eigenvalue problem from the baseline eigenvalue problem. This process shows that the actual shape of the absorber-transfer function only effects the eigenvalue problem via Equation (13), where the kth row of matrix is multiplied by the kth element in to give . Furthermore, the multiplication by the kth element in to give indicates that the effect of is row convolution, as previously noted above. This is an important insight as the influence of the kernel becomes clear, and this influence (once understood) can be exploited.
4. Near-Optimal Waveform via DPSS
From Equation (10), the matrix
is very similar to the matrix often referred to as the prolate matrix [
35], whose eigenvectors are the DPSSs. For
, the prolate matrix is defined from
where
N is the size of the matrix. Hence, the
matrix yields some set of DPSSs as its eigenvectors. The DPSSs can be considered to be a discrete relative of the PSWFs. Classical definitions of the DPSSs use
σ and
N as input values. The defining input parameters to determine a DPSS using Matlab are the number of points
N (index limit, also the size of the prolate matrix), and a time-bandwidth product denoted by
c. To find the DPSS,
c and
N are chosen and then the
dpss Matlab function code solves the prolate matrix (Equation (15)) eigenvalue problem for
to return the first 2
c eigenvectors (of length
N) to give the DPSS. It is noted that
N must satisfy
(to ensure
, as per the definition of the prolate matrix). The variable
N controls the size of the matrix and the ‘resolution’ in the eigenvectors, i.e., the amount of detail in the eigenvectors. The time-bandwidth parameter
c controls the energy concentrating properties of the eigenvectors.
It was shown in [
10] that the optimal waveform can give good gains in the SNR compared to other waveforms when the waveform duration is comparable with the absorber-characteristic duration. When the relative sizes of the input waveform and the absorber-effective duration differ by orders of magnitude, then there is very little additional SNR gain that can be achieved by optimizing the shape of the input waveform. Hence, we can assume that if we are seeking optimal or near-optimal waveforms, then
and
are approximately the same order of magnitude. When comparing Equations (10) and (15), the width of the ‘digital sinc’ function of matrix
in Equation (10) is controlled by a prolate factor of
. The effect of the multiplication with
to obtain
results from convolution, which will generally always ‘widen’ a signal. That is, we expect the matrix
to have a similar shape and structure to
but to be slightly wider in the areas where it is non-zero.
These observations allow us to directly propose the DPSS as a near-optimal solution. That is, we hypothesize and propose that the optimal waveforms (eigenvectors of used as Fourier coefficients) may in fact be very similar to some DPSSs, which is what leads to the proposal that the DPSSs can be used as near-optimal waveforms directly in the place of the optimal waveforms (eigenvectors of used as Fourier coefficients). We consider the consequences of this proposed approach in what follows. We demonstrate that the DPSS offers near-optimal SNR results compared to the true-optimal waveforms. The remaining question then becomes how to choose the parameters of the DPSSs to achieve near-optimal SNR results.
To find the DPSS, the DPSS parameters
c (time-bandwidth) and
N need to be chosen, and then the
dpss Matlab function code returns the DPSS vectors with the chosen
c and
N as parameters. To obtain a near-optimal waveform, we construct a discrete time vector with duration
with the same number of points
N, where the discrete time values of the near-optimal waveform are directly given by the values of the zeroth order DPSS obtained with the chosen
N and
. The zeroth order DPSS is chosen since it corresponds to the largest eigenvalue that maximizes the SNR. The resulting concentration bandwidth of the DPSS then corresponds to
. That is, the selected DPSS has energy
concentrated in
. The time-bandwidth product
c is unitless if
has units of microseconds (µs) and
has units of Megahertz (MHz). The DPSS with
is chosen since recent work [
10] demonstrated that this is the smallest value of c that allows the DPSS to meet the minimum allowable compactness of the classical Fourier uncertainty principle using the percentage energy definition of compactness. Hence, the DPSS is chosen with the smallest possible c that gives minimum possible compactness. Then, this vector is ‘scaled’ to fit the
required interval with
N values. This gives a sampling interval in time of
and a sampling frequency of
Hz. The
factor arises so that there will be exactly
points in the interval
.
In our proposed approach, we propose to use the values of the zeroth order DPSS directly as the discrete time values of the near-optimal waveform, that is, we do not interpolate with a cardinal sinc or construct a Fourier series from the given vector. Calling the dpss function is the only computational requirement. In contrast, the eigenvectors of must be used in the Fourier series’ reconstruction to give the required optimal waveform. That is, an eigenvalue problem and a Fourier reconstruction are required to find the optimal waveform. For the DPSS approach, the theoretical (Nyquist sampling) minimum that N must satisfy is . However, this lower Nyquist bound assumes sinc interpolation to give the remaining points in the function. Since we wish to use the values of the DPSS, directly as sampled values of the near-optimal waveform to avoid interpolation (and then resampling for plotting), N should be chosen much higher than this lower limit to give enough sampled points so that the function can be visualized. In our simulations, we chose N to be 201 to provide a smooth look to the curve and to permit a point-wise comparison with the optimal waveforms without the need for DPSS interpolation and resampling. We will demonstrate below that this simple selection of the DPSS allows for near-optimal results and requires very little knowledge about the absorber itself.
5. Numerical Simulations and Discussion
This section shows numerical simulation results obtained by the near-optimal method, shown in
Section 4, and compares those results with those obtained from optimal waveform results of
Section 3. All simulations were performed with Matlab. The DPSSs were obtained through the MATLAB R2019b signal-processing toolbox function
dpss, which calculates the eigenvalues and eigenvectors of the prolate matrix using a fast auto-correlation technique. The prolate matrix is known to be ill-conditioned and this fast auto-correlation approach gives good numerical results compared with simpler approaches.
Several different kernels are simulated in this section. Typical real-world kernels (auto-correlation of absorbers) may be neither exactly time-limited nor band-limited. Hence, we include those in our simulations. For kernels that are not exactly time-limited and/or band-limited, the effective duration and bandwidth of kernels are defined using a 98% energy criterion, where the effective time and bandwidth parameters are determined by finding the time interval and bandwidth where 98% of the energy is concentrated inside.
The SNR in this section is calculated as [
10]
with the assumption that the noise
. Here,
denotes the frequency domain and
denotes the frequency variable.
Figure 2 shows the matrix
represented as a 3D plot which is shown from different views. The matrices’ sizes are chosen as
for calculation convenience.
Appendix A provides a table comparing eigenvalues associated with the zeroth order PSWFs from tabulated values in [
28] and eigenvalues from matrices
for different sizes of the matrices. The table shows that by choosing a matrix size of
, the mean error of the first 10 eigenvalues is only 2.8657%. The higher errors only occur when the order of the eigenvalues is relatively large. The eigenvectors used in this paper correspond to the zeroth order eigenvectors, which are associated with the largest eigenvalues. Hence, the error will be small with the chosen matrix size. To provide a guide on how to choose the matrix size,
Figure A1 in
Appendix A provides the plot of mean errors of the first 10 eigenvalues from the matrices sizes
to
. As shown in
Figure A1, as the matrix size increases the error decreases, and the rate of the decrease in error also decreases. Hence, when the matrix size becomes large, the computational cost increases for small decreases in error. The plots of the
matrices shown in the following subsections demonstrate that
matrices are large enough to capture all the non-zero off-diagonal values of the
matrices. As can be seen from
Figure 2, the
matrix is approximately a diagonal matrix with a sinc shape on its skew diagonal.
As shown in Equation (13), the matrix is given by the kth row of matrix multiplied by the kth element in . Plots of matrices in the following simulations with different kernel profiles demonstrate that the matrices have similar profiles to , as was previously hypothesized.
5.1. SNR Simulations with Different Kernel Profiles
We begin the simulations by considering a Gaussian kernel, which is neither time-limited nor band-limited.
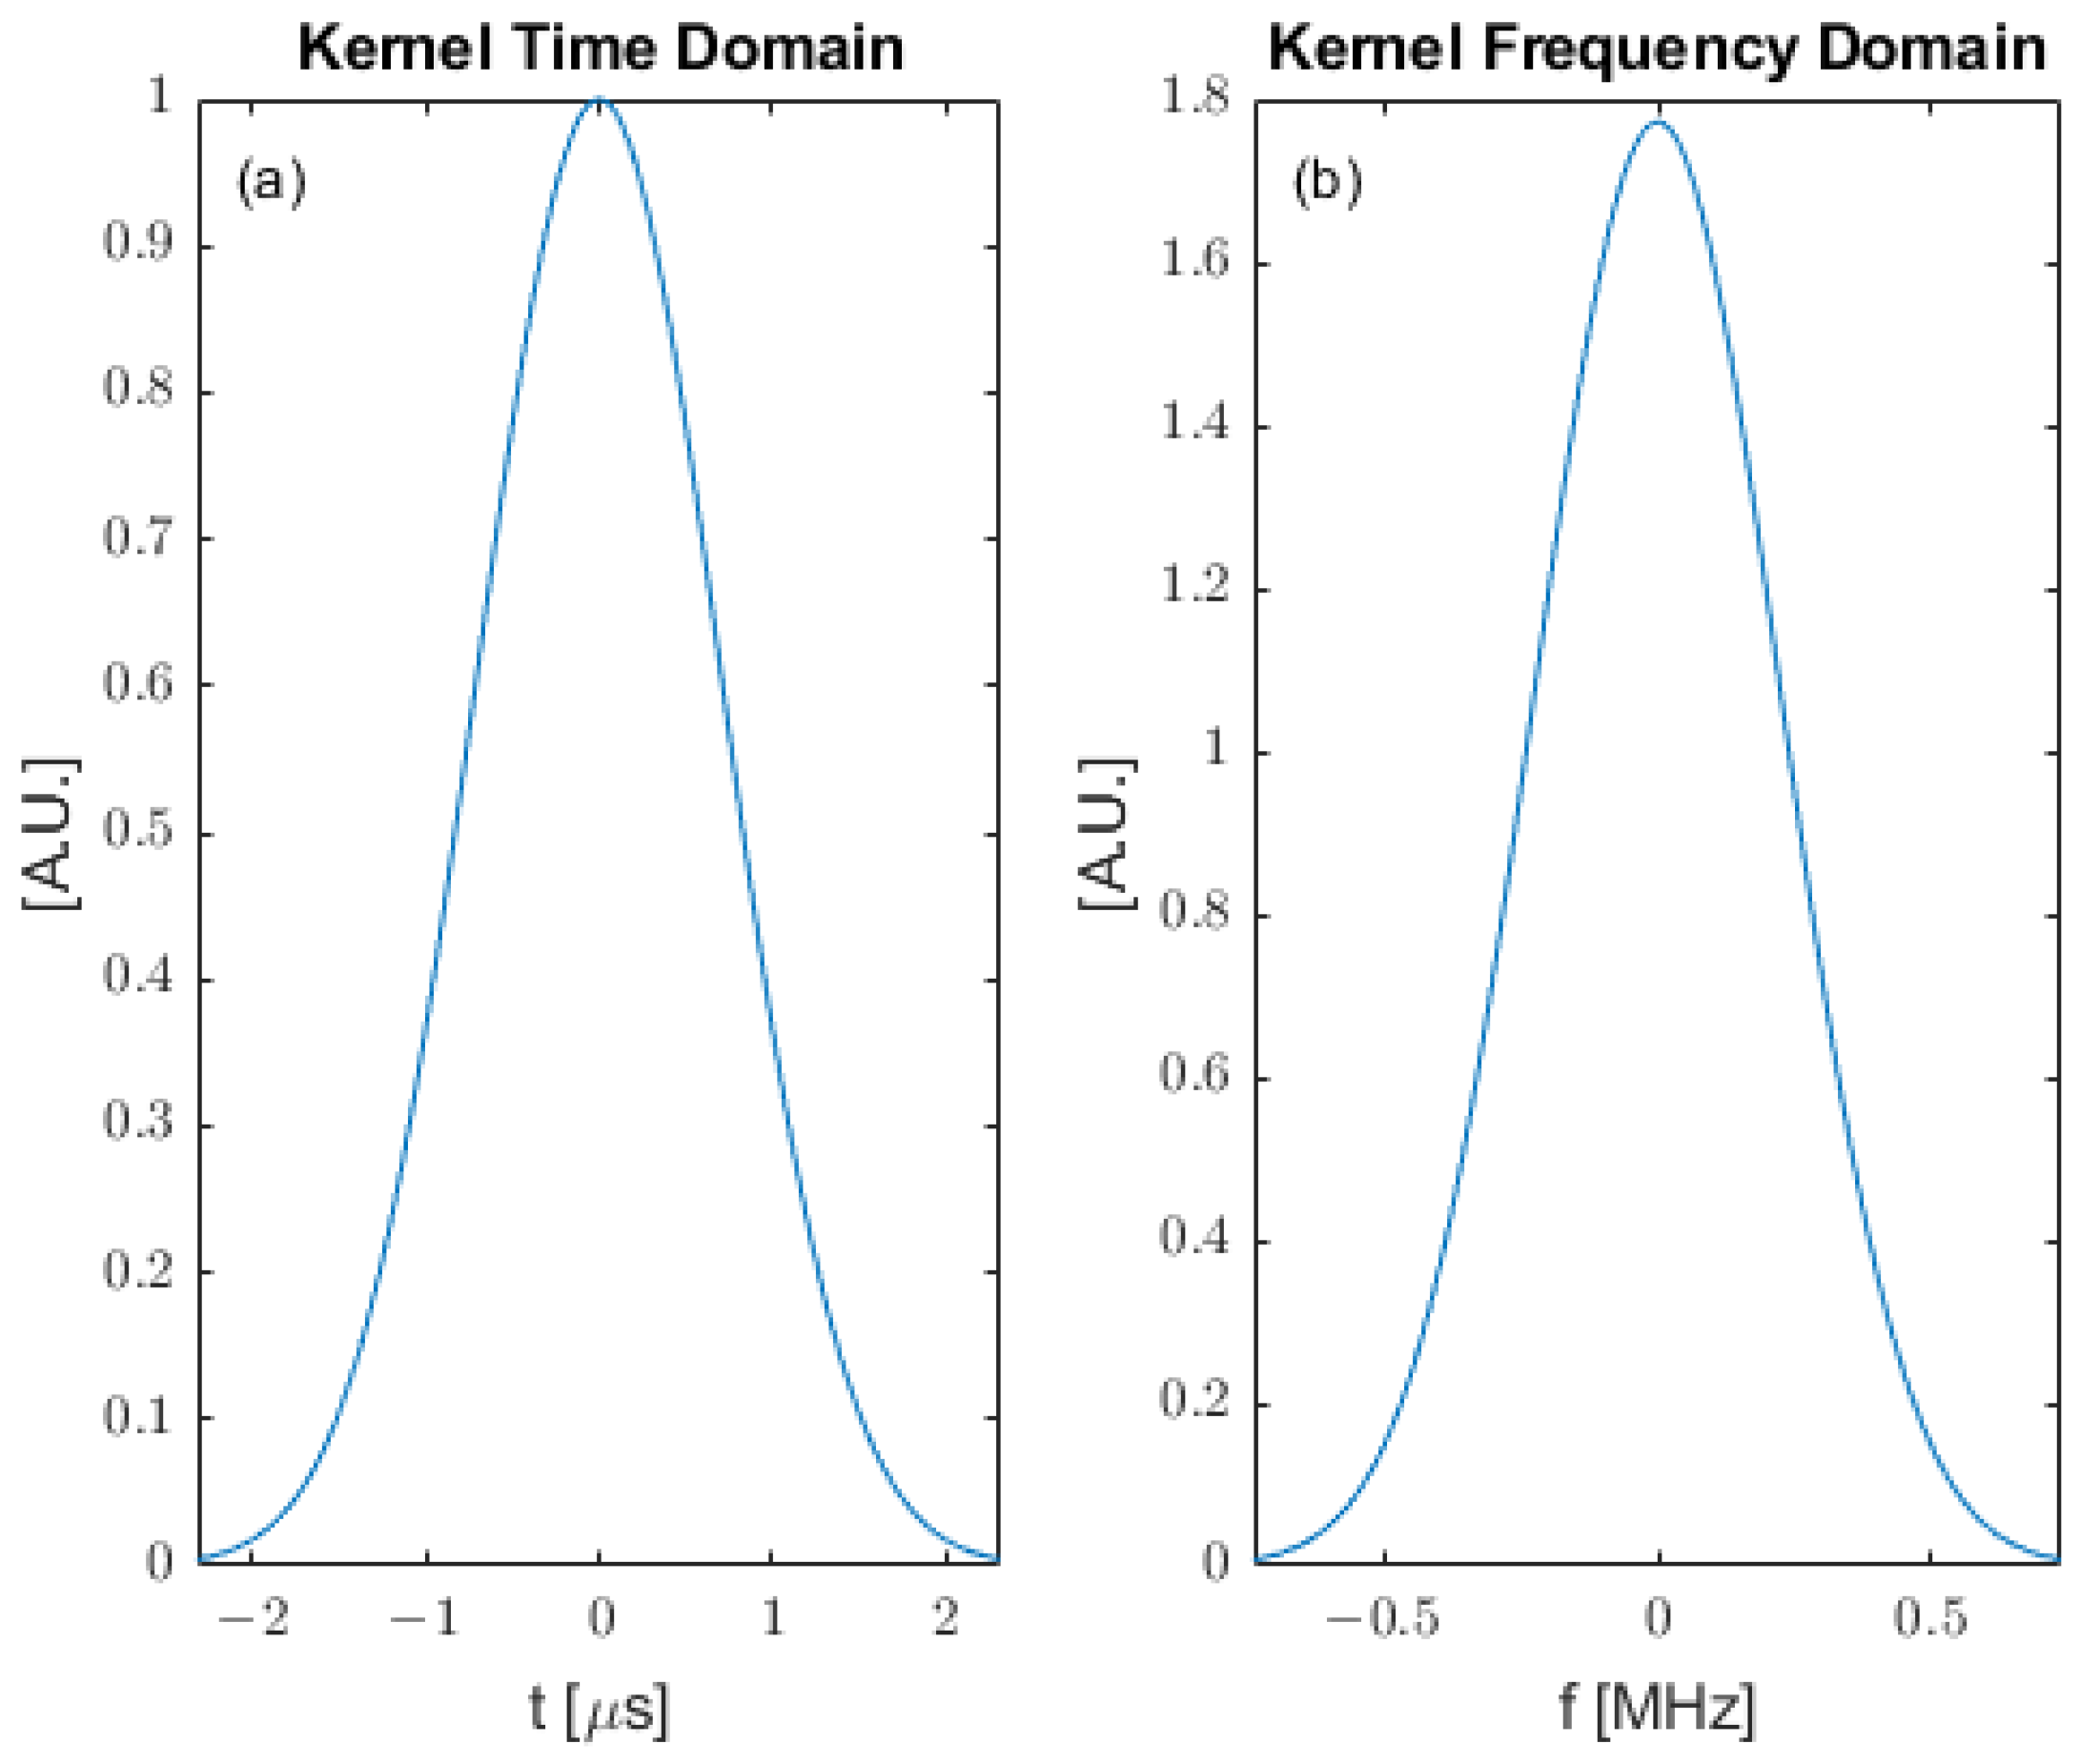
Figure 3 shows a Gaussian kernel defined by
.
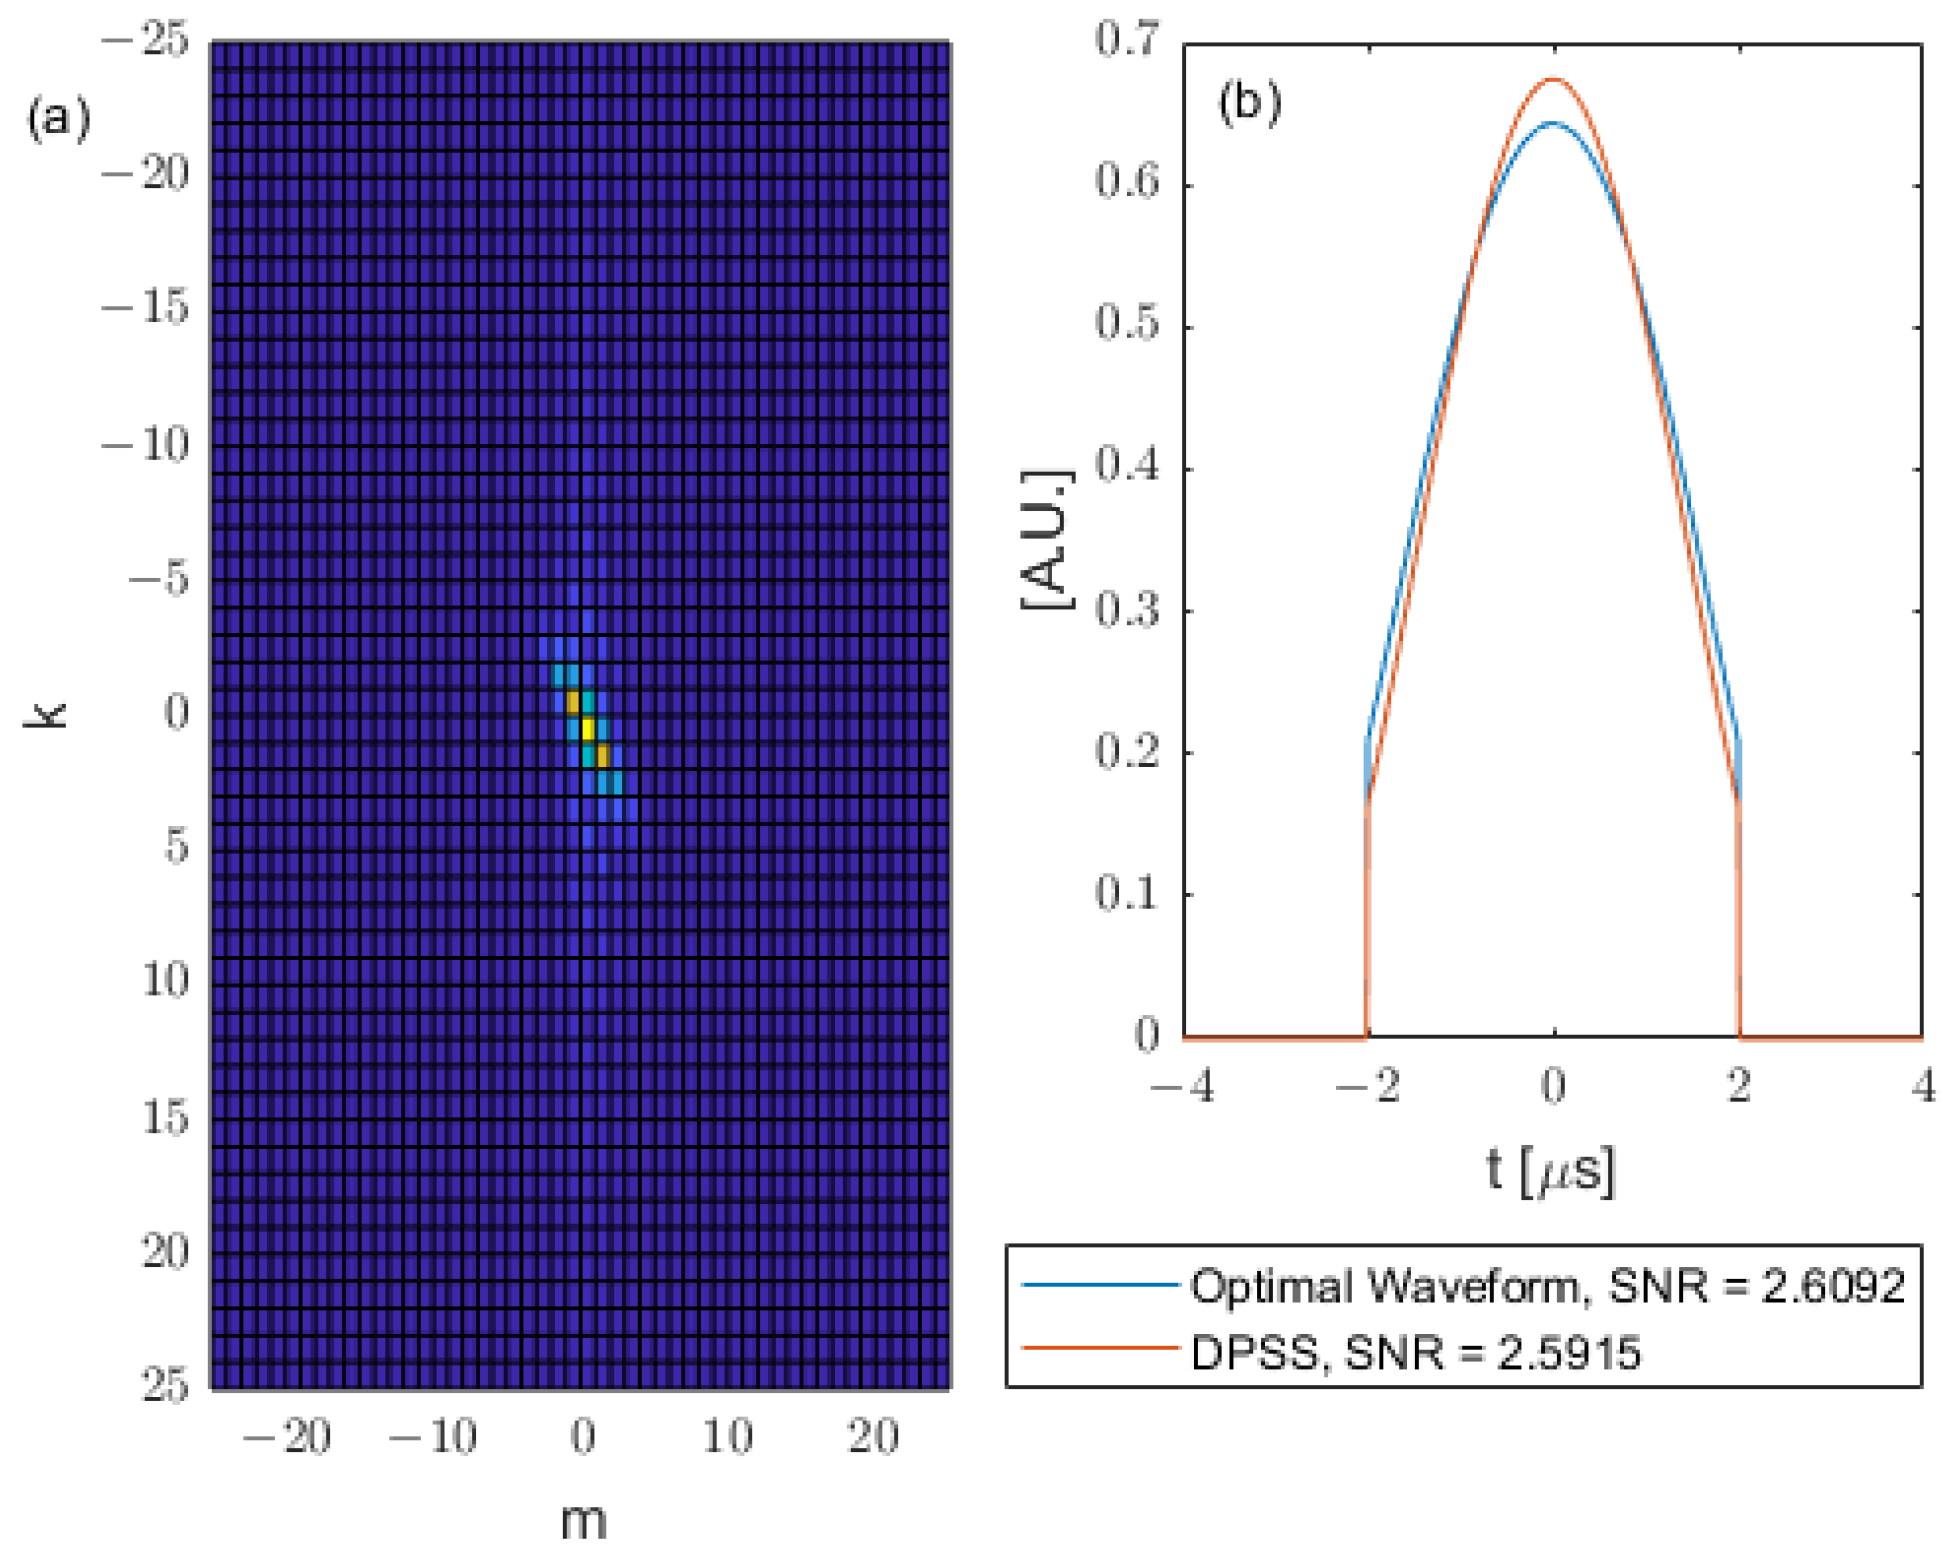
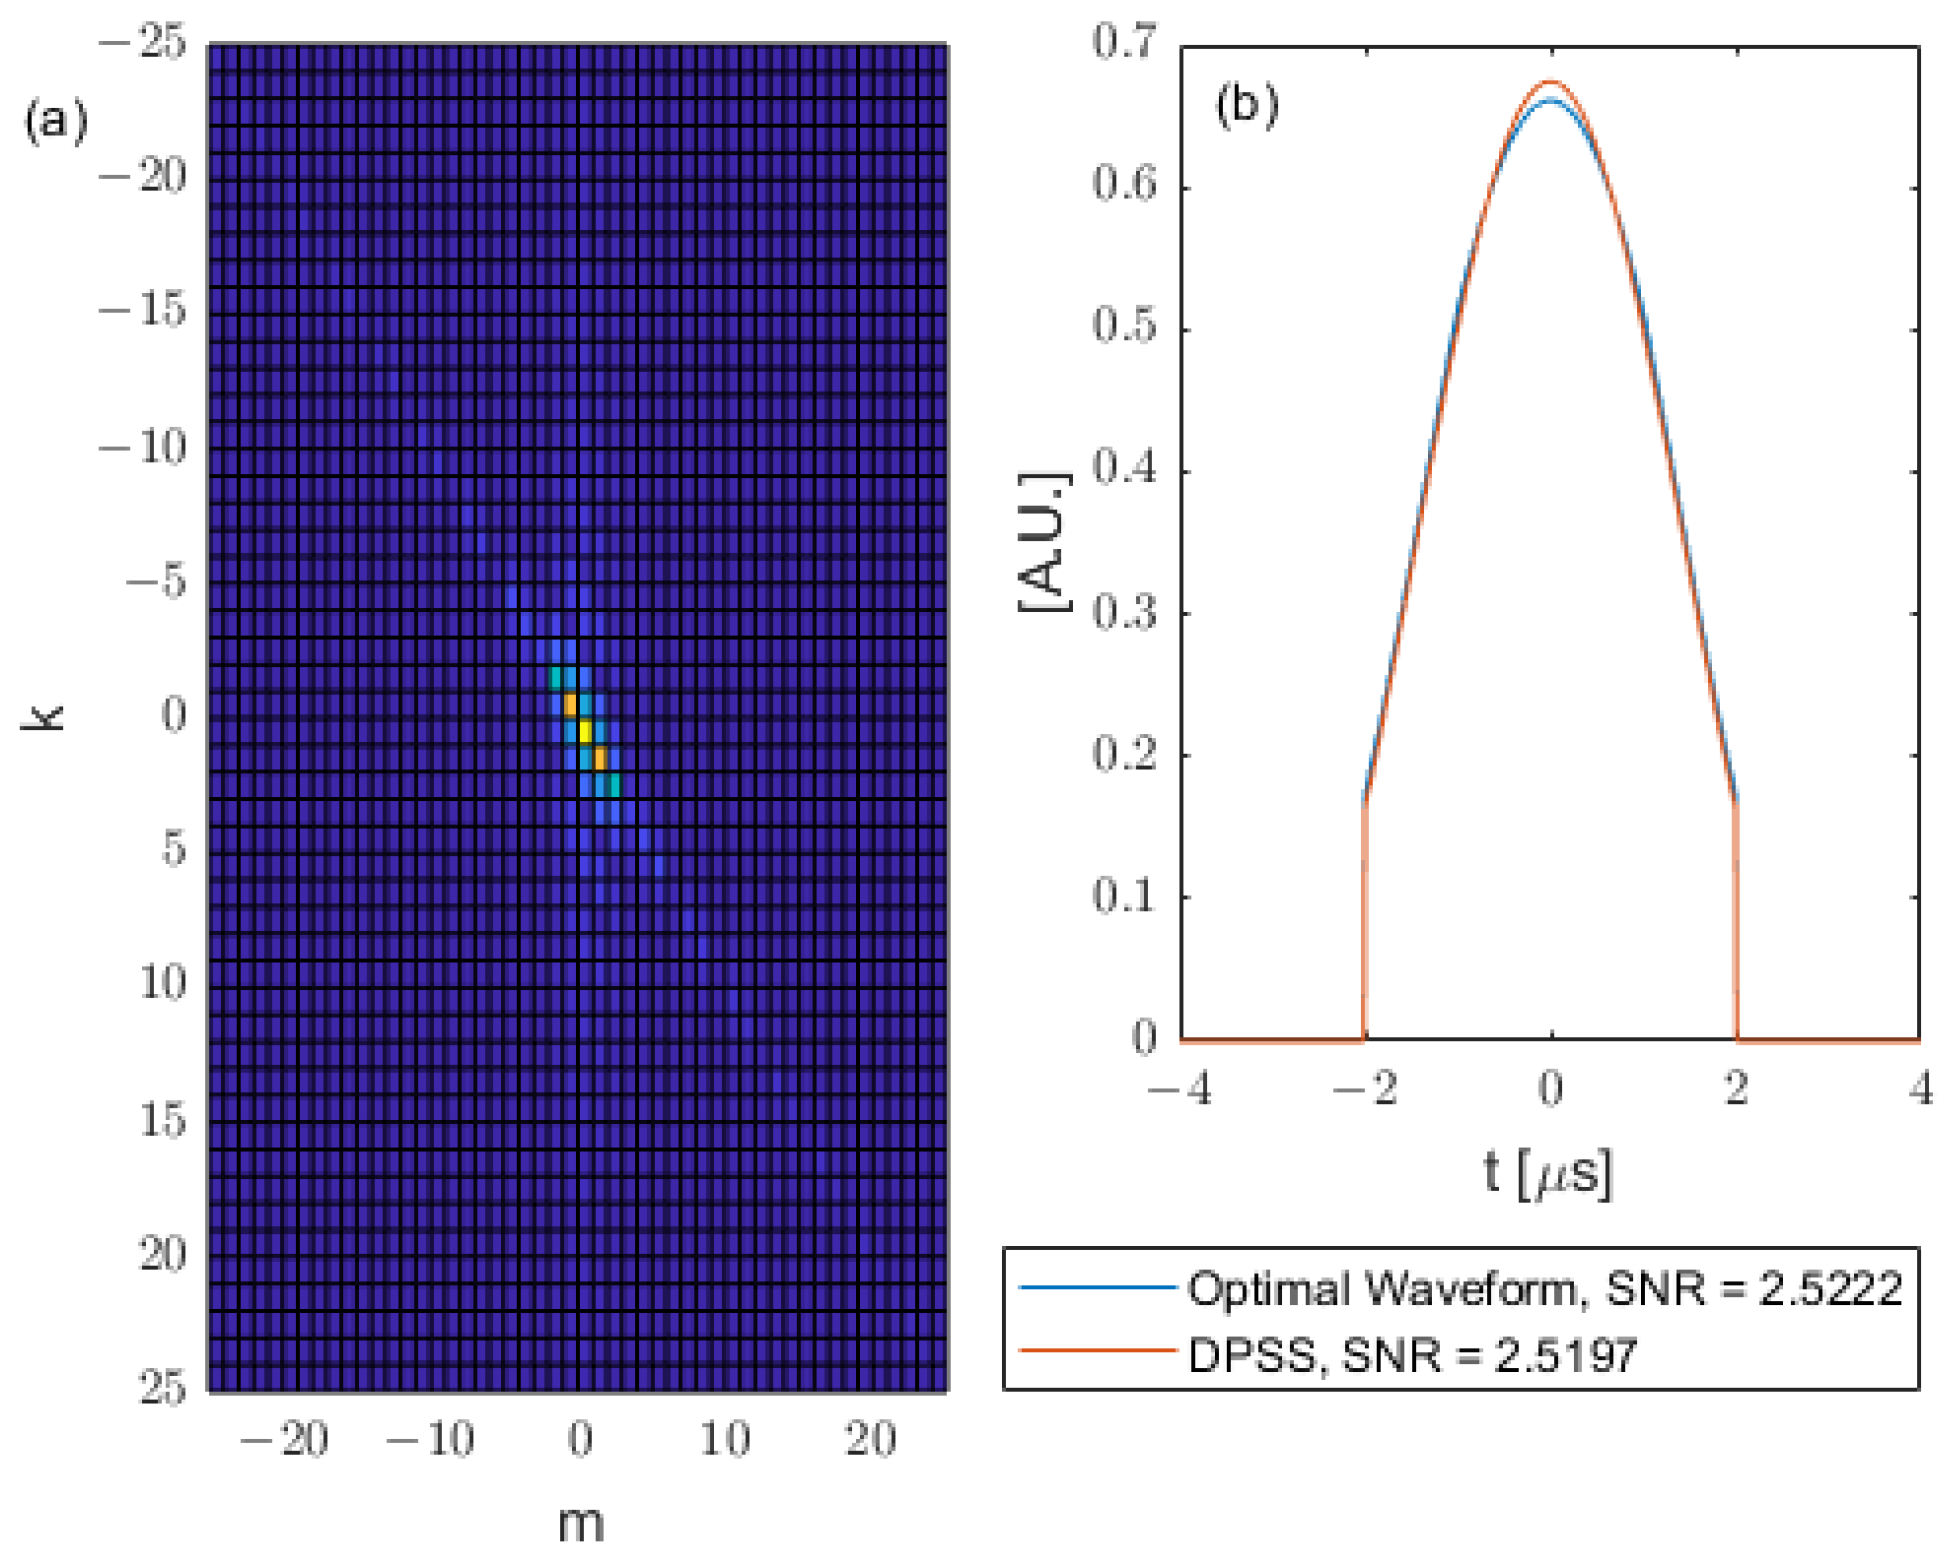
Figure 4a shows the
matrix for the Gaussian kernel.
Figure 4b shows the corresponding optimal waveform reconstructed using the zeroth eigenvector of
and the Fourier series, compared with a chosen DPSS. In this case, the
matrix is also approximately a diagonal matrix with a sinc shape on its skew diagonal. The optimal waveform (from Q matrix) and DPSS (from prolate matrix) are chosen to have the same duration. In this case
, we are restricting the duration of the input waveform to have a maximum duration of 4 microseconds. The DPSS is chosen to have a defining time-bandwidth product
. It has been shown that, as their defining time-bandwidth products increase, the effective time-bandwidth properties of the DPSS (effective duration and bandwidth calculated by energy concentration and variance) approach known minimum compactness limits allowed by uncertainty principles [
36]. The minimum compactness limit is first reached at the defining time-bandwidth product
c = 1, which is why this choice is made here. As can be seen from
Figure 4, the chosen DPSS yields a similar SNR with the optimal waveform.
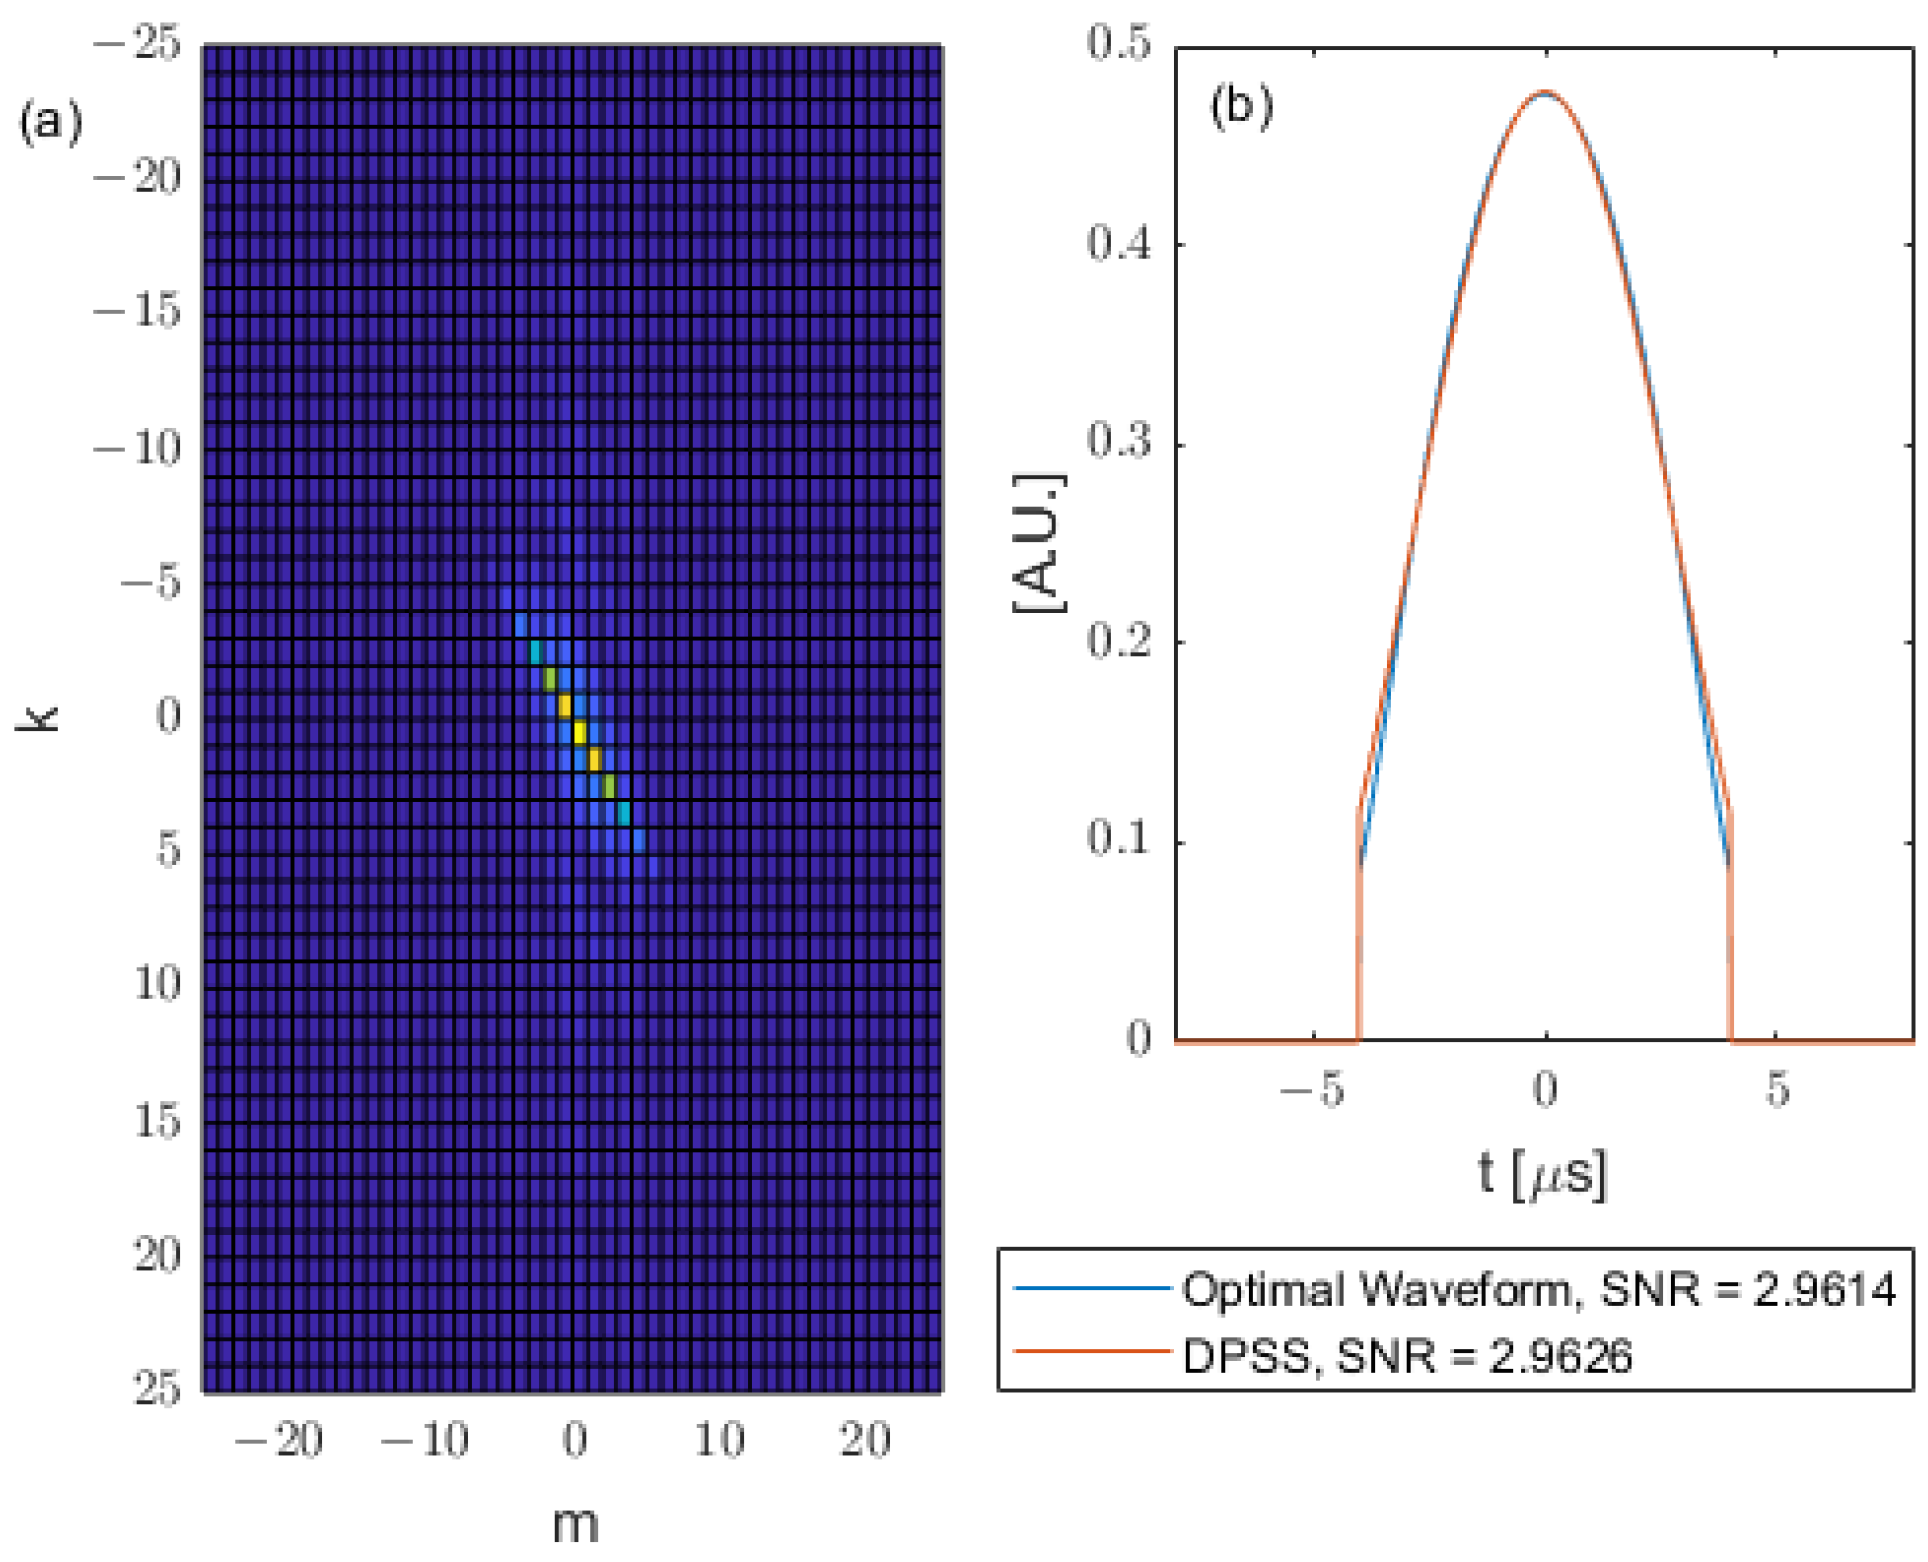
Now consider a system which allows a longer input waveform duration; hence, we choose the time interval
. Then, the corresponding Q matrix, optimal waveform and DPSS are shown in
Figure 5.
As can be seen in
Figure 5, as the duration of input waveform increases, the SNRs also increase. The DPSS is chosen to have the same duration as the optimal waveform (that is, from the duration constraint given for the waveform) and to also have
. The chosen DPSS gives a similar SNR (i.e., near optimal) to the optimal waveform.
Other kernel shapes are also simulated in this section. Similar trends also apply. The square kernel is defined as
The triangle kernel is defined as
The sinc-squared kernel is defined as
The cosine kernel is defined as
The plots of the above kernels shown in Equations (17)–(20) are shown in
Figure 6.
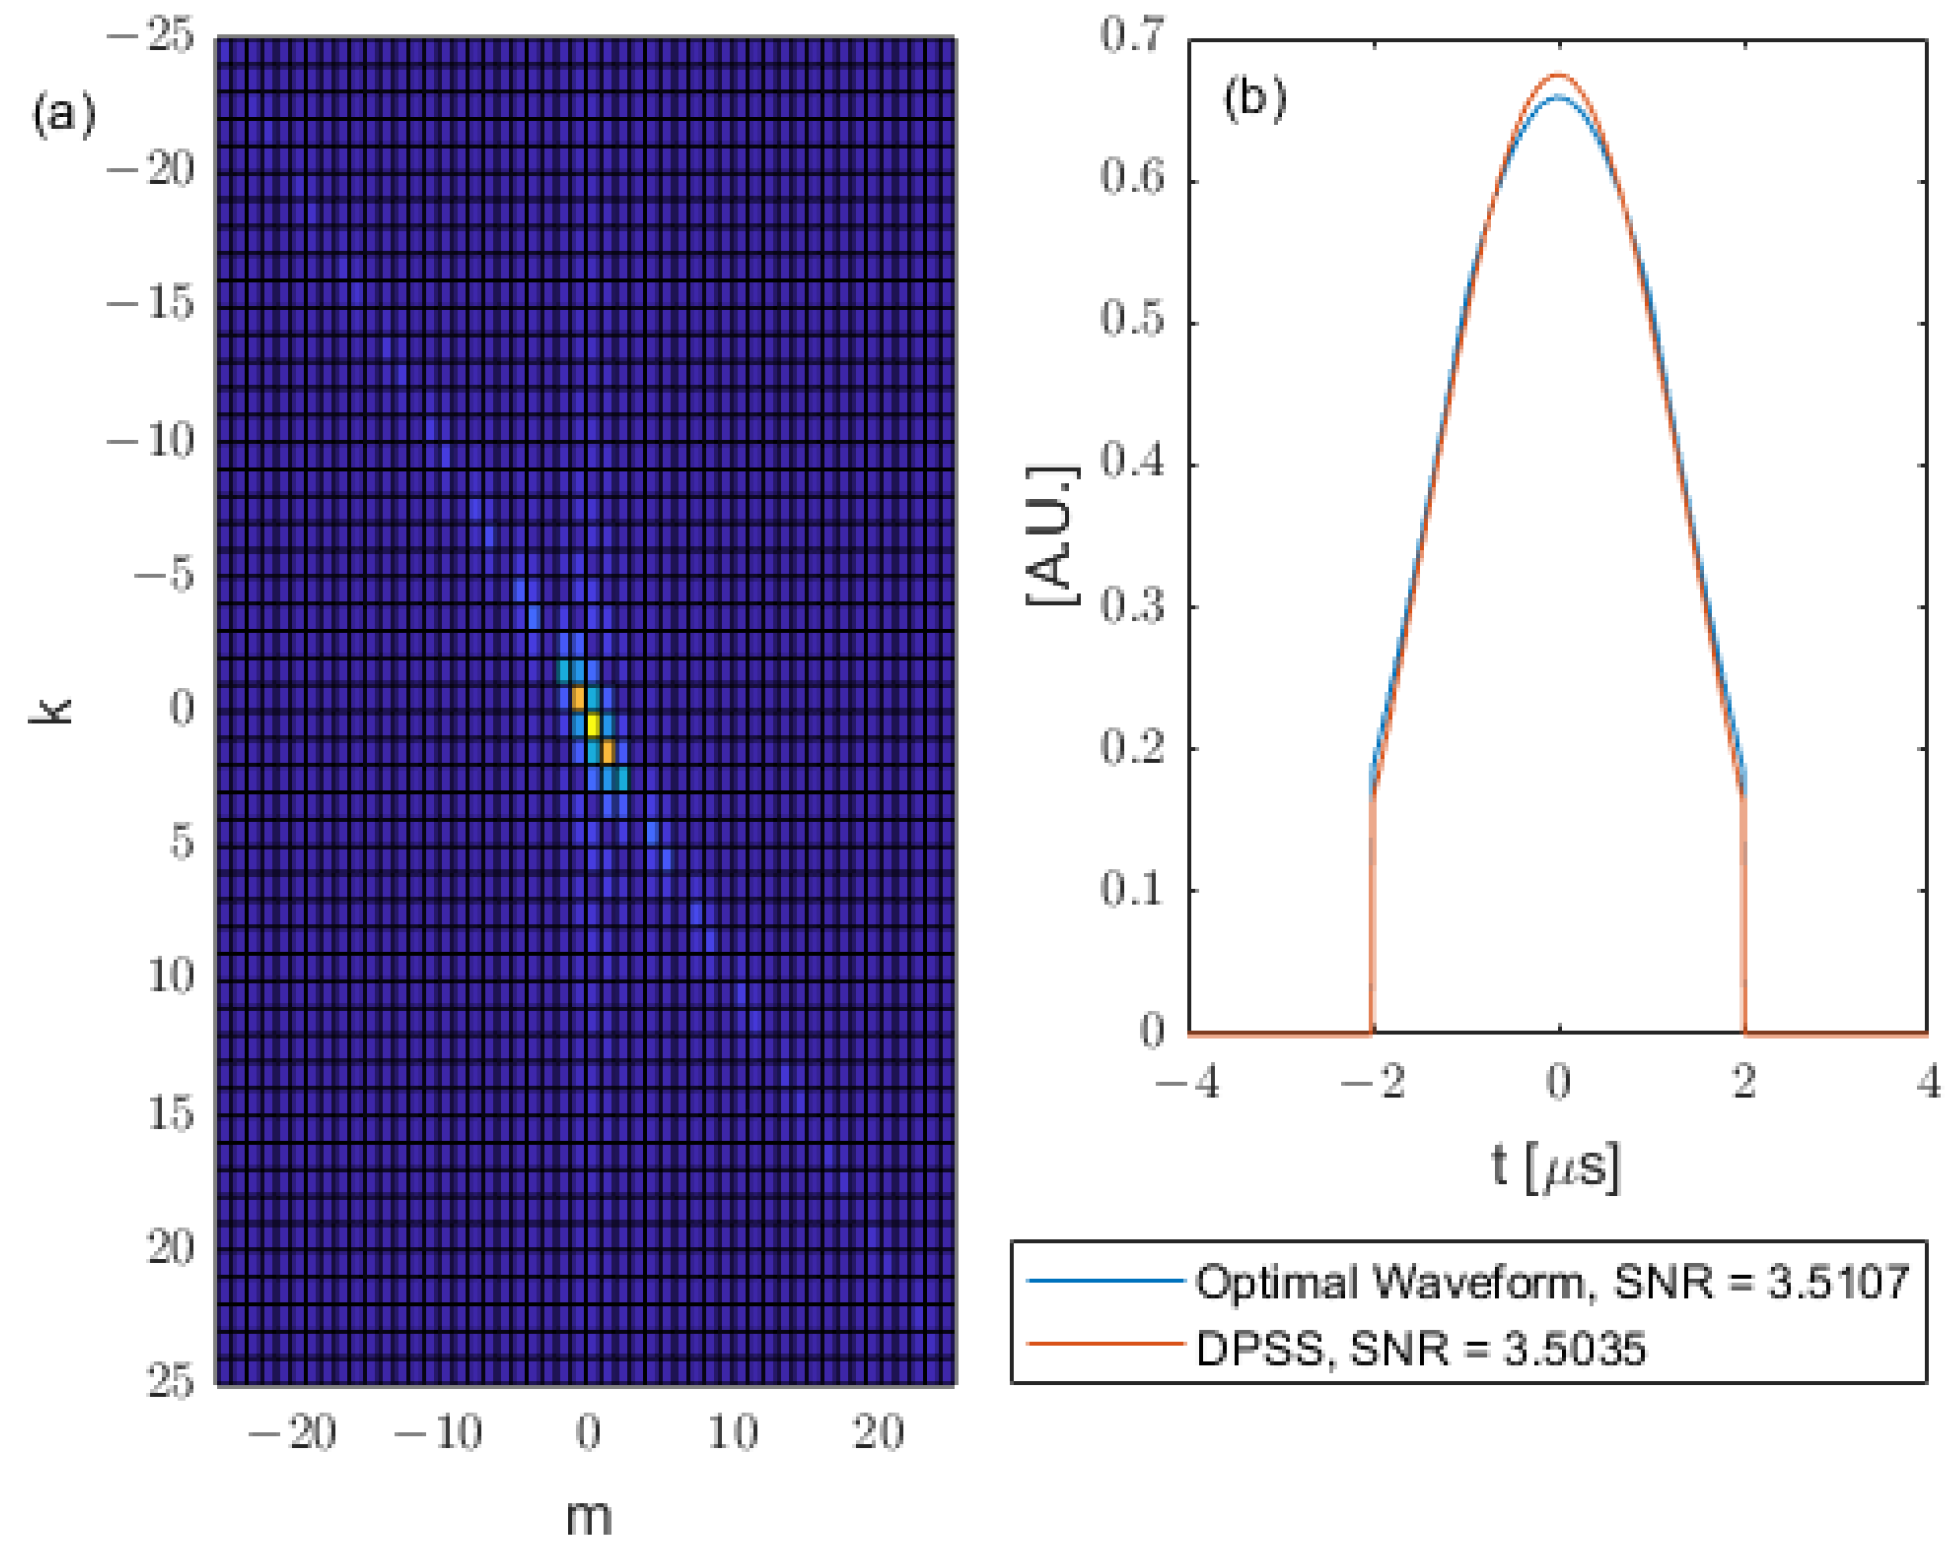
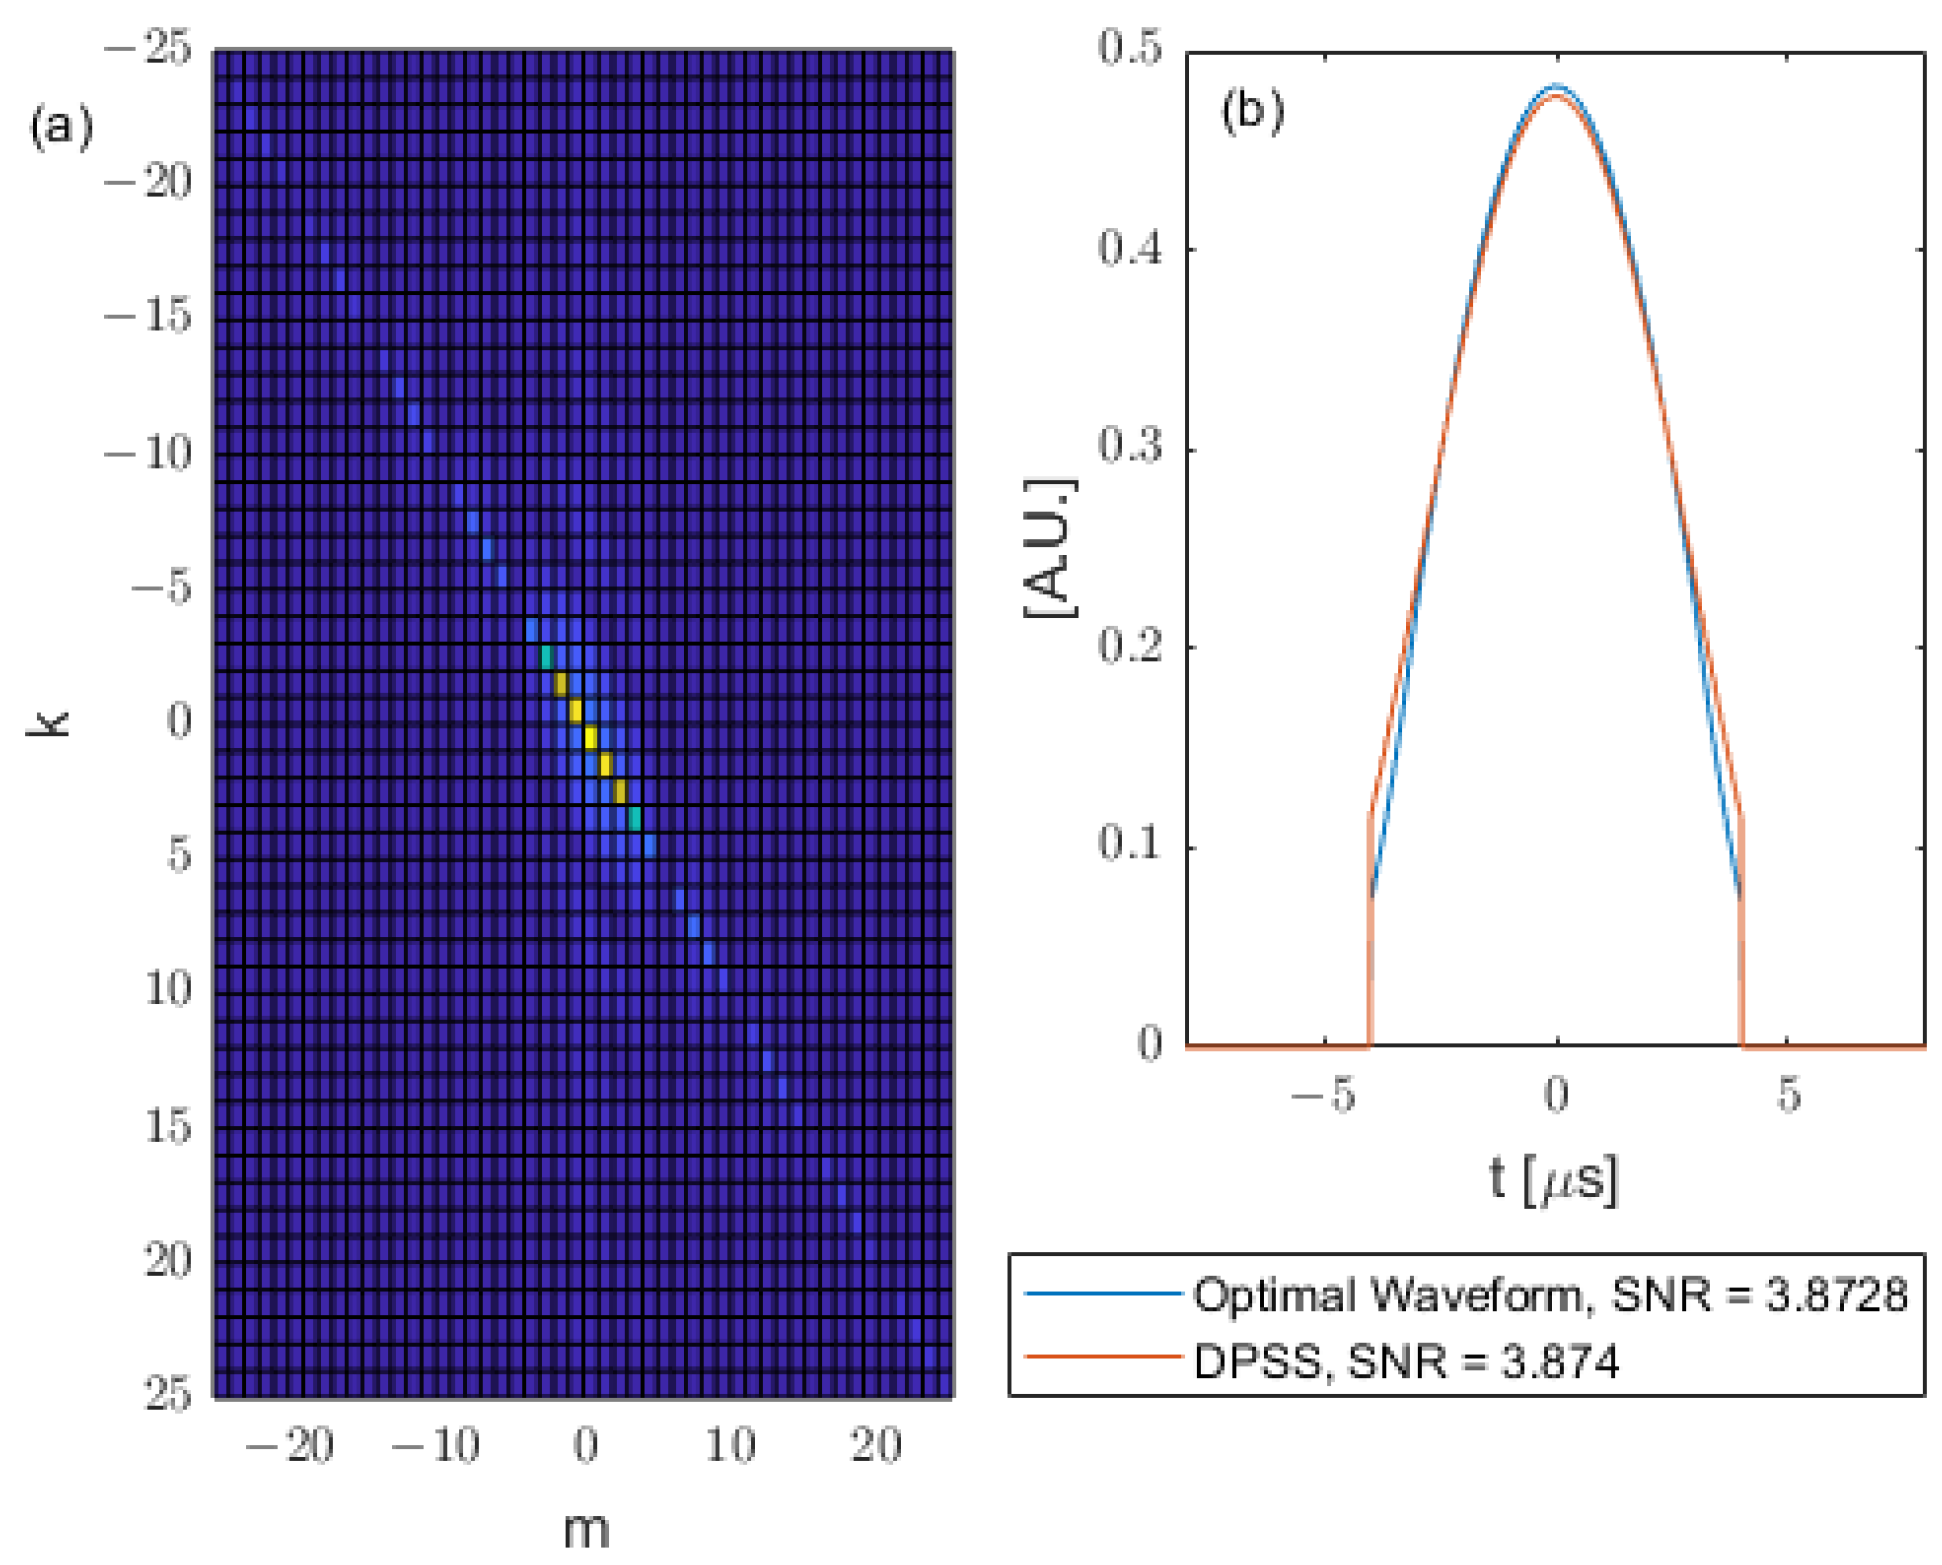
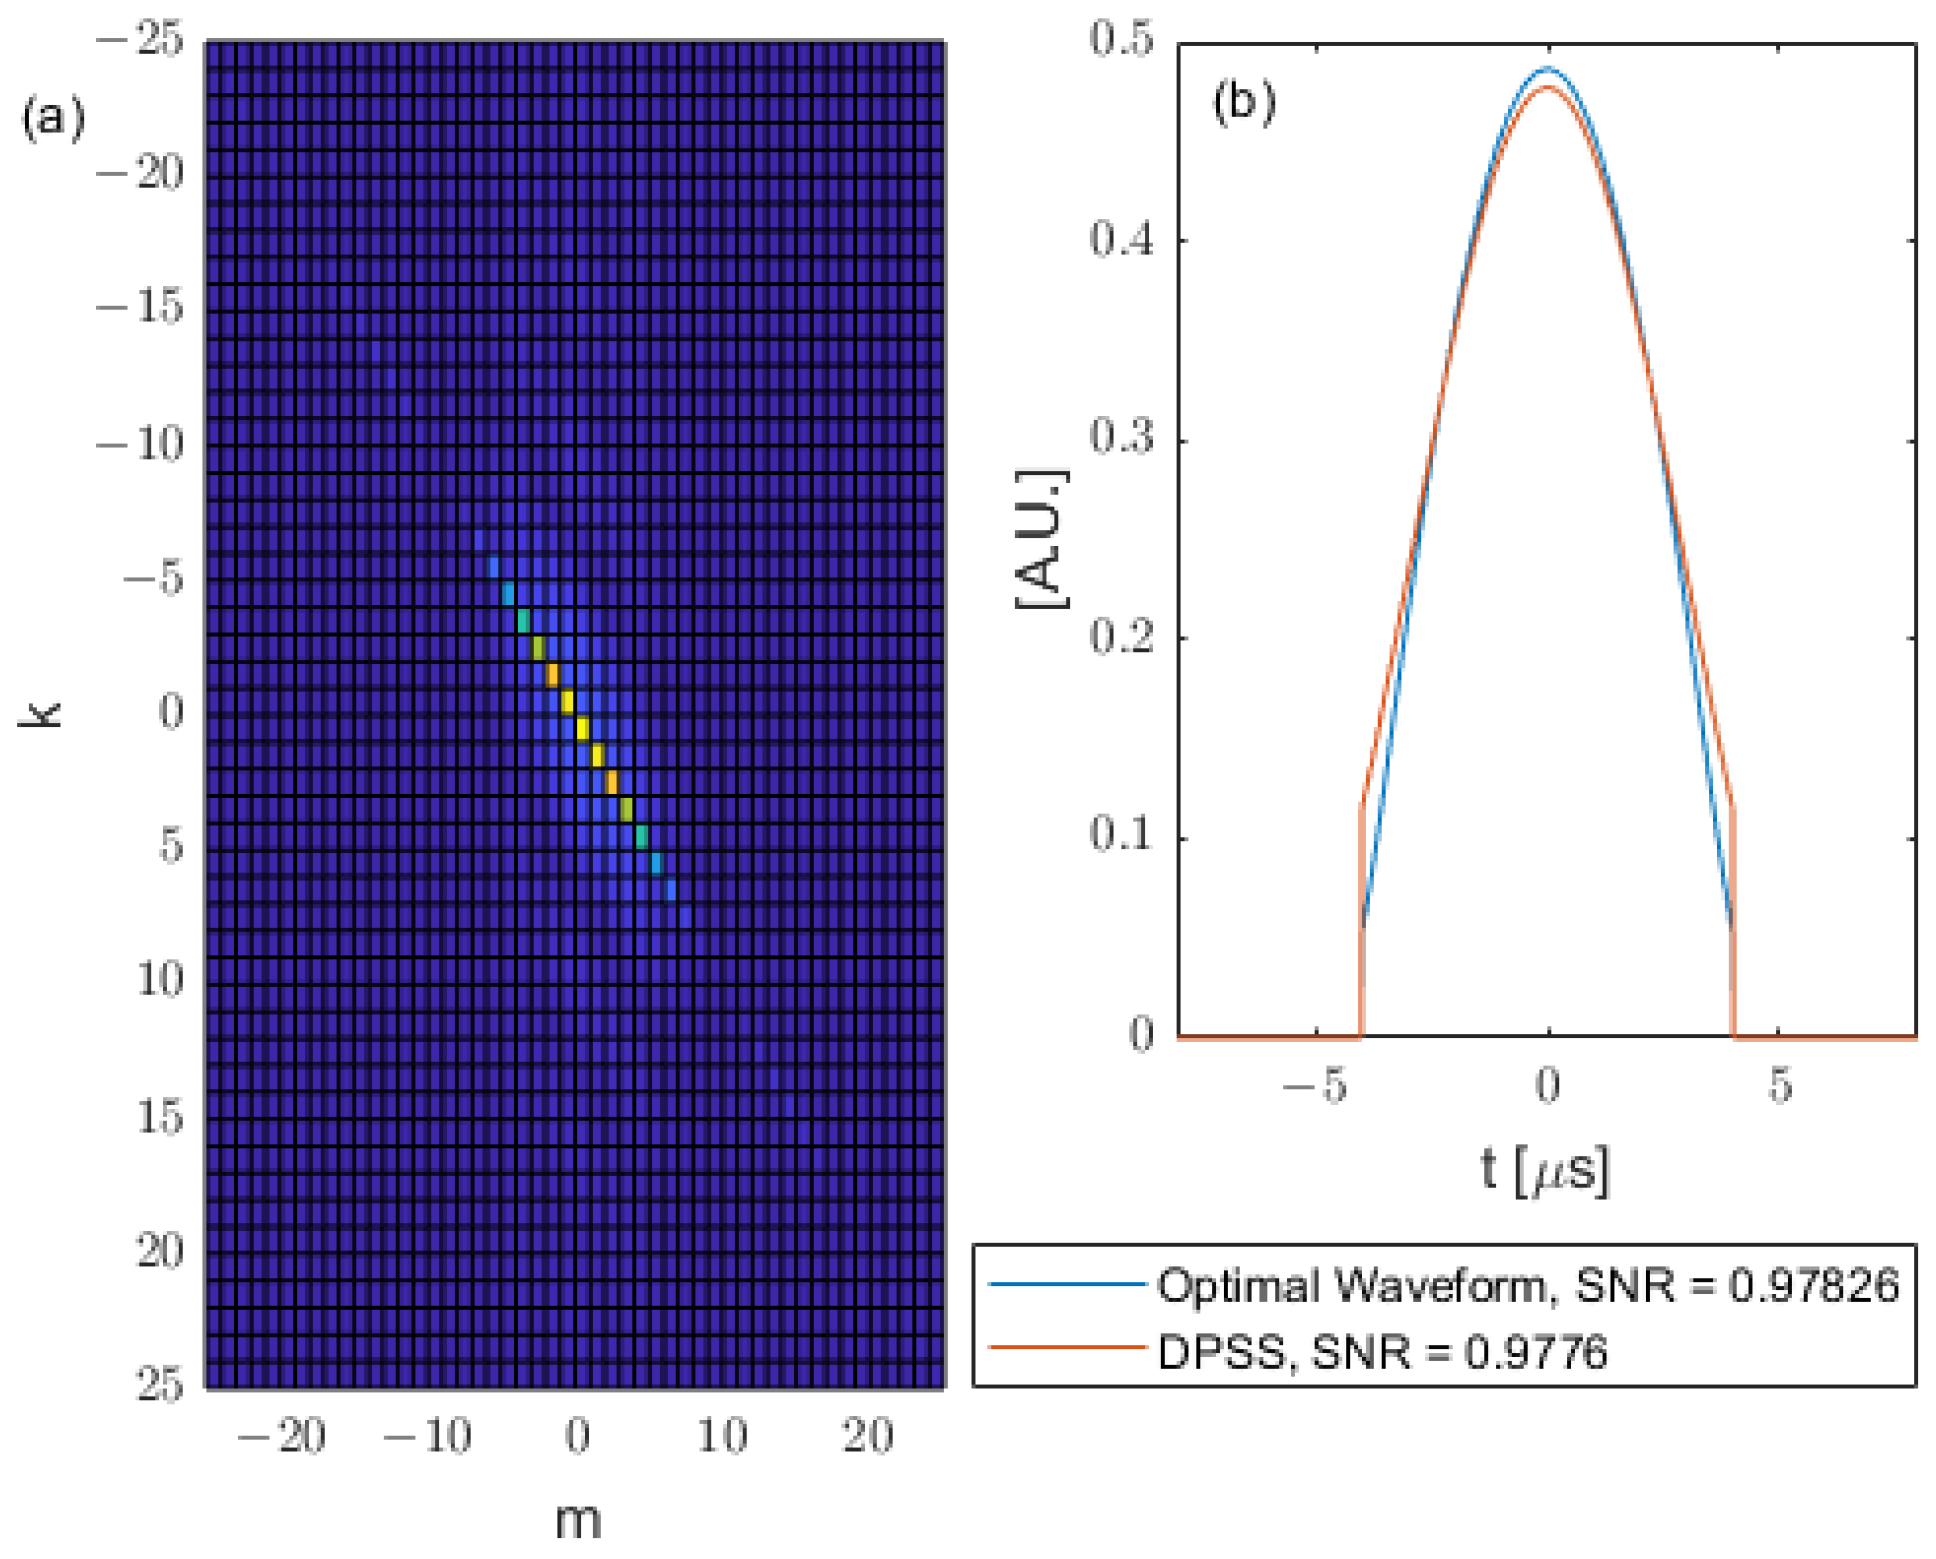
The corresponding Q matrices, optimal waveforms and DPSS waveforms for the square kernel are shown in
Figure 7 with input waveform durations
and in
Figure 8 with input waveform durations
.
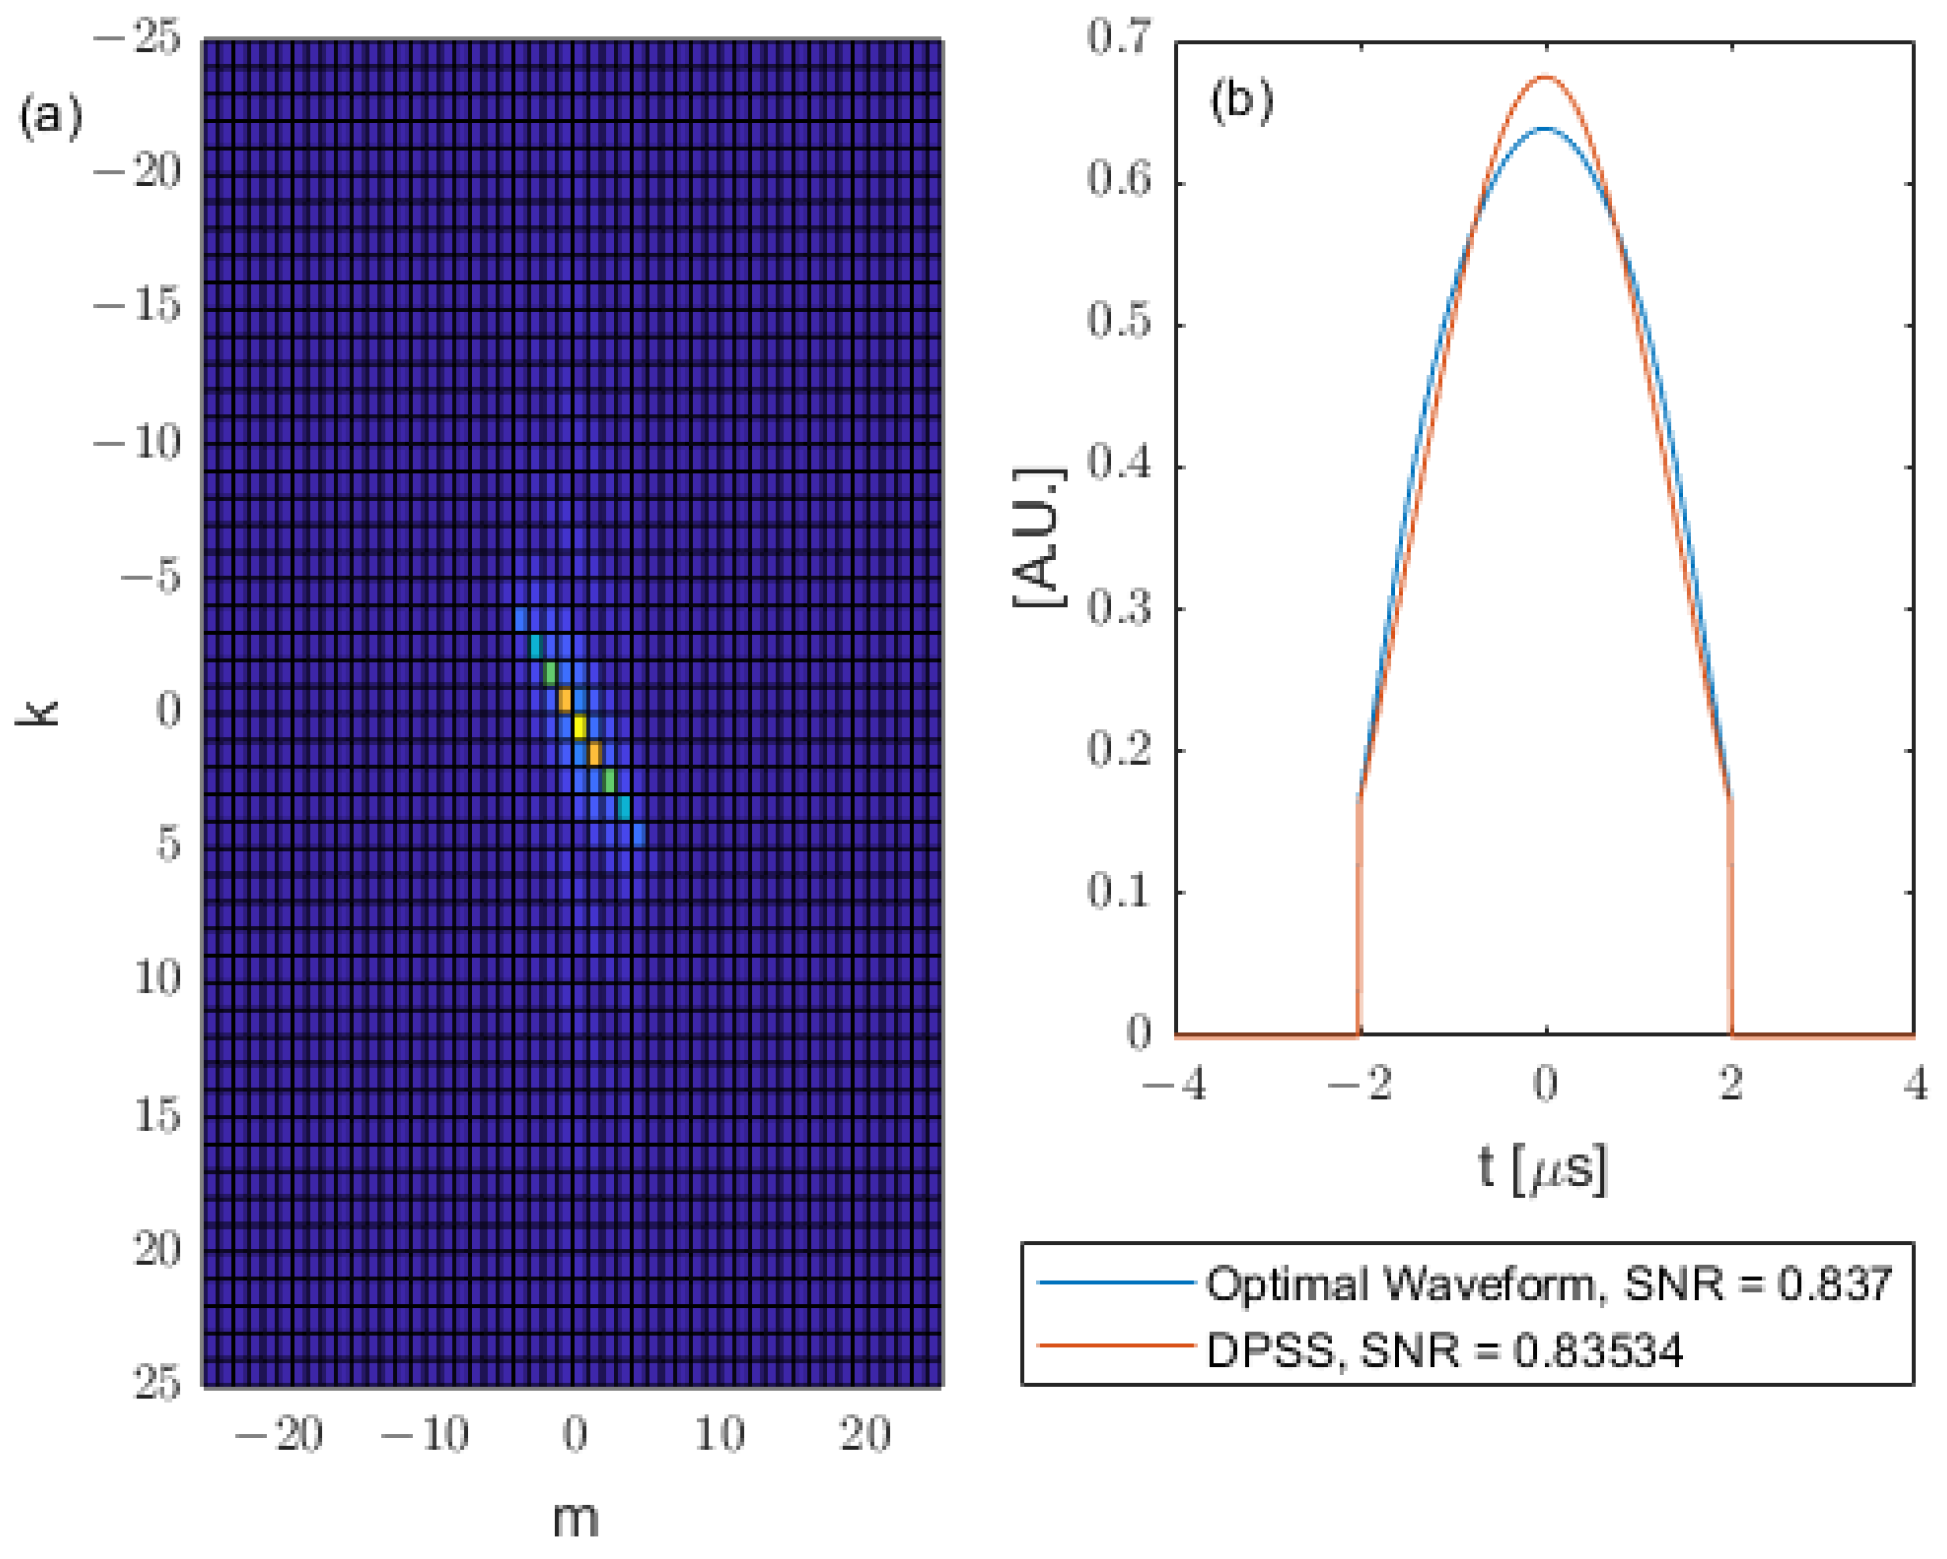
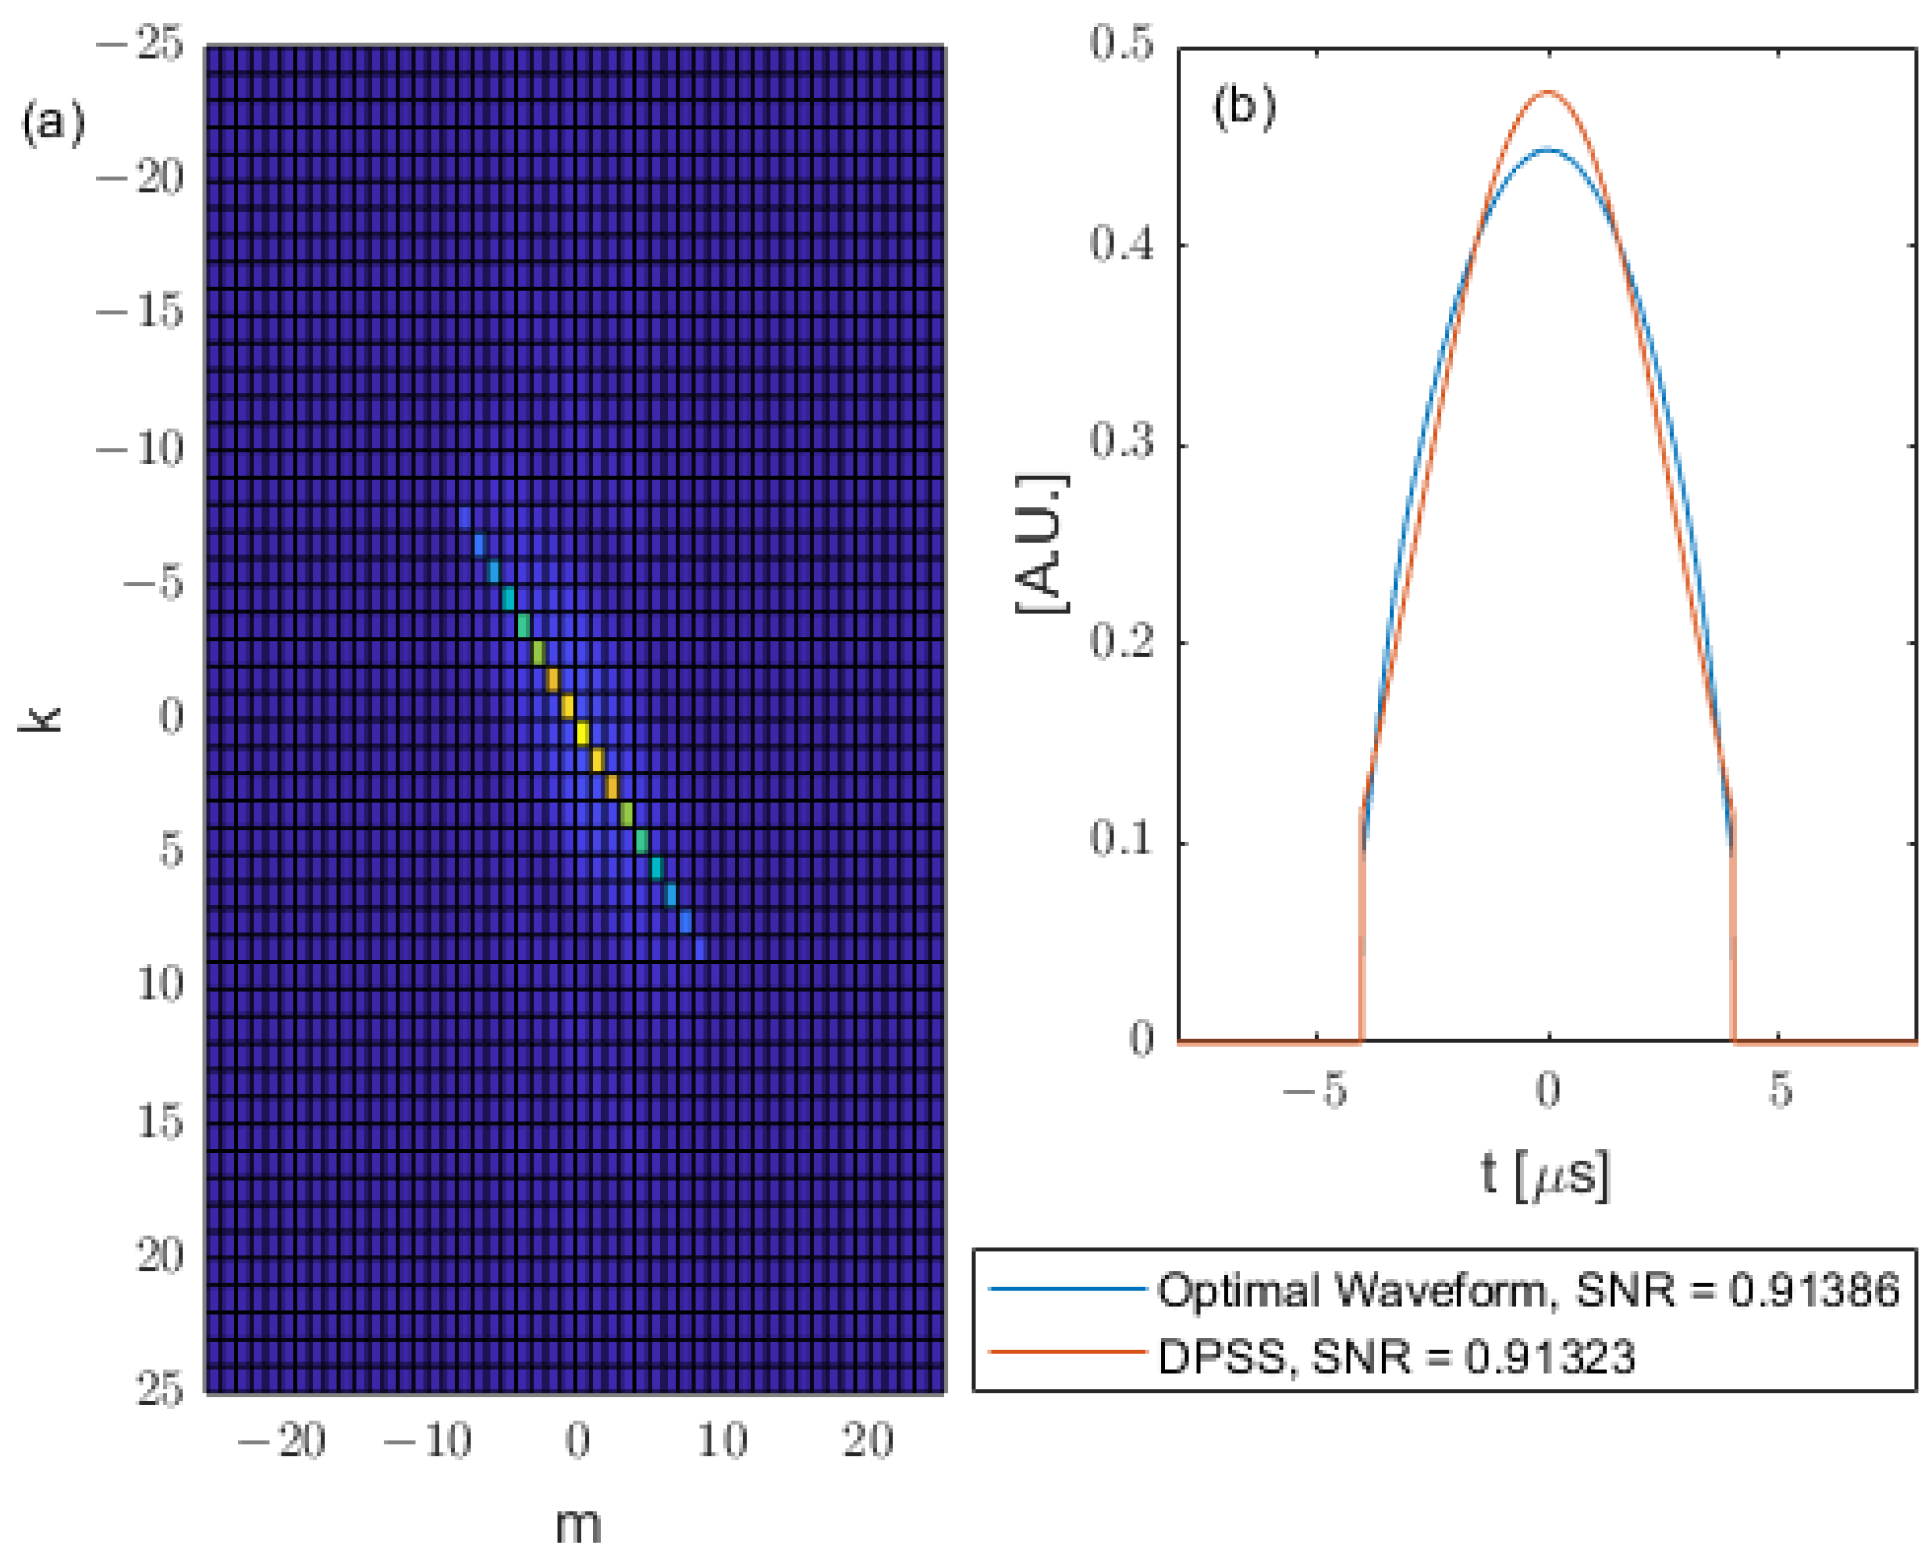
The Q matrices, optimal waveforms and DPSS for the triangle kernel are shown in
Figure 9 with input waveform durations
and in
Figure 10 with input waveform durations
.
The Q matrix, optimal waveform and DPSS for the sinc-squared kernel with
input waveform and
input waveform are shown in
Figure 11 and
Figure 12, respectively.
The Q matrix, optimal waveform and DPSS for cosine kernel with
input waveform and
input waveform are shown in
Figure 13 and
Figure 14, respectively.
5.2. SNR Simulations with Additional Kernel Profiles
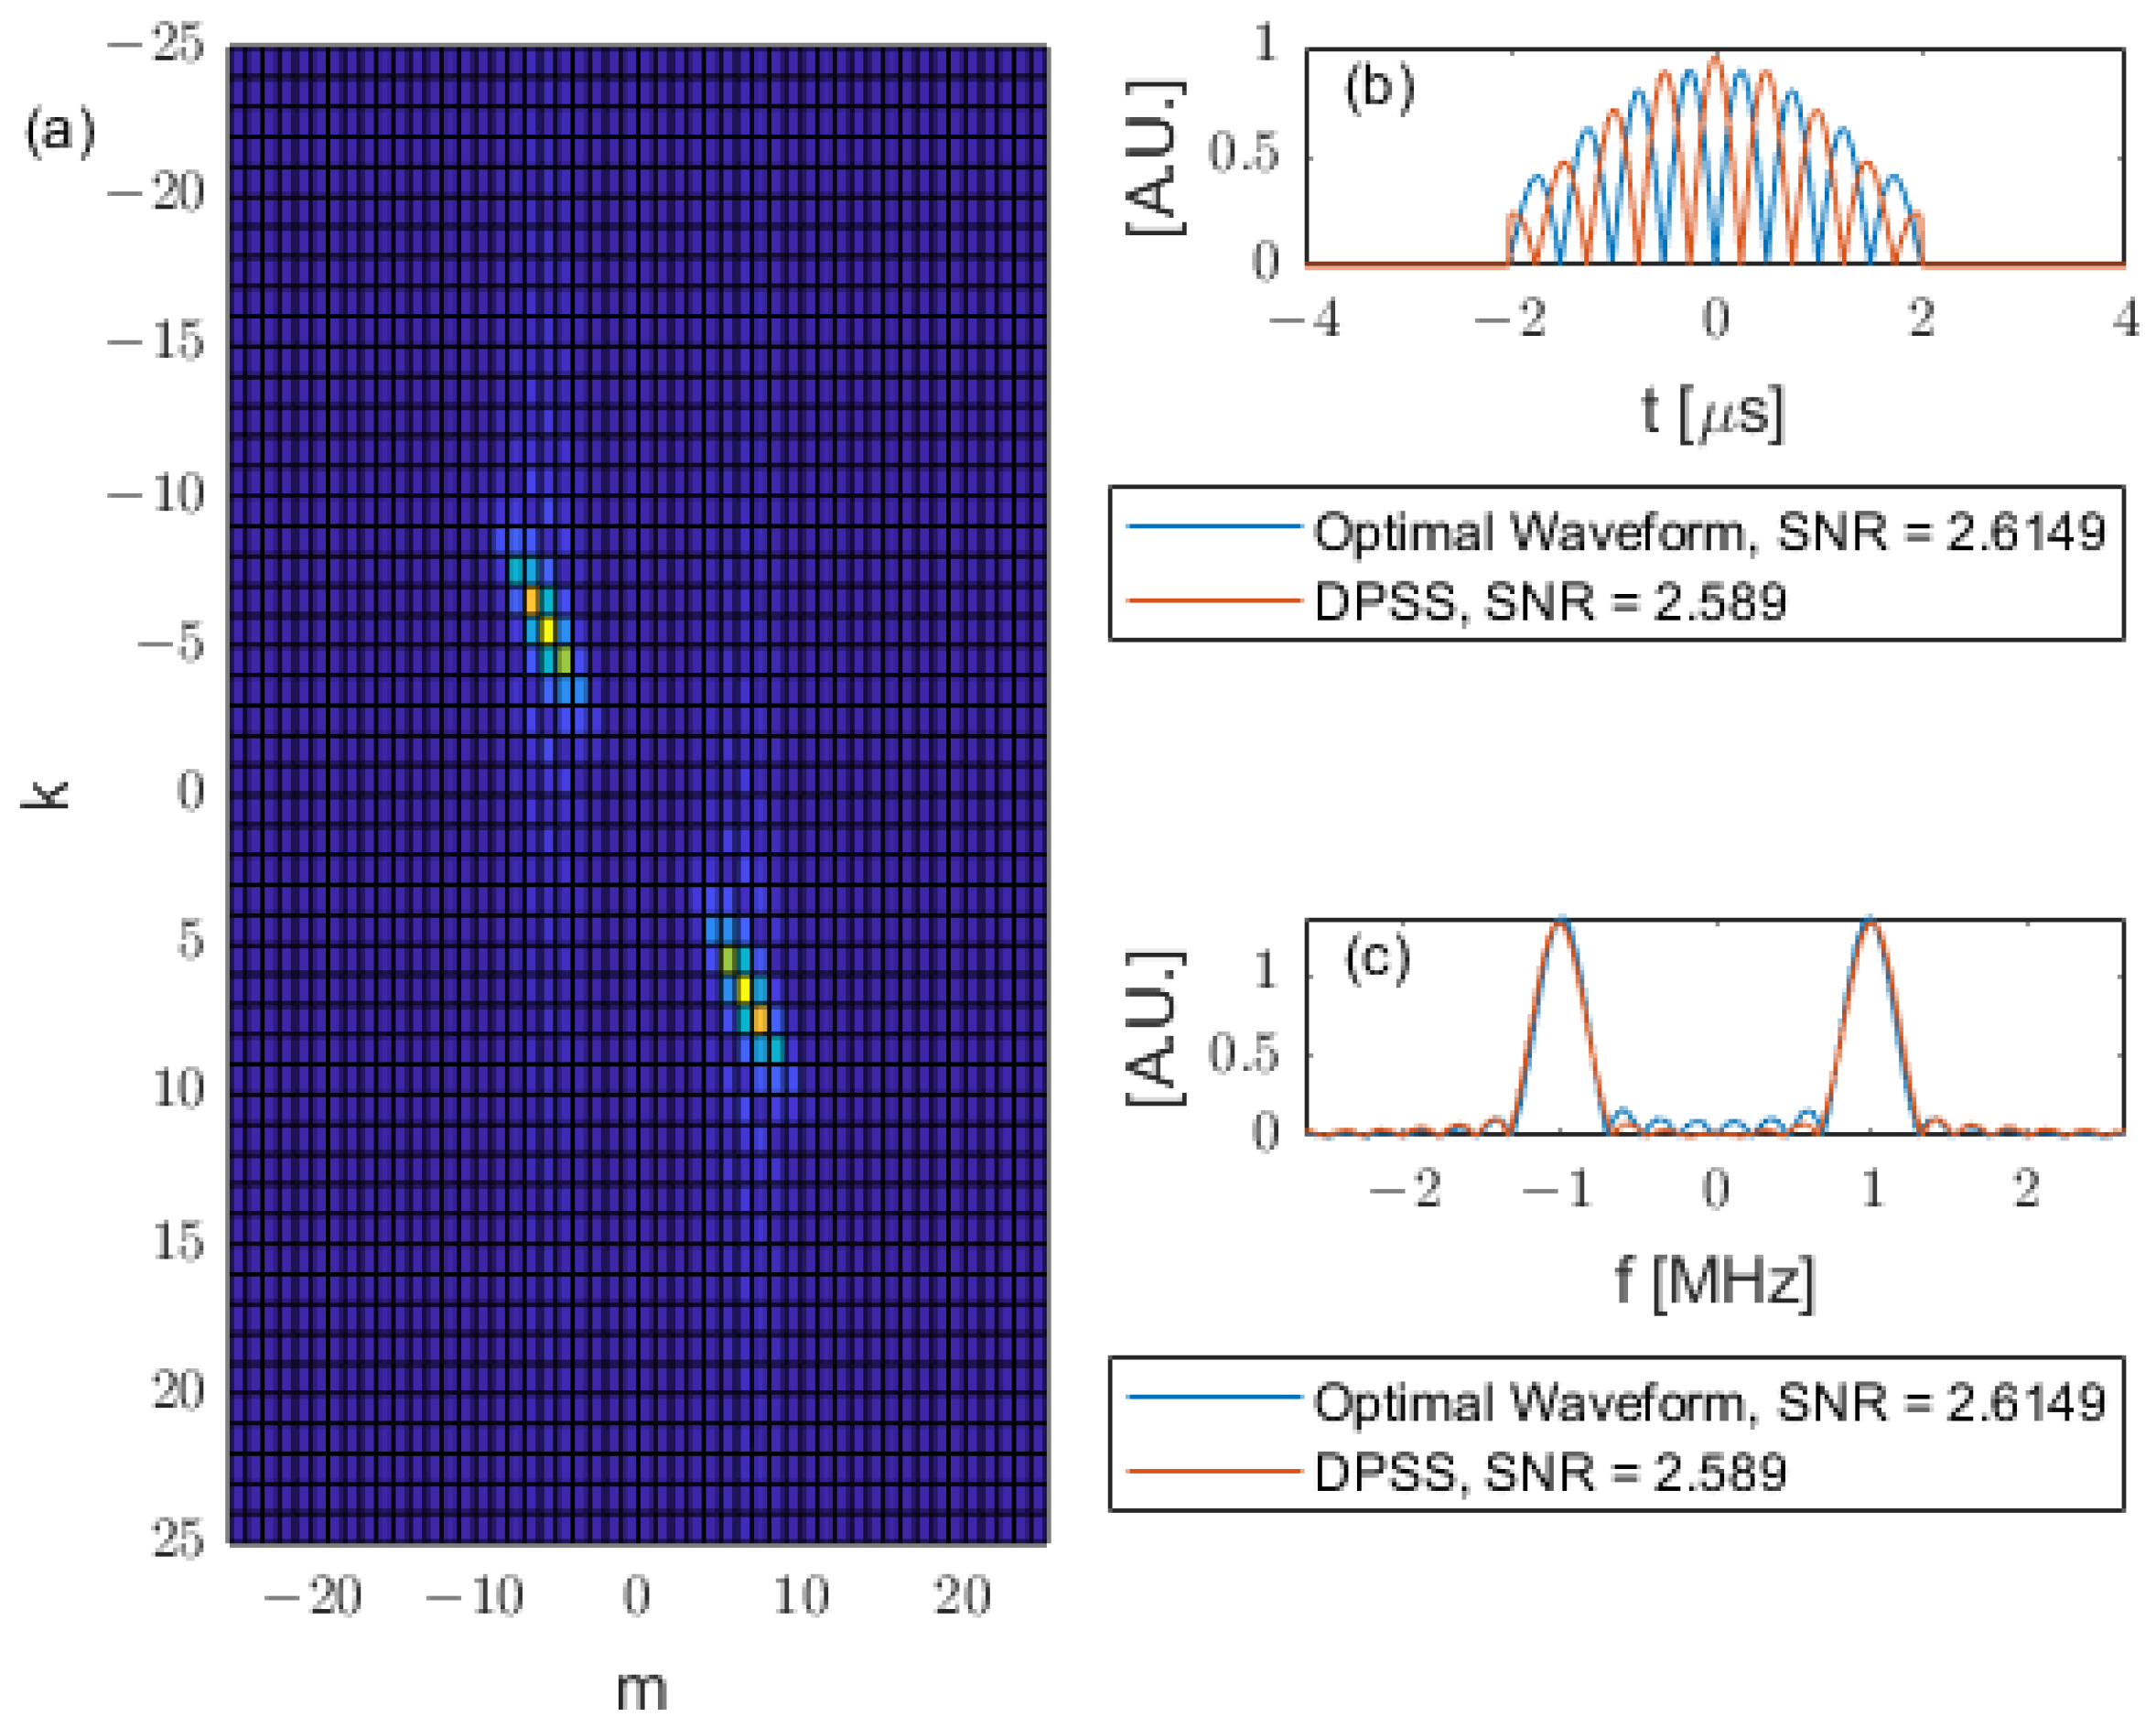
In addition to the simple kernels shown above, some other kernels with distinct profiles are also simulated. The frequency-shifted Gaussian kernel plotted in
Figure 15 is defined as
The frequency-shifted Gaussian kernel has a mirrored peak in negative frequency to ensure a real function in the time domain. As can be seen from
Figure 16, the obtained optimal waveform is also shifted in frequency, the same amount as the kernel. The DPSS in
Figure 16 is obtained by having the same duration
with the optimal waveform and is chosen to have a time-half bandwidth product
. Then, the DPSS is shifted to the centre frequency
and mirrored to have a peak in negative frequency. The resulting waveform is then normalized to have unit energy. From
Figure 16, the SNR obtained from the frequency-shifted DPSS is similar (near optimal) to the SNR obtained from the optimal waveform.
The combined kernel shown in
Figure 17 is defined as
where
and
. The peak value of the kernel appears at
.
The corresponding Q matrix, optimal waveform and DPSS are shown in
Figure 18. Although the kernel in
Figure 17 is complicated, the trends of the optimal waveform and the DPSS are still the same as the trends found for other kernels. The optimal waveform concentrates its energy near the kernel peak frequency. The chosen DPSS with
shifted, mirrored and normalized to have peaks where the kernel has the highest peak in frequency and has a similar near optimal SNR as the optimal waveform.
6. Conclusions
The photoacoustic SNR optimization problem with restrictions on input waveform duration and energy leads to a Fredholm integral eigenproblem, where the functional form of the target absorber needs to be known to be able to solve the problem.
This paper proposed a new approach for addressing the eigenvalue problem of the Fredholm integral by using the Fourier series expansion. This approach simplifies the integral eigenproblem to a matrix eigenproblem and, importantly, allows a heuristic view of how a kernel profile (absorber) affects the eigenproblem. It was observed that the sinc skew-diagonal profile of the resulting matrix makes the resulting eigenfunctions very close to a DPSS, which allowed us to propose that directly using a simple DPSS alone could achieve near-optimal SNR results.
The true-optimal waveforms can achieve higher SNR than other commonly used waveforms, especially when the duration of the input waveforms are limited to be of similar orders of magnitudes with the absorber-characteristic duration. It has been shown that a minimum 5–10% SNR increase can be achieved with this approach [
10]. However, achieving this requires the calculation of the integral eigenproblem for every distinct absorber profile and requires exact prior knowledge of the absorber-impulse response. By using the DPSS approach proposed in this paper, simulation results for different absorbers show only less than 1% SNR drop compared to the optimal waveform and require either no prior information or less prior information of the absorber.
This paper proposed using DPSSs with time-bandwidth product to achieve a near-optimal SNR. For simple absorbers with frequency spectrum peaks centred at the origin, prior information about the absorber is not needed. The criterion of choosing a DPSS is to choose the longest allowable duration imposed by the constraints on the problem, and to choose a corresponding bandwidth to achieve for the DPSS. For absorbers with frequency shifts (i.e., where the spectrum is not centred at the origin), the only required prior knowledge about the absorber is the location of the peak frequency. The DPSS with longest allowable duration and with must then be shifted to be centred at the same location of the peak frequency of the absorber.
In conclusion, near-optimal SNR results can be obtained by using the DPSS with as the input waveform. The only further required prior information to find the near-optimal DPSS are (i) the input-waveform restrictions on the duration and energy and (ii) the location of the peak frequency of the absorber to determine where to centre the DPSS in frequency.


