1. Introduction
With the development of optoelectronics, the application of the photoelectric effect is becoming increasingly important in vibration measurement. Vibration measurements play an important role in the study of the dynamic properties of structures. It is important to achieve global measurements of an object in its working state without affecting its own motion [
1,
2]. When an aero-engine is in operation, it produces vibrational effects on its surface ducts, and measuring these vibrations helps to understand the engine’s operating performance and damage detection [
3,
4]. It is therefore important to achieve a global vibration profile of the engine piping and to measure it in such a way that the engine itself is not affected.
Among the contact measurement methods, acceleration sensors are commonly used due to their cost and convenience. For example, Liu (2014) investigated the performance testing of an aero-engine assembled by a cracked blade-induced detuned blade disc through sensors [
5]. This measurement method can only measure local data for analysis. Chai (2021) developed a finite element model of an L-shaped pipe system with clamps and used a shaking table test to validate the natural frequency and finite element model [
6]. The above methods are limited by the number of sensors and when using the contact sensor method, it is difficult to achieve global measurements [
7,
8,
9]. In general, contact sensors can only provide sparse, low spatial resolution measurements and they do not easily provide a comprehensive, rapid measurement of the dynamic response information of a structure.
Laser measurement and vision measurement are two typical non-contact optoelectronic methods. Full-field measurements or vibration measurements in variable directions are difficult to achieve using laser methods, as the small measurement range due to laser characteristics does not allow for global measurement requirements [
10,
11,
12,
13]. Visual measurement is now widely used in vibration testing due to its large measuring field of view and non-destructive testing characteristics. Wang (2018) used the experimental modal analysis method to reconstruct the first few modal parameters of the cantilever beam [
14]. Lin (2021) investigated the laboratory’s nonlinear vibration characteristics of engine pipelines [
15]. The impact of fixture looseness on the nonlinear vibration characteristics of the system is investigated using the vibration transmissibility approach. Dong (2017) proposed a vision-based method to monitor the dynamic response of structures and identify modal parameters, mainly measuring the bridge structure in the laboratory environment [
16,
17]. The binocular vision measurement method used above requires the setting of manual marker points and has limitations in the amount of data that can be measured [
18,
19]. The binocular vision method still needs to set markers for matching in the measurement and cannot achieve complete non-contact measurement. Compared with binocular vision, the projection measurement technology using structured light has more advantages in measuring global data [
20]. Some researchers have combined structural light projection measurements with vibrations, on the basis of which global measurements have been carried out for various structures [
21,
22]. Wu (2022) solves the problem of full-field strain prediction of variable cross-section beams by the visual method, and improves the theoretical calculation accuracy of displacement-strain transformation [
23]. This method is aimed at the measurement of modal parameters for known vibrations and thus has limitations for the identification of modal parameters in operating conditions. Therefore, it is necessary to establish a method that can measure global data and apply it to engine pipelines.
Based on the analysis presented earlier, this paper proposes a global dynamic testing method for measuring the overall vibration information of engine pipelines in working conditions, which is based on projection measurement. The modal parameters of the engine pipeline are obtained by combining the vibration data obtained with the time domain analysis method. By comparing the results of the projection measurement method with those of the contact sensor method using high-precision laser sensors as the reference, this paper shows that the projection measurement method can reduce measurement error and improve measurement accuracy. Experimental results demonstrate the feasibility of identifying modal parameters under working conditions using the proposed method, providing a basis for the diagnosis of faults in engine pipelines.
The remainder of the paper is organized as follows:
Section 2 discusses the theoretical basis of the proposed method, where the projection measurement scheme used in this paper is described and analyzed in detail.
Section 3 addresses the projection measurement experiments and sensor experiments for the turbine engine. Then,
Section 4 gives the results of this paper and the associated analysis. Finally,
Section 5 concludes the paper.
2. Theory
In order to obtain the natural frequency of the object, it is necessary to extract and reconstruct the vibration information of the pipeline on the engine surface, and then obtain the natural frequency of the object by analyzing the vibration information. In order to realize the complete non-contact measurement of engine surface pipeline, the method is based on digital image correlation, rather than phase unwrapping. As shown in
Figure 1, the specially designed speckle matching function can improve the matching speed. At the same time, the optimal defocus degree is determined by objective defocus method. The binary defocus method can speed up the projection speed, while the circular method can reduce the total number of gratings required for reconstruction. The six-step phase shift method is used instead of the three-step phase shift method to improve its measurement accuracy.
2.1. Six-Step Term Shift Method Based on Structured Light
To enhance the measurement accuracy, a six-step phase-shifting grating is adopted instead of the conventional three-step one. The six-step phase shift algorithm with a phase shift of
can be expressed as follows:
where
m denotes the grating order ranging from 1 to 6.
k is the mean intensity,
A is the intensity modulation and
is the desired phase information. By solving the following equation,
can be obtained:
The phase of the object can be obtained from six images only. To resolve the phase ambiguity, the speckle image is embedded into the phase-shifted fringe pattern, which enables the integration of phase-related and digital-related features for feature point matching. Both types of features can achieve high-precision measurements by matching a large number of pixels, but the matching speed is compromised due to the high computational cost. Therefore, a hybrid method that combines both features can improve the matching speed compared to using either one alone. In this paper, an objective defocusing method based on structural similarity detection in image processing is employed for projector defocusing measurement. Then, stereo rectification is applied to match feature points only on the same horizontal line in subsequent stereo images to accelerate the matching process, and disparity constraints are used to complete the matching.
After a single image is matched, the data of the reconstructed point cloud can be improved by recycling images. For example, when 4000 images are needed in this experiment, this paper only needs to shoot 4005 images. In a set of images required to obtain the wrapped phase, the object in each frame is considered to be relatively stationary. However, the object is in fact moving, so there will be motion errors between frames. In this article, the Wang method [
24] is used to reduce movement errors.
After reconstructing the point cloud data, this study specifically utilized the actual three-dimensional information of the needle jet engine pipeline to extract each point. Due to the inability to correlate the scattering information of points at different times, specific position information of vibration time domain cannot be obtained. As shown in
Figure 2, the actual length of the engine line changes very little during vibration and this feature can be referred to the point cloud data for clustering of the data. To solve this problem, this study distinguishes the pipes according to their length information by clustering the data in X and Y coordinates of the point cloud according to their location respectively. The points are clustered and the average value of the clustered used to calculate the data of the three axes of XYZ. Finally, 100 points were selected by length of line for subsequent data analysis and processing.
2.2. Modal Parameter Identification Based on Displacement
The excitation information of an aero-engine in its operating condition is difficult to measure and the traditional transfer function-based modal parameter analysis methods are no longer applicable. In order to measure the modal parameters in the operating condition, this paper uses a modal parameter analysis method on time domain analysis. The identification process for a specific aircraft engine is shown in the diagram.
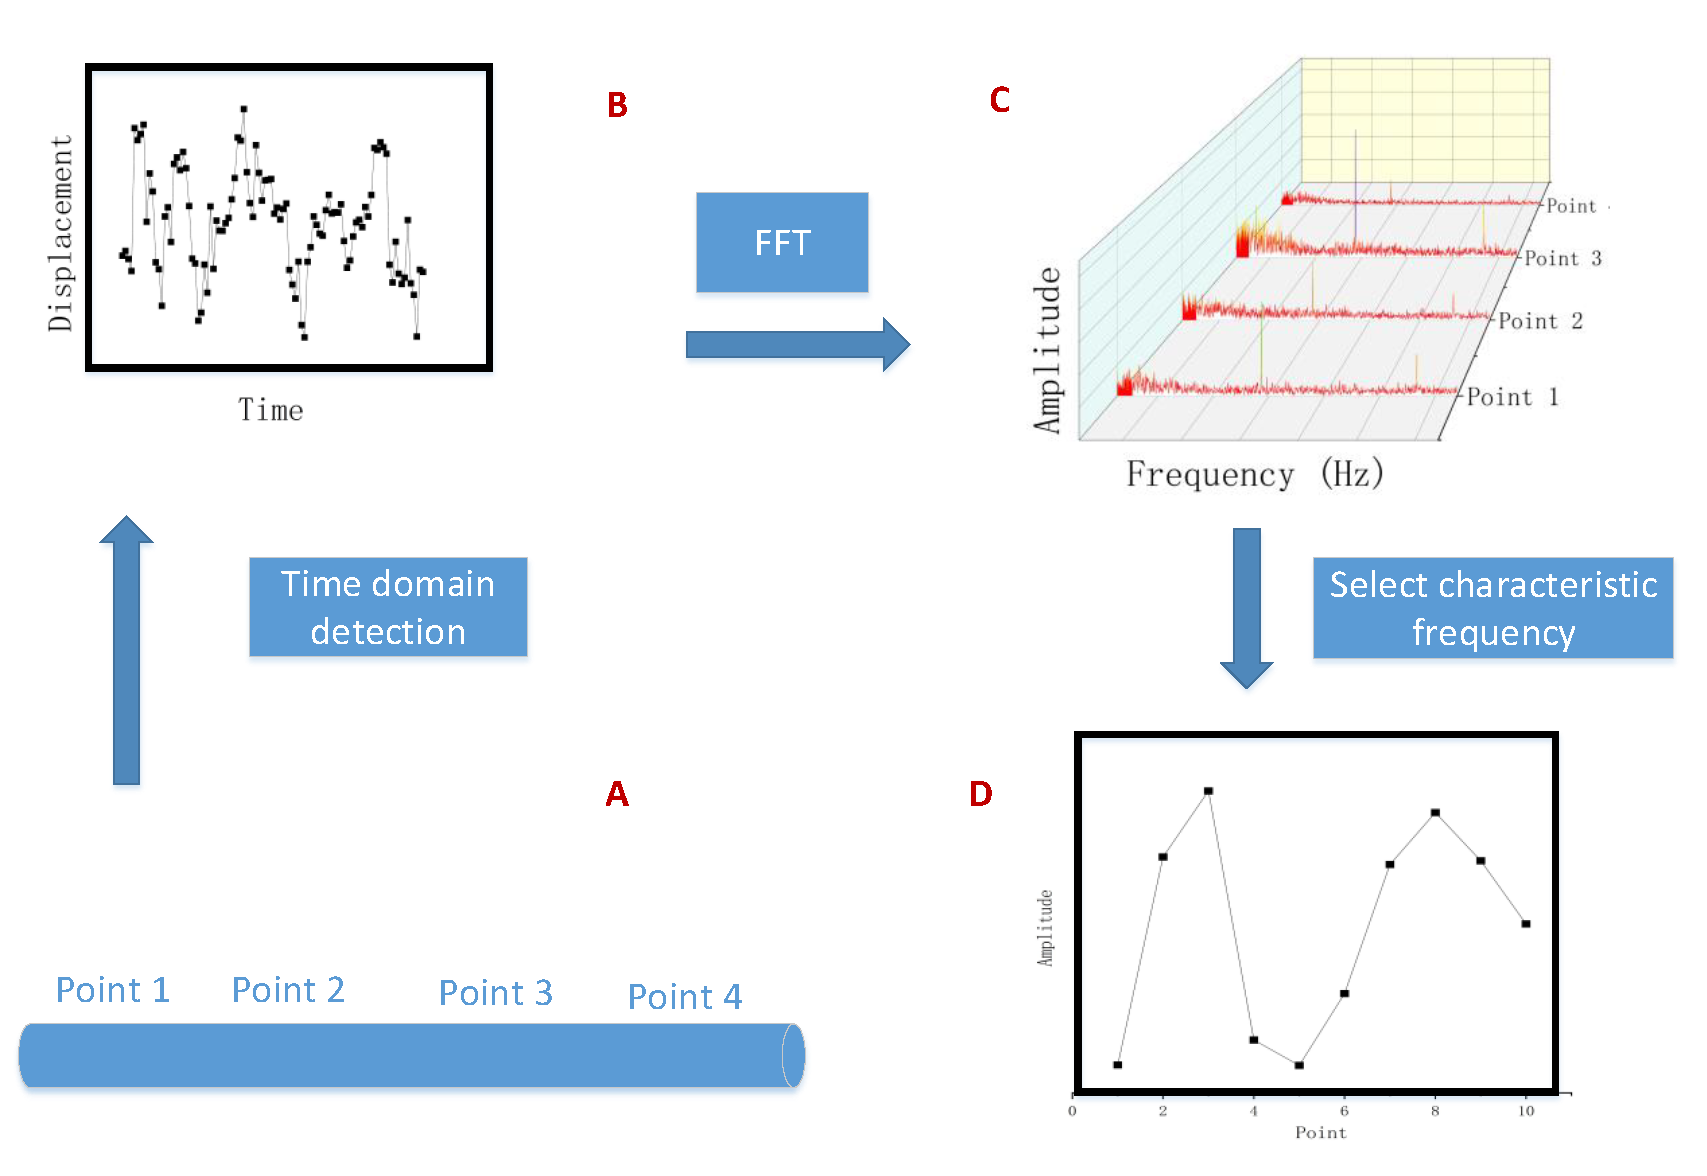
Figure 3 is a schematic diagram of time–frequency domain transformation of displacement time. The first step involves the use of clustering methods in the upper portion of the graph to establish the correlation between the time and displacement of the various points in section B. Subsequently, the Fast Fourier Transform (FFT) is applied to section B to obtain the Fourier spectra of the selected points. The corresponding amplitude parameters are extracted based on the frequency corresponding to the peak value of each point. Finally, the modal vibration parameters are obtained in section D by normalizing and arranging the amplitude parameters according to the order of the points. This method allows the vibration of the various parts of the system to be matched to the modal parameters. The vibration results are obtained by means of special peaks in the amplitude–frequency image of the fast Fourier variation, and the modal shape is obtained by means of the corresponding amplitude at each point. This method allows the identification of the modal parameters of the system without having to obtain the vibration model of the structure itself and the vibration source, which is ideal for the measurement of unknown structures.
3. Experimental Test
In order to verify that the method in this paper is able to measure the full field information of an operating engine pipeline, three measurement methods are designed to measure the pipeline vibration of a turbine engine.
The first method uses a high-precision laser displacement sensor and the purpose of the experiment is to use the results of the measurement as a reference value for comparison with other methods. The laser displacement sensor has the advantage of high measurement accuracy and is capable of non-contact measurement. At the same time, the method is limited in that the measurement range is influenced by the laser. In order to reduce the influence of engine vibrations, a force hammer is used to tap the engine pipeline to measure its vibration.
The second method uses a contact accelerometer. The purpose of the experiment is to verify the measurement accuracy and range of the method as a comparison experiment. The contact sensor has the advantage of a large measuring range and a long measuring time. Again, this method can also affect the accuracy of the measurement due to the quality of the sensor. Since its measurement data can be recorded over a long period of time, the experiment can measure its vibration in its operating condition.
The third method is the structured light projection measurement method proposed in this paper. Its experimental purpose is to verify that this method can measure the entire vibration of the engine pipeline and can analyse its vibration modes. The purpose of this method is to address the vibration of the engine in operating conditions and to be able to perform modal analysis.
3.1. Experiment with Laser Displacement Sensor
The primary measurement method employed in the first experiment involved the use of high-precision laser displacement sensors. Due to the limited measurement range of the laser displacement sensors, severe interference occurs when the engine is in operation, rendering measurement possible only when the engine is not functioning. In this case, since there is no vibration source, the hammer impact method was employed. The hammer impact method uses the impact of a hammer as an excitation input, with the sensor serving as the output, and the collected data are used to analyze the inherent frequency of the object. It is the most widely used method for testing frequency response functions.
The main laser displacement sensor used in the experiments is the keyence il-100 with a measuring distance of 75 mm to 130 mm and an accuracy of 4
m. The experimental steps are all as shown in
Figure 4; first, install the device and then open the interface, ready for the sensor measurement. The line is then struck with a force hammer and the data are collected, and finally its parameters are analyzed by the software(Matlab2016) to obtain information about them.
3.2. Experiments with Contact Sensor
The second experiment differs from the first method in that the contact sensor can be measured while the turbine engine is in operation. To determine the accuracy of the measurements, two contact sensor measurements were sampled for this experiment. In order to obtain more accurate parameters for engine vibration data, contact sensors measure the engine line data in the turbine engine vibration state.
The main accelerometer used in the experiments was the DH132 from Tung Wah Testing, with a weight of 65 g and a sensitivity of 100 mv/m·s
. As shown in
Figure 5, the contact sensor is first attached to the surface of the pipe, then the turbine engine is switched on and the software corresponding to the sensor is switched on to carry out the measurement and finally the data are obtained through the analysis software.
3.3. Experiment with Structured Light
For the measurement of turbine engine lines using projection, the following equipment is used: an industrial projector (DLP4500, from Texas Instruments Incorporated), two high-speed cameras (Flare 2M360-CL, from IOI Industries), f = 25 mm lens, two blue filters (450 mm), a blue light source, a computer and a turbine engine (SPARK T16, from Guangzhou Spike Aviation Equipment Co.). Here, the projector is used to project streaks and synchronisation signals, the blue filter is used to filter the effects of the flames produced by the engine and the high-speed camera is used to pick up vibration signals from the pipeline. The experimental procedures are outlined below.
The projector used for the experiment is a DLP4500 with a resolution of 912 × 1124 pixels and a maximum projection speed of 4225 Hz. The maximum frame rate of the camera is 360 fps, so based on the above data, the maximum sampling rate for the experiment is 360 fps. In order to measure and obtain more experimental data, the projection and camera sampling rate used for this experiment was 256 Hz. As shown in
Figure 6, the first step is the projection calibration, where the appropriate projection interval and the internal and external parameters of the two cameras are selected. Then, the turbine engine is switched on and the synchronized projection and triggered camera shots are taken by the projector to obtain the synchronized data, which are finally analyzed by the software.
4. Results and Discussion
4.1. Result of Sensor
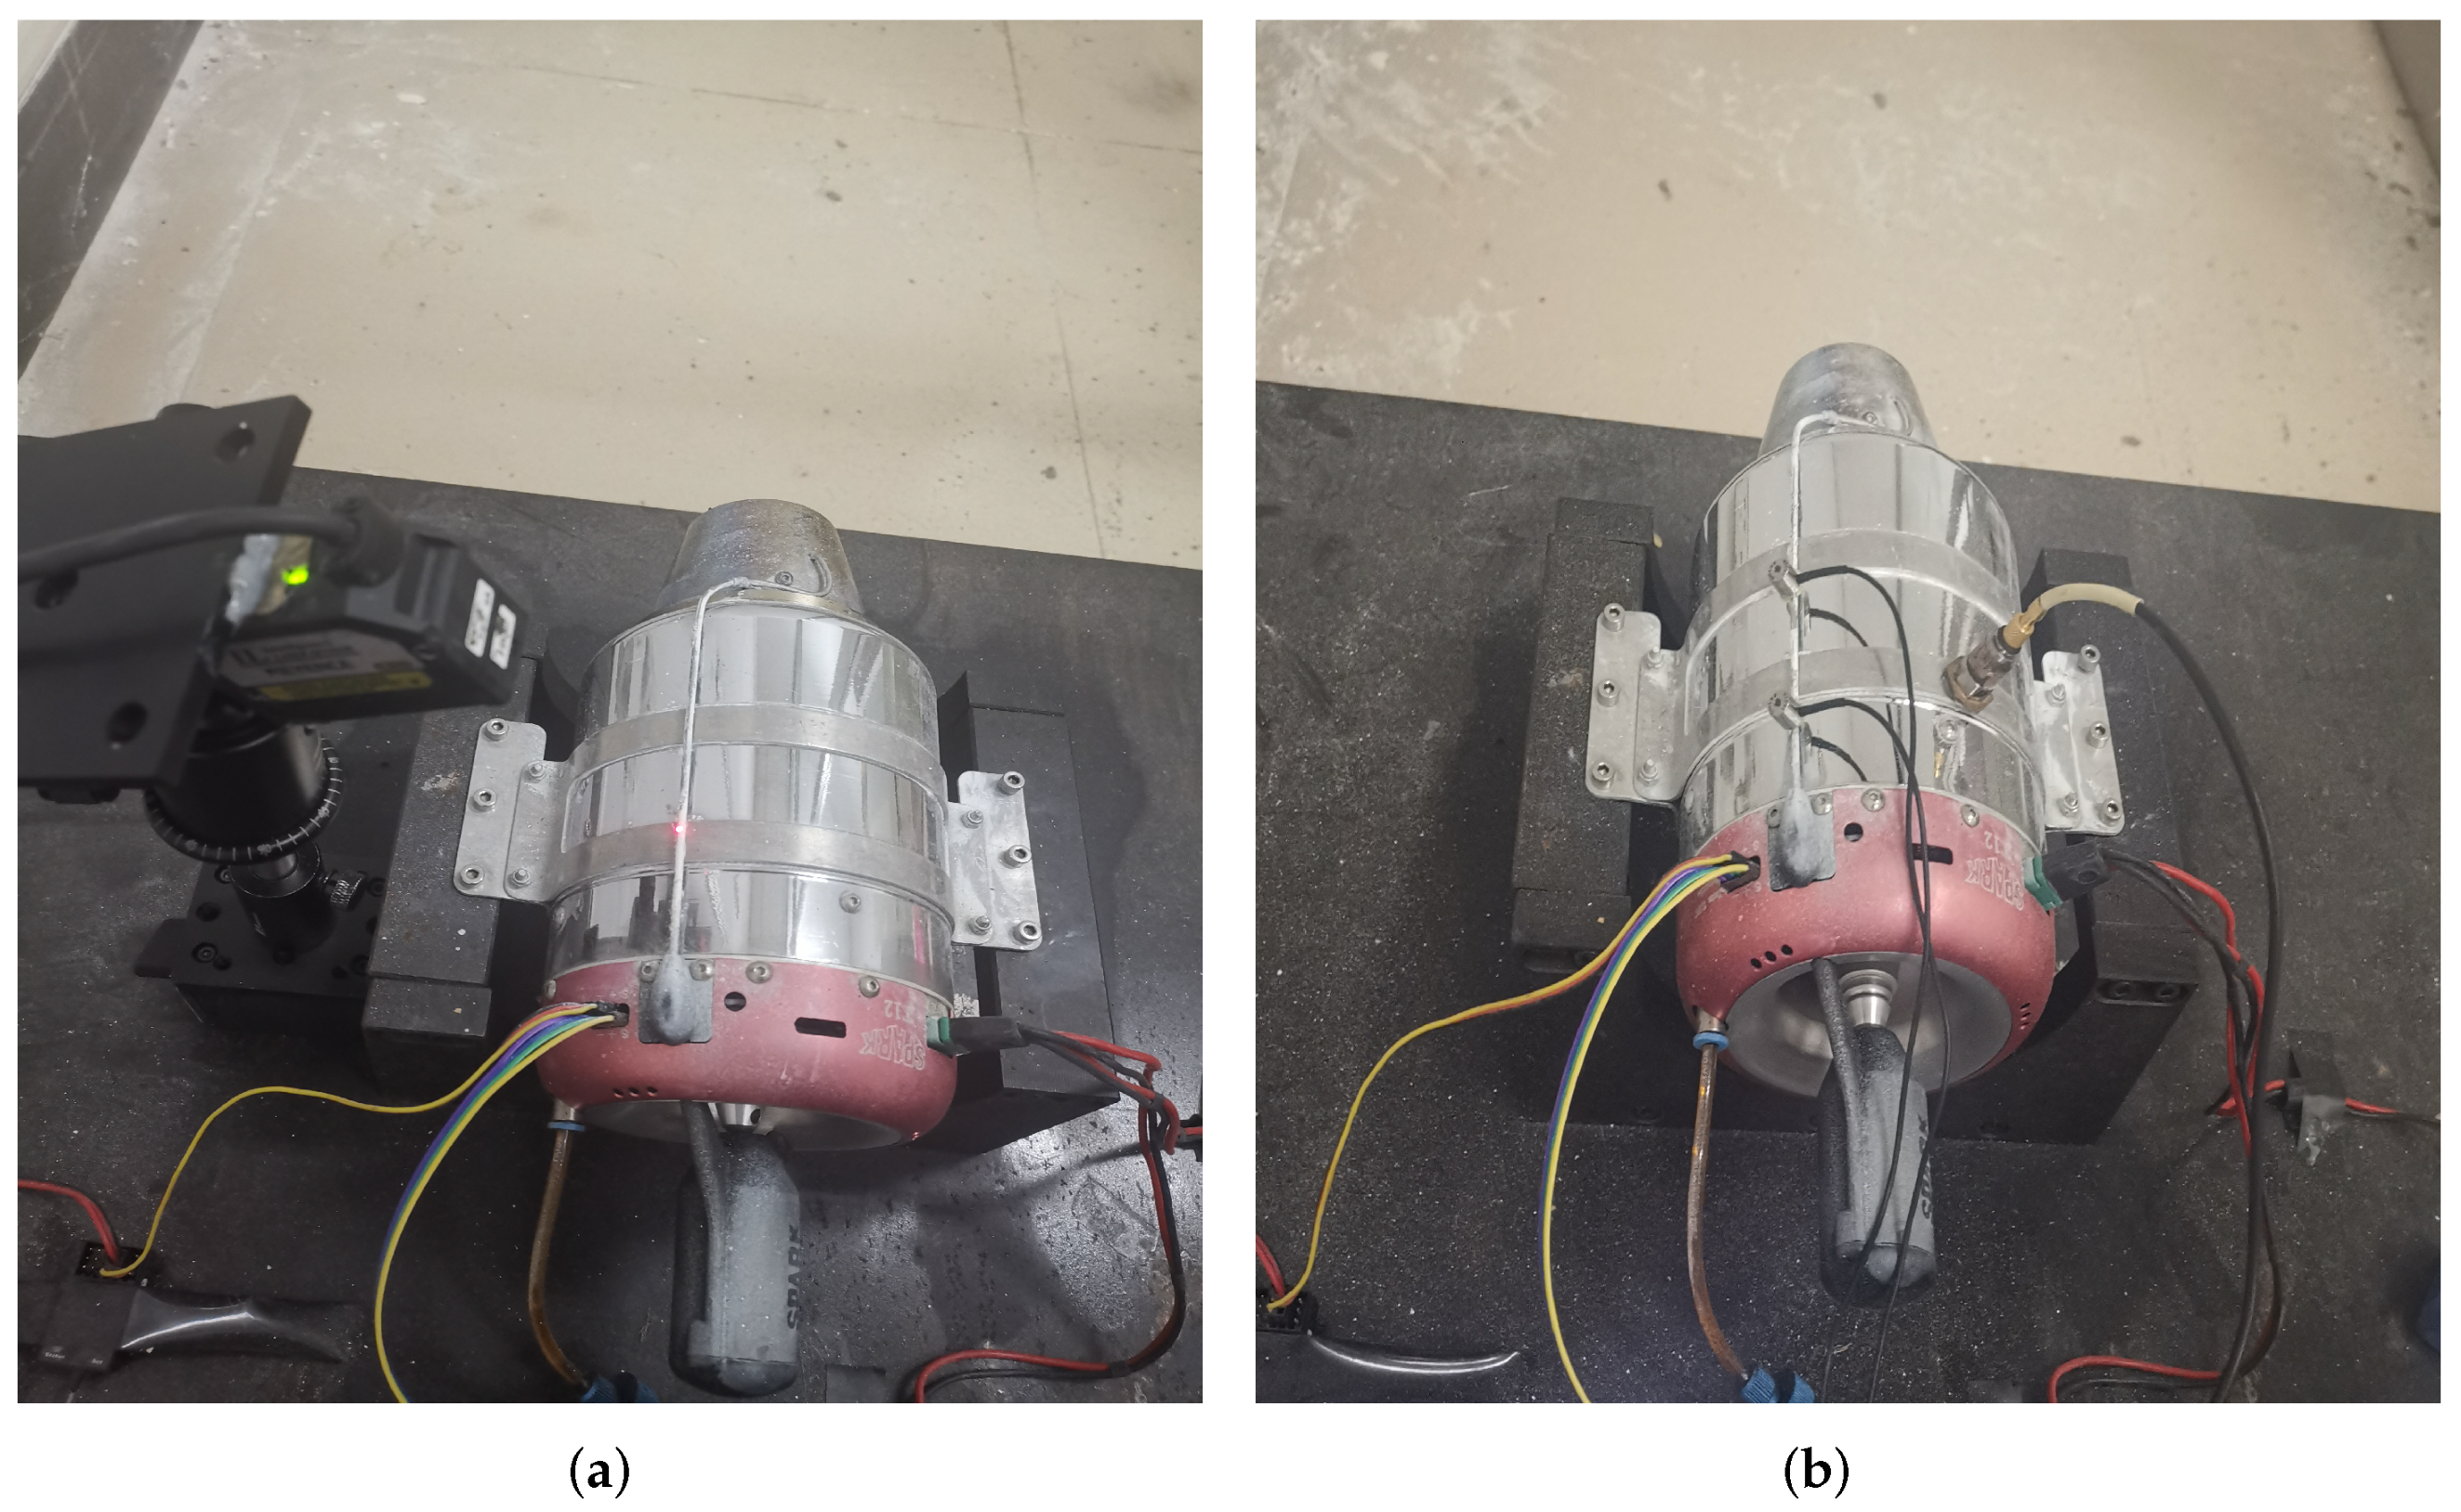
Using the aforementioned approach, the data of the two experiments were initially acquired. The physical objects of the experiments are illustrated in the figure, and the obtained data are all based on the oscillation relationship of time series. As the data obtained from the laser displacement sensor and the contact acceleration sensor cannot correspond one-to-one, their natural frequencies are analyzed through FFT transformation. The actual experimental diagram is shown in
Figure 7.
The analysis of the results is obtained through the software and the specific results will be listed separately.
The sampling frequency of the laser displacement sensor is 500 Hz, and as can be seen from
Figure 8, the data in the first experiment were varied by FFT to obtain a plot of the amplitude and frequency characteristics for that time period. The 113.3 Hz in the graph is the first natural frequency of the engine line.
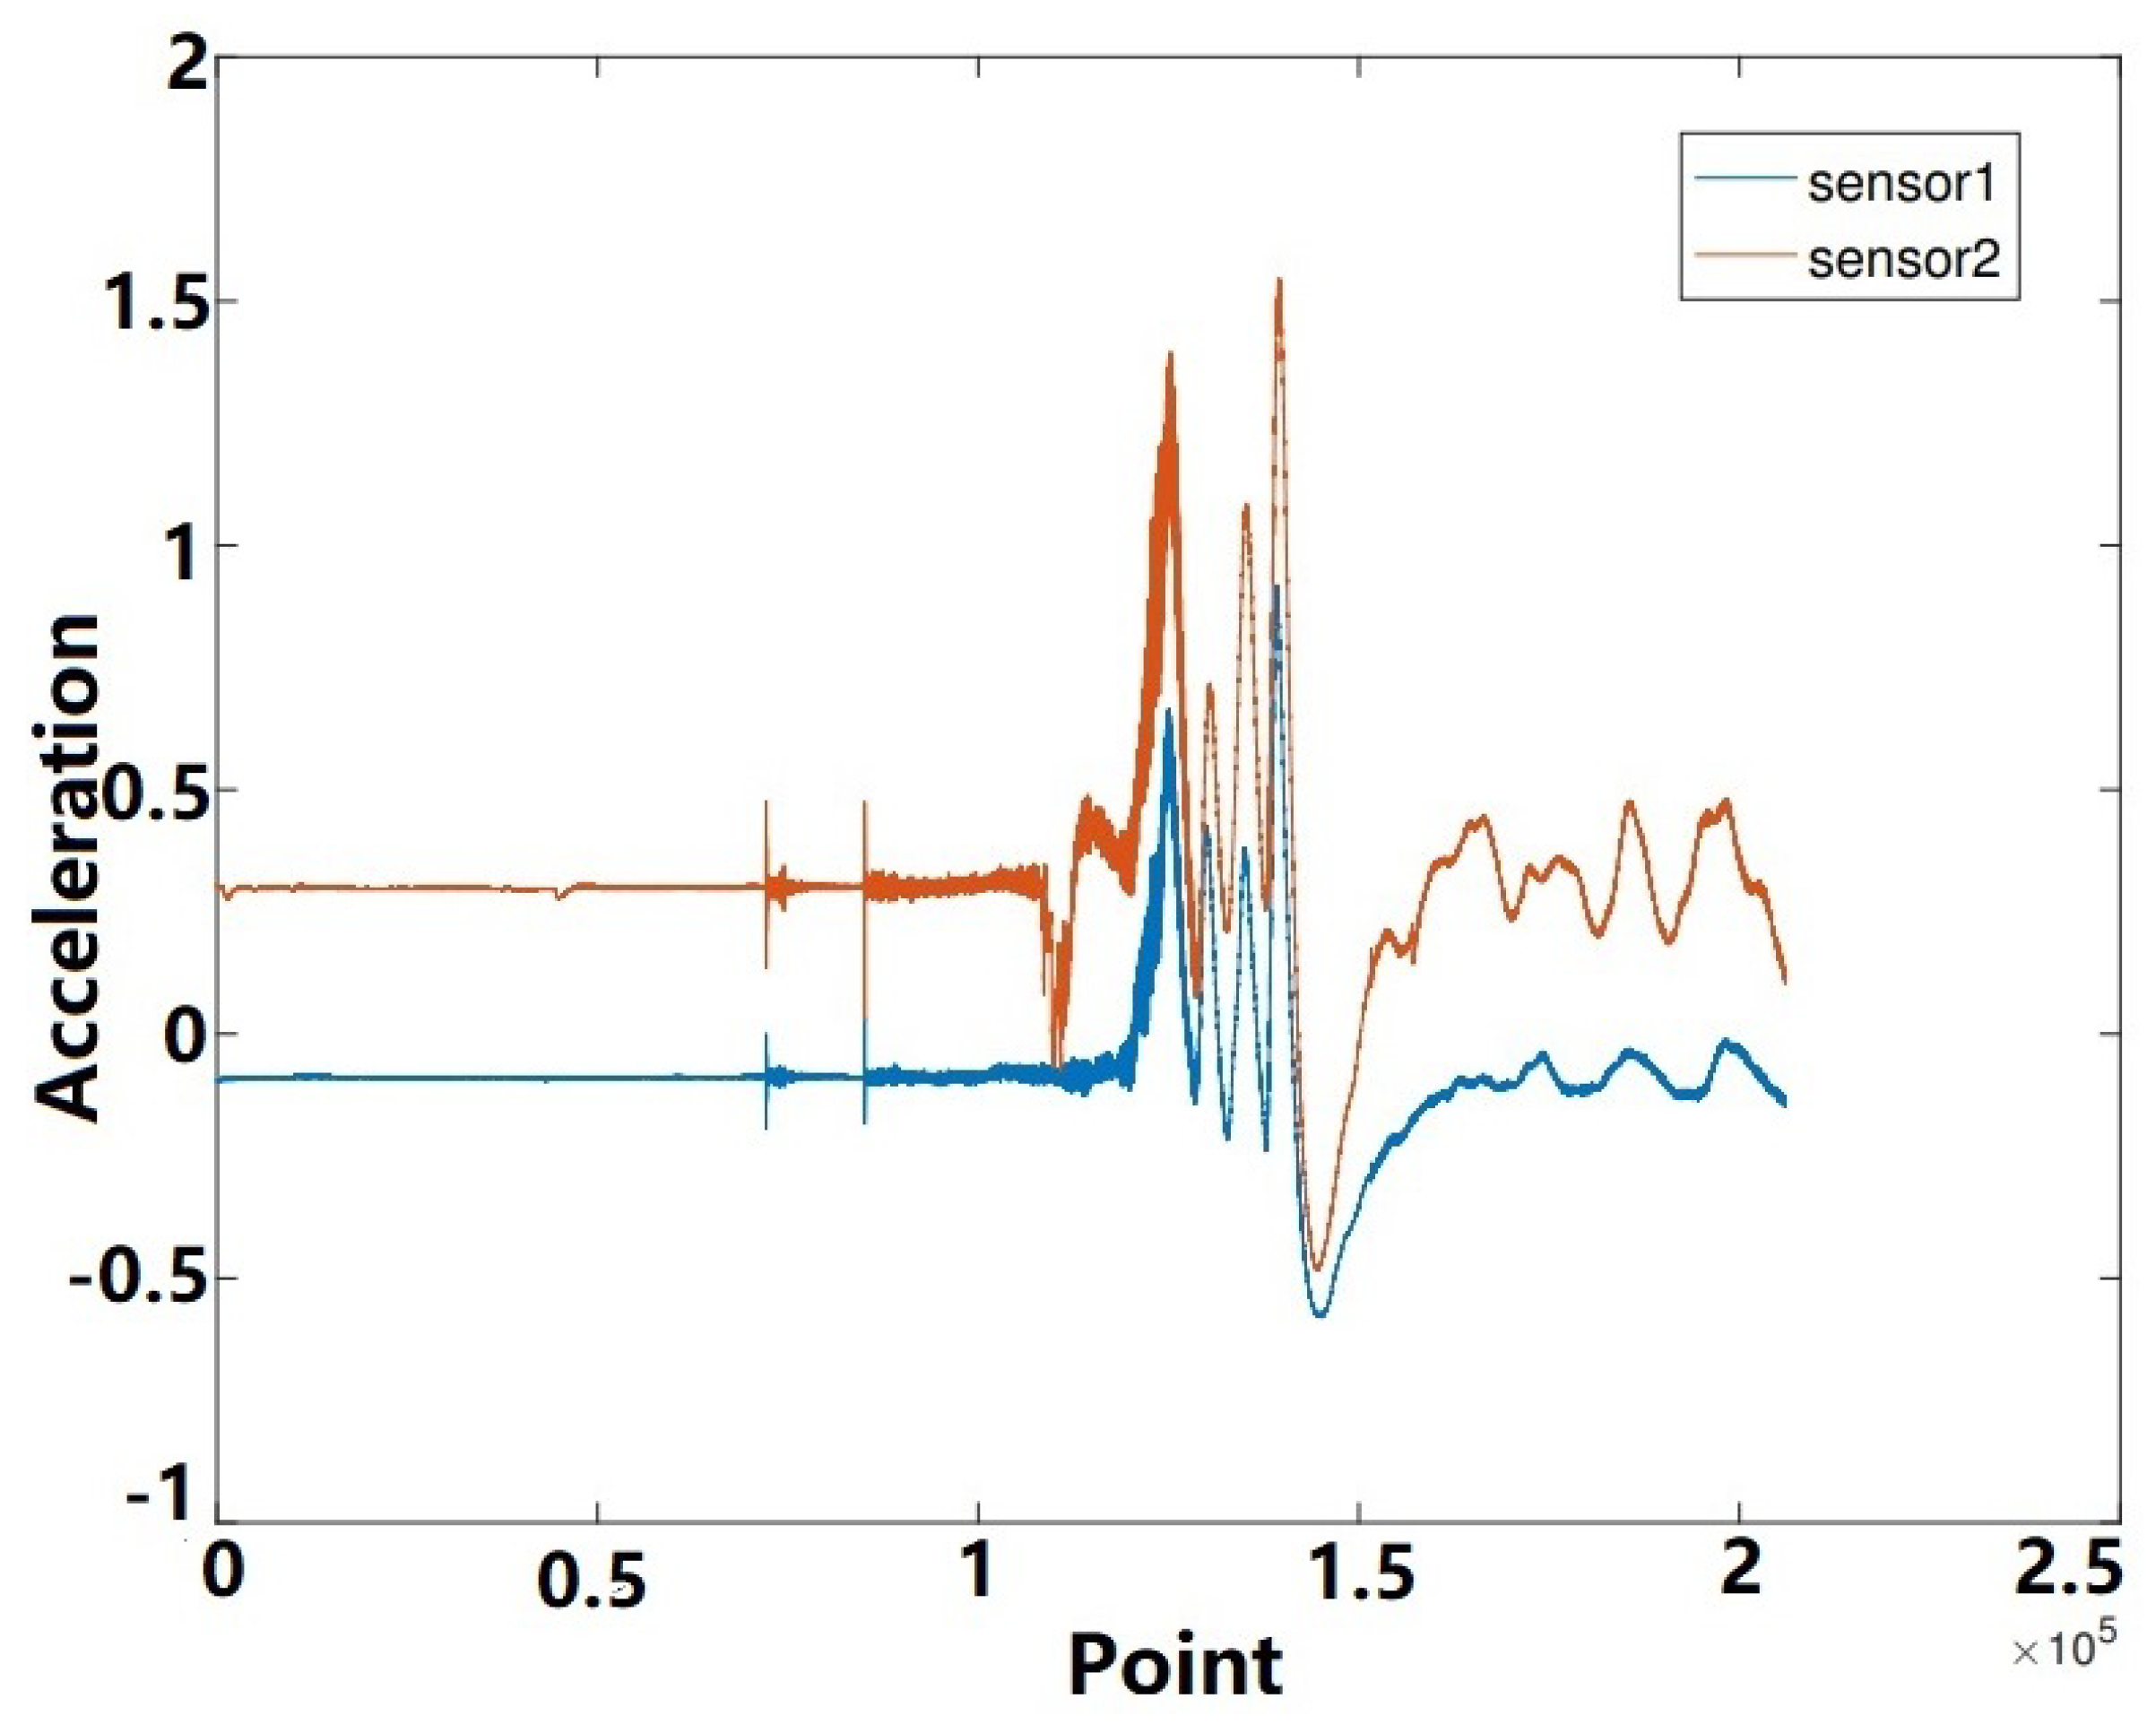
The results of using the contact sensor to measure the engine’s operating condition are shown in
Figure 9. When the time starts at the 100th second, there is a clear difference in the acceleration data from the two sensors. The data from the two sensors show how the engine lines were vibrated by internal engine vibrations during the following 10 s. When different parts of two sensors are selected, and the time is from 100 s to 107 s, respectively, the characteristic frequencies detected are shown below.
As can be seen in
Figure 10, the corresponding frequency in the peak data found in the graph is 115.8 Hz. The analysis shows that this corresponds to the first-order natural frequency, which also corresponds to data from the experimental measurements.
4.2. Result of Structured Light
As shown in
Figure 12, the depth information of the left and right cameras is obtained by a six-step item shift method, and then the three-dimensional information of the surface pipeline of the turbine engine is reconstructed by depth information matching.
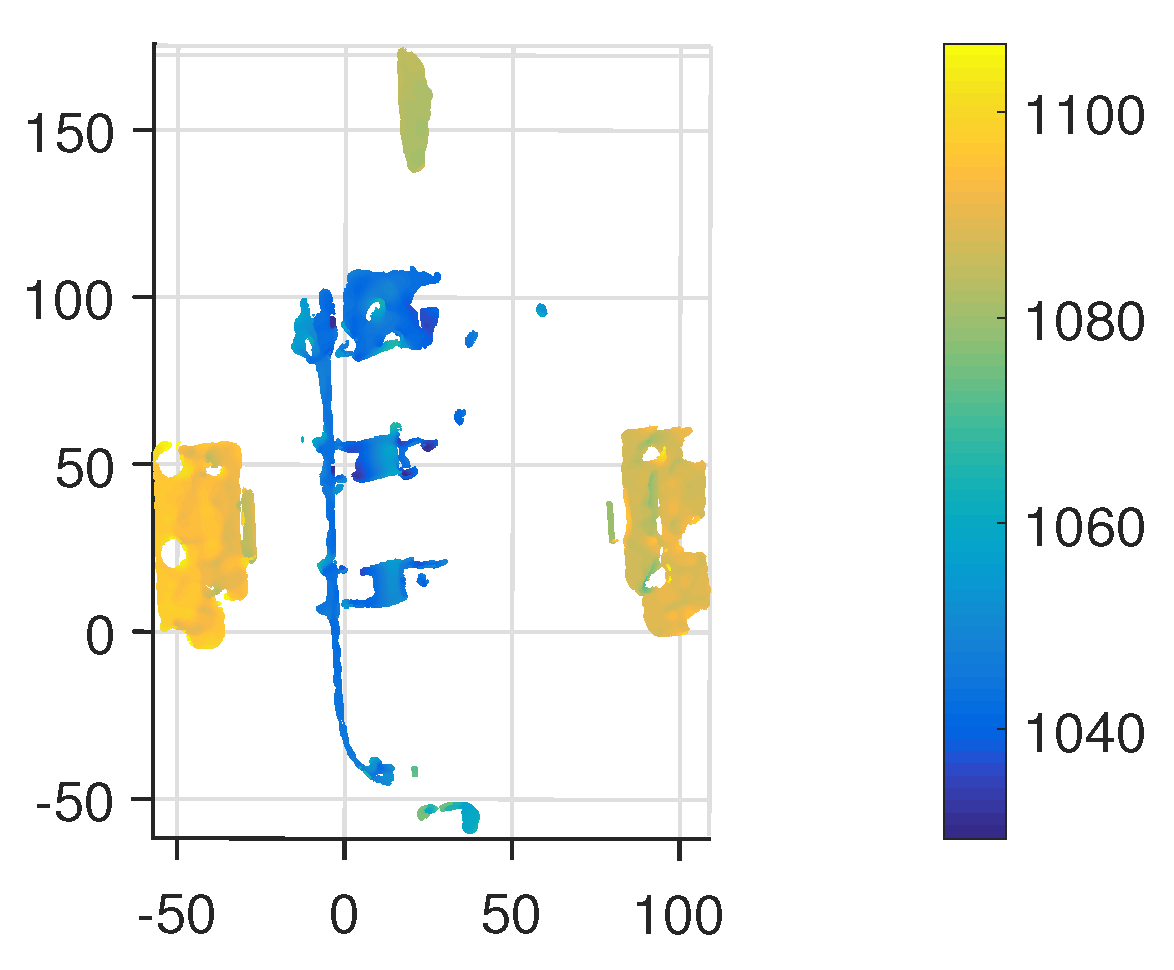
As shown in
Figure 13, the reconstructed data are point cloud data, and the relative displacement information of the corresponding position cannot be obtained. Here, this paper uses the method of point cloud collection which first eliminates other point cloud data of the engine pipeline, and then divides the engine surface point cloud data into 100 parts through the actual length of the engine surface pipeline. The present study reports the outcomes of the analysis conducted on the three-dimensional motion of each point over time. The graphs illustrate the variation of distance traveled in millimeters along the Z direction, time along the Y direction and 100 points along the X direction. The sampling frequency of 256 Hz ensures that the 4000 points plotted on the graph correspond to a duration of 15.625 s. It is noteworthy that a smaller number on the X-axis indicates a position closer to the rear of the engine. To facilitate a comprehensive comparison of the motion state at each point, the displacement values of the 100 points were deduced from their respective initial values, resulting in the subsequent plot of the effect.
It is apparent from the illustration, as referenced in
Figure 14, that there are issues with the matching of the first 20 data points. As a result, only the data from the 20th to the 100th points were utilized for subsequent analysis. The displacement data obtained previously were subjected to FFT transformation, and the characteristic frequency was determined by examining the data. In this study, the displacement data from the 60th point were chosen for FFT transformation, resulting in the determination of its parameters.
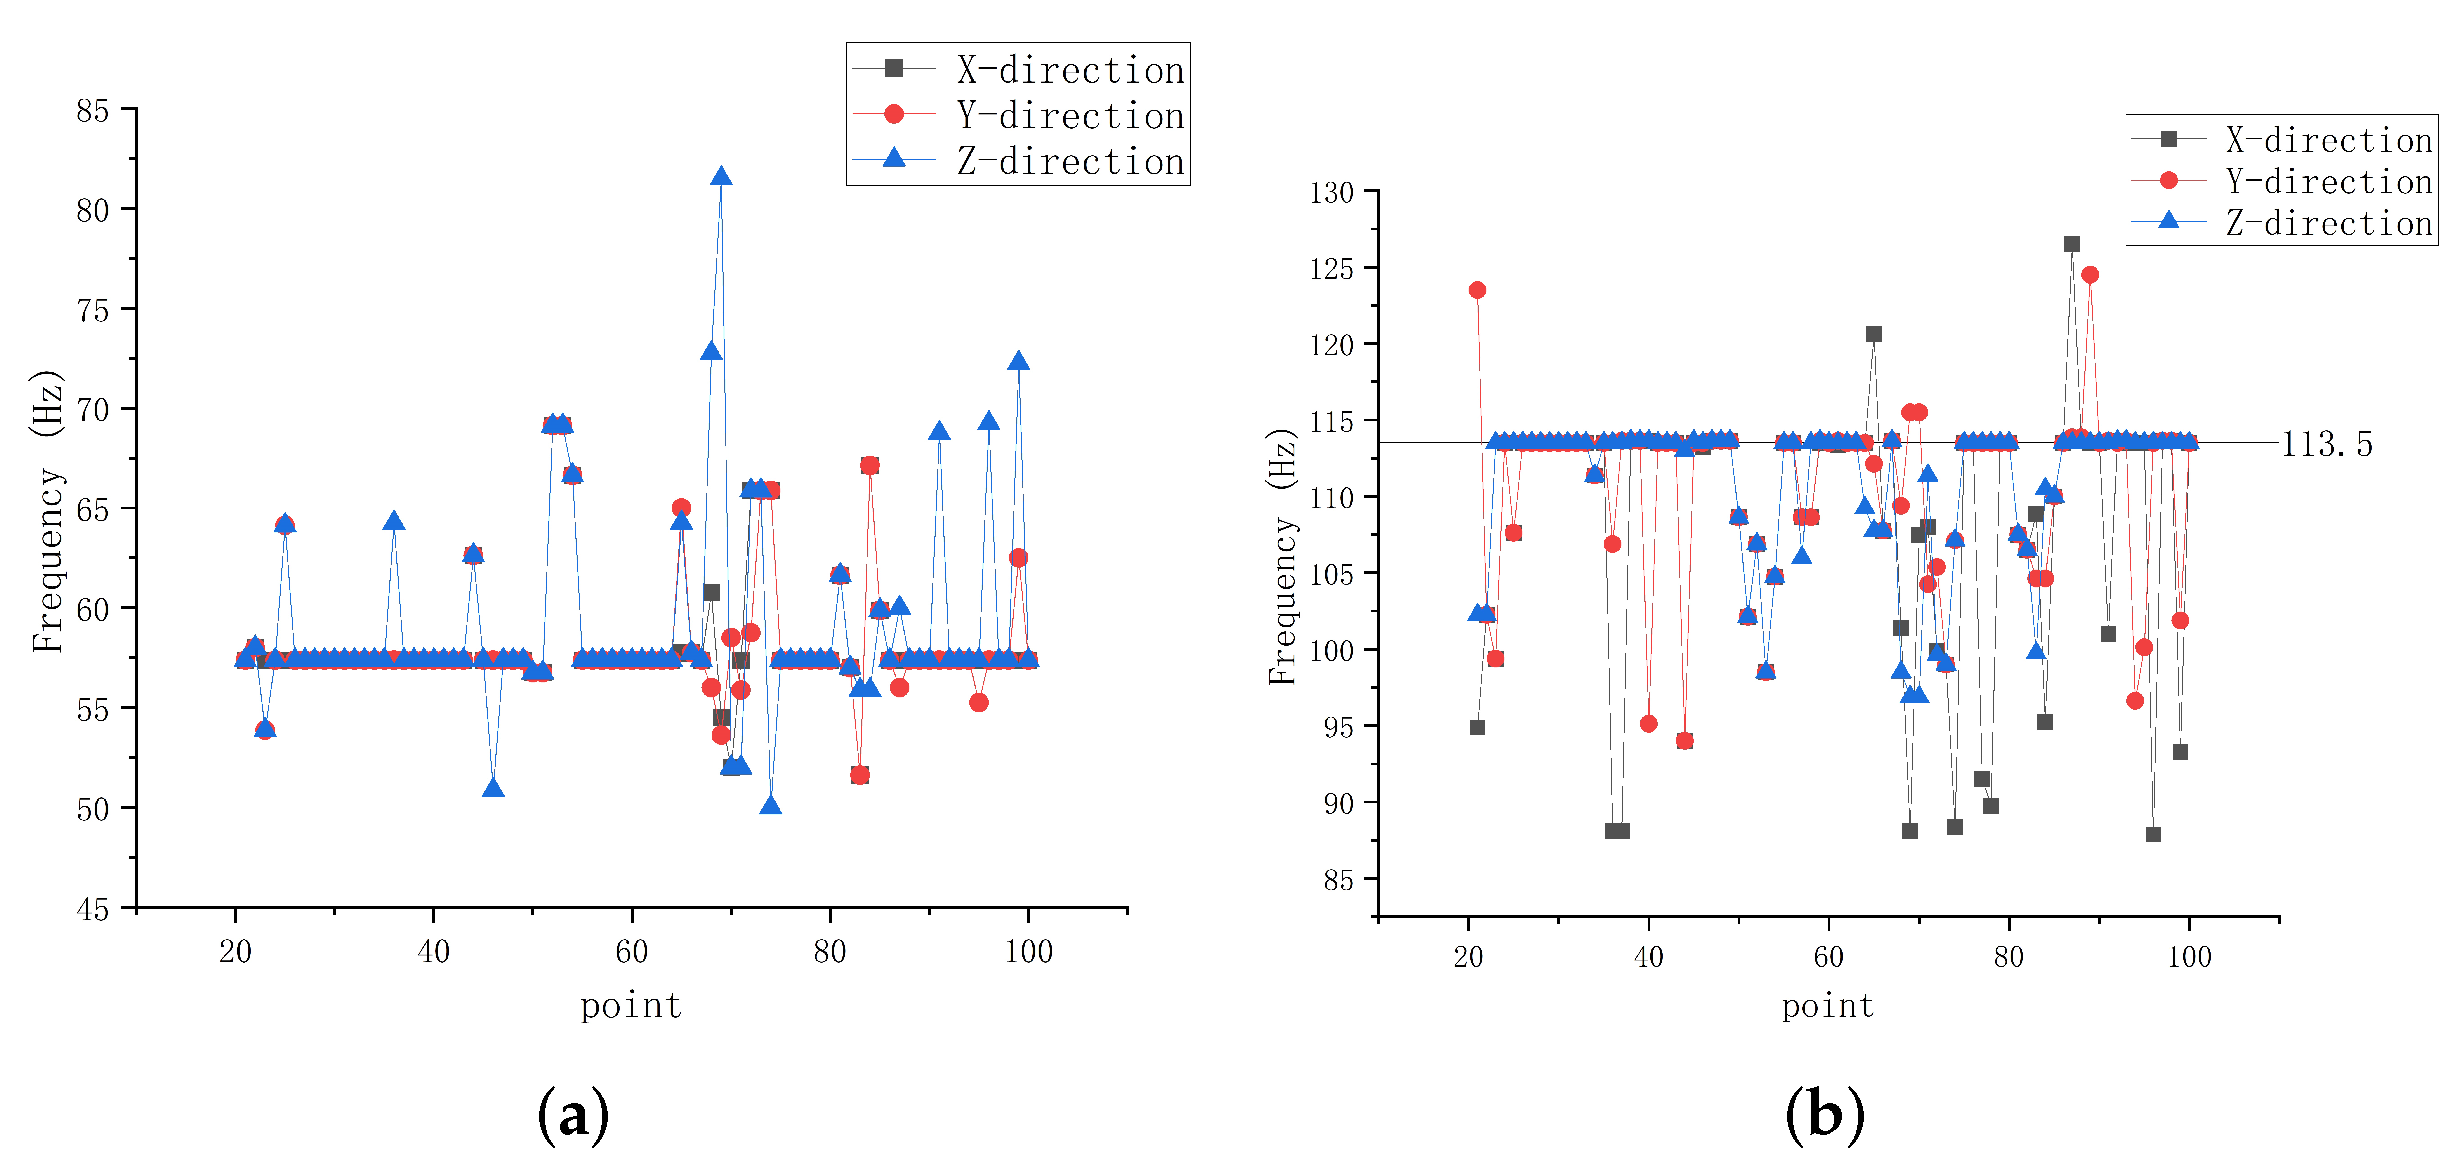
Figure 15 is a plot of the amplitude and frequency characteristics of the 60th point in three directions, from which it can be seen that there are two possible characteristic frequencies: 57.38 Hz and 113.5 Hz. To prove that this is not an exception, the amplitude and frequency of the 80 points are counted separately.
As can be observed in
Figure 16, the statistical results show that natural frequencies with peaks of 57.38 Hz and 113.5 Hz are present at most of the 80 points at the same time. However, by comparing the results with those of the high-precision laser displacement sensor and the contact sensor method, the approach value was found to be 113.5 Hz. Here, as 57.38 Hz is half of 113.5 Hz, it is reasonable to assume that 57.38 Hz is one-half the frequency of 113.5 Hz and that the phenomenon may be generated by the influence of the internal rotor of the engine.
Finally, by comparing the results above, the following table was obtained.
As shown in
Table 1, this represents the natural frequencies of the vibration of the turbofan engine pipeline measured using four different methods. The results obtained from the binocular vision measurement are derived from other experimental results presented in this paper and are equally reliable. From the table, it can be observed that the measurement results based on structured light and laser displacement methods are the closest to each other because these two methods do not affect the inherent structure of the engine pipeline. The binocular vision method, which applies marker points on the surface of the pipeline, yields slightly different results from the first two methods. The acceleration sensor, with a sensor of approximately 65 g attached to the pipeline, exhibits the largest difference compared to the high-precision laser displacement sensor used as a reference. This is because the attached sensor changes the mass of the pipeline, thereby affecting the natural frequency of the engine pipeline. Overall, using the high-precision laser displacement sensor measurement value of 113.3 Hz as a reference, the structured light method can obtain more accurate measurement results. In addition, compared to the laser displacement sensor method, the structured light projection measurement method is more suitable for the working conditions of the engine in terms of measurement range.
4.3. Modal Shape
Through the above analysis, we can observe that the first natural frequency of the engine pipeline is about 113.5 Hz. The theory of amplitude analysis tells us that the amplitude corresponding to the same frequency obtained at each point of the structure after the FFT variation reflects the structural vibration pattern corresponding to the point in that part of the structure. Therefore, this paper can also reflect the modal vibration pattern of engine pipes by comparing the amplitude of each point at 113.5 Hz. After FFT, the amplitude state of each point at 113.5 Hz is related to the modal shape of the pipeline itself, and thus we can directly analyze and calculate the amplitude data of 1–100 points.
The abscissa in
Figure 17 is the serial number of the point, and the ordinate is the corresponding amplitude parameter of the point after FFT transformation, which is merged into the whole coordinate system and can correspondingly reflect the situation of the turbine engine surface pipeline. This paper therefore explains the actual parameters of the turbine engine.
It can be seen from
Figure 18 that when the resonance frequency of the pipeline of the turbine engine is 113.5 Hz, the vibration amplitude of the bent pipe is much higher than that of other parts. In the straight pipe part, the amplitude at the middle point 60 is also higher than that in other parts of the straight pipe. The model represented by the amplitude theoretically corresponds to the mode shape of its modal parameters, so the modal analysis can be carried out on the data of the straight pipe. Here, the Ibrahim Time Domain (ITD) method is used for modal analysis, and the data of 10 points with the same interval from the 21st to the 100th points are put forward for data analysis. The theoretical model references Wang’s approach and the reliability of this solution is verified by this algorithm [
25].
Based on the measurement data from point 21 to point 100, the ITD method can be used to determine the modal parameters. The ITD method is a technique that employs the time domain signals of displacement, velocity or acceleration of the structural free vibration response to determine the modal parameters. In the experiment outlined in this paper, we selected data from 10 points through data fitting, obtaining modal frequency and corresponding modal shape data. During measurement, only one second of data can produce the corresponding modal shape.
As shown in
Figure 19, the modal amplitude data of the engine ducts were obtained. The modal vibration patterns obtained by this method are compared with the previously obtained amplitude parameters and the trend after placing them in the same coordinate system and normalizing them is shown in the following figure:
Comparing the graphs, it can be observed that the amplitude spectrum tends towards a sinusoidal trend when the 60th point is not considered. Additionally, as illustrated in
Figure 20b, by uniformly selecting 10 points from the 80 points and comparing them with the ITD method, it can be demonstrated that the two vibration modes are similar. Therefore, it can be inferred that the modal vibration of the engine pipeline measured in this paper conforms to the reference vibration mode obtained by the ITD method, which proves the reliability of the proposed method. During the process of establishing the vibration mode using the amplitude method, it was discovered that the vibration amplitude of the turbofan engine bend pipe was significantly higher than that of other components. This suggests that this component is more prone to failure compared to others.


