Communication

Evaluation of Renal Ischemia–Reperfusion Injury Using Optical Coherence Tomography Based on Fractal Dimension

1
College of Physics and Information Engineering, Minnan Normal University, Zhangzhou 363000, China
2
Key Laboratory of OptoElectronic Science and Technology for Medicine of Ministry of Education, College of Photonic and Electronic Engineering, Fujian Normal University, Fuzhou 350007, China
*
Authors to whom correspondence should be addressed.
Photonics 2023, 10(7), 741; https://doi.org/10.3390/photonics10070741
Submission received: 30 April 2023 / Revised: 15 June 2023 / Accepted: 26 June 2023 / Published: 28 June 2023

Abstract

:
Renal ischemia–reperfusion (IR) is inevitable in partial nephrectomy and kidney transplantation. Acute tubular necrosis (ATN) induced by renal IR causes the loss of functional units in the kidney, pathologically presenting as the nonhomogeneous distribution of normal uriniferous tubules and usually used to characterize kidney activity. Optical coherence tomography (OCT) has been proven to have the ability to image the kidney microstructure in vivo and in real time. However, a fast image analysis method is needed for clinical application purpose. In this work, a new method for assessing renal IR injury was developed using a fractal-dimension-based texture of the OCT kidney image. Thirty-five Wistar rats were divided into seven groups for renal ischemia–reperfusion: control and various ischemia-time groups. A time series of 3D OCT kidney images was obtained. We calculated the fractal dimension (FD) of OCT en face images and found that the value increased gradually and finally became stable after 90 min of reperfusion. The stable value in the long-ischemia-time group was smaller than that in the short-ischemia-time group. The FD value of the OCT kidney image was highly responsive to renal IR injury. The proposed method is promising for a fast diagnostic application.

1. Introduction

Optical coherence tomography (OCT) is a non-invasive optical imaging technique published by David Huang et al. in 1991 [1]. Similar in principle to ultrasonic pulse–echo imaging, OCT uses an interferometer to locate scatterers in tissue by measuring time-gate light pulses. By employing a broadband light source, the axial resolution of OCT can achieve several microns or even submicron. Two-dimensional and three-dimensional imaging is realized via a pair of mutually orthogonal scanning galvanometers. Therefore, OCT has the ability to visualize architectural morphology in organs and tissues. OCT can be interfaced with endoscopes or laparoscopes. The development of full-field OCT [2], functional OCT [3,4,5,6] formed by Doppler, or speckle variance or other algorithms, has further broadened its applications. In the biomedical field, the applications involve ophthalmology [7,8], cardiology [9,10], dermatology [11,12,13], gastroenterology [14], urology [15,16,17], and oncology [18,19].
Due to the difference in optical coefficients, the backscattered signal of the renal tubules is lower than that of the surrounding tissue. On this basis, OCT has been proven to have the ability to non-invasively visualize the renal microstructure in vivo and in real time. Chen et al. published the initial study on OCT imaging of the kidney in 2007 [15]. More researchers have also used OCT to image pathological changes caused by renal disease [20,21,22,23,24,25,26,27]. In the event of renal surgery, such as nephrectomy, carcinoma resection, or kidney transplantation, renal ischemia–reperfusion is an unavoidable biological reaction. The restoration of blood flow is likely to result in irreversible damage to the nephrons, known as ischemia–reperfusion injury, when the artery is obstructed for an extended period of time. Proximal uriniferous tubule is the part that is most sensitive to ischemia. The primary cause of acute renal injury in clinic is acute tubule injury (ATN), which may rapidly deteriorate the kidney and even cause kidney failure. In previous studies, we used OCT to take a time series of images of rat kidneys during ischemia–reperfusion [28]. Significant changes in tubule density and diameter were observed during IR. Renal activity can be assessed based on these indicators. Distribution of uriniferous tubules in cross-sectional and en face OCT images is uneven due to partial necrosis of renal tubules, which have lost their normal low-signal features. Analyzing the uniformity of tubule distribution in OCT images can help determine the extent of the renal ischemia–reperfusion injury.
The textured surface of a natural scene is intrinsically complex and basic shape primitives are not sufficient to represent it. In 1975, Mandelbrot introduced the fractal dimension (FD) to describe the degree of irregularity of natural phenomena [29], thus laying the theoretical foundation of fractal geometry. FD specifies the space to be filled by the fractal set [30]. As a result, it illustrates the irregularity, roughness, and complexity of a fractal set. Researchers are interested in fractal-based image analysis, which is utilized to address various issues in natural sciences. Fractal dimension has been extensively applied in the fields of shape recognition [31], ecology [32], image segmentation [33,34], complex network analysis [35], biometrics [36], medicine [37,38,39], face image fusion [40], and so on.
Based on the time series of OCT images of the rat kidneys during ischemia–reperfusion, in this paper, the feasibility of employing fractal dimension to assess renal ischemia–reperfusion injury by measuring the uniformity of renal tubular distribution in OCT images was evaluated.

2. Materials and Methods

2.1. Animal Protocol

Male Wistar rats (n = 35, 250 ± 20 g, 8 weeks) were provided by Shanghai SLAC Laboratory Animal Co., Ltd., Shanghai, China. All rats were regularly fed with water and rat fodder. The animal protocol was approved by the Committee of Animal Care and Use in Fujian Normal University, China.
Thirty-five Wistar rats were imaged in this study. Five rats served as normal controls, and thirty rats underwent renal ischemia–reperfusion surgery. To evaluate the ability of the proposed method to quantify IR injury, rats in the IR group were separated into 6 subgroups (5 rats per group), and the blood supply was restored after 20, 30, 40, 50, 60, and 90 min of ischemia in each group, respectively. For simplicity’s sake, the groups were labeled as Normal, I20, I30, I40, I50, I60, and I90. The animals were anesthetized with isofluorane during the induction and maintenance procedures (induction: 80% oxygen, 5 mL/L isoflurane; maintenance: 80% oxygen, 1.5 mL/L isoflurane). Following induction, the left kidney was exposed from the lower back, then placed and fixed on a kidney cup directly beneath the OCT probe. Using a bulldog clamp, the renal arteriovenous ligation was performed to induce renal ischemia. The kidney would gradually turn darker before turning atropurpureus. After temporarily obstructing the blood flow, the bulldog clamp was released to restore blood supply to the kidney. After reperfusion, a time series OCT imaging was performed on each and every rat kidney. The animals were euthanized after the completion of the experiment.

2.2. OCT Imaging of the Rat Kidney

A spectral domain OCT (GAN520C1, Thorlabs Inc., Lübeck, Germany) was used in this study, with a broadband light source centered at 900 nm, as schematically illustrated in Figure 1. The axial and lateral resolutions of this system are 2.7 and 4 μm, respectively. The system operates at a scanning rate of 76 kHz with an output power of about 10 mW.
Three-dimensional sequential OCT images of each kidney were obtained to examine renal ischemia–reperfusion injury. Before vessel ligation, an OCT image of the normal kidney with sufficient blood supply was collected in each individual rat as a baseline. Then, a vessel ligation was performed to the kidney. The length of the ligation was determined by the group. Different groups had varying ischemia durations. For example, group I20 underwent a 20 min ischemia. When the bulldog clamp was removed, OCT images were obtained at 5, 10, 20, 30, 40, 50, 60, and 90 min after blood reperfusion. The same imaging process was repeated for the same group of rats.
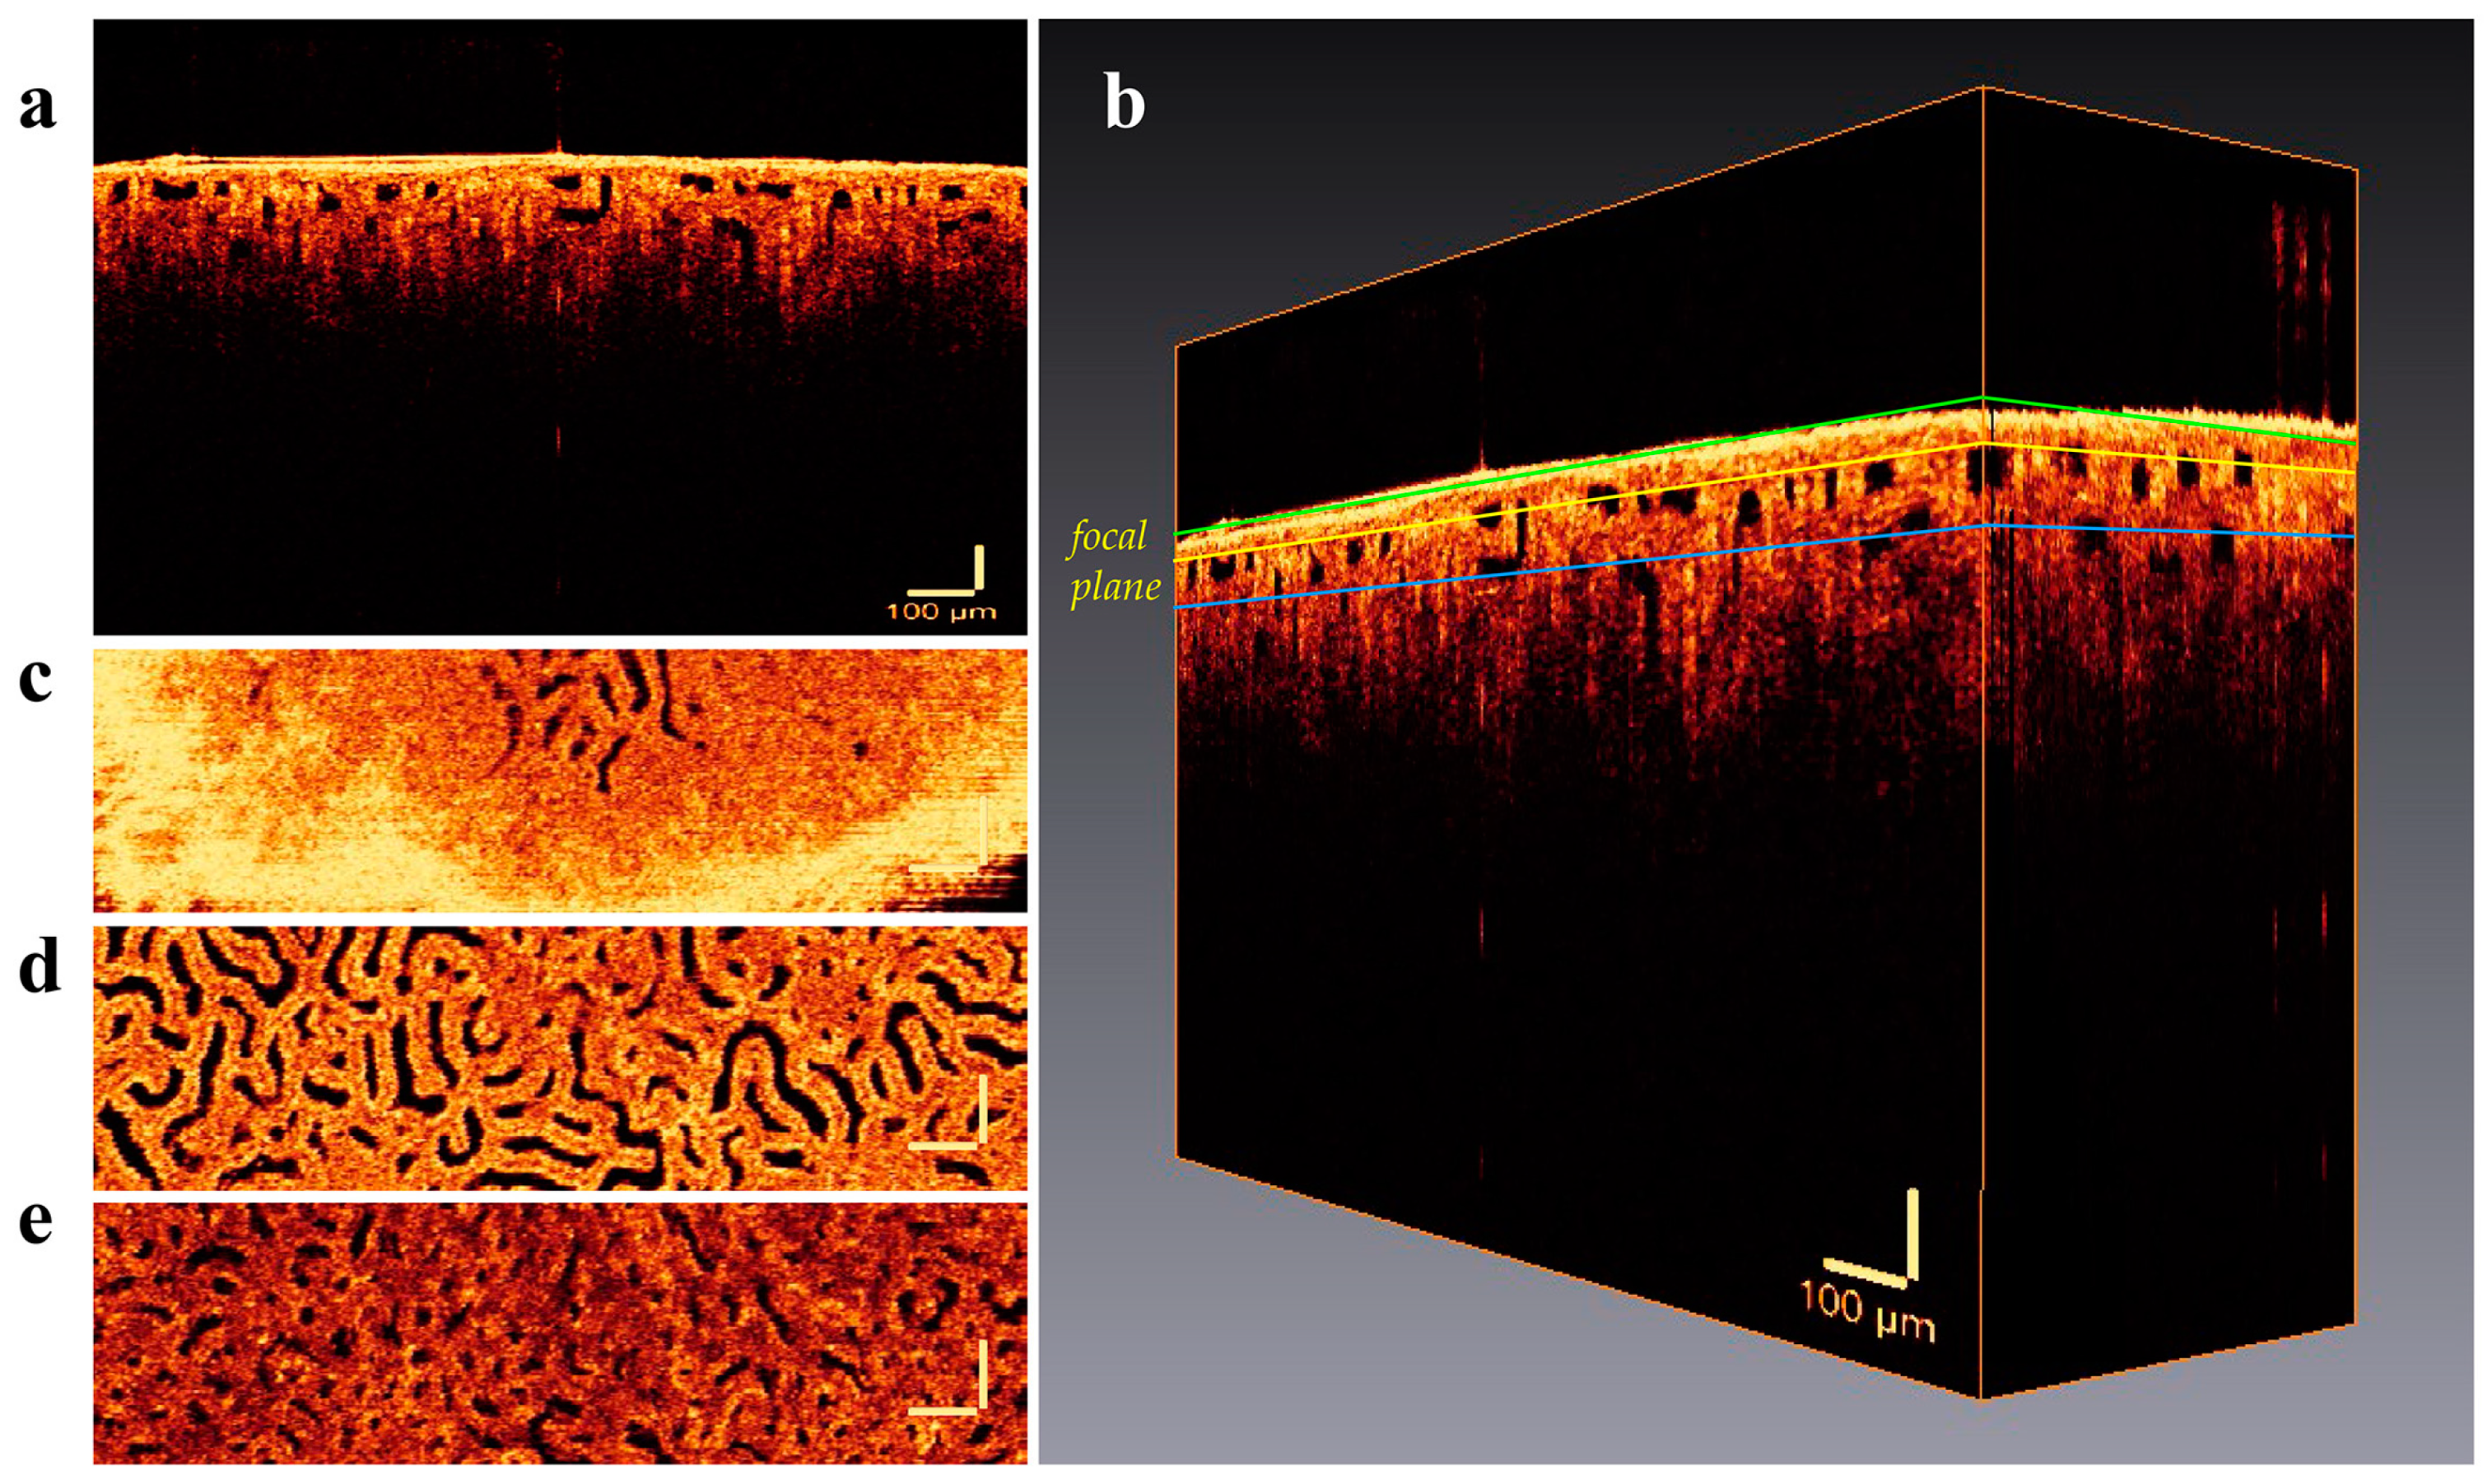
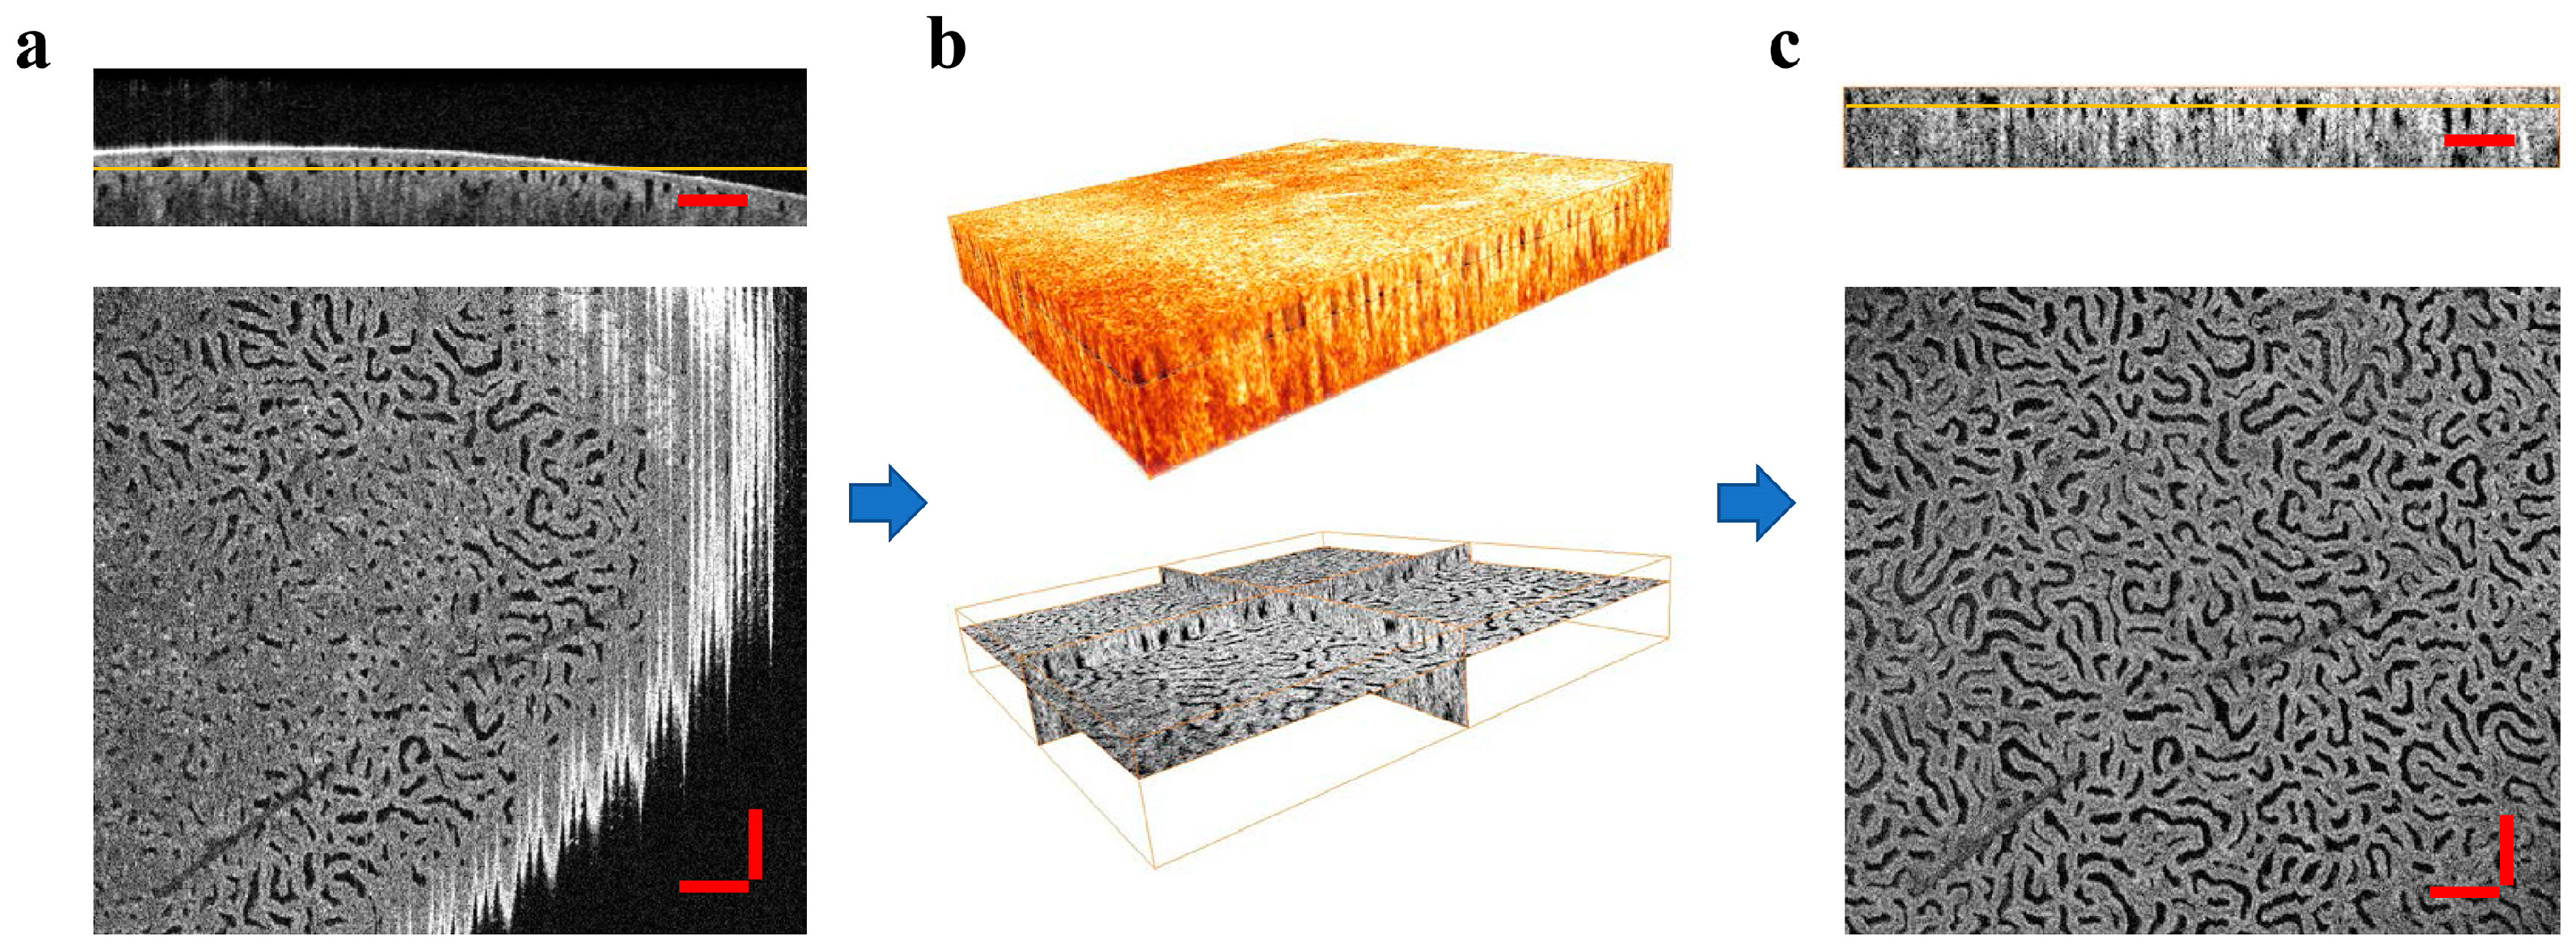
Two-dimensional and three-dimensional imaging is realized via a pair of mutually orthogonal scanning galvanometers. The scanning of the X galvanometer yields the cross-sectional OCT image of normal Wistar rat kidney (XZ plane), as shown in Figure 2a. The typical tubular structure, represented as a low-signal area below the capsule, can be clearly observed from the cross-sectional image. A three-dimensional OCT image is reconstructed from a series of cross-sectional images obtained by the scanning of the Y galvanometer. From a 3D OCT image (Figure 2b), OCT en face images (XY plane) can be extracted (Figure 2c). In the experiment, every single OCT 3D image was taken at a size of 2 mm × 2 mm × 2.5 mm (X × Y × Z), with 1000 × 1000 × 1024 pixels.
Since the surface of the kidney was curved and the objective lens has a limited depth of focus (DOF), the OCT en face images out of the focal plane were obscure and lacked detail. Figure 2d shows an en face image of rat kidney at the focal plane. Figure 2c,e were taken from 50 μm above and 100 μm below the focal plane, respectively. To evaluate IR injury using OCT images with clear and useful information, the 3D image surface must be flattened and focal plane images extracted.

2.3. Fractal Dimension Calculation of OCT Image

The calculation of fractal dimension using differential box counting (DBC) is fast and easy to compute. The number of boxes required to completely cover or fill a fractal set determines the DBC, which is dependent on the box dimension of the fractal set. If the scale of the studied two-dimensional image is recorded as unit 1, a number of boxes with scale r ( r 1 ) are applied to cover the image and count the number of boxes containing target pixels. In our study, the target pixel refers to the pixel corresponding to the uriniferous tubule. Count the quantity of boxes N r that contain the target pixels while decreasing the box side length r until the mesh size approaches a pixel. Then, D f is called the fractal dimension of the fractal set if it satisfies Equation (1) [41].
N r = ( 1 r ) D f         a s       r 0
Equation (1) can also be expressed by Equation (2).
lim r 0 [ N r / ( 1 r ) D f ] = k
where k is a positive constant. To obtain the value of D f , a logarithm is introduced on both sides of Equation (2). When the denominator becomes infinite as r 0 , the final expression for estimating Df is shown in Equation (3), which is obtained by removing the constant term from Equation (2).
D f = lim r 0 [ l o g ( N r ) l o g ( 1 r ) ]
A series of data points ( l o g ( 1 r ) , l o g ( N r ) ) is obtained, and the fractal dimension D f can be calculated by solving the slope of the regression line through these points.
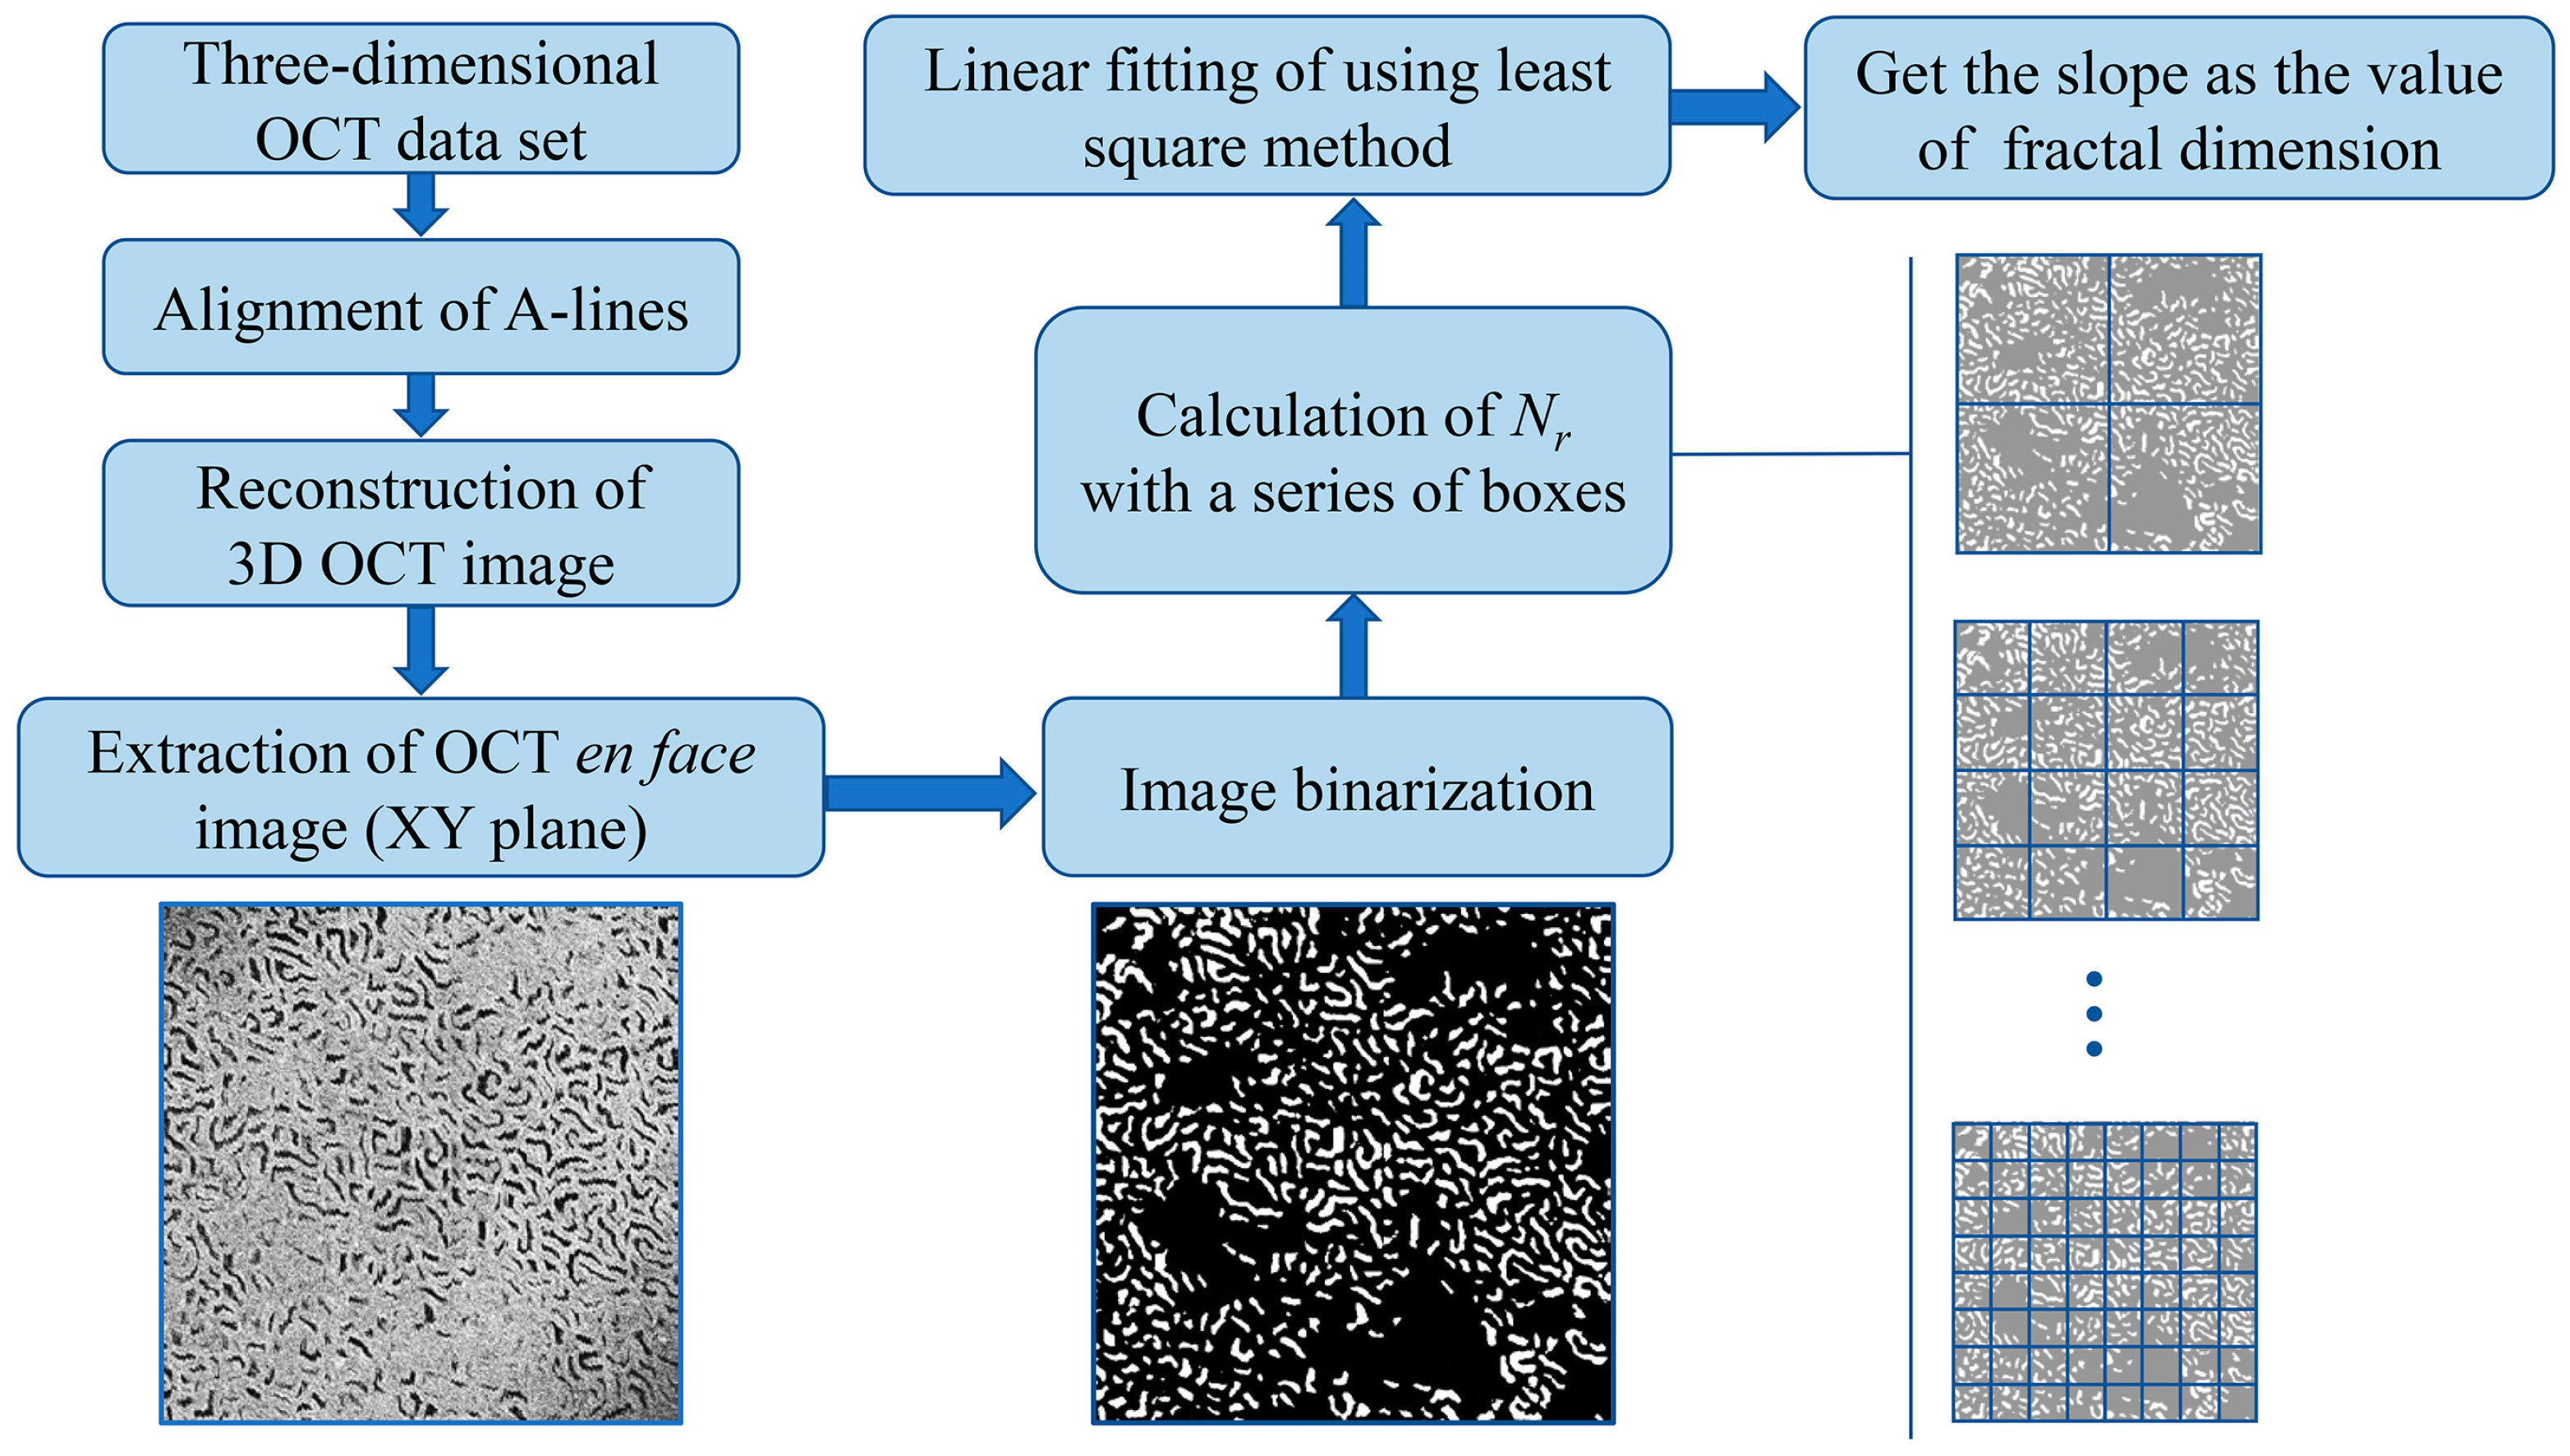
Figure 3 shows the flow chart of solving the fractal dimension of OCT images. Surface flattening of OCT three-dimensional data sets was performed first. OCT en face images at the focal plane were extracted for further analysis. First, the A-lines of each OCT cross-sectional image were aligned. Then, the aligned cross-sectional images were reconstructed to form a new three-dimensional image. Finally, the image at the focal plane was extracted from the 3D image. All operations were completed by MATLAB, except the fractal dimension analysis. Image segmentation using the OTSU algorithm was performed to obtain binarized images, which was helpful to isolate hyporeflective tubular structures. Following that, OCT images were covered with 2 × 2, 3 × 3, 4 × 4, 6 × 6, 8 × 8, 12 × 12, 16 × 16, 32 × 32 and 64 × 64 boxes. Let the OCT image’s side length be a unit. When varying the numbers of boxes that cover the image, the corresponding side length of the box and the number of boxes containing the target pixel N r were determined. After the logarithm was taken, the least squares method was used for linear fitting, and the slope was calculated as the fractal dimension D f of the image. The calculation of fractal dimension using the box counting method was executed using ImageJ in the experiment.

3. Results

Figure 4a,b show a three-dimensional OCT image of a normal rat kidney reconstructed after the alignment of A-lines in cross-sectional images. Figure 4c and Figure 5a depict the en face image taken from the reconstructed 3D image at the focal plane. The en face image shows the uniformly distributed morphological microstructures of renal tubules. Uniformly distributed morphological microstructures of uriniferous tubules are visible in the en face image of the normal kidney.
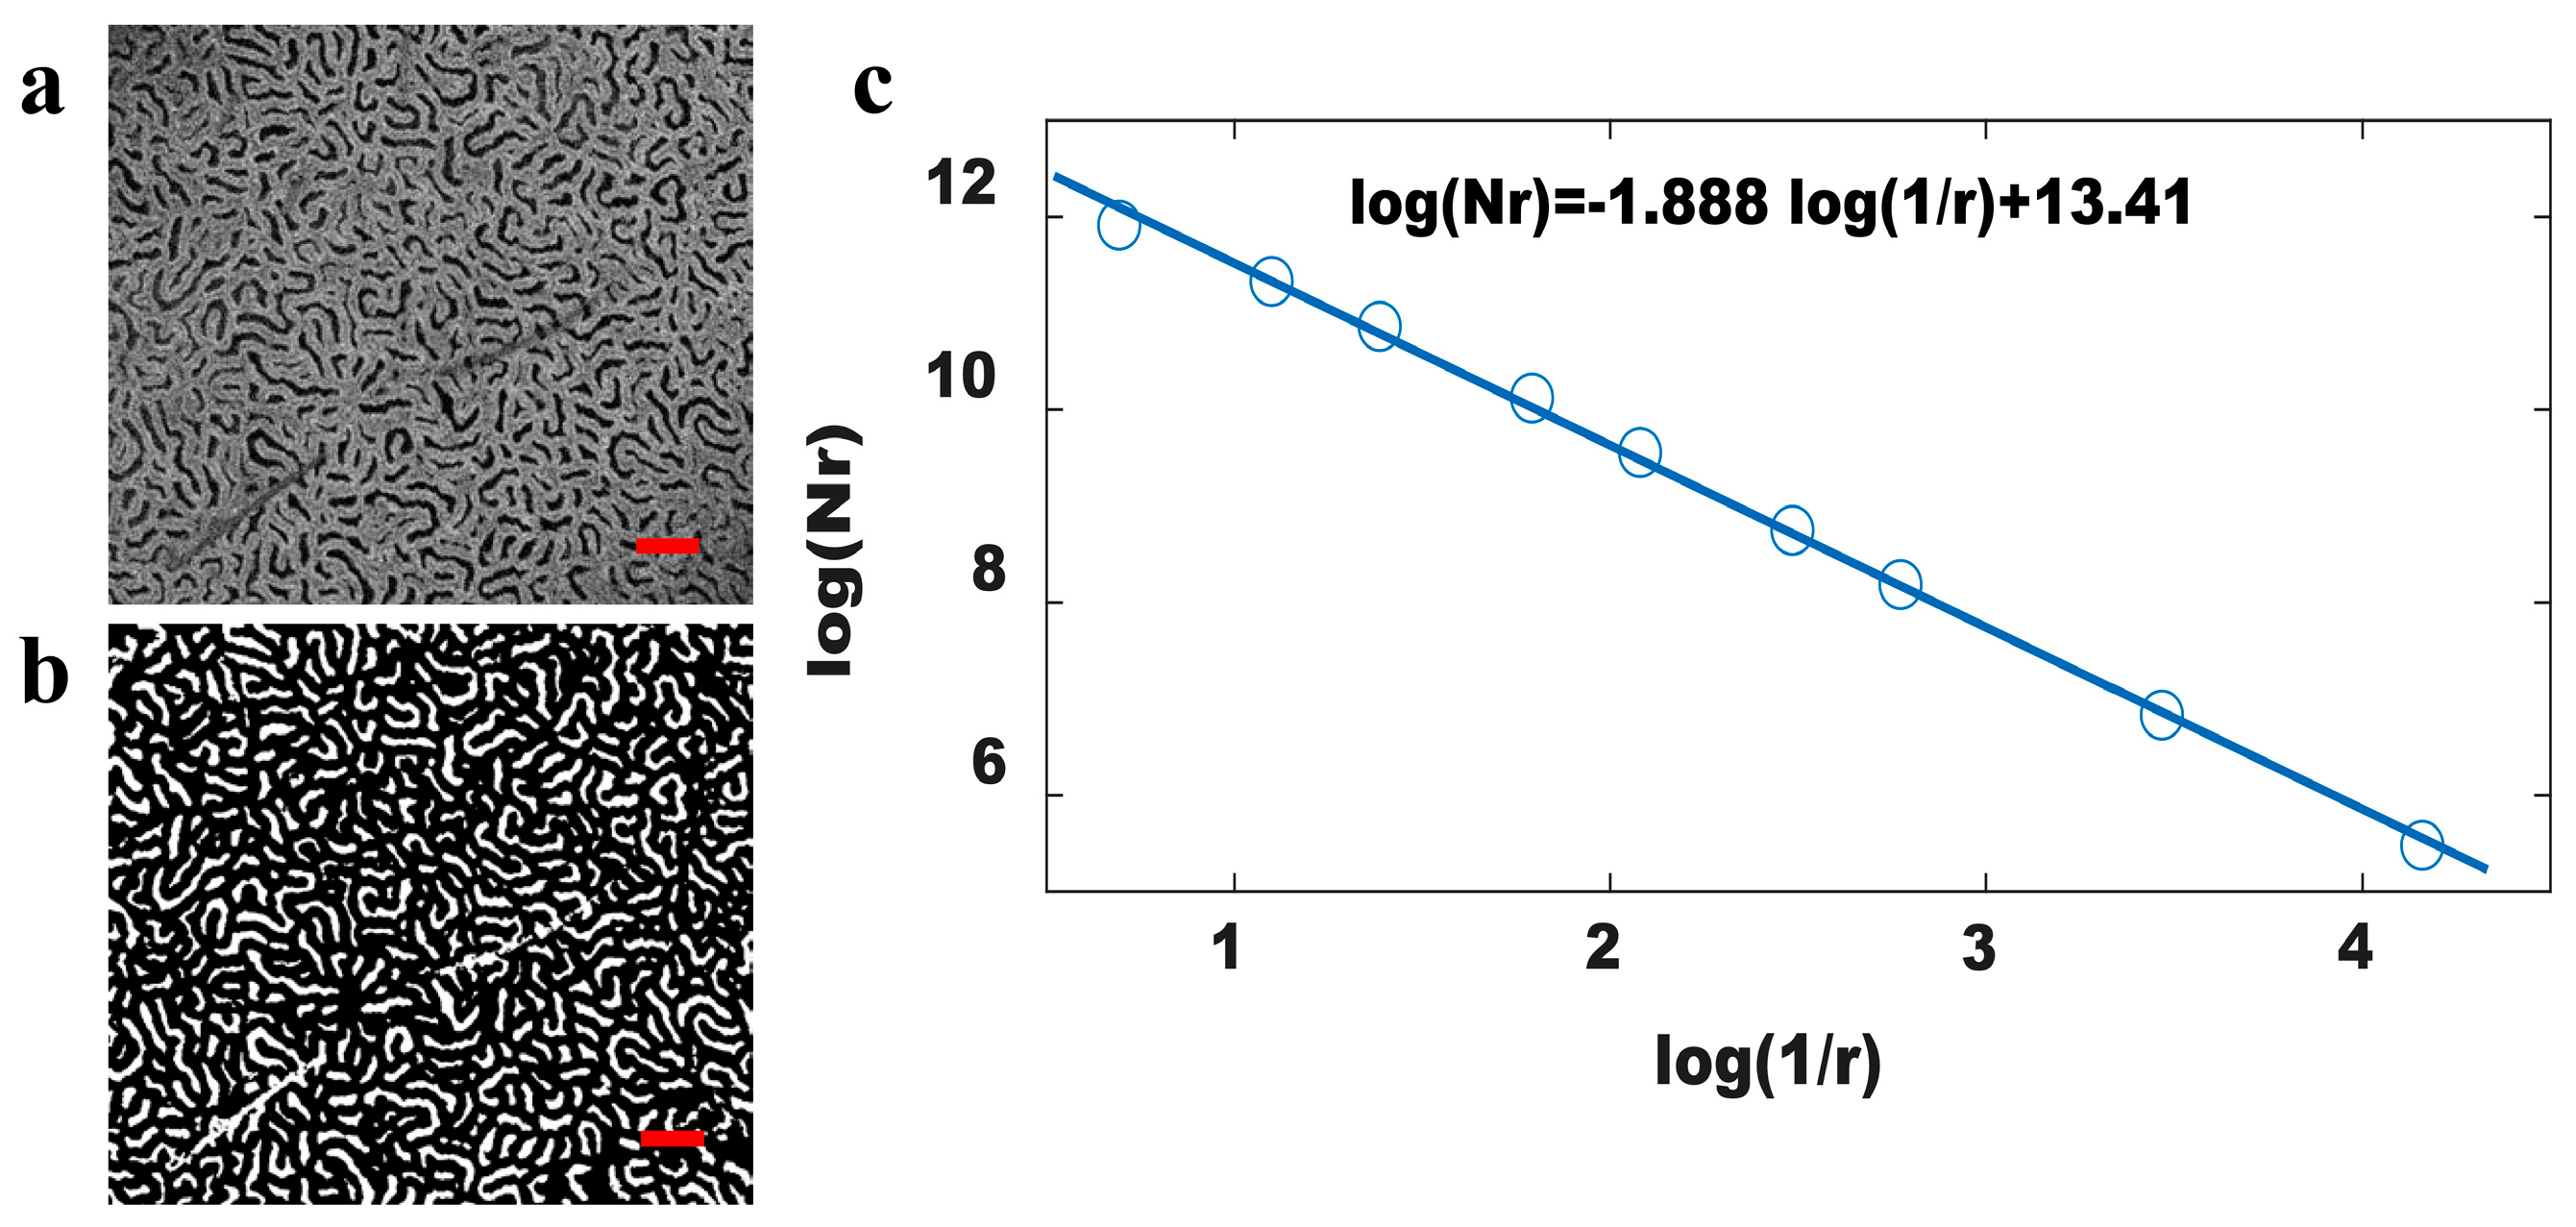
Before calculating the fractal dimension, all the OCT images were binarized. Taking the normal kidney image as an example, Figure 5b shows the binary image of Figure 5a. The feature of uniformly distributed tubules was also exhibited in the binary image. Using the Fractal Box Counter in ImageJ toolbox, 2 × 2, 3 × 3, 4 × 4, 6 × 6, 8 × 8, 12 × 12, 16 × 16, 32 × 32 and 64 × 64 boxes were used to cover the image, then the number of boxes ( N r ) containing tubular pixels was counted. The data points ( l o g ( b o x   s i z e ) , l o g ( N r ) ) were plotted in Figure 5c. Through the least squares method, the linear fitting equation and the slope of −1.888 were obtained. The fractal dimension of the image is the absolute value of the slope of the fitted line, 1.888. The goodness of the linear fit was 0.9983.
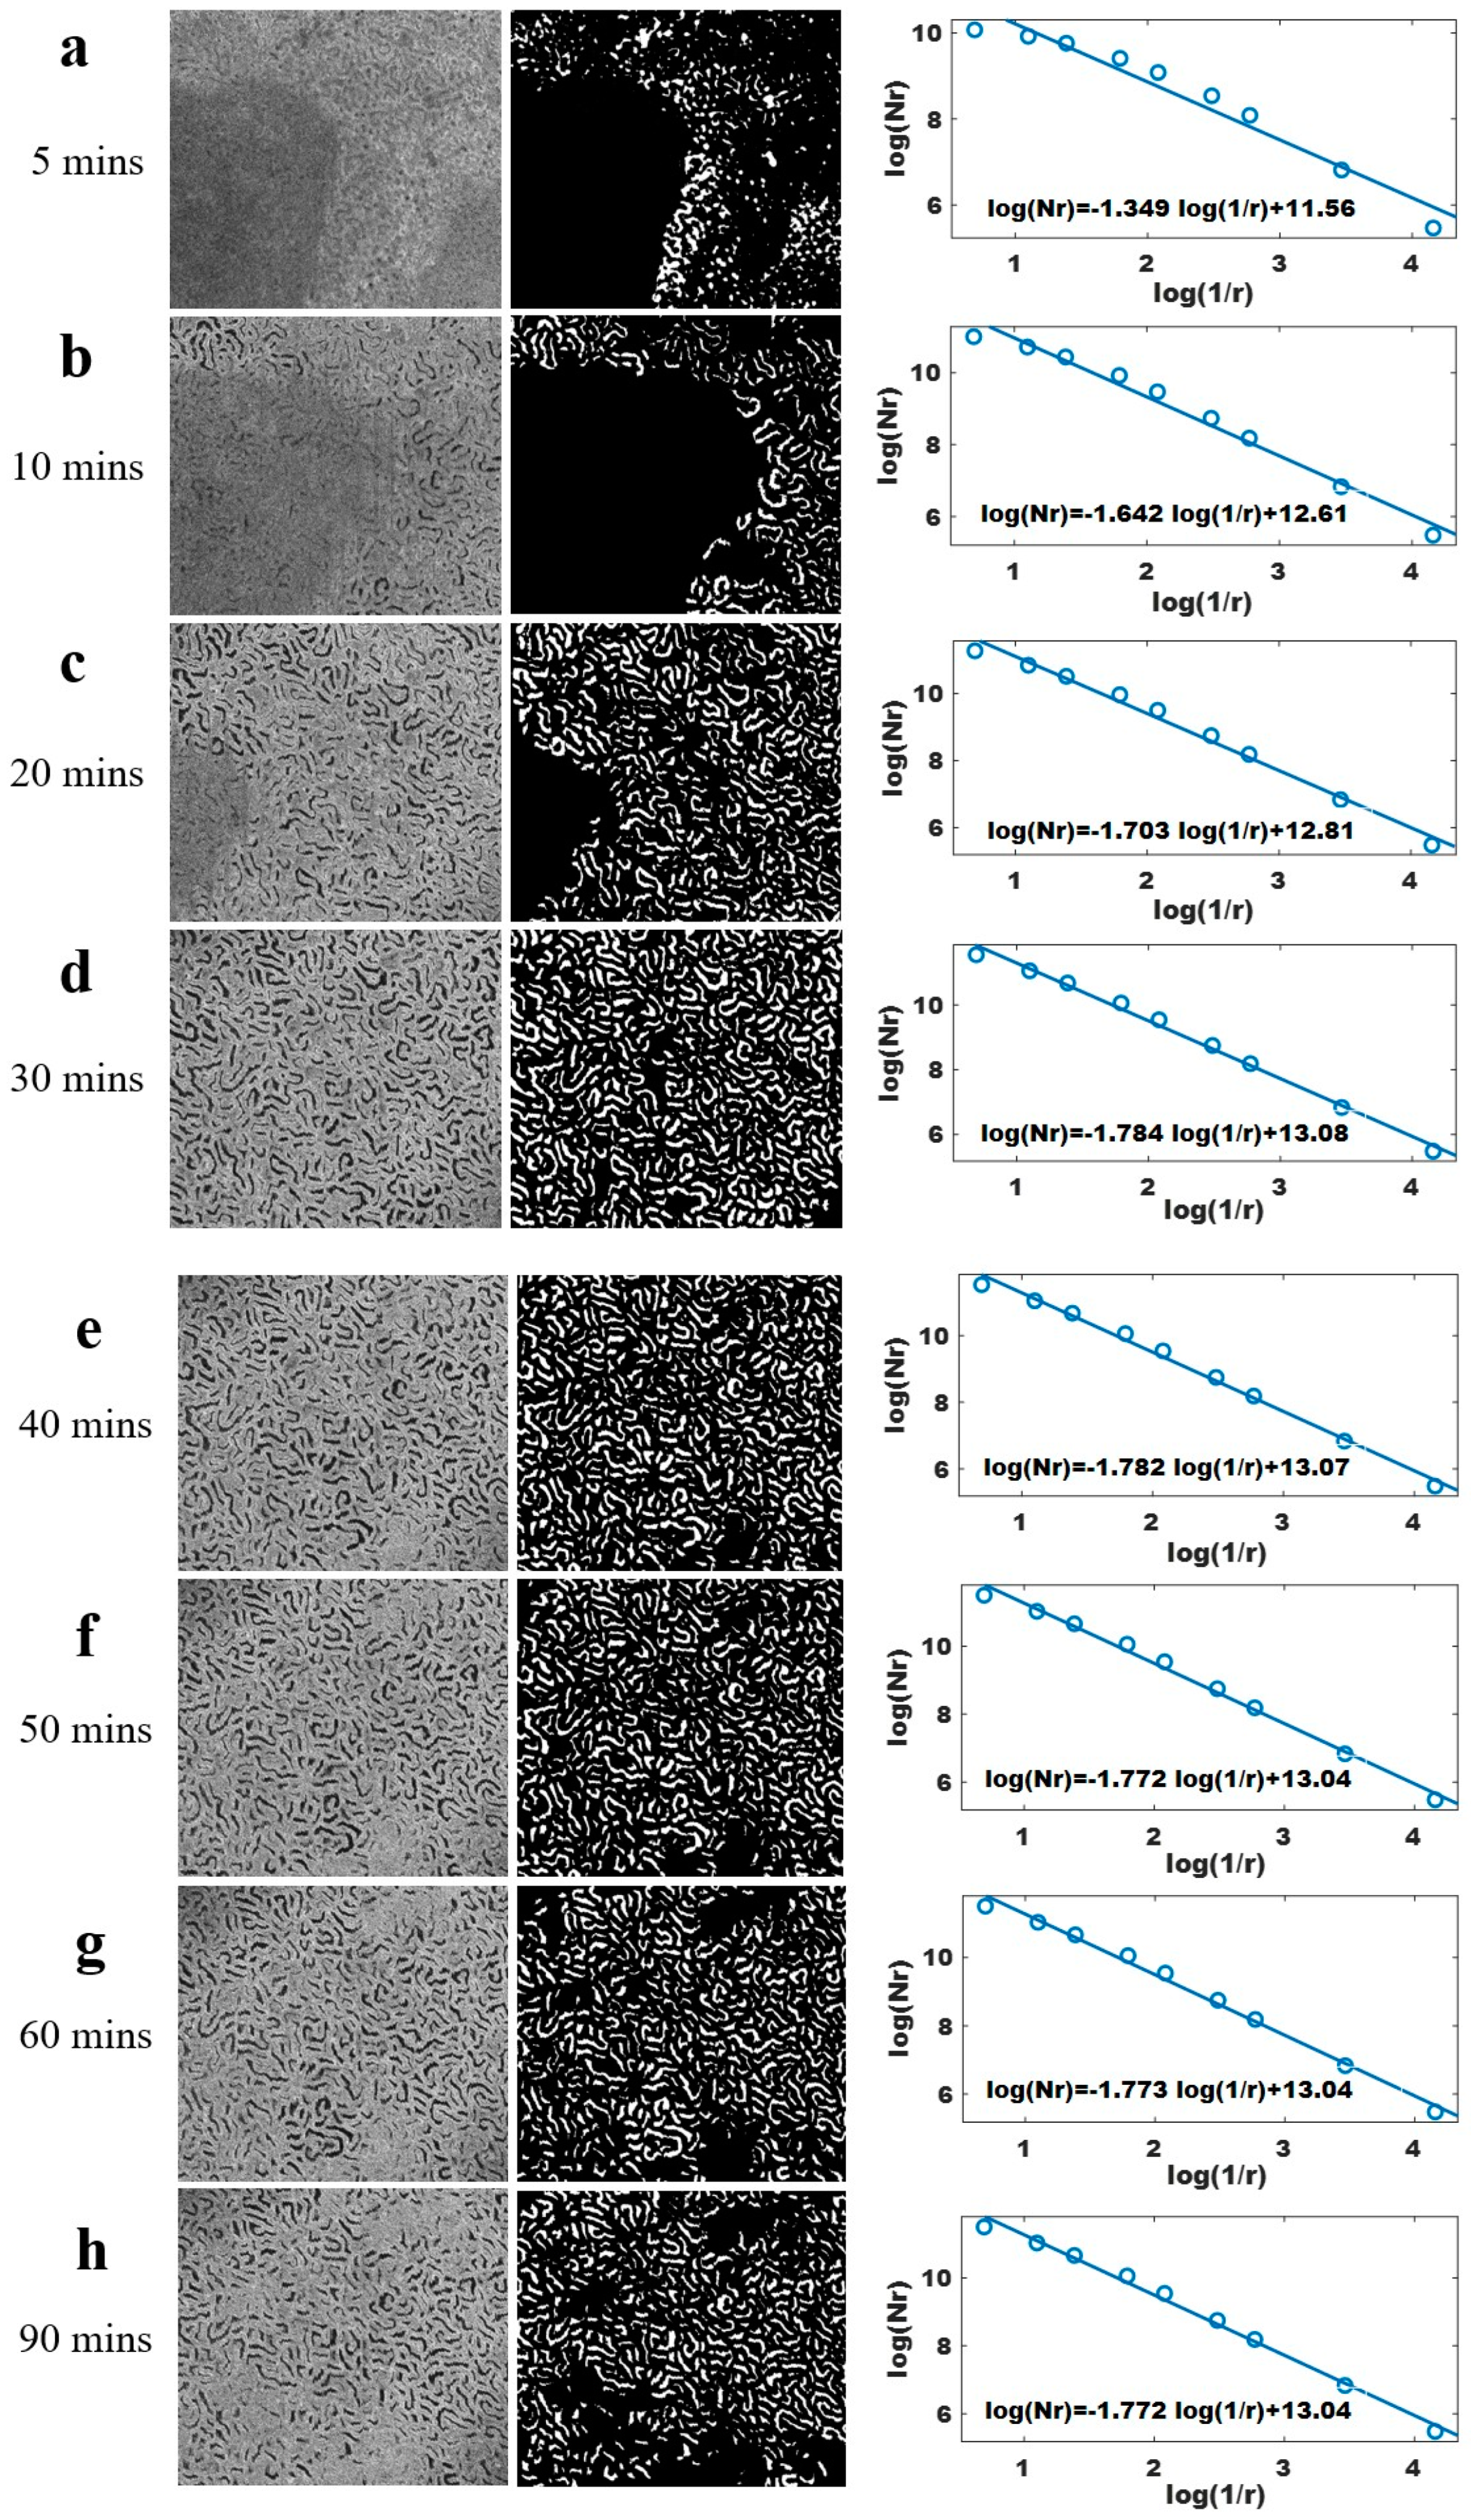
Figure 6 shows the time series OCT images in the group I30. The baseline image for Figure 6 is shown in the en face images of Figure 4c and Figure 5a. As a result of swelling or necrotic shedding of the endothelial cells, the tubular lumen of the uriniferous tubules reduces during renal ischemia–reperfusion. In OCT images, the necrosis tubules lose their typical low-signal features and resemble the tissue surrounding them, as shown in Figure 6. Therefore, these images showed an uneven distribution of tubules. The values of the fractal dimension of these images were calculated and are shown to the right in Figure 6a–h. The fractal dimension of the normal kidney image was the largest. After ischemia, uriniferous tubules can no longer be seen in OCT images, and the fractal dimension reached its minimum value at this time. During reperfusion, blood supply is restored and the renal tubules gradually reopen. Therefore, fractal dimension rose sharply in the first 20 min after reperfusion and reached its maximum at 30 min, as shown in Figure 7. Then, the value drops slightly until it reached a relatively stable value, about 1.772. The fitted y intercept also exhibits a similar shift, increasing with reperfusion and eventually approaching a relatively stable value. However, ischemia–reperfusion damage to some tubules is irreversible. Due to ischemia, partial renal tubule necrosis is not reproduced in OCT images, resulting in the final stable value of fractal dimension not reaching the normal renal counterpart.
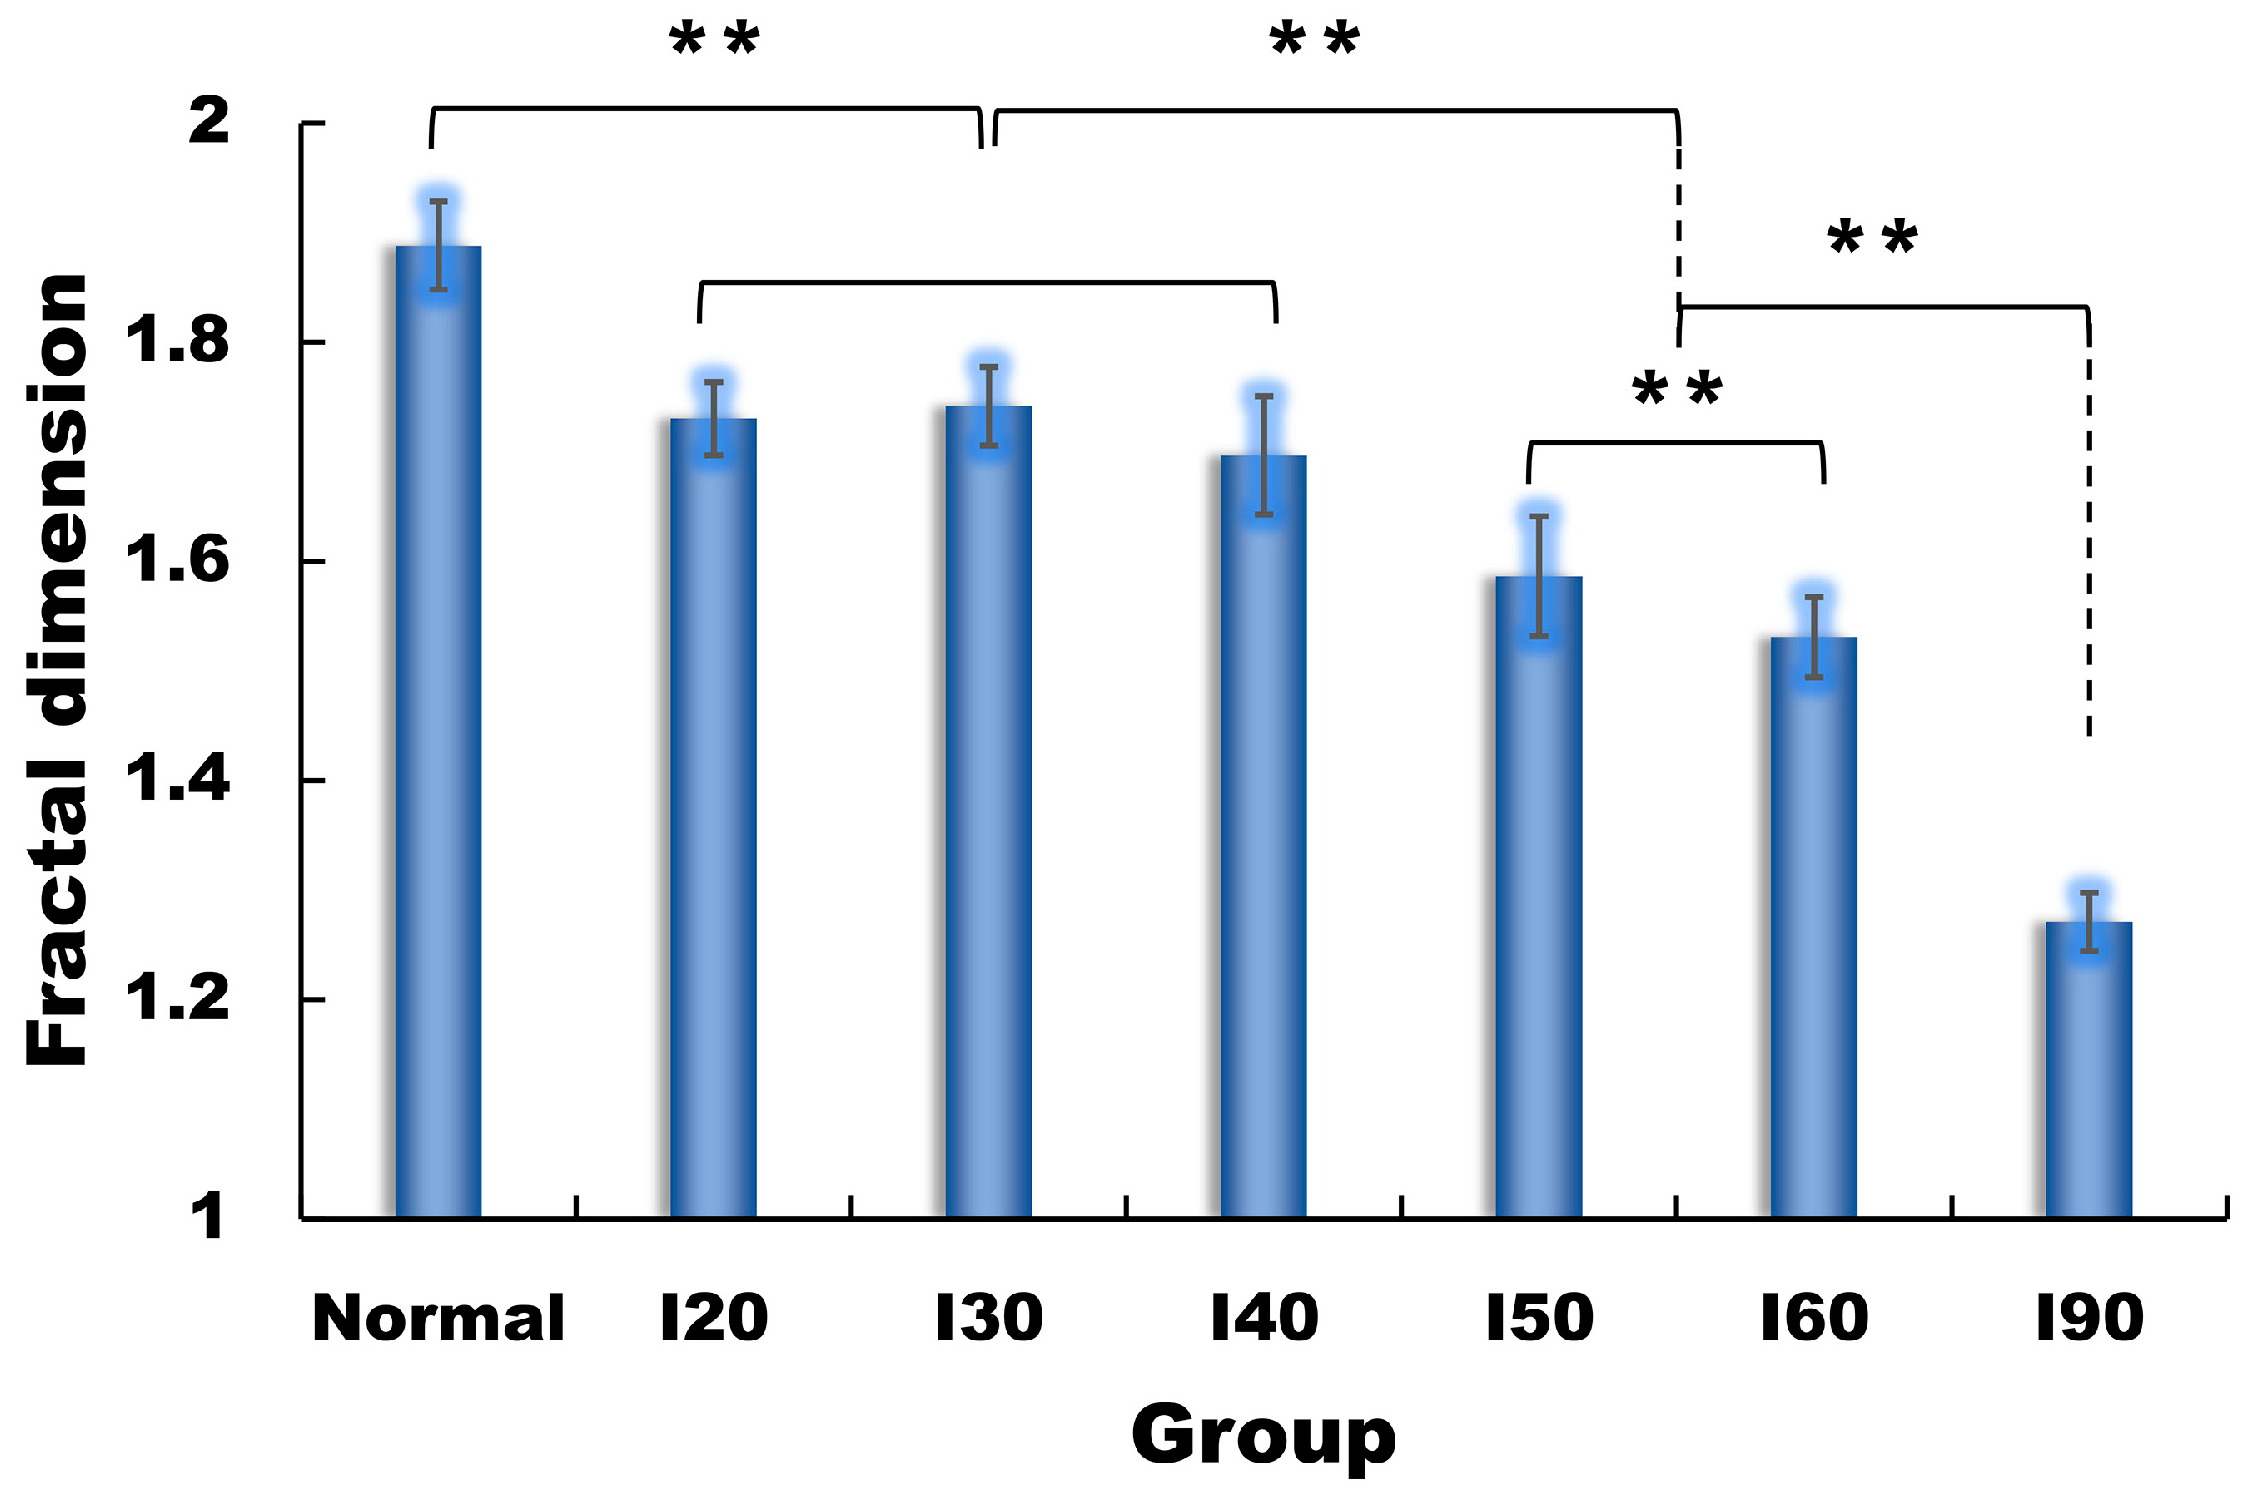
Furthermore, we calculated the fractal dimensions of OCT images of different groups in the experiment. The fractal dimension of the normal kidney was 1.888 ± 0.040. The value represented the mean and standard deviation of 35 rats; 5 from the control group and 30 from the ischemia–reperfusion group (baseline). In the IR group, the mean of the fractal dimension at each time point following 30 min of reperfusion was used to calculate the ultimate stable value for each individual rat. Given the individual differences, the average of the five final stable values from each group was utilized to represent the typical value of the fractal dimension following IR in this group. The FD values for each IR group are listed in Table 1 and shown in Figure 8. The results showed that the longer the ischemia time, the smaller the fractal dimension of the image after reperfusion, indicating that there are more damaged uriniferous tubules. There were very significant differences in FD between normal kidneys and IR kidneys (t-test, p < 0.001). However, in the short-term-ischemia group, we found no significant difference in FD values in the I20, I30, and I40 groups (p = 0.329 between I20 and I30, p = 0.122 between I30 and I40). There was a significant difference between the two groups for 50–60 min of ischemia (p = 0.0006), and highly significant difference between groups I60 and I90 (p = 1.47 × 10⁻⁸). There were significant differences among the normal control group, the I20–I40 group, the I50–I60 group, and the I90 group (p < 0.001). The results indicated that the fractal dimension was highly sensitive to IR injury. Based on this, fractal dimension can be an indicator used to evaluate the degree of ischemia–reperfusion injury.

4. Discussion

OCT enables in vivo, real-time imaging of the kidney. The histomorphological microstructure of the kidney exhibited in OCT images can aid in the diagnosis of renal status. In this study, we imaged the rat kidney using a spectral domain OCT. Figure 2 shows the OCT images of a Wistar rat kidney, including the cross-sectional image, three-dimensional image, and an en face image extracted from the 3D one. The microstructure of the kidney can be clearly observed in the images. The bright boundary on the upper surface is the renal capsule, and below the capsule is the superficial layer of the renal cortex. According to the pathological structure of the kidney, the black tubular structure (low backscattering signal) in the OCT image corresponds to the uriniferous tubules. Unlike the study of Yu Chen et al., we could not observe the glomeruli in the images. This is due to the animal strain. The animals we used in the study were not Munich Wistar rats, which have superficial glomerulus with direct contact with the renal capsule.
Proximal renal tubules are extremely sensitive to ischemic response. By designing animal models of renal diseases, scholars have conducted numerous relevant experiments to verify the possibility of OCT imaging in renal clinical diagnostic applications. Yu Chen and Andrews et al. applied OCT to image living kidneys for the first time, and to monitor the structural changes of renal tubules and glomerulus throughout the ischemia–reperfusion, and during intravenous mannitol injection [16]. The results showed that intravenous mannitol can thin the tubular wall and enlarge the diameter of the tubular, which can prevent the tubule contraction caused by the swelling of the proximal renal tubules during ischemia. Onozato et al. [20] studied four human kidneys in vitro. The work predicted the possibility of OCT application in the diagnosis of kidney diseases. Hsing-Wen Wang et al. simulated chronic kidney disease (CKD) with intravenous doxorubicin injection in Munich rats [22,23]. OCT images were obtained at multiple time points during the injection process, and the density and diameter of renal tubules in the images were analyzed for evaluating CKD. Dilated tubules can be observed at 4 to 8 weeks, especially at 8 weeks, with changes in tubular density and diameter due to tubule loss and swelling. The results suggest that, by interpreting histopathological information from images, OCT can be used to monitor age-related progressive nephropathy and to evaluate the status of aging donor kidneys.
In this work, we established a renal ischemia–reperfusion model of Wistar rats and observed the rat kidney using OCT in real time. The rats were separated into different groups for various ligation times, and the degree of IR injury was evaluated by analyzing the microstructure of OCT images. The results showed that tubules are sensitive to ischemia. Ischemia may cause swelling of the tubular endothelial cells, leading to tubule contraction or even necrosis. Therefore, when the kidney is ligated, we cannot see any tubules on OCT images. The tubules in OCT images reopen following reperfusion. However, the shed cells in some tubules would block the lumen after reperfusion, resulting the correspondent tubules no longer visible in OCT images and the uneven distribution of renal tubules.
Researchers use renal tubule density or tubular diameter to evaluate kidney status quantitatively [26,27]. In our previous study, we also used tubule density and tubular diameter to evaluate the IR injury [28]. The indicators of tubule density and tubular diameter are highly response to IR and can be used to access IR injury. However, this method requires a large amount of calculation. Taking tubular diameter as an example, the OCT image should be smoothed and binarized first, and the ROIs (tubular lumens) in the image chosen to further analyze. Skeletons and boundaries of tubules are extracted from the ROIs and used to calculate the diameters. Bohan Wang et al. used ConvNet training (CNN Image Classifier) to classify renal tubules and non-renal tubules, and then quantified the identified renal tubules. This study demonstrated that the developed CAD system can distinguish renal tubules from OCT images and automatically measure the size of coiled tubules [27]. However, the application of automatic quantization algorithm or deep learning has a heavy calculation and certain requirements for computer configuration, such as GPU and computer memory.
In this study, we used fractal dimension to quantify the uneven distribution of renal tubules and further evaluate IR injury. The results indicate that FD is sensitive to ischemia. To verify the ability of FD to quantify IR injury, rats were separated into several IR groups and endured various ligation times. For an individual rat, the FD has a maximum value at baseline (normal kidney), and minimum value during ischemia, following which FD increases rapidly until finally reaching a stable value. Due to the loss of tubules (necrosis), the stable value is always smaller than the baseline. The longer the ischemia time, the smaller the FD value. The statistical analysis results indicate that FD can be used to differentiate IR injury.
Fractal dimension also has its shortcomings. According to its statistical methodology, it is difficult to diagnose a disease from the microstructure of the kidney’s morphology, such as changes in tubular diameter (like an aging kidney). Moreover, the calculation is highly dependent on the image quality and segmentation, and algorithmic improvements should be taken in the follow-up work. However, fractal dimension is suitable for rapid diagnosis because it requires less computation. It can be used in the clinic diagnosis of acute kidney injury (AKI) caused by acute tubular necrosis (ATN) in renal surgery.

5. Conclusions

From a mathematical view point, calculating the fractal box dimension provides a more objective indicator to describe the distribution uniformity of renal tubules. Our results indicate that the application of fractal theory for measurement of distribution of renal microstructures, namely renal tubules, in OCT images can quantify acute kidney injury caused by ischemia–reperfusion and thus can be used to assess local and global renal activity.

Author Contributions

Conceptualization, S.X; methodology, W.G.; software, Y.F.; validation, W.G., Z.H. and S.X.; formal analysis, Y.F.; investigation, Y.F. and L.Z.; resources, W.G.; data curation, Y.F.; writing—original draft preparation, Y.F.; writing—review and editing, Y.F.; visualization, Y.F.; supervision, S.X.; project administration, W.G. and Y.Z.; funding acquisition, Z.H. All authors have read and agreed to the published version of the manuscript.

Funding

This work was supported in part by the National Natural Science Foundation of China (Grant No. 61675044), Natural Science Foundation of Fujian Province (Grant No. 2017J01220), the Special Funds of the Central Government Guiding Local Science and Technology Development (2017L3009), and the Junior Teacher Research Project of Education Department of Fujian Province (Grant No. JAT190379).

Institutional Review Board Statement

Not applicable.

Informed Consent Statement

Not applicable.

Data Availability Statement

The data supporting the reported results can be obtained from the authors upon reasonable request.

Acknowledgments

The authors acknowledge useful discussions with Xiang Wu and Qinjiang Xu.

Conflicts of Interest

The authors declare no conflict of interest.

References

  1. Huang, D.; Swanson, E.A.; Lin, C.P.; Schuman, J.S.; Stinson, W.G.; Chang, W.; Hee, M.R.; Flotte, T.; Gregory, K.; Puliafito, C.A. Optical coherence tomography. Science 1991, 254, 1178–1181. [Google Scholar] [CrossRef] [Green Version]
  2. Xiao, P.; Mazlin, V.; Grieve, K.; Sahel, J.A. In vivo high-resolution human retinal imaging with wavefront-correctionless full-field OCT. Optica 2018, 5, 409–412. [Google Scholar] [CrossRef] [Green Version]
  3. Chen, Z.; Milner, T.E.; Srinivas, S.; Wang, X.; Malekafzali, A.; van Gemert, M.J.; Nelson, J.S. Noninvasive imaging of in vivo blood flow velocity using optical doppler tomography. Opt. Lett. 1997, 22, 1119–1121. [Google Scholar] [CrossRef]
  4. Izatt, J.A.; Kulkarni, M.D.; Yazdanfar, S.; Barton, J.K.; Welch, A.J. In vivo bidirectional color dopplor flow imaging of picoliter blood volumes using optical coherence tomography. Opt. Lett. 1997, 22, 1439. [Google Scholar] [CrossRef] [PubMed] [Green Version]
  5. Leitgeb, R.A.; Hitzenberger, C.K.; Fercher, A.F.; Bajraszewski, T. Phase-shifting algorithm to achieve high-speed long-depth-range probing by frequency-domain optical coherence tomography. Opt. Lett. 2003, 28, 2201–2203. [Google Scholar] [CrossRef] [PubMed]
  6. Chen, C.L.; Wang, R.K. Optical coherence tomography based angiography [Invited]. Biomed. Opt. Express 2017, 8, 1056–1082. [Google Scholar] [CrossRef] [Green Version]
  7. Son, T.; Alam, M.; Toslak, D.; Wang, B.; Lu, Y.; Yao, X. Functional optical coherence tomography of neurovascular coupling interactions in the retina. J. Biophotonics 2018, 11, e201800089. [Google Scholar] [CrossRef] [PubMed]
  8. Auksorius, E.; Borycki, D.; Wojtkowski, M. Crosstalk-free volumetric in vivo imaging of a human retina with fourier-domain full-field optical coherence tomography. Biomed. Opt. Express 2019, 10, 6390–6407. [Google Scholar] [CrossRef] [PubMed]
  9. Vignali, L.; Solinas, E.; Emanuele, E. Research and clinical applications of optical coherence tomography in invasive cardiology: A review. Curr. Cardiol. Rev. 2014, 10, 369–376. [Google Scholar] [CrossRef] [PubMed] [Green Version]
  10. IJsselmuiden, A.J.J.; Zwaan, E.M.; Oemrawsingh, R.M.; Bom, M.J.; Dankers, F.J.; de Boer, M.J.; Camaro, C.; van Geuns, R.J.; Daemen, J.; Van Der Heijden, D.J.; et al. Appropriate use criteria for optical coherence tomography guidance in percutaneous coronary interventions: Recommendations of the working group of interventional cardiology of the Netherlands society of cardiology. Neth. Heart J. 2018, 26, 473–483. [Google Scholar] [CrossRef] [Green Version]
  11. Luna, J.A.; Saleah, S.A.; Kim, H.; Kang, D.; Seong, D.; Kim, Y.; Kim, H.; Wijesinghe, R.E.; Kim, J.; Jeon, M. A Case Report on Skin Sebum Extraction Using High Lateral Resolution Spectral-Domain Optical Coherence Tomography. Photonics 2023, 10, 30. [Google Scholar] [CrossRef]
  12. Qin, W.; Wang, R.K. Assessment of edema volume in skin upon injury in a mouse ear model with optical coherence tomography. Lasers Med. Sci. 2016, 31, 1351–1361. [Google Scholar] [CrossRef] [PubMed] [Green Version]
  13. Adabi, S.; Hosseinzadeh, M.; Noei, S.; Conforto, S.; Daveluy, S.; Clayton, A.; Mehregan, D.; Nasiriavanaki, M. Universal in vivo textual model for human skin based on optical coherence tomograms. Sci. Rep. 2017, 7, 17912. [Google Scholar] [CrossRef] [PubMed] [Green Version]
  14. Welge, W.A.; Barton, J.K. In vivo endoscopic doppler optical coherence tomography imaging of the colon. Lasers Surg. Med. 2017, 49, 249–257. [Google Scholar] [CrossRef] [Green Version]
  15. Chen, Y.; Andrews, P.M.; Aguirre, A.D.; Schmitt, J.M.; Fujimoto, J.G. High-resolution three-dimensional optical coherence tomography imaging of kidney microanatomy ex vivo. J. Biomed. Opt. 2007, 12, 034008. [Google Scholar] [CrossRef]
  16. Andrews, P.M.; Chen, Y.; Onozato, M.L.; Huang, S.W.; Adler, D.C.; Huber, R.A.; Jiang, J.; Barry, S.E.; Cable, A.E.; Fujimoto, J.G. High-resolution optical coherence tomography imaging of the living kidney. Lab. Investig. 2008, 88, 441–449. [Google Scholar] [CrossRef] [Green Version]
  17. Andrews, P.M.; Cooper, M.; Verbesey, J.; Ghasemian, S.; Chen, Y. Mannitol infusion within 15 min of cross-clamp improves living donor kidney preservation. Transplantation 2014, 98, 893–897. [Google Scholar] [CrossRef]
  18. Wang, J.; Xu, Y.; Boppart, S.A. Review of optical coherence tomography in oncology. J. Biomed. Opt. 2017, 22, 121711. [Google Scholar] [CrossRef]
  19. Naseripour, M.; Falavarjani, K.G.; Mirshahi, R.; Sedaghat, A. Optical coherence tomography angiography (OCTA) applications in ocular oncology. Eye 2020, 34, 1535–1545. [Google Scholar] [CrossRef]
  20. Onozato, M.L.; Andrews, P.M.; Li, Q.; Jiang, J.; Cable, A.; Chen, Y. Optical coherence tomography of human kidney. J. Urol. 2010, 183, 2090–2094. [Google Scholar] [CrossRef]
  21. Tojo, A. Optical coherence tomography in the kidney: A step toward echo microscopy. J. Urol. 2010, 183, 1669–1670. [Google Scholar] [CrossRef] [PubMed]
  22. Wang, H.; Guo, H.; Andrews, P.M.; Anderson, E.; Chen, Y. Optical coherence tomography (OCT) of a murine model of chronic kidney disease. Proc. SPIE Med. Imag. 2015, 9417, 94170T. [Google Scholar]
  23. Andrews, P.M.; Wang, H.; Guo, H.; Anderson, E.; Falola, R.; Chen, Y. Optical coherence tomography of the aging kidney. Exp. Clin. Transplant. 2016, 6, 617–622. [Google Scholar]
  24. Wierwille, J.; Andrews, P.M.; Onozato, M.L.; Jiang, J.; Cable, A.; Chen, Y. In vivo, label-free, three-dimensional quantitative imaging of kidney microcirculation using doppler optical coherence tomography. Lab. Investig. 2011, 91, 1596–1604. [Google Scholar] [CrossRef] [Green Version]
  25. Zhi, Z.; Jung, Y.; Jia, Y.; An, L.; Wang, R.K. Highly sensitive imaging of renal microcirculation in vivo using ultrahigh sensitive optical microangiography. Biomed. Opt. Express 2011, 2, 1059–1068. [Google Scholar] [CrossRef] [PubMed]
  26. Li, Q.; Onozato, M.L.; Andrews, P.M.; Chen, C.W.; Paek, A.; Naphas, R.; Yuan, S.A.; Jiang, J.; Cable, A.; Chen, Y. Automated quantification of microstructural dimensions of the human kidney using optical coherence tomography (OCT). Opt. Express 2009, 17, 16000–16016. [Google Scholar] [CrossRef] [PubMed]
  27. Wang, B.; Wang, H.; Guo, H.; Anderson, E.; Tang, Q.; Wu, T.; Falola, R.; Smith, T.; Andrews, P.M.; Chen, Y. Optical coherence tomography and computer-aided diagnosis of a murine model of chronic kidney disease. J. Biomed. Opt. 2017, 22, 121706. [Google Scholar] [CrossRef] [PubMed]
  28. Fang, Y.H.; Gong, W.; Huang, Z.; Zheng, L.Q.; Lin, H.X.; Yang, D.Y.; Xie, S.S. Research on Ischemia-Reperfusion Injury of Rat Kidney Using Optical Coherence Tomography; SPIE/COS Photonics Asia: Hangzhou, China, 2019. [Google Scholar]
  29. Benoit, B.M.; John, A.W. The fractal geometry of nature. Am. J. Phys. 1983, 51, 286. [Google Scholar]
  30. Sarkar, N.; Chaudhuri, B.B. An efficient differential box-counting approach to compute fractal dimension of image. IEEE Trans. Syst. Man Cybernet. 1994, 24, 115–120. [Google Scholar] [CrossRef] [Green Version]
  31. Neil, G.; Curtis, K.M. Shape recognition using fractal geometry. Pattern Recogn. 1997, 30, 1957–1969. [Google Scholar] [CrossRef]
  32. Sugihara, G.; May, R.M. Applications of fractals in ecology. Trends Ecol. Evol. 1990, 5, 79–86. [Google Scholar] [CrossRef] [PubMed]
  33. Chaudhuri, B.B.; Sarkar, N. Texture segmentation using fractal dimension. IEEE Trans. Pattern Anal. Mach. Intell. 1995, 17, 72–77. [Google Scholar] [CrossRef]
  34. Keller, J.M.; Chen, S.; Crownover, R.M. Texture description and segmentation through fractal geometry. Comput. Vis. Graph. Image Process. 1989, 45, 150–166. [Google Scholar] [CrossRef]
  35. Jalan, S.; Yadav, A.; Sarkar, C.; Boccaletti, S. Unveiling the multi-fractal structure of complex networks. Chaos Solitons Fractals 2017, 97, 11–14. [Google Scholar] [CrossRef] [Green Version]
  36. Yu, L.; Zhang, D.; Wang, K.; Yang, W. Coarse iris classification using box-counting to estimate fractal dimensions. Pattern Recognit. 2005, 38, 1791–1798. [Google Scholar] [CrossRef]
  37. Uahabi, K.L.; Atounti, M. Applications of fractals in medicine. Ann. Univ. Craiova-Math. Comput. Sci. Ser. 2015, 42, 167–174. [Google Scholar]
  38. Saghatchi, F.; Mohseni-Dargah, M.; Akbari-Birgani, S.; Saghatchi, S.; Kaboudin, B. Cancer therapy and imaging through functionalized carbon nanotubes decorated with magnetite and gold nanoparticles as a multimodal tool. Appl. Biochem. Biotechnol. 2020, 191, 1280–1293. [Google Scholar] [CrossRef]
  39. MubarakAli, D. Comprehensive review on rapid diagnosis of new infection COVID-19. Appl. Biochem. Biotechnol. 2022, 194, 1390–1400. [Google Scholar] [CrossRef]
  40. Seal, A.; Panigrahy, C. Human authentication based on fusion of thermal and visible face images. Multimed. Tools Appl. 2019, 78, 30373–30395. [Google Scholar] [CrossRef]
  41. Panigrahy, C.; Seal, A.; Mahato, N.K. Image texture surface analysis using an improved differential box counting based fractal dimension. Powder Technol. 2020, 364, 276–299. [Google Scholar] [CrossRef]
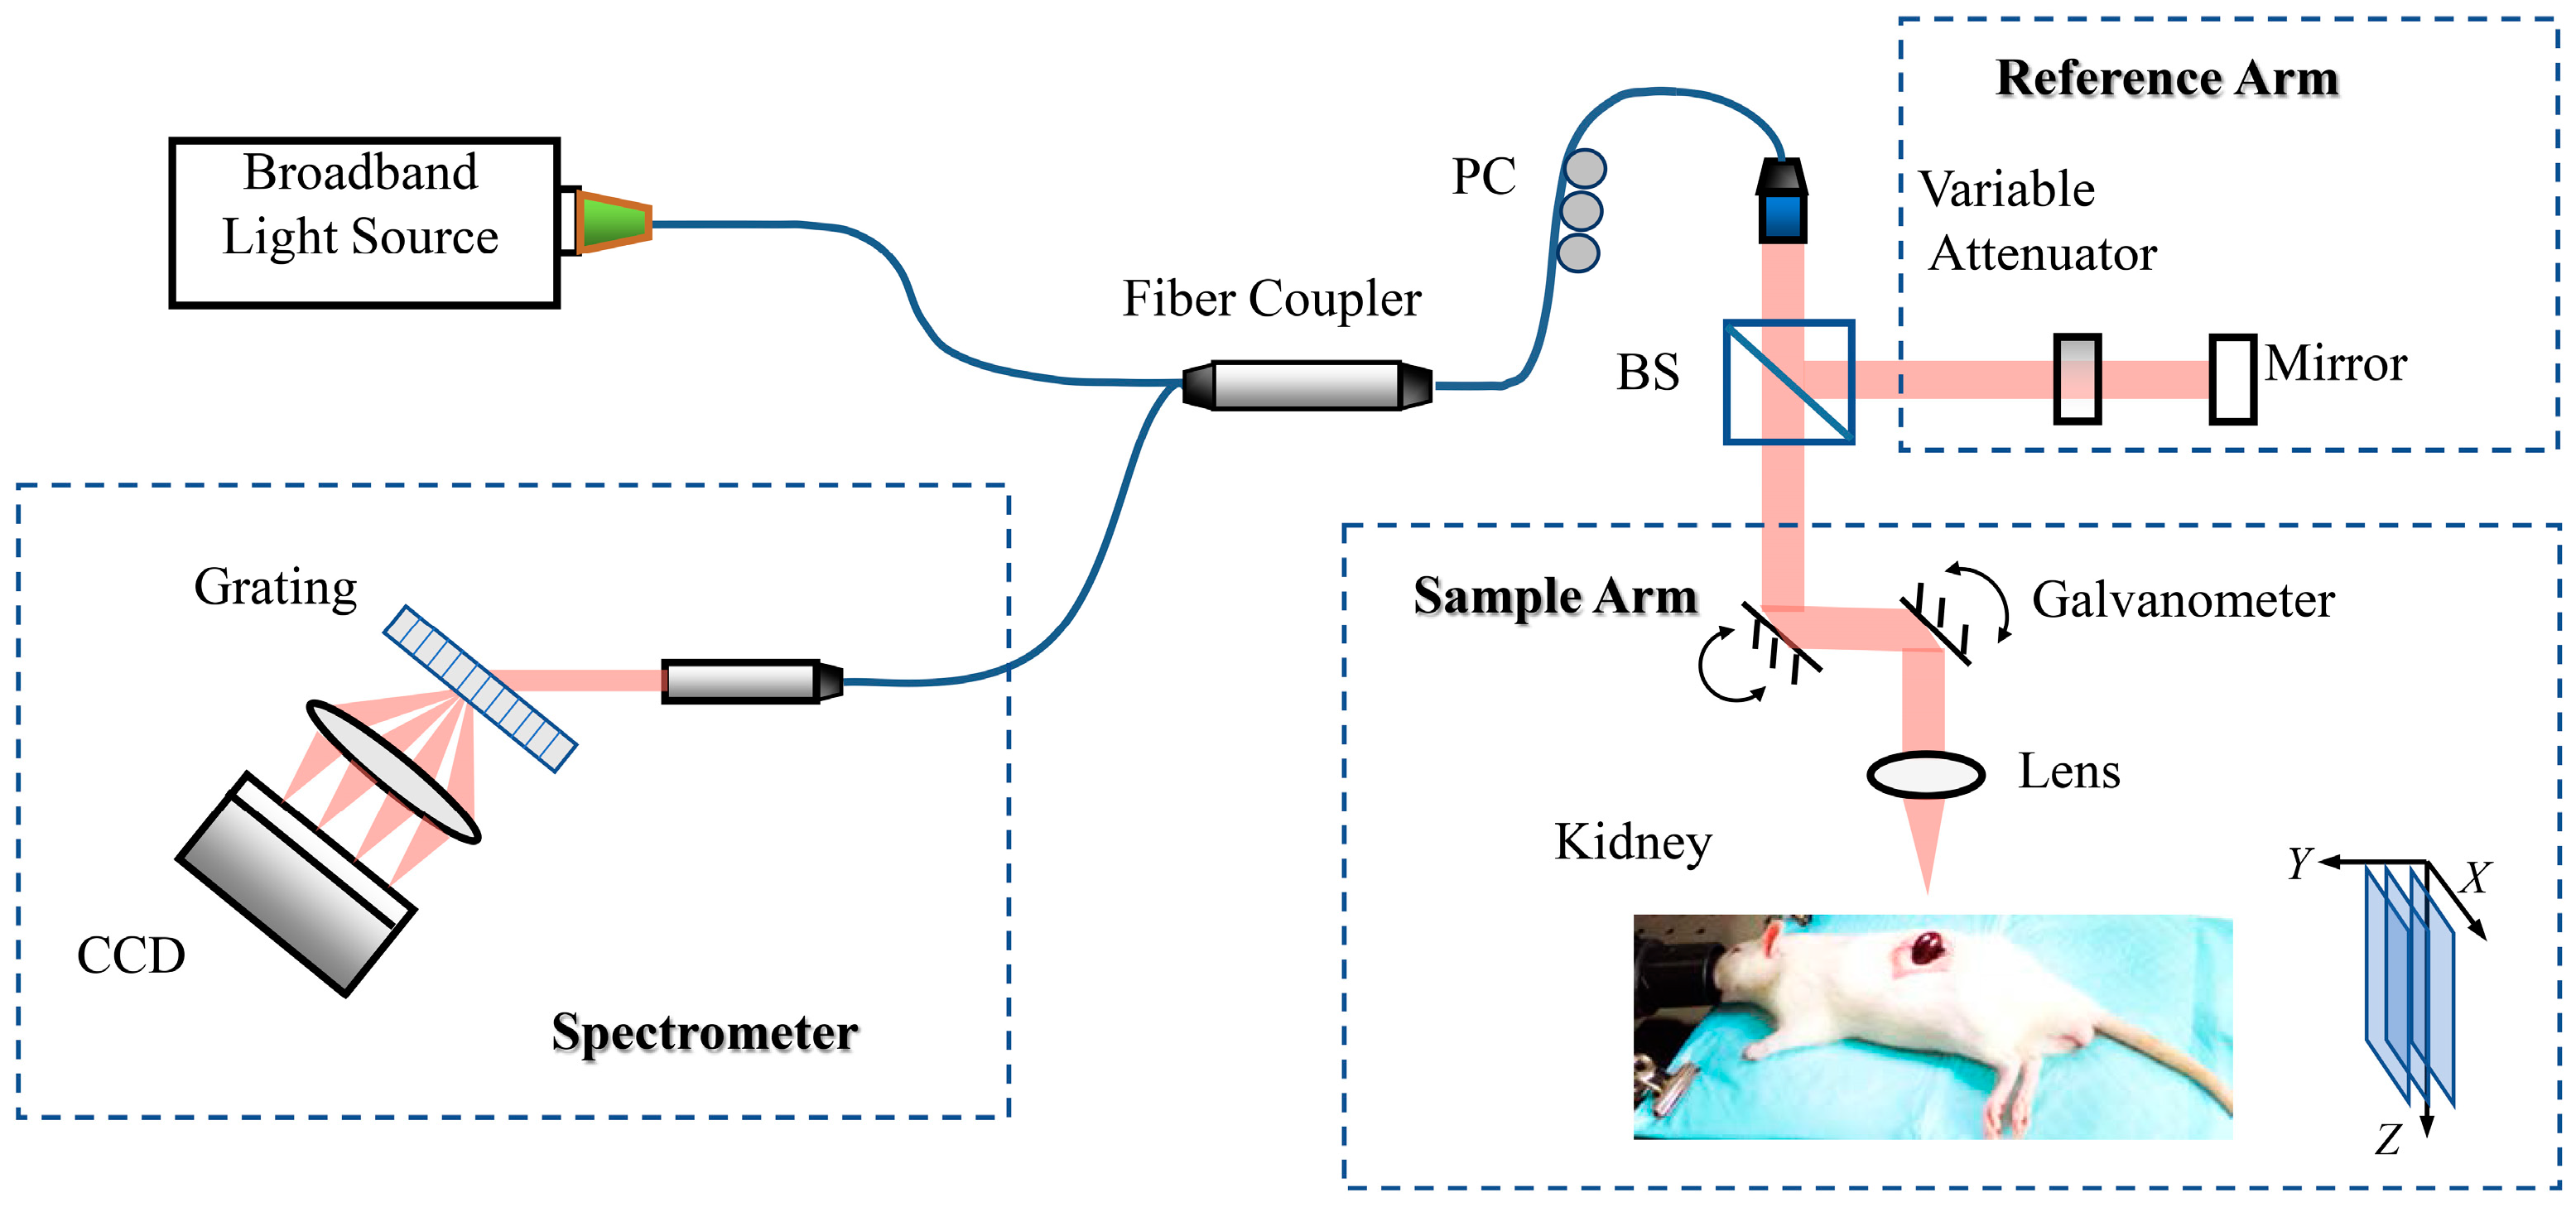
Figure 1. Schematic configuration of the OCT system for imaging rat kidneys in experiment.
Photonics 10 00741 g001
Figure 2. OCT images of normal Wistar rat kidney: (a) cross-sectional image; (b) three-dimensional image; and an en face image at (c) 50 μm above the focal plane (green plane in C-scan (b)); (d) focal plane (yellow plane in (b)); and (e) 100 μm below the focal plane (blue plane in (b)). The scale bar is 100 μm.
Photonics 10 00741 g002
Figure 3. Flow chart of fractal dimension calculation of OCT en face image.
Photonics 10 00741 g003
Figure 4. Reconstruction of three-dimensional OCT image after alignment of A-lines. (a) Original OCT images; (b) reconstructed OCT 3D image of rat kidney after surface flattening; (c) cross-sectional image after alignment of A-lines and OCT en face image extracted from reconstructed 3D image at the focal plane. The scale bar is 200 μm.
Photonics 10 00741 g004
Figure 5. The FD calculation of a normal OCT image. (a) Normal OCT en face image at the focal plane; (b) the binary image of (a); (c) linear fitting of the data points ( l o g ( b o x   s i z e ) , l o g ( N r ) ) . The scale bar is 200 μm.
Photonics 10 00741 g005
Figure 6. Calculation of the time series OCT images in the group I30. Reperfusion for (a) 5 min; (b) 10 min; (c) 20 min; (d) 30 min; (e) 40 min; (f) 50 min; (g) 60 min; (h) 90 min. OCT images are 2 mm × 2 mm in size.
Photonics 10 00741 g006
Figure 7. The fractal dimension of group I30 vs. reperfusion, the orange line in the figure indicates the fractal dimension of the normal kidney image (baseline).
Photonics 10 00741 g007
Figure 8. Comparison of the fractal dimension of each group. The normal value and standard deviation was calculated from 35 rats, 5 from the control group and 30 from the ischemia–reperfusion group (baseline). The mean and standard deviation of each group was calculated from of the five final stable values from each group. ** denotes a statistically significant difference between the groups (p < 0.001).
Photonics 10 00741 g008
Table 1. Measured fractal dimension of each group.
GroupNormalI20I30I40I50I60I90
FD1.888 ± 0.040 11.730 ± 0.0331.741 ± 0.0361.697 ± 0.0541.586 ± 0.0551.531 ± 0.0361.271 ± 0.027
1 All values are given as Mean ± Standard Deviation.
Disclaimer/Publisher’s Note: The statements, opinions and data contained in all publications are solely those of the individual author(s) and contributor(s) and not of MDPI and/or the editor(s). MDPI and/or the editor(s) disclaim responsibility for any injury to people or property resulting from any ideas, methods, instructions or products referred to in the content.