1. Introduction
Benzoic acid and its derivative benzoate are widely utilized as food preservatives. Nonetheless, their improper use may lead to a variety of negative health consequences, including asthma, kidney failure, stomach problems, and cancer. To address this issue, many countries, including China and Brazil, have established standards for the amount of benzoic acid that can be added to food [
1]. The employment of food additives, such as benzoic acid, is governed by the “National Food Safety Standard: Standard for the Use of Food Additives” (GB-2760-2014) in China. The regulation sets a maximum limit of 1.0 g/kg for benzoic acid content in dairy products [
2]. Various techniques are currently available for detecting benzoic acid, including high-performance liquid chromatography (HPLC) [
3], gas chromatography-mass spectrometry (GC/MS) [
4], and the fluorescent probe method [
5]. While these methods provide excellent precision and a broad linear detection range, they necessitate skilled handling, incur substantial detection expenses, entail lengthy detection periods, involve complicated sample preparation, and mandate costly equipment [
6]. Consequently, it is essential to develop an efficient, precise, and universally applicable technique for detecting trace food additives.
Metamaterials are composite structures with nano/micro scale properties and phenomena that are difficult to obtain from natural materials. These include negative refractive index, invisibility, perfect lenses, and resonant absorbers [
7]. By artificially arranging subwavelength cell structures in a periodic manner, metamaterials exhibit unique responses to electromagnetic waves. The distinctive electromagnetic response of metamaterials is determined by the geometrical features of their structure. Consequently, carefully designing the resonant structure and employing various sequential modes can produce the desired resonant properties [
8]. As biomolecules display unique biological signatures in the THz range, harnessing the special electromagnetic response of metamaterials can lead to the development of highly sensitive sensors.
Biosensors can be classified as labeled or unlabeled, depending on whether the analyte has been modified or pretreated. Labeled sensing methods have several disadvantages, including complex labeling processes, long detection periods, and, in some cases, changing the properties of the analyte. Metamaterial biosensors offer a novel label-free sensing approach that converts external refractive index changes into optical signal changes, overcoming the resolution limitations of traditional sensors [
8]. There are currently some cases of applying metamaterial sensors to the food industry. B.B. Wang et al. designed a metamaterial sensor for detecting trace concentrations of acetylcholinesterase in pesticides [
9]. Bin Wang et al. used the metamaterial sensor to detect changes in the concentration of pituitary hormones [
10]. B. Zhu et al. designed a polarization-insensitive sensor for detecting food additives [
11]. Overall, the application of metamaterial sensors in the detection of food additives has become a new field, especially in the terahertz band. This is mainly because the terahertz band has many unique advantages in food detection. Firstly, the wavelength of the terahertz band is between that of microwaves and infrared, which allows it to penetrate food materials and detect their structural information without causing radiation damage to the food. Secondly, the terahertz band has good sensitivity to most food additives, and can quickly and accurately detect their components. Compared with traditional methods, terahertz metamaterial sensing has a series of advantages, such as label-free detection, fast detection, and low cost. The food industry has several methods for detecting benzoic acid, including: 1. High-performance liquid chromatography (HPLC): This is currently one of the most commonly used methods for detecting benzoic acid, with advantages such as high sensitivity, high resolution, and high repeatability. 2. Gas chromatography (GC): This method involves volatilizing the benzoic acid in the food sample and then detecting it using a gas chromatograph, with high sensitivity and high resolution. 3. Liquid chromatography-mass spectrometry (LC-MS): This method combines high-performance liquid chromatography with mass spectrometry technology to quickly and accurately detect benzoic acid in food. 4. Infrared spectroscopy (IR): This method utilizes the absorption characteristics of benzoic acid molecules in the infrared spectrum to detect benzoic acid. Each of these methods has its own advantages and disadvantages. For example, HPLC requires a longer analysis time and higher cost; GC requires sample pretreatment; LC-MS requires specialized instruments and techniques; IR has higher sample handling requirements. Therefore, studying the application of metamaterial sensors for benzoic acid detection has practical significance and is necessary.
This study introduces a sensitive technique for detecting benzoic acid, which employs a pre-designed metasurface sensor. The resonance dip of the sensor is designed to be at 0.93 THz, which corresponds to the fingerprint spectrum of benzoic acid in the THz range. We simulated the THz transmission spectrum using the designed absorber structure and placing different thicknesses of benzoic acid on the metasurface sensor. Our results show that both spectral frequency shifts and transmission intensities exhibit high sensitivity to trace benzoic acid thicknesses. The use of this metasurface sensor can effectively and rapidly detect trace substances, making it a crucial tool for maintaining food safety.
2. Materials and Methods
In this study, we used CST software to design and simulate the structural parameters of metamaterial resonators, solving Maxwell’s equations by the finite integration method [
12]. Previous research has identified one of the resonance dips of benzoic acid at 0.93 THz [
13]. Therefore, in this paper, we designed a metasurface sensor with a resonance dip close to 0.93 THz using a periodic arrangement of cross-shaped aluminum structures on a polyimide substrate. The specific size parameters are shown in
Figure 1, with the period (P) of 123 μm, dielectric constant of the polyimide substrate of 3.5, substrate layer thickness (h) of 19 μm, aluminum coating with a conductivity of 3.56 × 10
7 S/m, and thickness (t) of 4 μm, cross length (L) of 108 μm, and cross width (W) of 7 μm. The calculated transmission spectrum of the metasurface sensor with TE wave incidence demonstrates a resonance dip of approximately 0.93 THz.
Figure 2a illustrates the CST-computed spatial electric field intensity distribution surrounding the cross-shaped array. The X and Y coordinates represent the unit cell’s location on the metasurface array. The color scale, ranging from blue to red, indicates the variation in electric field intensity from low to high, with the darkest red representing the maximum electric field intensity at that particular spot. The THz hotspot, which generates marked signal enhancements, corresponds to the maximum electric field at the cross arm ends. Based on these simulation outcomes, the optimal excitation frequency can be determined. To gain a deeper insight into the absorption mechanism,
Figure 2b,c depict the surface current and magnetic field distributions of the cross-shaped metasurface at 0.93 THz, respectively. The simulation results indicate that when a THz wave is incident on the metasurface sensor, a surface current is generated vertically down the
y-axis and a clockwise magnetic field is produced in the plane perpendicular to the
y-axis, thereby generating electrical current. This resonance is an electric dipole, which reduces reflection and enhances the absorption of electromagnetic waves.
3. Results
An analysis was performed to investigate how the transmission spectra of the metamaterial sensor are influenced by its structural parameters.
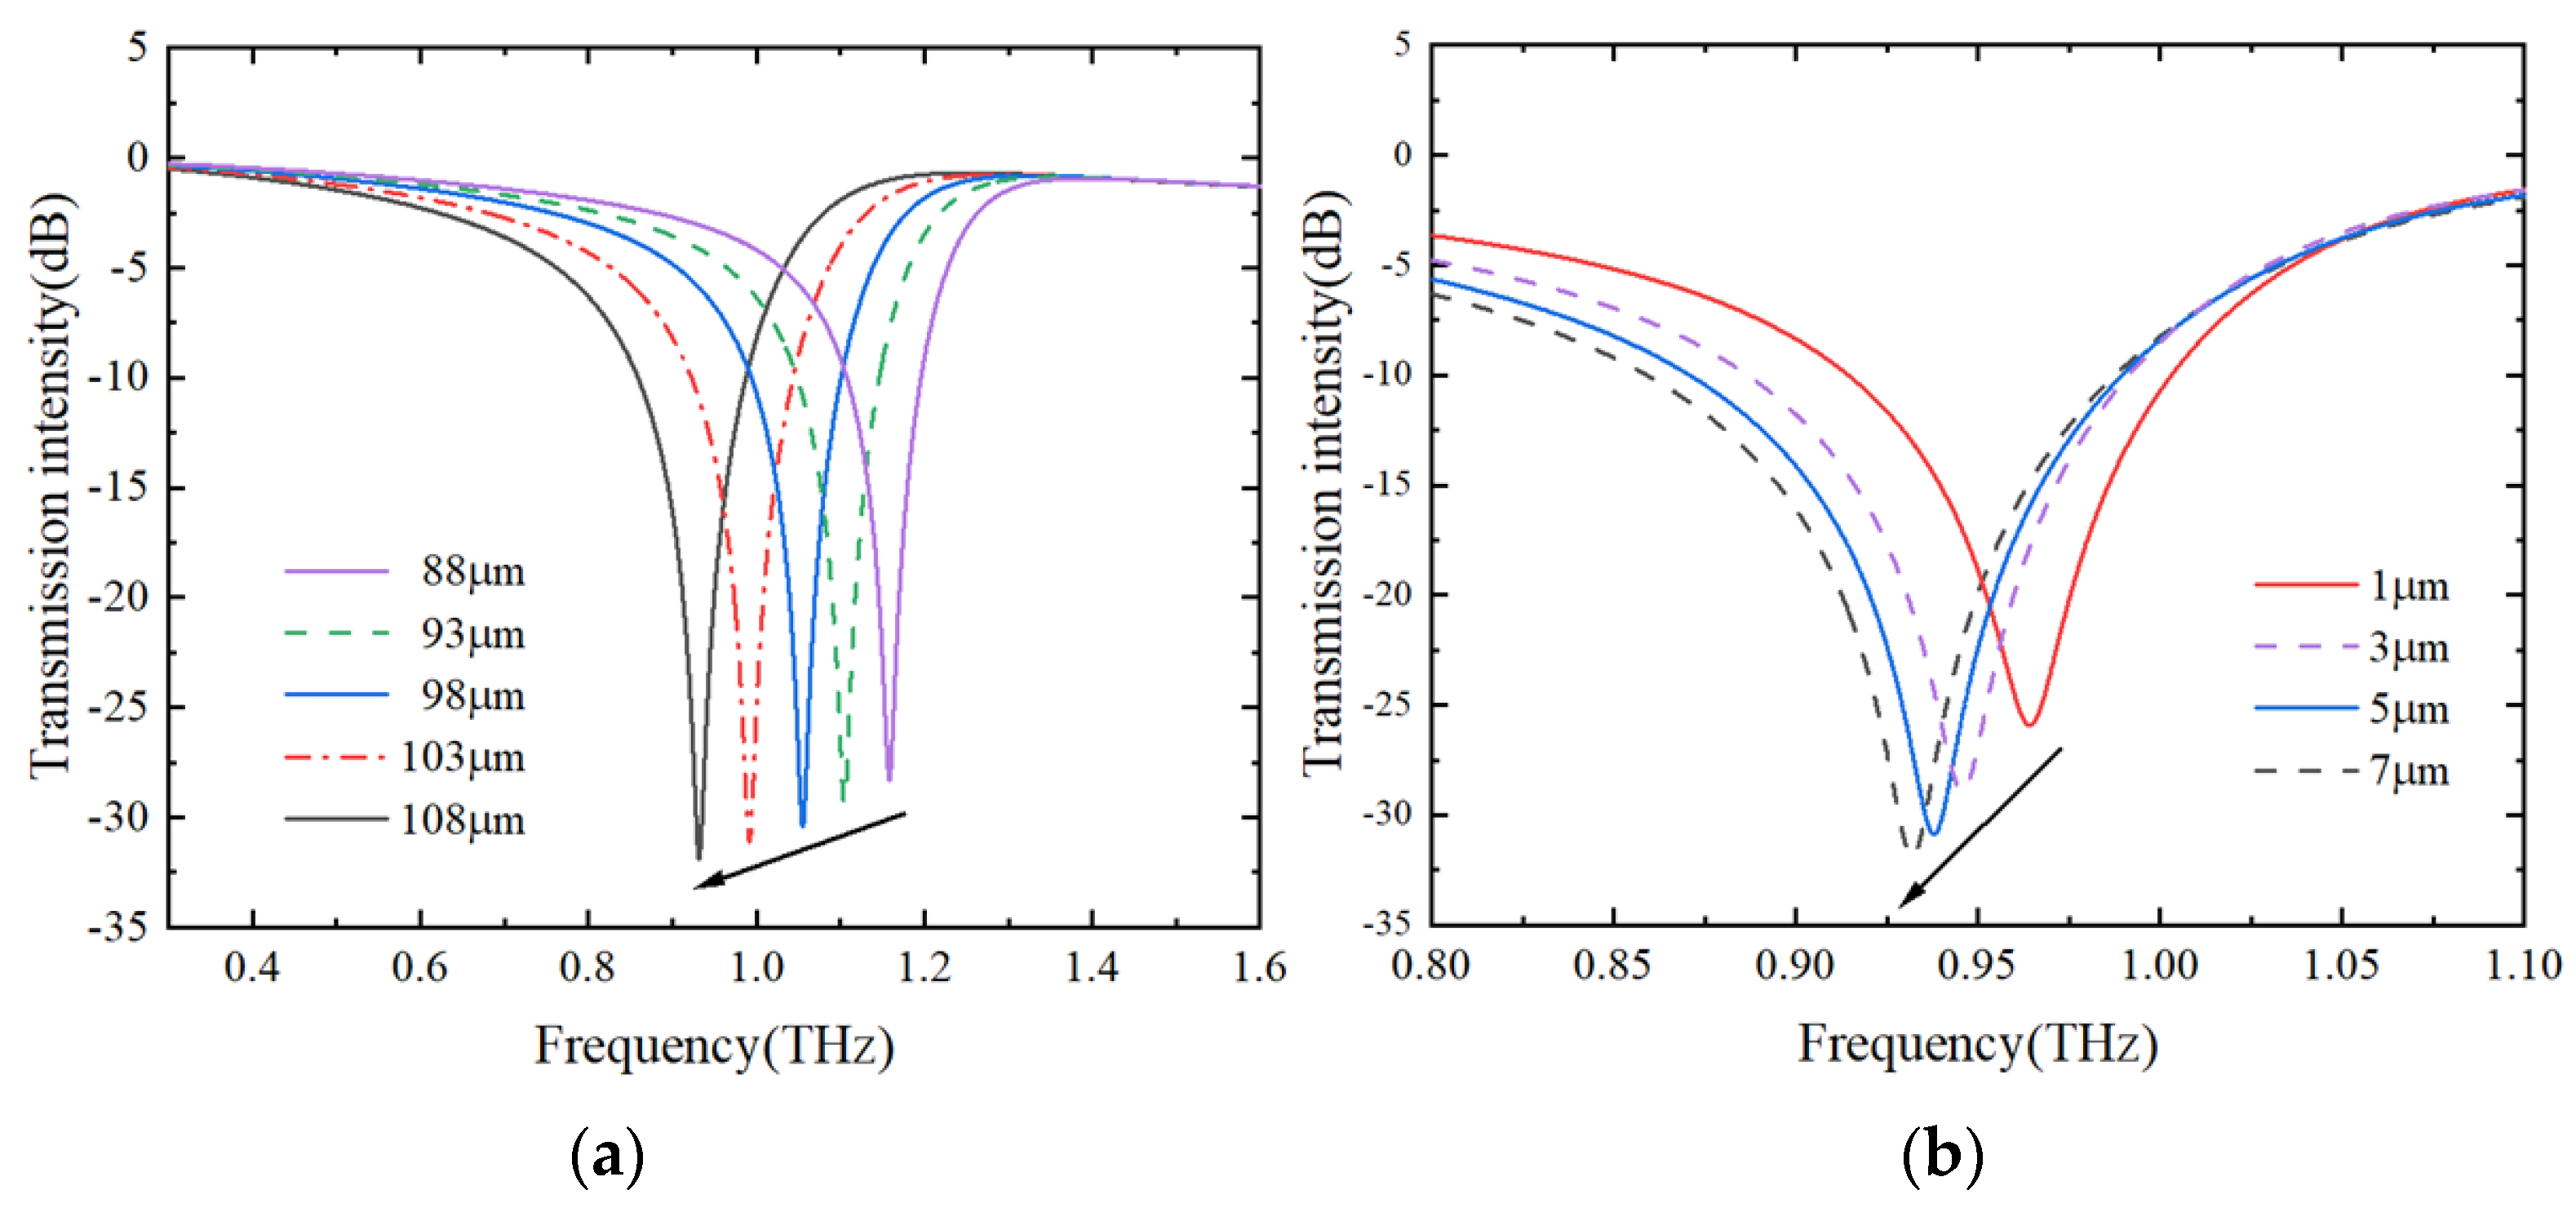
Figure 3a illustrates the effect of changing the length of the cross (L) on the resonance dip. At this moment, the cross width (W) is 7 μm. As L increases, the resonance dip shifts towards lower frequencies and exhibits a downward trend. Based on the scanning result of
Figure 3a, we determined the length of the cross (L) to be 108 μm, and then set (L) as 108 μm for parameter scanning of the cross width.
Figure 3b depicts the effect of changing the width of the cross (W) on the resonance dip. As (W) increases, the resonance dip also shifts towards lower frequencies and decreases in magnitude. Obtained under the optimal parameters, the width of the cross (W) is 108 μm, and the length of the cross (L) is 7 μm. Specifically, when the cross length (L) increases, leading to a decrease in the resonant frequency. In addition, the electric field distribution inside the resonator also changes with the increase of the cross length, which affects the resonant angle. In this case, the resonant angle shifts to lower frequencies and shows a decreasing trend. On the other hand, when the cross width (W) increases, leading to a decrease in the resonant frequency. Moreover, a larger cross width will lower the quality factor of the resonator, which means that the energy stored in the resonator will decrease, resulting in a decrease in the amplitude of the resonance peak. Therefore, the resonant angle shifts to lower frequencies and the amplitude decreases. In summary, the cross length (L) and cross width (W) are important parameters that affect the resonant frequency and resonant angle of the resonator. By changing these parameters, the performance of the resonator can be adjusted to meet specific application requirements.
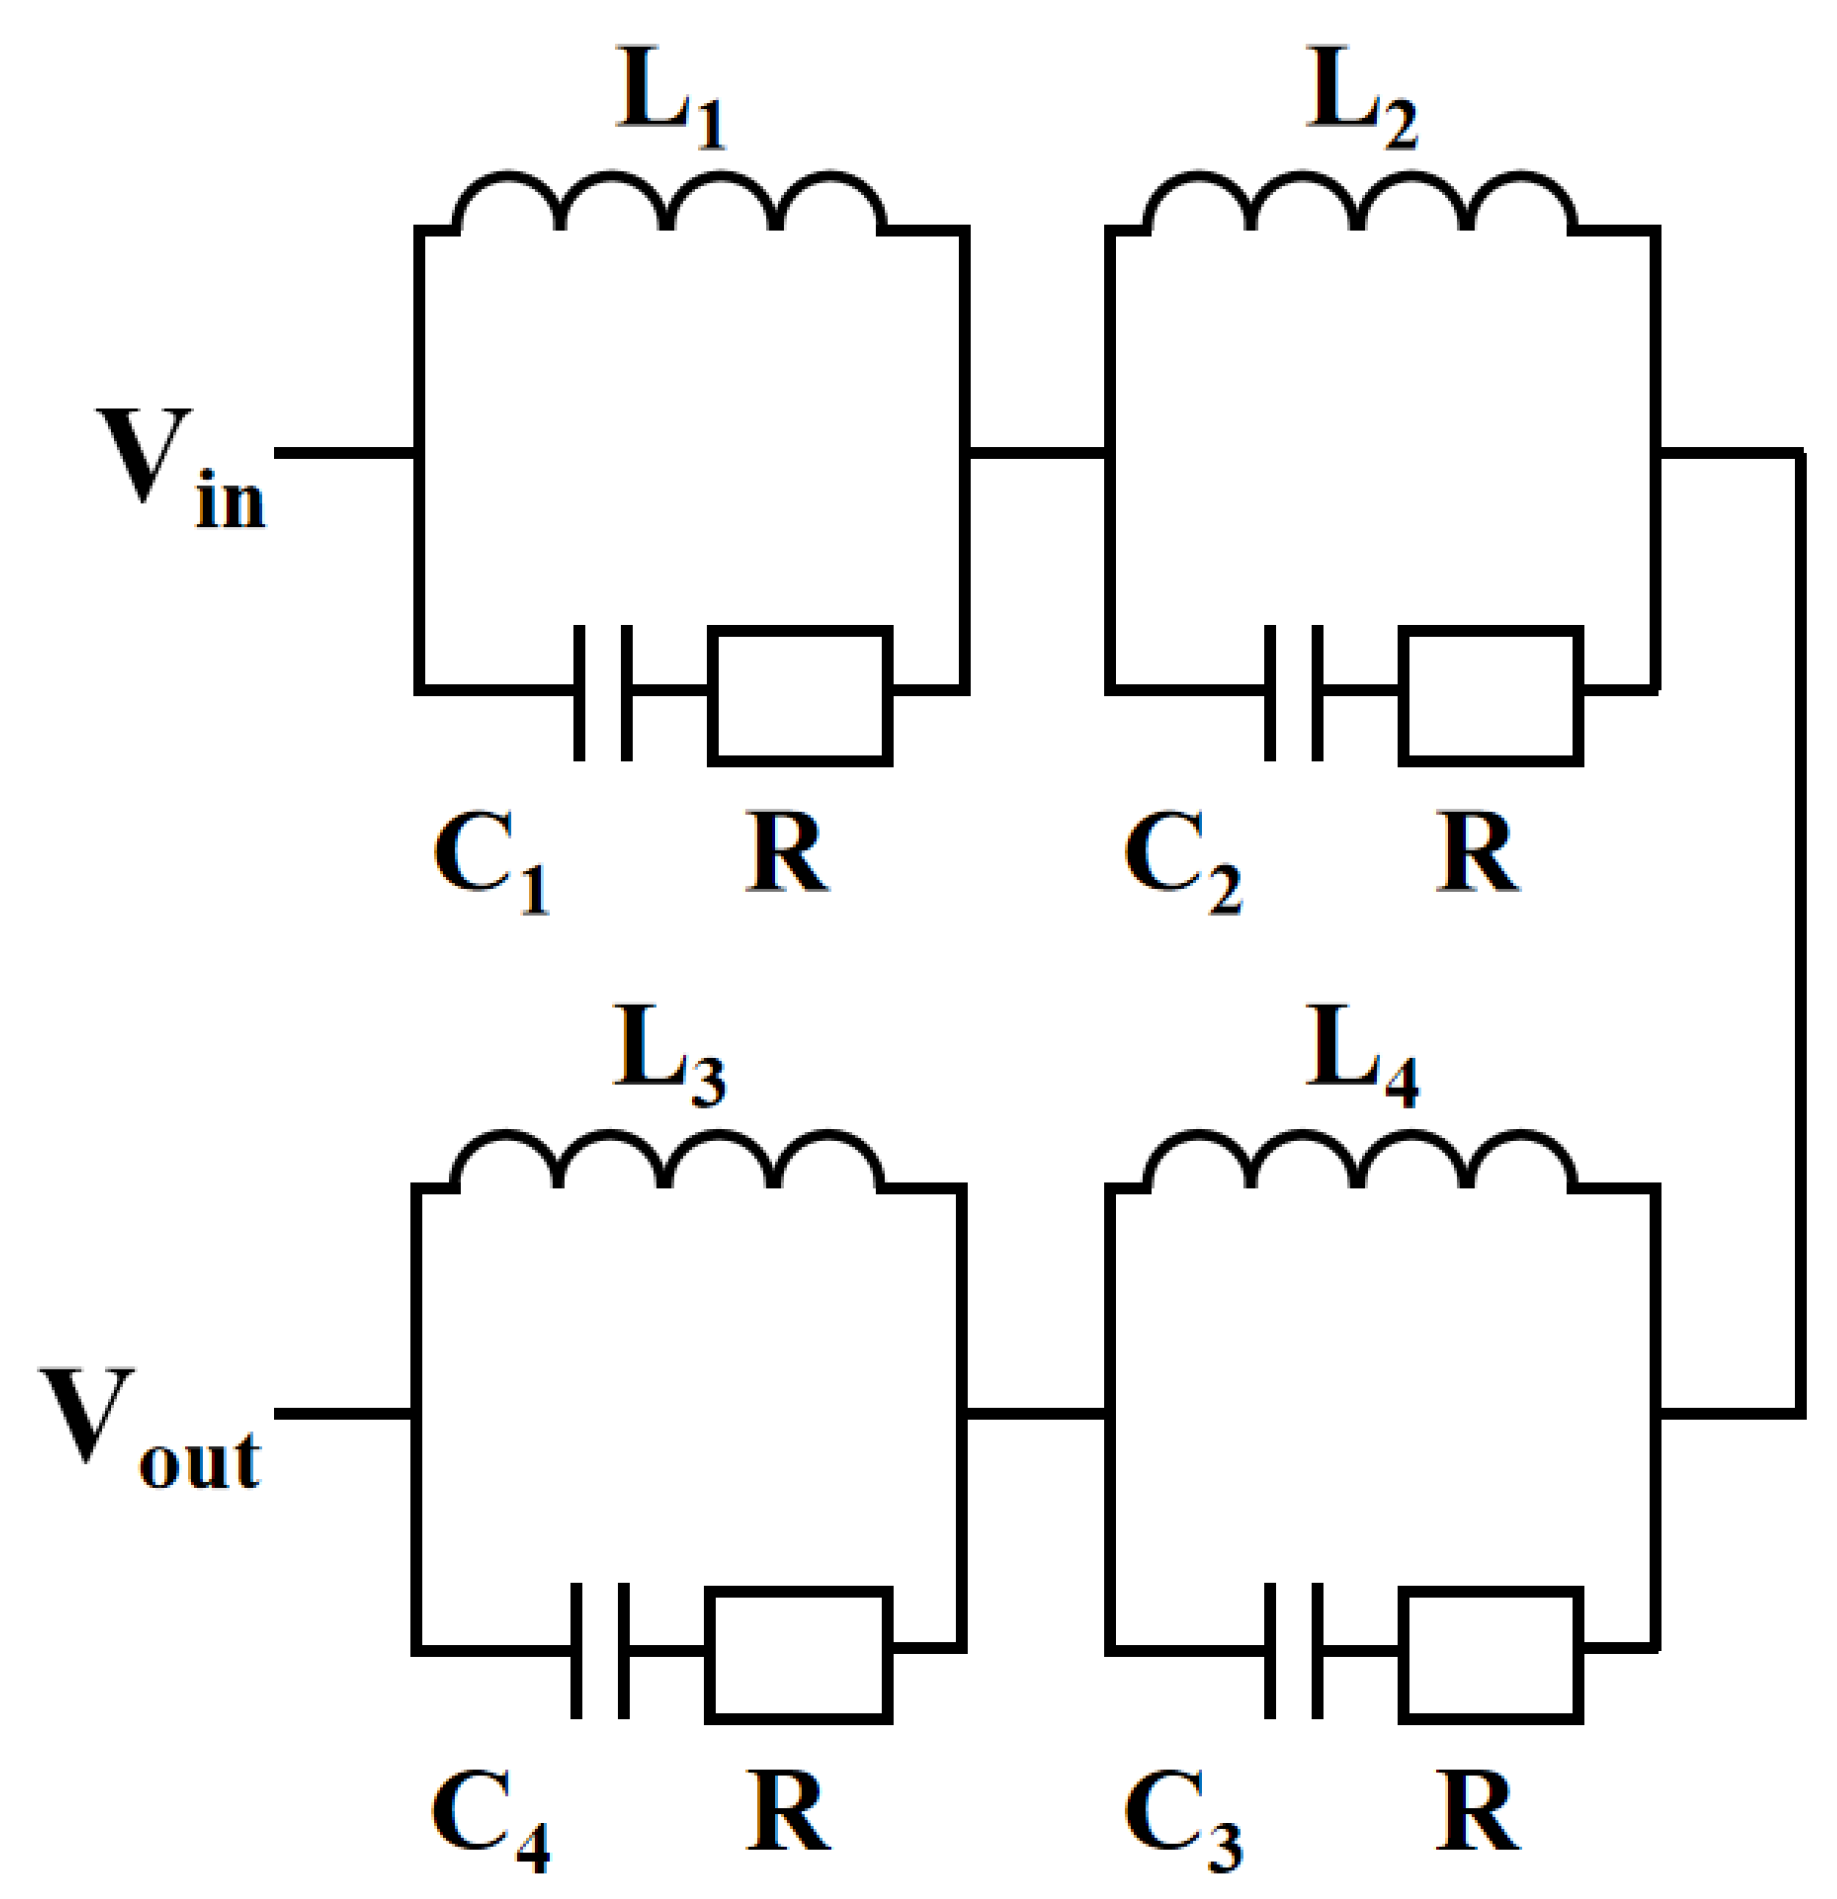
The cross-shaped terahertz metasurface structure can be described by various circuit models to explain the relationship between the structure and the transmission spectrum. One commonly used circuit model is the LC series circuit, where R represents resistance, L represents inductance, and C represents capacitance. The cross-shaped terahertz metasurface structure can be approximated as an LC series circuit, where the inductance and capacitance represent the reactance of the structure, and the resistance represents the damping loss of the structure. Specifically, the cross structure can be divided into four directions, each corresponding to an inductance and capacitance. L1, L2, L3, and L4 represent the four directions of inductance, and C1, C2, C3, and C4 represent the four directions of capacitance. When the frequency of the incident light wave matches the resonant frequency of the cross structure, the reactance of the inductance and capacitance in the four directions will reach its maximum value, and the energy of the incident light wave will be absorbed. This resonance phenomenon will cause a resonance dip or peak to appear in the transmission spectrum. When the frequency of the incident light wave deviates from the resonant frequency, the reactance of the inductance and capacitance in the four directions will decrease, reducing the energy absorption and causing a peak to appear in the transmission spectrum. The equivalent circuit model is shown in
Figure 4.
The finite integration method [
14] was used to analyze the transmission performance of the proposed metasurface sensor. First, the optimal parameters were selected according to
Figure 3, with (W) of 7 μm and (L) of 108 μm, and it was found that the resonant peak frequencies were all around 0.93 THz. The parameter settings of benzoic acid are related to the resonant peak frequency. At this time, the dielectric constant of benzoic acid is 1.1, and the damping frequency is set to 1.59 × 10
11 1/s.
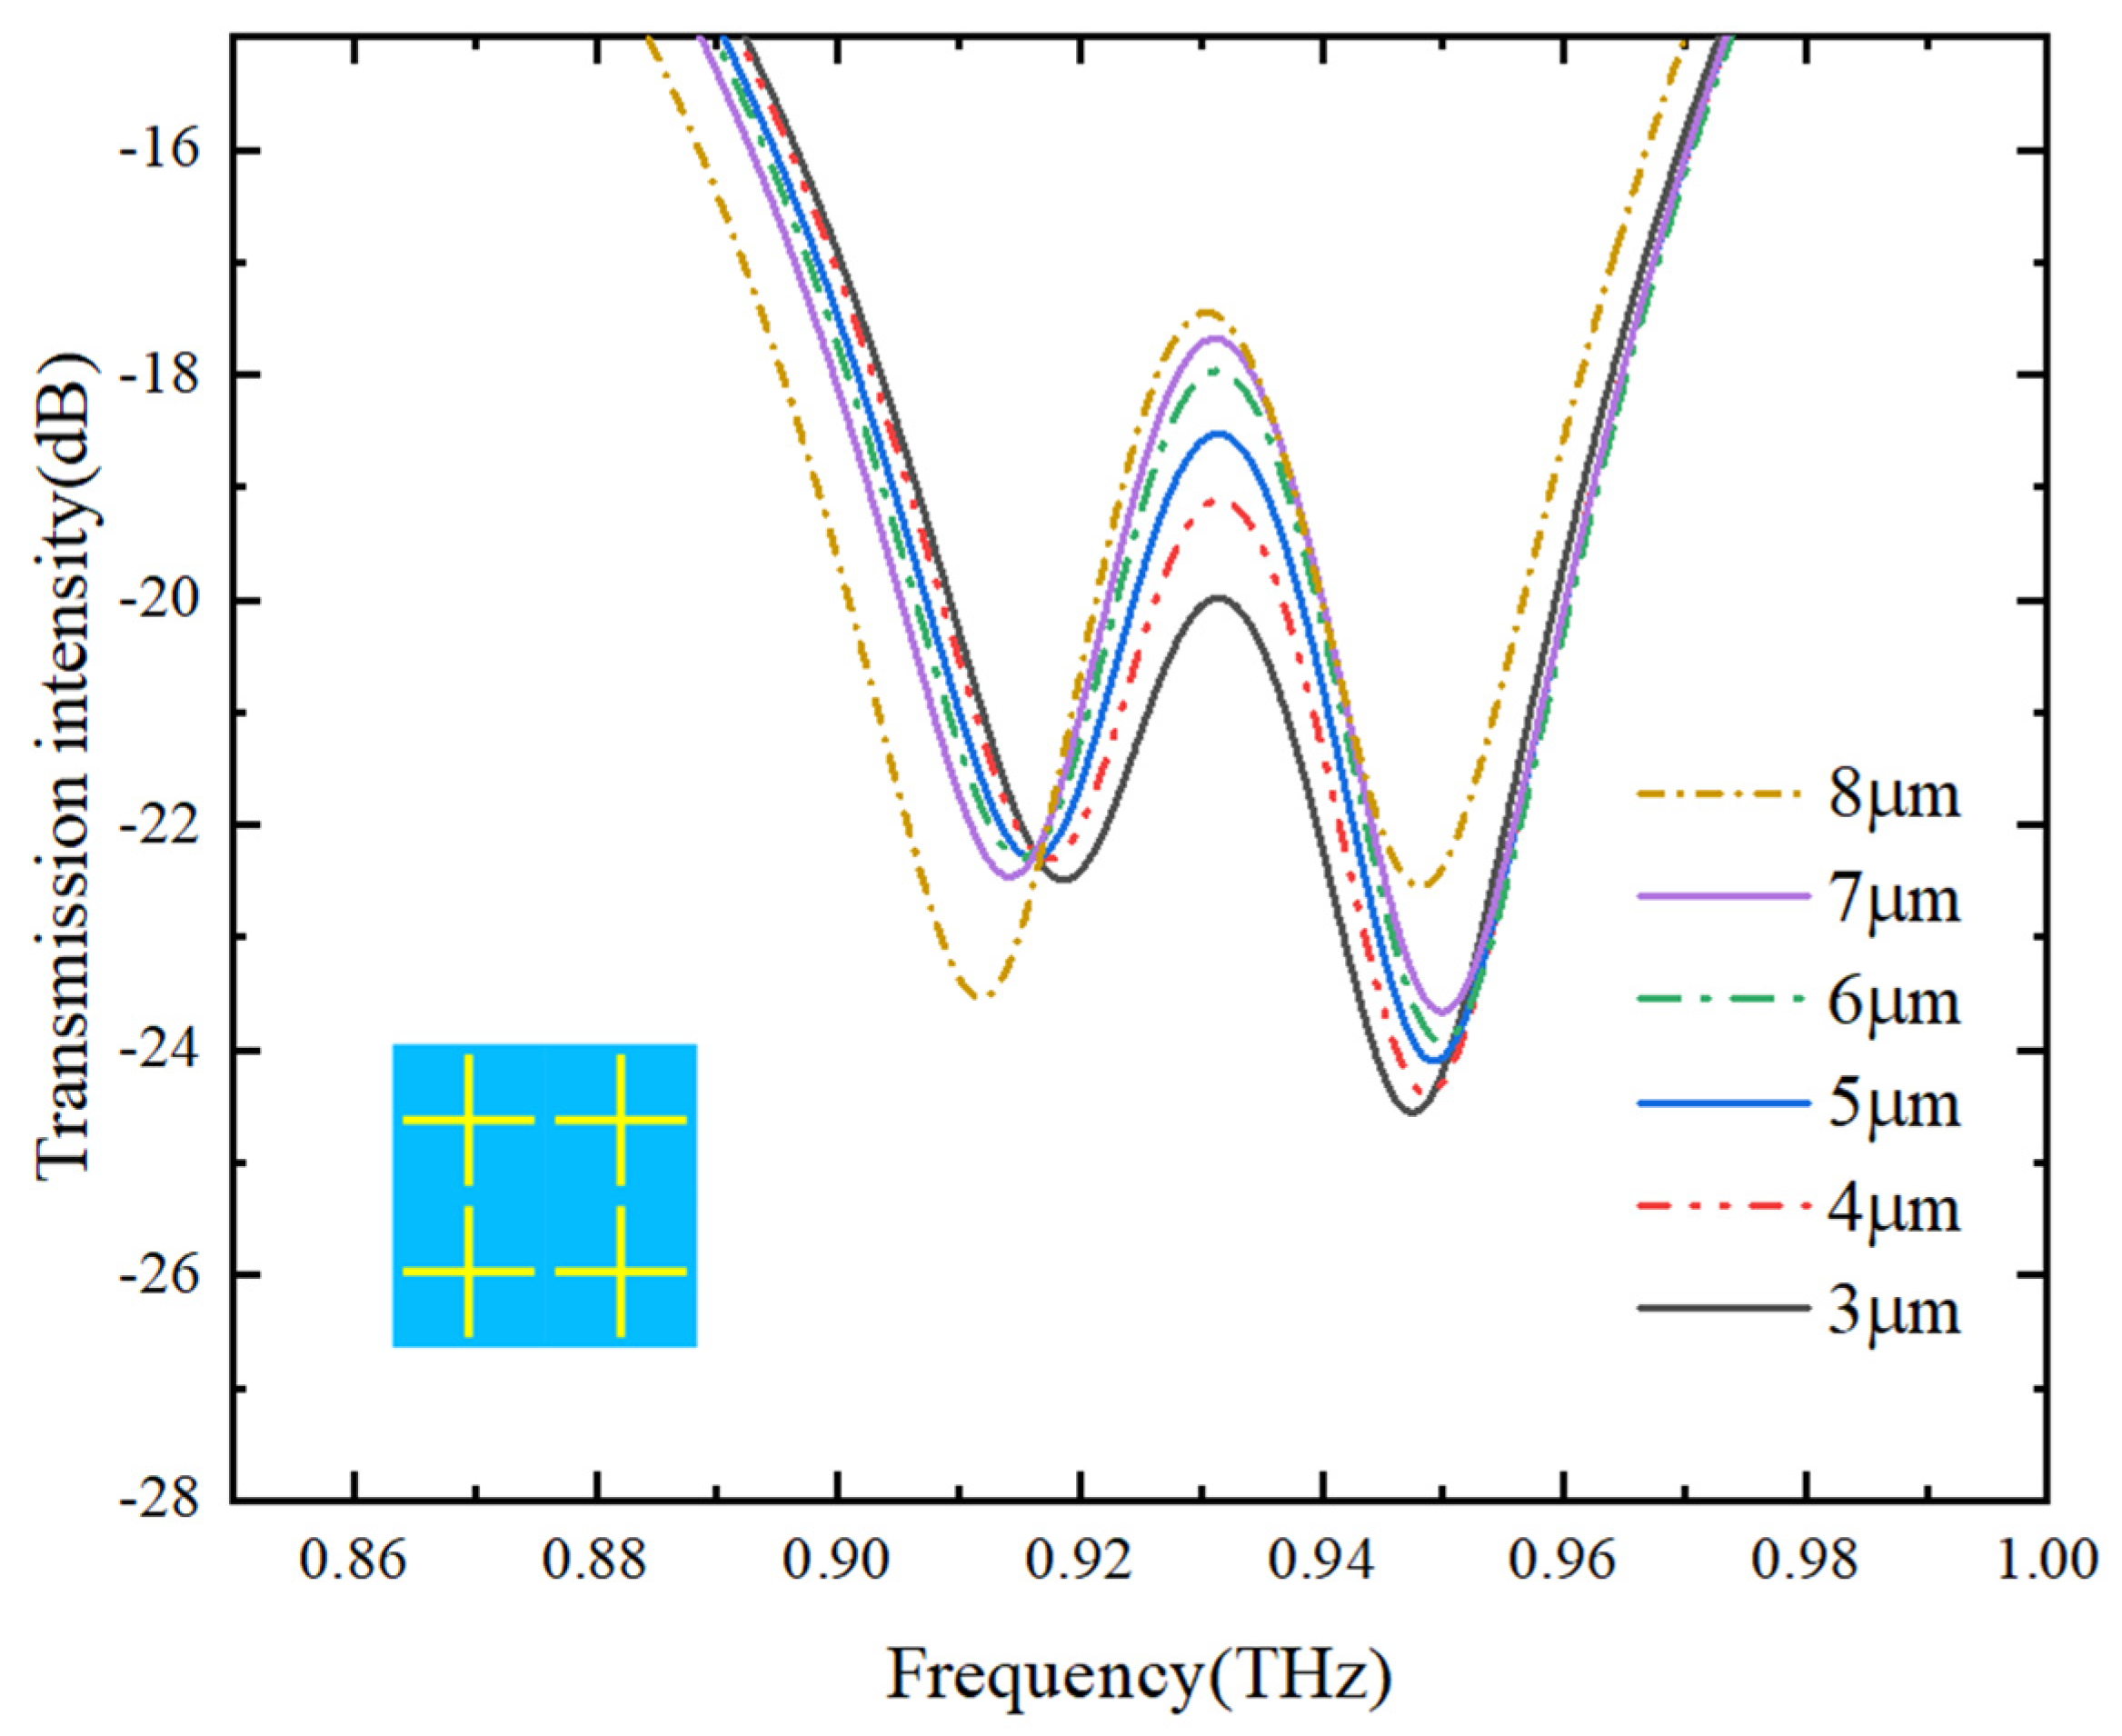
Figure 5 shows the sensor’s transmission spectra as the thickness of the benzoic acid analyte is modified. The peak in the transmission spectra can be attributed to hybridization-induced transparency (HIT). The cross-shaped structure can be considered as consisting of two coplanar aluminum strips arranged along the vertical and horizontal directions, respectively. The length and width of the aluminum strips in the cross-shaped structure affect its electromagnetic response, and the resonance frequency and intensity of the structure can be adjusted by tuning its parameters. When the frequency of terahertz waves matches the resonant frequency of the cross-shaped structure, the interaction between the aluminum strips and the terahertz waves leads to the appearance of resonant peaks or dips in the transmission spectrum. When benzoic acid is introduced into the cross-shaped structure, the interaction between the benzoic acid molecules and the aluminum strips becomes stronger, and the coupling between the terahertz waves and the structure becomes stronger, resulting in the formation of new hybrid resonance modes. The resonant frequency and intensity of these mixed resonance modes change with the concentration of benzoic acid, leading to changes in the resonant phenomena in the transmission spectrum. When the concentration of benzoic acid is high, the interaction between the benzoic acid molecules and the metal nanobelt becomes stronger, and the coupling between the terahertz waves and the structure also becomes stronger, resulting in the appearance of stronger or deeper resonant peaks or dips in the transmission spectrum. A phenomenon known as the hybridization-induced transparency (HIT) arises from the coherent coupling of plasmonic and atomic oscillators in a hybrid structure. The HIT serves as a hybrid counterpart of plasmon-induced transparency (PIT) and electromagnetically induced transparency (EIT) in a plasma/atomic hybrid structure [
15]. By utilizing HIT, it is possible to quantitatively identify food additives.
The transmission intensity at 0.93 THz shows a tendency to increase as the thickness of the benzoic acid layer increases. This may be due to the higher concentration of benzoic acid analyte, which enhances the transmission. The transmission intensity continues to increase until the thickness reaches approximately 8 μm, after which it tends to saturate. The relationship between transmission intensity and thickness can be described using the fitting equation, where
I represents the transmission intensity and
h is the thickness
The simulation’s
x- and
y-axes were established using the unit cell boundary conditions, while the
z-axis was set as the Floquet port. Since the structure is periodic, only one unit cell was included in the simulation. A TE wave with the electric field oriented in the
x-direction was employed. The transmission rate was calculated using the following formula [
16], where
T is the transmittance at an angular frequency
ω, and
A and
R are the absorbance and reflectance.
It can be observed that only one peak exists in
Figure 3, while two peaks are observed in
Figure 5 after the addition of benzoic acid. This is because the added analyte causes changes in the electromagnetic response of the metamaterial, resulting in the phenomenon of splitting resonance. This phenomenon can be explained by the HIT theory. These structural changes include the adsorption of the analyte on the surface of the metamaterial and the interaction between the analyte and the metamaterial. When the analyte is adsorbed on the surface of the metamaterial, it affects the charge distribution on the surface of the metamaterial, thereby changing the electromagnetic response of the metamaterial and causing the original resonance peak to split into two peaks.
With the increase of the thickness of benzoic acid, the transmission intensity of the resonance peak at 0.93 THz also increases, as shown in
Figure 5. This is because the increase in the thickness of benzoic acid affects the electromagnetic response of the metamaterial chip, thereby affecting the transmission intensity of the resonance peak. When benzoic acid molecules are adsorbed on the surface of the metamaterial chip, they change the distribution and transmission mechanism of the electromagnetic field in the metamaterial chip, thereby affecting the transmission intensity of the resonance peak.
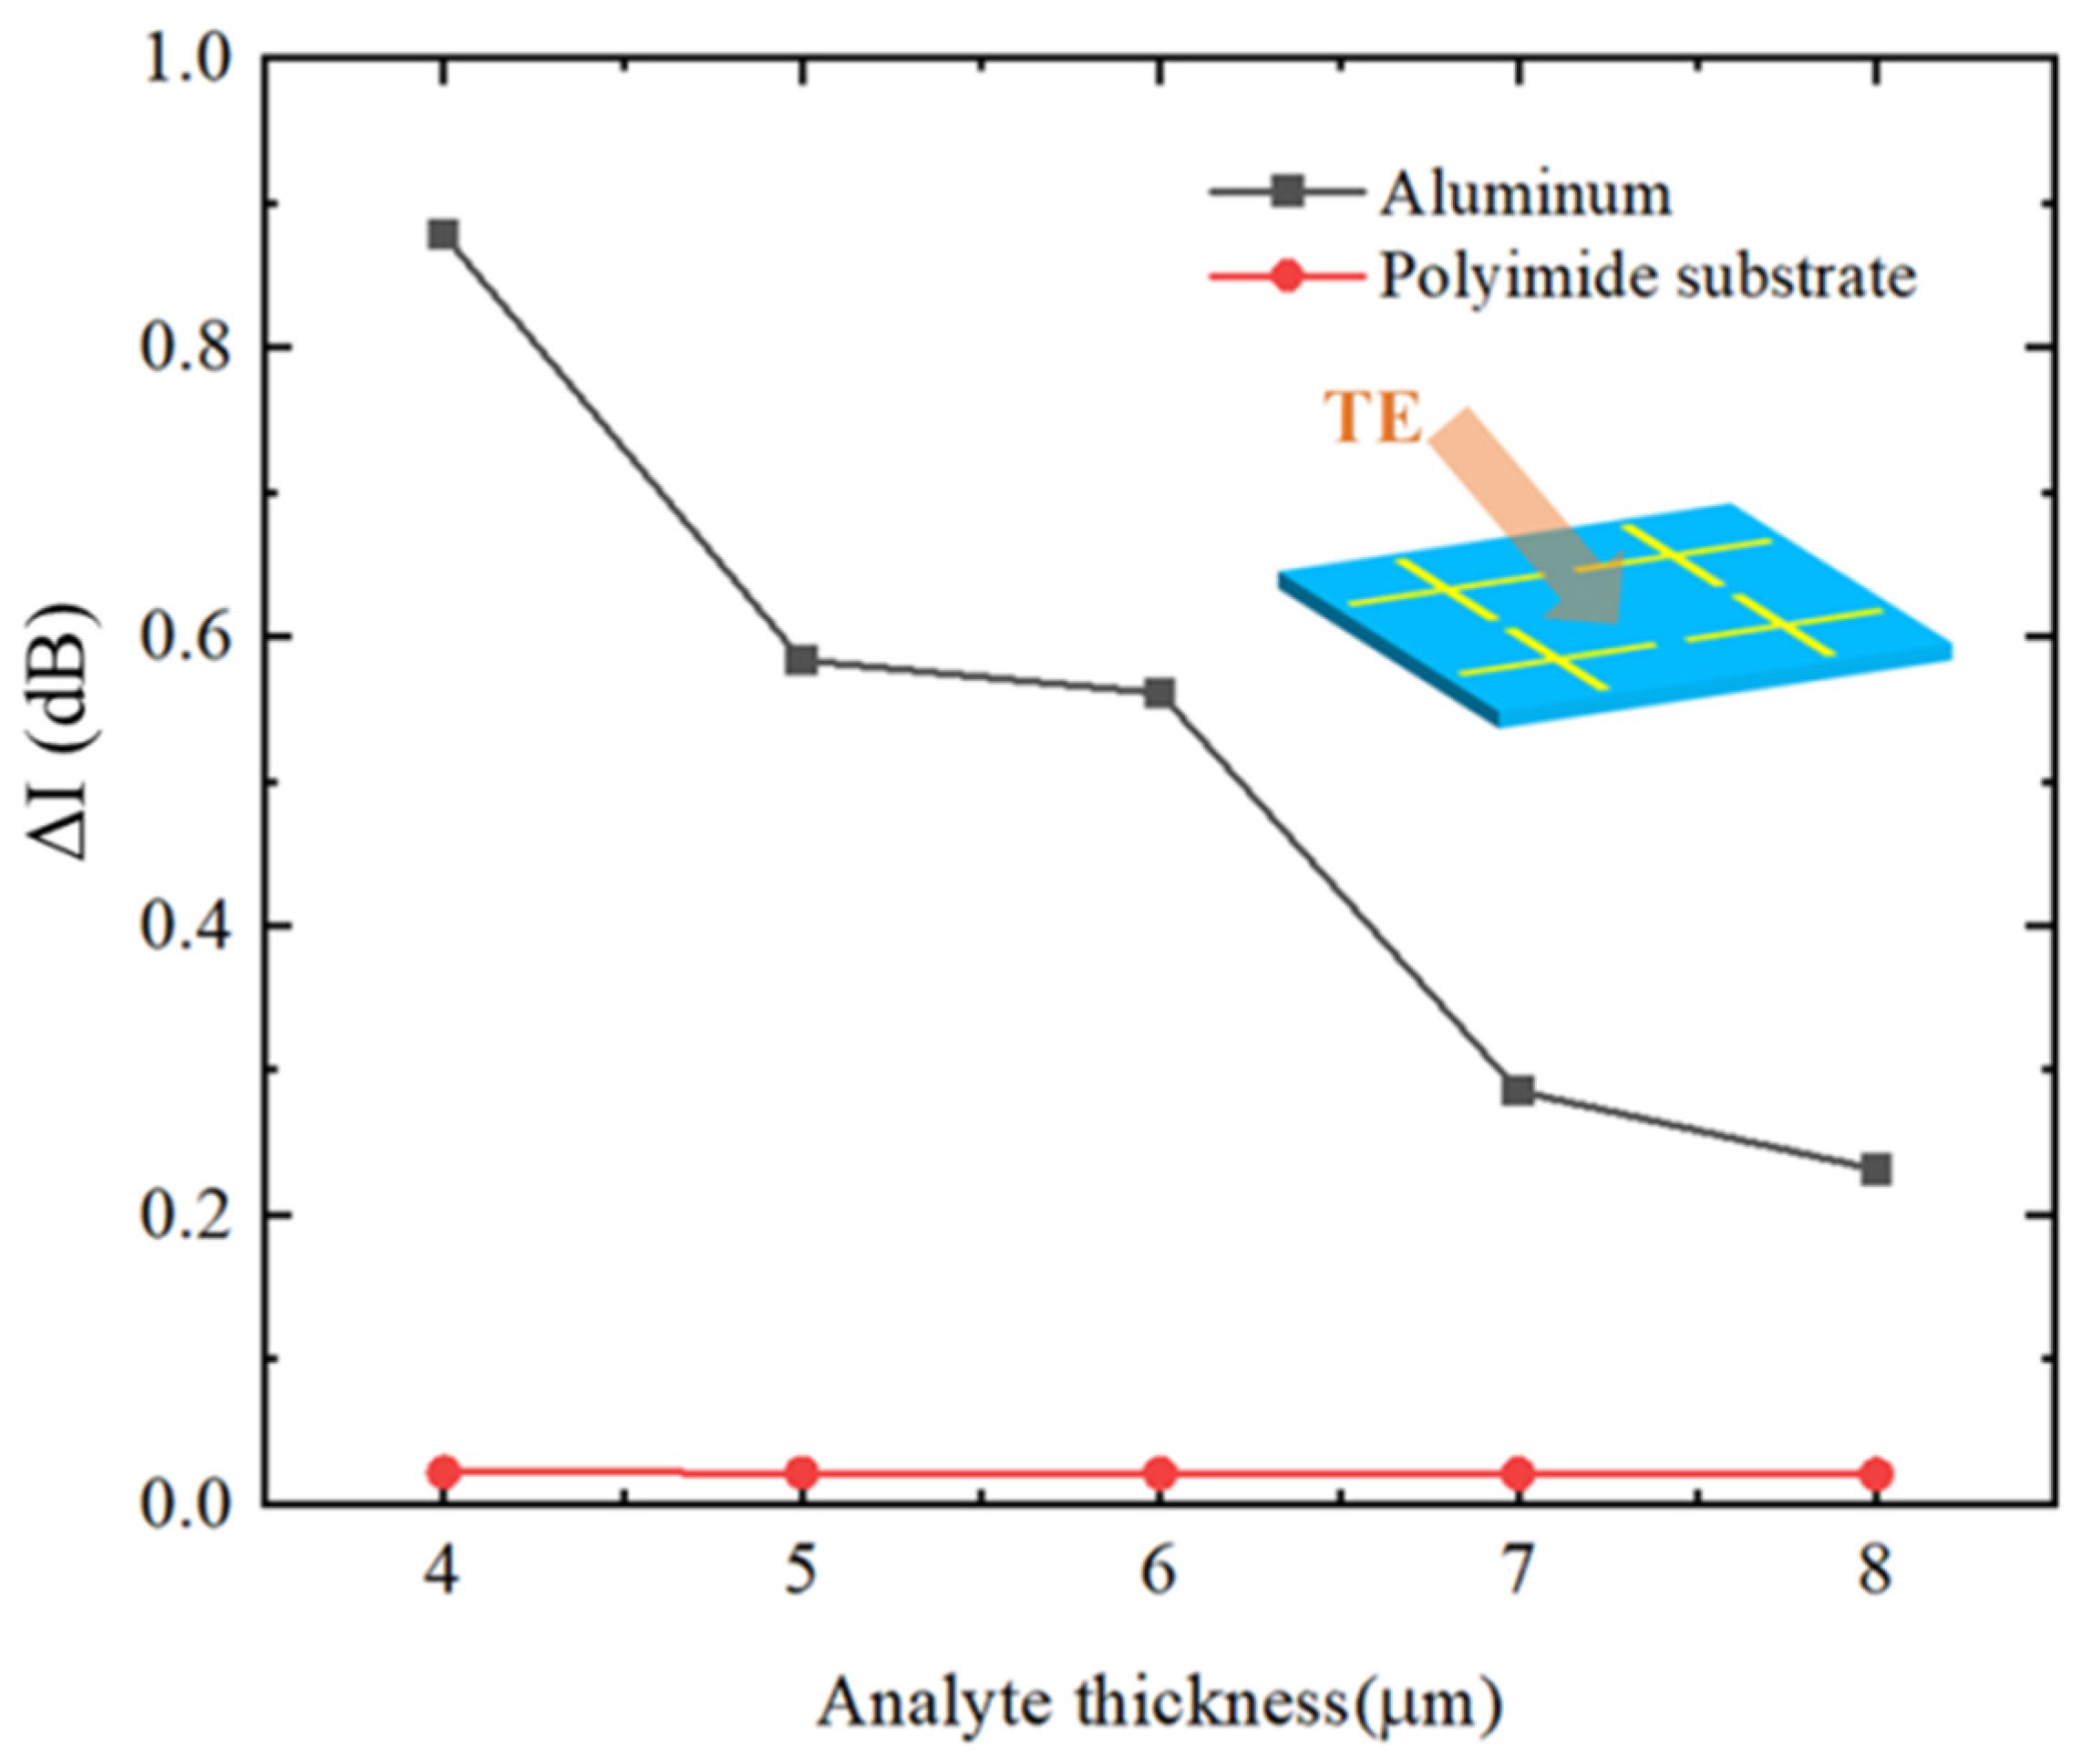
To gain a better understanding of the variation in transmission intensity with different benzoic acid thicknesses, we defined ΔI as the amplitude difference in transmission intensity at 0.93 THz for two adjacent benzoic acid thicknesses. As illustrated in
Figure 6, the amplitude of the transmission spectra at 0.93 THz remained nearly constant when benzoic acid was added to the bare polyimide substrate. However, a significant decrease in the amplitude change was observed when benzoic acid was added to the proposed metasurface sensor.
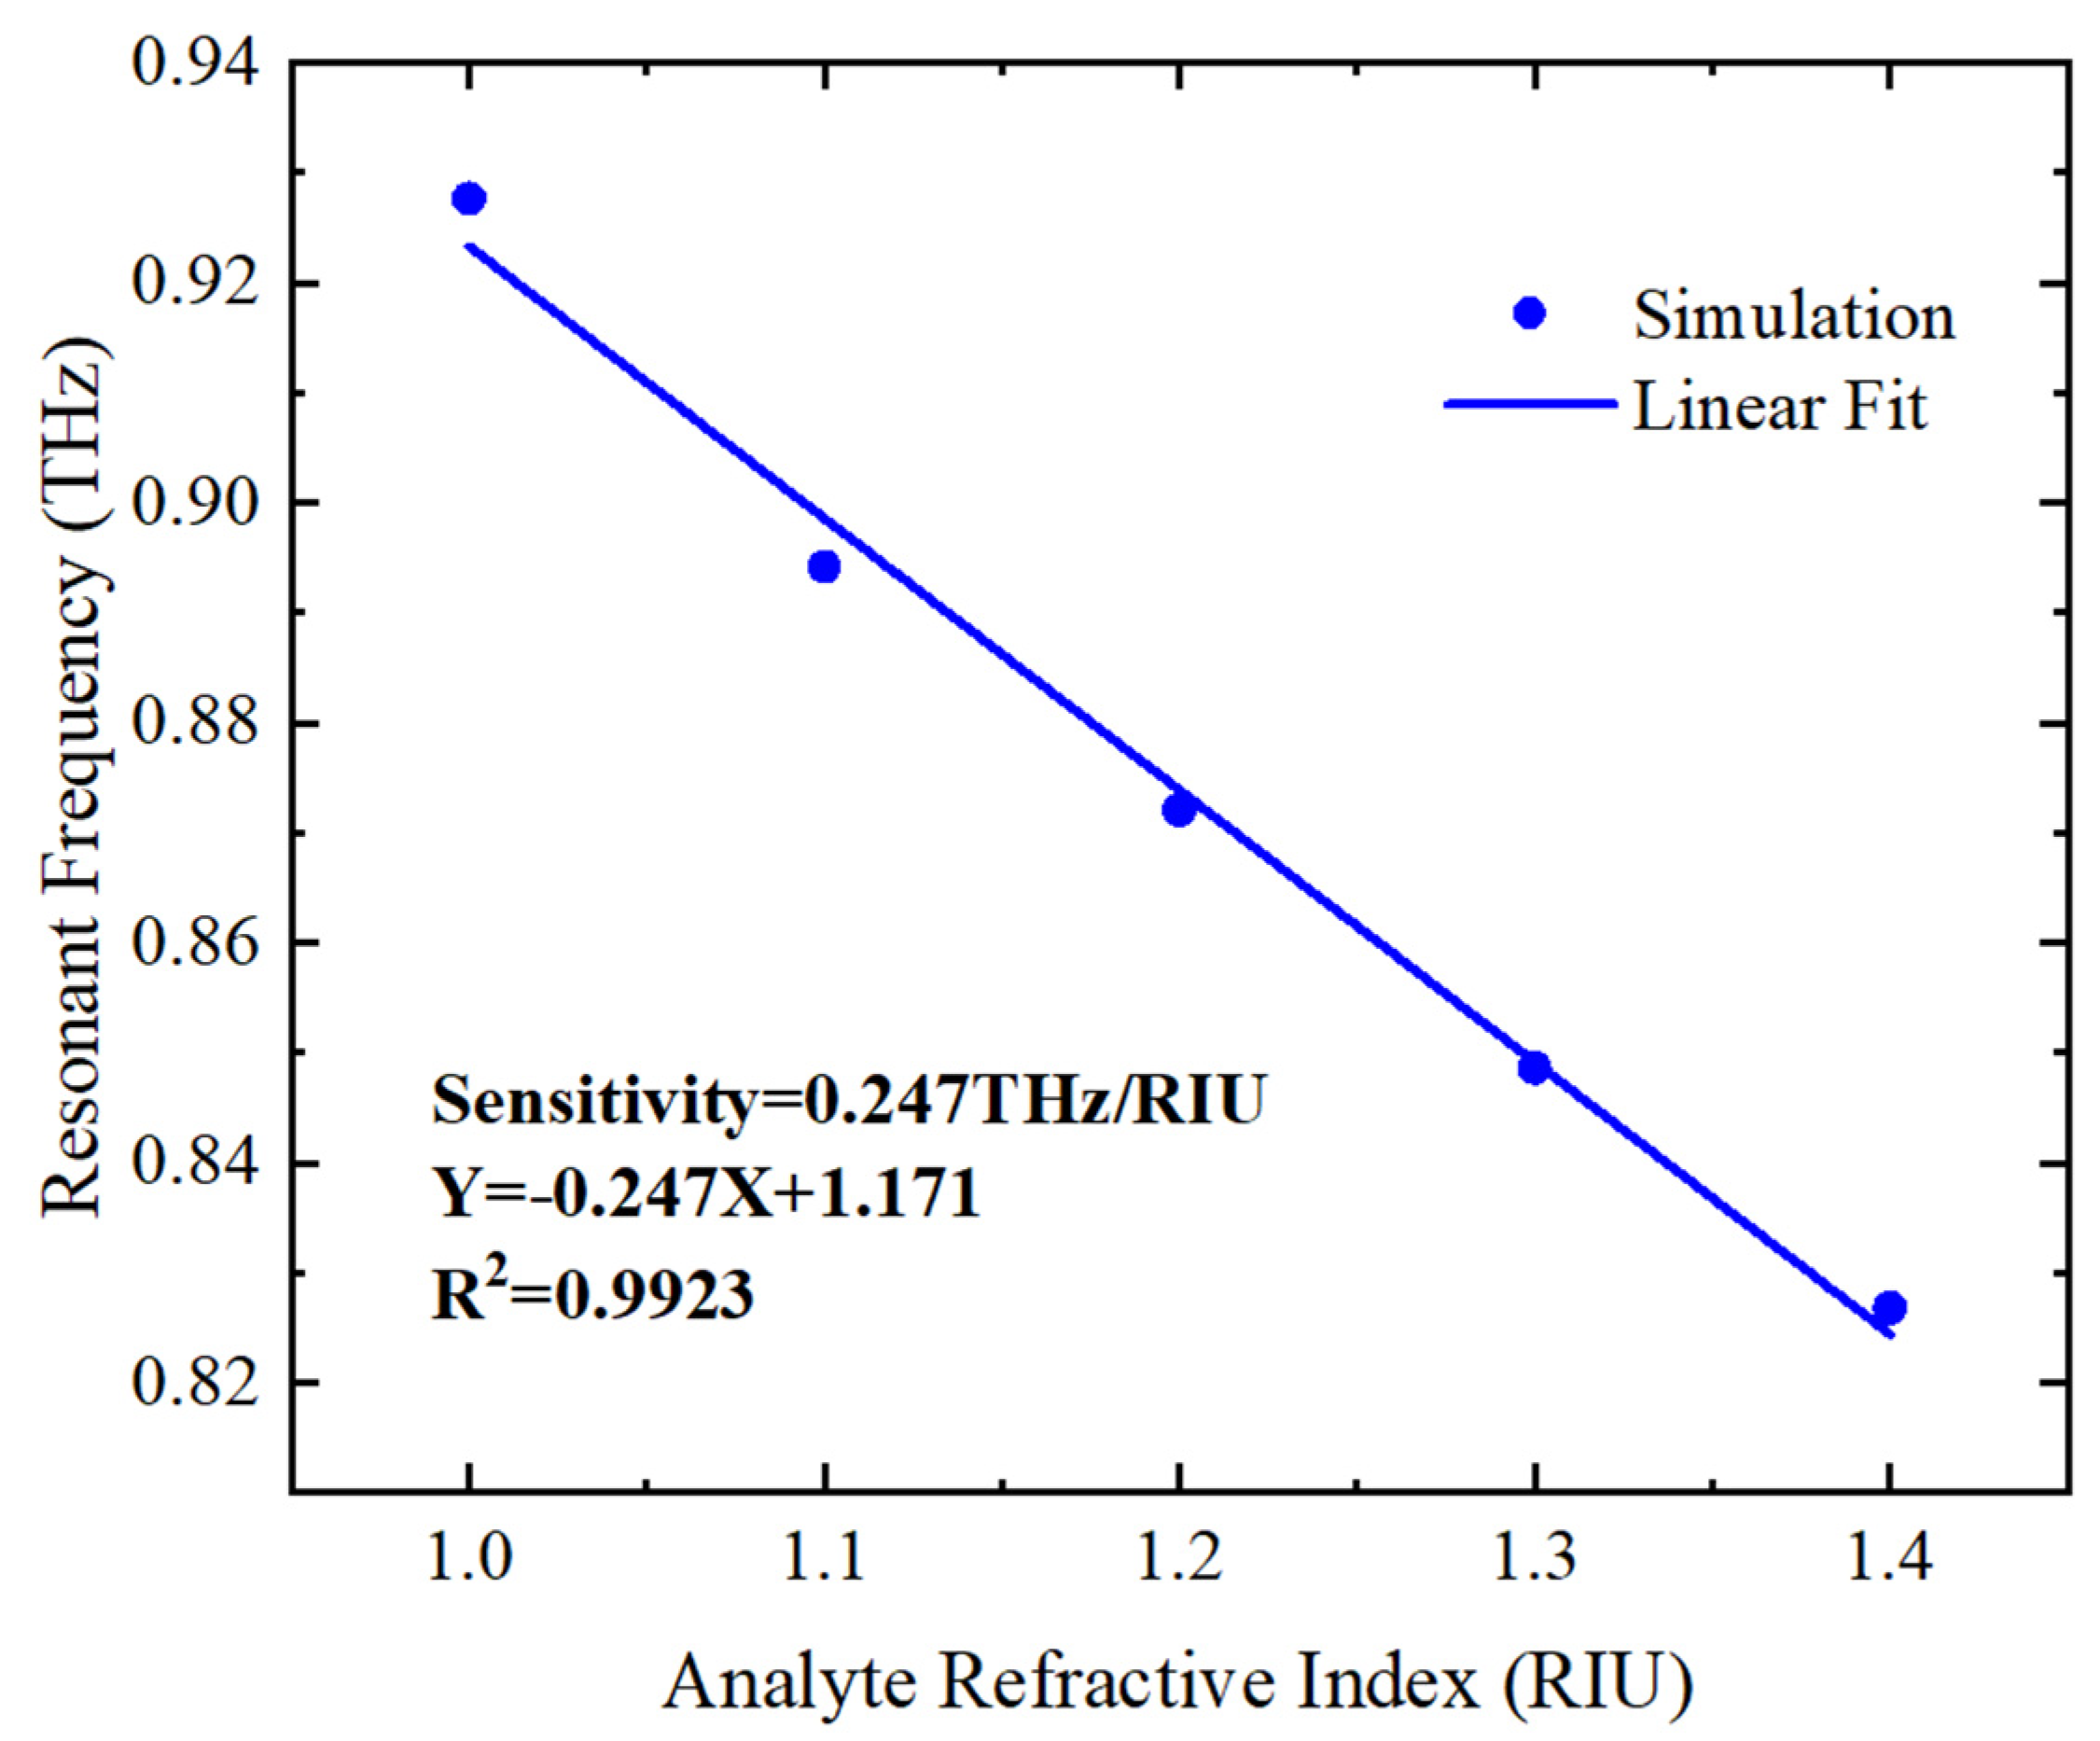
Figure 7 illustrates the linear shift in the simulated transmission peak frequency of the proposed metasurface sensor as the refractive index is varied from 1 to 1.4 in increments of 0.1. The cross-shaped metamaterial structure designed in this study obtained an R
2 value of 0.9923 in simulation, which is close to 1. This indicates a high level of model fit between the simulated benzoic acid thickness and the transmission spectrum, and suggests that the model is reliable and stable. To measure sensing capability, the sensor’s sensitivity (S) was determined by evaluating the ratio of the shift frequency of the transmission peak to the refractive index unit (RIU), a standard metric [
17].
Based on the linear fit depicted in
Figure 6, the sensor’s sensitivity is roughly 0.247 THz/RIU. Additionally, the sensing performance can be assessed using the figure of merit (
FOM), expressed as [
16]:
Our proposed structure’s figure of merit (
FOM) can be estimated as approximately 3.927, with
FWHM representing the full width at half maximum of the transmission spectra, which is approximately 0.0629 THz. The sensitivity and
FOM of the proposed metasurface sensor are contrasted with those of other sensors [
9,
10,
11,
18] in
Table 1.
4. Discussion
Here’s why we chose the cross structure. Firstly, the cross-shaped structure can adjust its resonance frequency and resonance peak intensity by adjusting its geometric parameters. Compared with other structures, the geometric parameters of the cross-shaped structure are easier to optimize, thus achieving higher detection sensitivity and selectivity. Secondly, the cross-shaped structure has higher symmetry and periodicity, which allows for better controllability and repeatability of its optical response. Finally, the cross-shaped structure is relatively simple to fabricate, and can be produced using conventional photolithography and etching processes. In summary, we believe that the cross-shaped structure as the basic unit of the metamaterial chip has multiple advantages, including easier optimization of geometric parameters, higher symmetry and periodicity, and simpler fabrication processes. We considered multiple factors in the design and ultimately chose the cross-shaped structure.
Based on the above theory and simulation, we found that the supermaterial chip composed of polyimide and aluminum designed in this study has the characteristics of low cost, high sensitivity, and easy preparation when applied to the detection of benzoic acid. Here, we provide the specific processing technology of the chip as follows: 1. Select an appropriate size polyimide substrate and wash its surface with deionized water. 2. Deposit a 4 μm thick aluminum film on the surface of the polyimide substrate by physical vapor deposition. 3. Coat the aluminum film surface with a layer of photoresist and use a photolithography machine to develop a cross-shaped pattern on the surface of the photoresist. 4. Use etchant to remove the unprotected aluminum film to form a cross-shaped structure. 5. Clean the etched chip with deionized water and acetone solvent, and dry it in a drying oven.


