Communication

Topological Charge Measurement of a Partially Coherent Vortex Beam Using Dual Cylindrical Lenses with an Arbitrary Angle

1
School of Physical Science and Technology, Soochow University, Suzhou 215006, China
2
School of Physics and Electronics, Shandong Normal University, Jinan 250014, China
3
Shandong Provincial Engineering and Technical Center of Light Manipulation & Shandong Provincial Key Laboratory of Optics and Photonic Devices, School of Physics and Electronics, Shandong Normal University, Jinan 250014, China
*
Author to whom correspondence should be addressed.
Photonics 2023, 10(4), 444; https://doi.org/10.3390/photonics10040444
Submission received: 21 March 2023 / Revised: 5 April 2023 / Accepted: 11 April 2023 / Published: 13 April 2023
(This article belongs to the Special Issue Advances and Application of Structured Light)

Abstract

:
For a partially coherent Laguerre–Gaussian (PCLG) vortex beam, information regarding the topological charge (TC) is concealed in the cross-spectral density (CSD) function phase. Herein, a flexible method for the simultaneous determination of the sign and magnitude of the TC for a PCLG vortex beam is proposed based on the measured CSD amplitude and phase after the beam propagates through a dual cylindrical lens with adjustable angles. Both the stripes in the CSD amplitude and phase exhibit quantitative relationships with the value of TC, that is, N = 2 l + 1 . Meanwhile, the angle adjustability of cylindrical lenses allows flexible measurements, thus rendering the scheme effective for both high and extreme coherences.

1. Introduction

The vortex beam is characterized by the helical distribution of isophase lines along the azimuth angle, and the convergence of the isophase lines depends on the coherence singularities [1]. The phase of spiral wavefronts can be described as exp(i), where l and φ represent the topological charge (TC) and azimuth coordinate, respectively. TC l is typically an integer that can be defined as the number of turns of phase twists at a specified wavelength. The sign of l depends on the rotation direction of the phase; a larger l value indicates that light rotates faster along the optical axis. In 1992, Allen et al. [2] hypothesized that each photon of a vortex beam exhibits an orbital angular momentum (OAM) with a value of lħ (ħ is the reduced Planck constant), thus revealing the relationship between macroscopic optics and quantum effects. Hence, optical vortices are widely used in optical micromanipulation [3,4,5], large-capacity optical communication [6,7,8], super-resolution imaging [9,10], nanostructures [11], artificial spin ice systems [12], spin measurement of M87 black holes [13], and ptychographic imaging of highly periodic structures [14].
However, high spatial coherence causes adverse factors, such as speckles, wandering, and scintillation, in turbulence media [15]. Gori et al. [16] introduced a vortex structure into a partially coherent beam. Compared with fully coherent fields, partially coherent fields are advantageous in complex media propagation [17,18] and exhibit a higher signal-to-noise ratio. In addition, some partially coherent vortex beams exhibit unique propagation properties, such as self-focusing, self-splitting, and self-remodeling effects [19,20,21], which can result in a lower bit error rate in photon communication. For a partially coherent vortex beam with a Shell model, such as a partially coherent Laguerre–Gaussian (PCLG) vortex beam, the vortex structure, which features a dark core and bright rings, vanishes as the coherence decreases and beam propagates. By regulating parameters such as the coherent width and TC, the light intensity can be modulated into hollow, flat top, and Gaussian distributions. These diverse beam-shaping capabilities have promoted the development of particle-manipulation techniques.
The accurate and rapid detection of the TC is extremely important owing to the close relationship between the application of the vortex beam and the properties of the TC or OAM. TC measurement schemes under fully coherent cases have been widely investigated in recent years [22,23,24], such as the Shack–Hartmann measurement [25], interferometry [26,27,28,29], and ptychography [30]. However, when the spatial coherence decreases, the interference and diffraction of the beam are no longer evident. Therefore, the TC of vortex beams with low coherence must be obtained [31,32,33,34]. Cylindrical lenses have been widely used to determine the TCs of coherent vortex beams [35,36]. For partially coherent vortex beams, Chen et al. [32] proposed a simple method to determine the magnitude and the sign of TCs by measuring the complex degree of coherence of a partially coherent vortex beam after it propagated through two mutually perpendicular cylindrical lenses. Lu et al. [33,34] proposed a method using self-reference holography to measure cross-spectral density (CSD) and obtained the magnitude and the sign of TCs from the number of coherence singularities. However, the quantitative relationships between bright fringes and TCs based on the cylindrical lens method are only valid for cases of extremely low coherence, whereas self-reference holography relies on the appropriate choice of reference point. Subsequently, the introduction of double slits allows one to observe coherence singularities with an on-axis reference point, whereas the double-slit scheme has only been validated in cases of medium coherence (coherence greater than 0.3 times the beam width) [34]. In addition, the light intensity is severely reduced by the double slits, thus resulting in noisy measurements.
In this study, we theoretically and experimentally investigate the evolution properties of the CSD amplitude and phase of a PCLG vortex beam after it propagates through two cylindrical lenses with varying angles. Combining the above with self-referencing holography [33,34], the CSD distribution of a PCLG vortex beam can be measured. The angle adjustability of the cylindrical lenses allows this scheme to be used in situations involving extremely low coherence and extremely high coherence cases. The quantitative relationship between the TC and CSD phase distributions is investigated, which determines the magnitude and the sign of the TC for the PCLG vortex beam.

2. Theory

Herein, the propagation of a PCLG vortex beam through a non-axisymmetric ABCD optical system, that is dual cylindrical lens system, is analyzed. For the convenience of understanding, a schematic diagram is presented in Figure 1. A PCLG vortex beam on the source plane passing through a dual cylindrical lens system (CL1 and CL2), the measurement plane is located on the defocus plane of CL2. The coordinates and symbols used in the following analysis are also marked.
For a monochromatic partially coherent beam, the second-order, two-point correlation of such a field E r , i.e., the CSD is defined as W r 1 , r 2 = E * r 1 E r 2 in the space-frequency domain [16]. E r is the electric field with random fluctuations and r 1 , r 2 are vector coordinates. Here, the asterisk “*” and the angle brackets 〈 〉 represent the complex conjugate and the ensemble average, respectively. The CSD of the PCLG vortex beam in the source plane can be expressed as [37].
W 0 r 1 , φ 1 , r 2 , φ 2 = 2 r 1 r 2 ω 0 2 l L p l 2 r 1 2 ω 0 2 L p l 2 r 2 2 ω 0 2 × e x p i l φ 1 φ 2 e x p r 1 2 + r 2 2 4 ω 0 2 e x p r 1 r 2 2 2 σ g 2
where r 1 , φ 1 , r 2 , φ 2 are the polar coordinates of r 1 , r 2 . ω 0 means the waist width on the source plane, σ g denotes the initial coherence width, and L p l represents the Laguerre polynomial with a radial mode index p and a TC of l. Subsequently, using the generalized Collins’ formula [38], the CSD of the PCLG vortex beam through a non-axisymmetric ABCD optical system composed of two cylindrical lenses can be obtained as follows:
W ρ x 1 , ρ y 1 , ρ x 2 , ρ y 2 = 1 / λ 2 B 1 B 2 W 0 x 1 , y 1 , x 2 , y 2 × exp i k 2 B 1 * A 1 * x 1 2 2 x 1 ρ x 1 + D 1 * ρ x 1 2 i k 2 B 2 * A 2 * y 1 2 2 y 1 ρ y 1 + D 2 * ρ y 1 2 × exp i k 2 B 1 A 1 x 2 2 2 x 2 ρ x 2 + D 1 ρ x 2 2 + i k 2 B 2 A 2 y 2 2 2 y 2 ρ y 2 + D 2 ρ y 2 2 d x 1 d x 2 d y 1 d y 2
where x 1 , y 1 and x 2 , y 2 correspond to r 1 and r 2 , respectively. ρ x 1 , ρ y 1 , ρ x 2 , ρ y 2 are the coordinates after the dual-cylindrical-lens system; and A 1 , B 1 , C 1 , D 1 , A 2 , B 2 , C 2 , and D 2 are the components of the transmission matrix of the dual cylindrical lens system. In fact, it can be obtained by multiplying the corresponding transmission matrices from the beginning to the end, i.e., in the order of free space, cylindrical lens, free space, cylindrical lens, and free space. The free space transmission matrix M F and the cylindrical lens matrix M C L can be expressed as:
M F = 1 0 z 0 0 1 0 z 0 0 1 0 0 0 0 1   and   M C L = I 0 Φ I
where 0 in bold denotes a 2 × 2 null matrix and I in bold denotes a 2 × 2 unit matrix. The matrix Φ is expressed as:
Φ = 1 f c o s 2 θ s i n θ c o s θ s i n θ c o s θ s i n 2 θ
where θ is the angle between each cylindrical lens and the y-axis, and f is the focal length of the cylindrical lens. In particular, an analytical solution for the vertical placement of a cylindrical lens can be obtained by applying Equation (5) into Equation (2) [32]. A1, B1, C1, D1, A2, B2, C2, and D2 can be calculated as follows:
A 1 0 B 1 0 0 A 2 0 B 2 C 1 0 D 1 0 0 C 2 0 D 2 = 1 l 0 + z f 1 0 s + z + z 0 z 0 f 1 ( s + z ) 0 0 1 z f 2 0 s + z + z 0 z 0 f 2 ( s + z 0 ) 1 f 1 0 1 z 0 f 1 0 0 0 0 1 s + z 0 f 2
where f1 and f2 are the focal lengths of the first and the second cylindrical lens, respectively; z0 denotes the distance between the source plane and the first cylindrical lens; and ‘s’ is the distance between two cylindrical lenses.

3. Simulation Results

Based on Equation (2), the CSD characteristics of a PCLG vortex beam through a non-axisymmetric ABCD optical system composed of two cylindrical lenses were simulated. The radial mode index p was set to 0 in the following analysis. The focal lengths of the cylindrical lenses were f1 = f2 = 200 mm, the propagation distance between the source field and the first cylindrical lens was z0 = 500 mm. Due to the size of the lens holder, the cylindrical lenses cannot be too close, so the distance between two the cylindrical lenses was s = 60 mm. During the focusing/defocusing process, the rotation of the vortex beam is related to the sign of TC, as discussed in [20]. Therefore, the distance from the second cylindrical lens to the detection plane was z = 300 mm. In addition, the beam waist width ω0 = 0.35 mm and the wavelength λ = 532 nm.
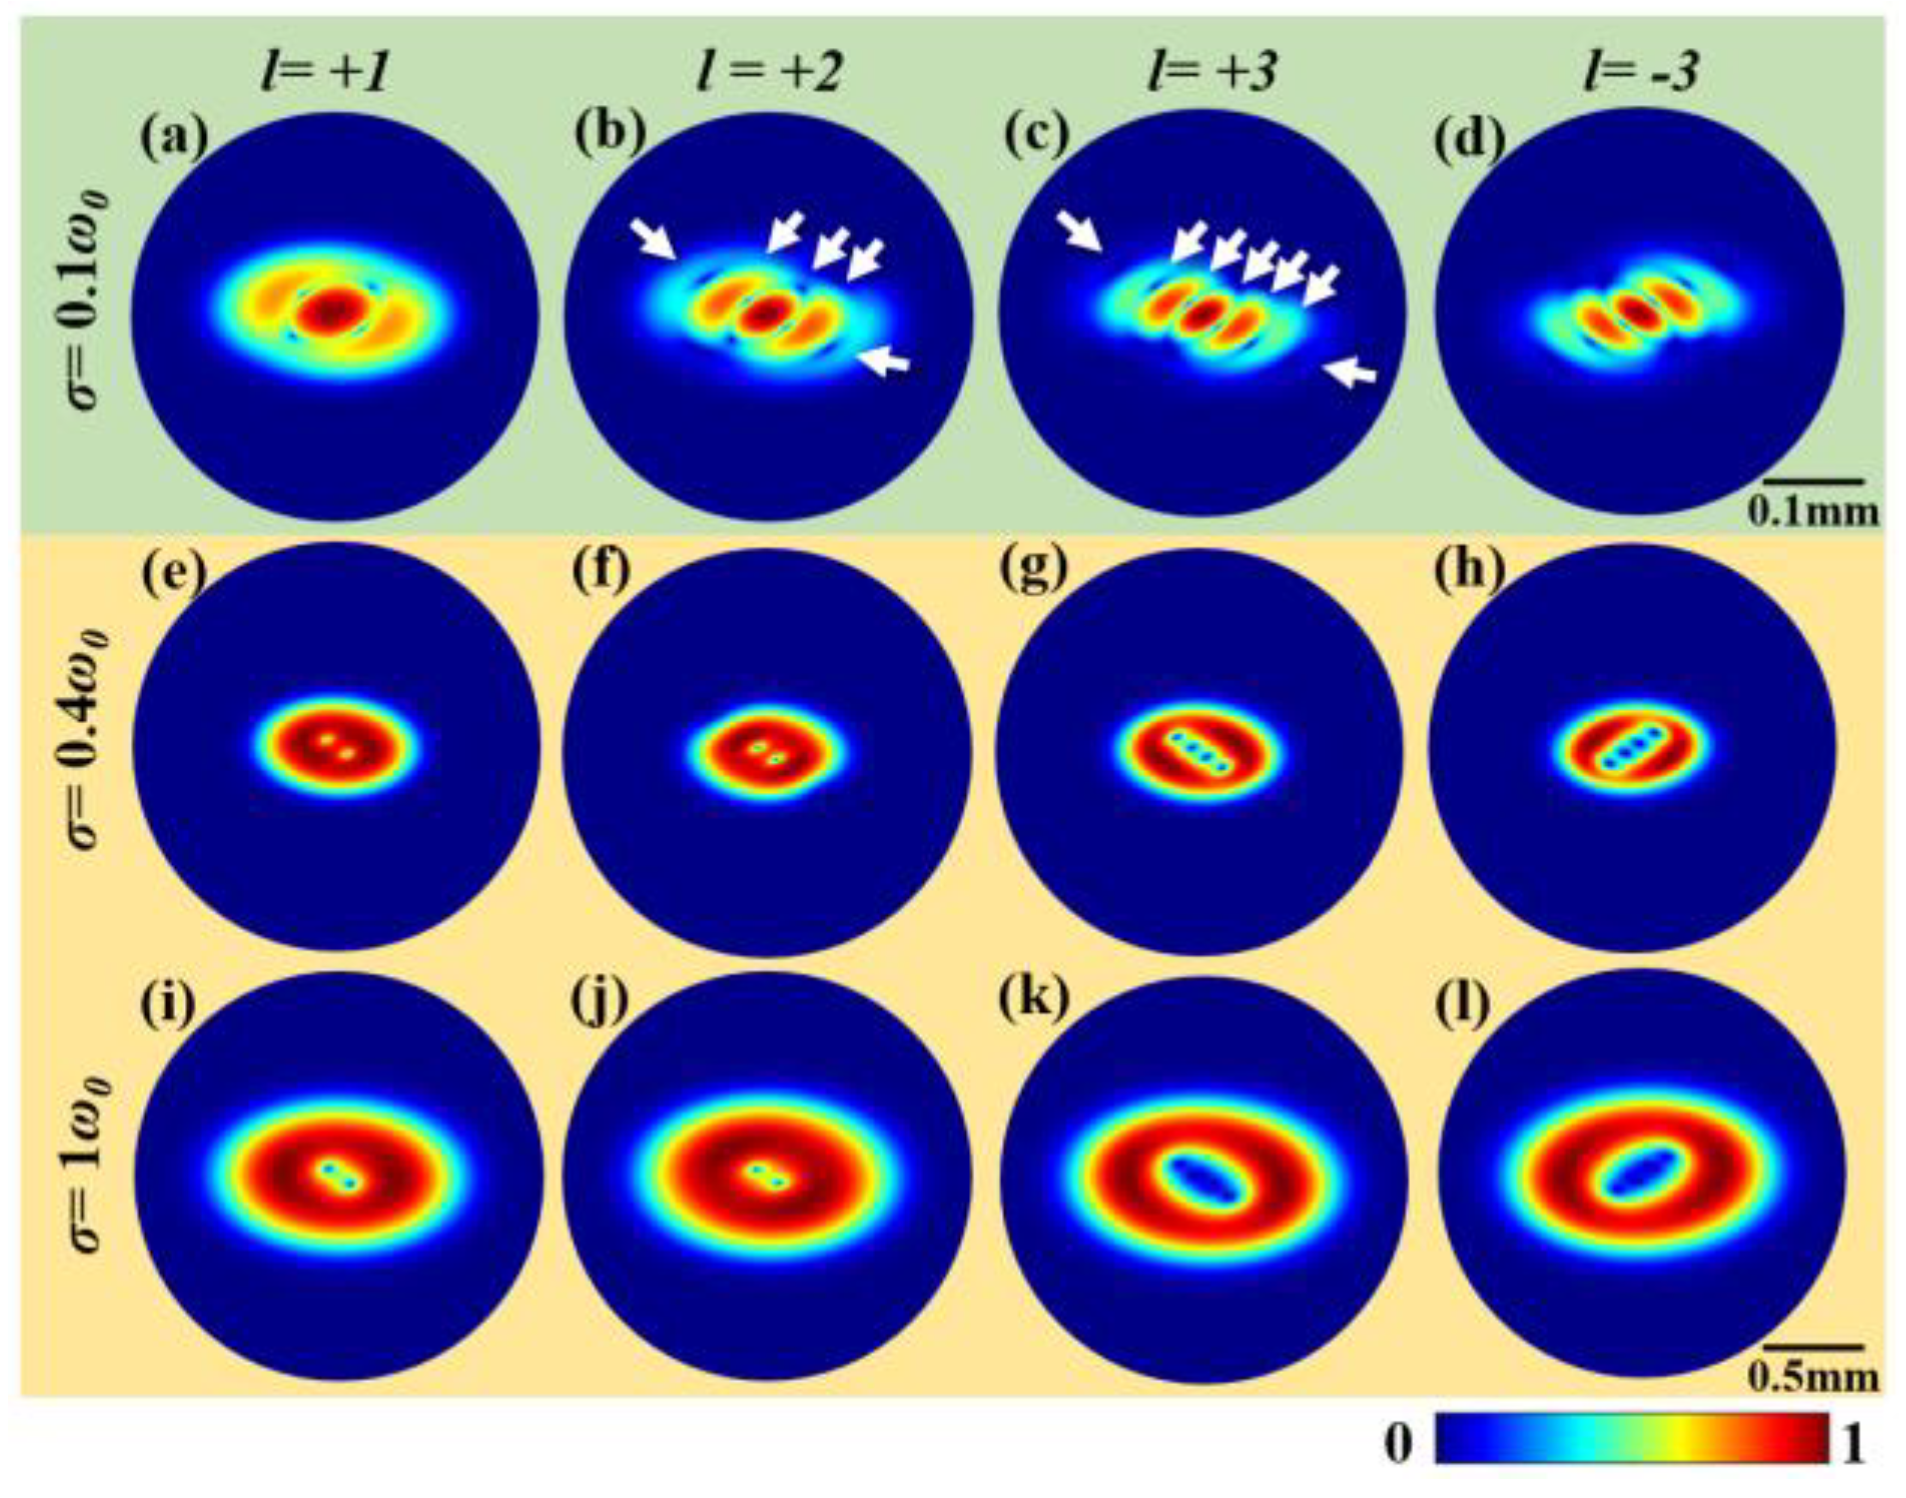
Figure 2 shows the theoretical CSD amplitude distributions with varying TCs under different initial coherence widths, i.e., σ g = 0.035, 0.14, and 0.35 mm, which correspond to extremely low coherence, medium coherence, and high coherence, respectively. The two cylindrical lenses were placed vertically. Here, the amplitude is shown based on an on-axis reference point ( ρ 2 x , ρ 2 y = 0 , 0 ) and the pattern is in log scale, i.e., log [ 1 + W ρ 1 x , ρ 1 y , 0 , 0 ]. The CSD amplitude exhibits anisotropy and presents a stripe distribution at extremely low coherence, i.e., σ g = 0.1 ω 0 , as shown in Figure 2a–d. For example, the bright stripes are denoted by white arrows in Figure 2b,c. The relationship between the number of bright stripes and TC is N = 2|l| + 1. Furthermore, a comparison between the cases of l = 3 and l = −3 indicates that the sign of the TC can be determined by the orientation of the CSD amplitude.
As the coherence increased, the CSD amplitude no longer exhibited a strip distribution, but singularities (i.e., dark dots) occurred [33]. However, the quantitative relationship between the number of singularities and the TC was not constant for different coherence cases. This is because the singularities exited from the amplitude envelope. Although the CSD phase can be experimentally measured (Section 4), the phase outside the amplitude envelope was noisy and difficult to distinguish. This implies that when the two cylindrical lenses are placed vertically, accurate TC measurements can only be achieved in the case of extremely low coherence. Therefore, the CSD distributions for different cylindrical lenses angles were investigated.
Currently, obtaining a final analytical solution for other included angles is difficult. Thus, in non-vertical cases, the CSD was numerically calculated using the random screen simulation method to avoid onerous integral operations [39]. Figure 3 presents the numerical simulation results of the CSD amplitude of the PCLG vortex beams; the parameters are the same as those used in Figure 2. These results agreed well with the theoretical calculations shown in Figure 2. A comparison of the analytical (Figure 2) and simulation results (Figure 3) for the case of 90° confirmed the accuracy and effectiveness of the random-screen simulation method presented in [39]. The speckle noise outside the central region was caused by the speckle superposition applied in numerical simulation. The positions of the singularities shown in Figure 2 and Figure 3 mirrored each other, except for l = +3 (Figure 3k) and l = −3 (Figure 3l). This error was similarly caused by the speckles applied in the simulation. In particular, for the on-axis reference case, the singularity distribution was easily perturbed.
We further investigated the effect of the cylindrical lenses angle on the CSD distribution. As shown in Figure 4, the CSD phase and amplitude were simulated, with σ g = 0.4 ω 0 , l = ± 2, and different cylindrical lenses angles. When the angle decreased gradually from 90° to 0°, the singularities in the CSD amplitude evolved gradually into stripes. In particular, between 30° and 60°, the relationship between the number of stripes and the TC was N = 2|l| + 1. In contrast to the amplitude, the CSD phase showed a dumbbell-like shape, and the total number of “dumbbell pieces and handles” (marked with arrows) obeyed the relationship N = 2|l| + 1. In particular, when the angle was approximately 30°, the phase relationship was more evident than that in the amplitude pattern, although the amplitude was shown on a log scale. Thus, the magnitude of the TC was easier to distinguish and determine from the CSD phase pattern with an angle of 30°.
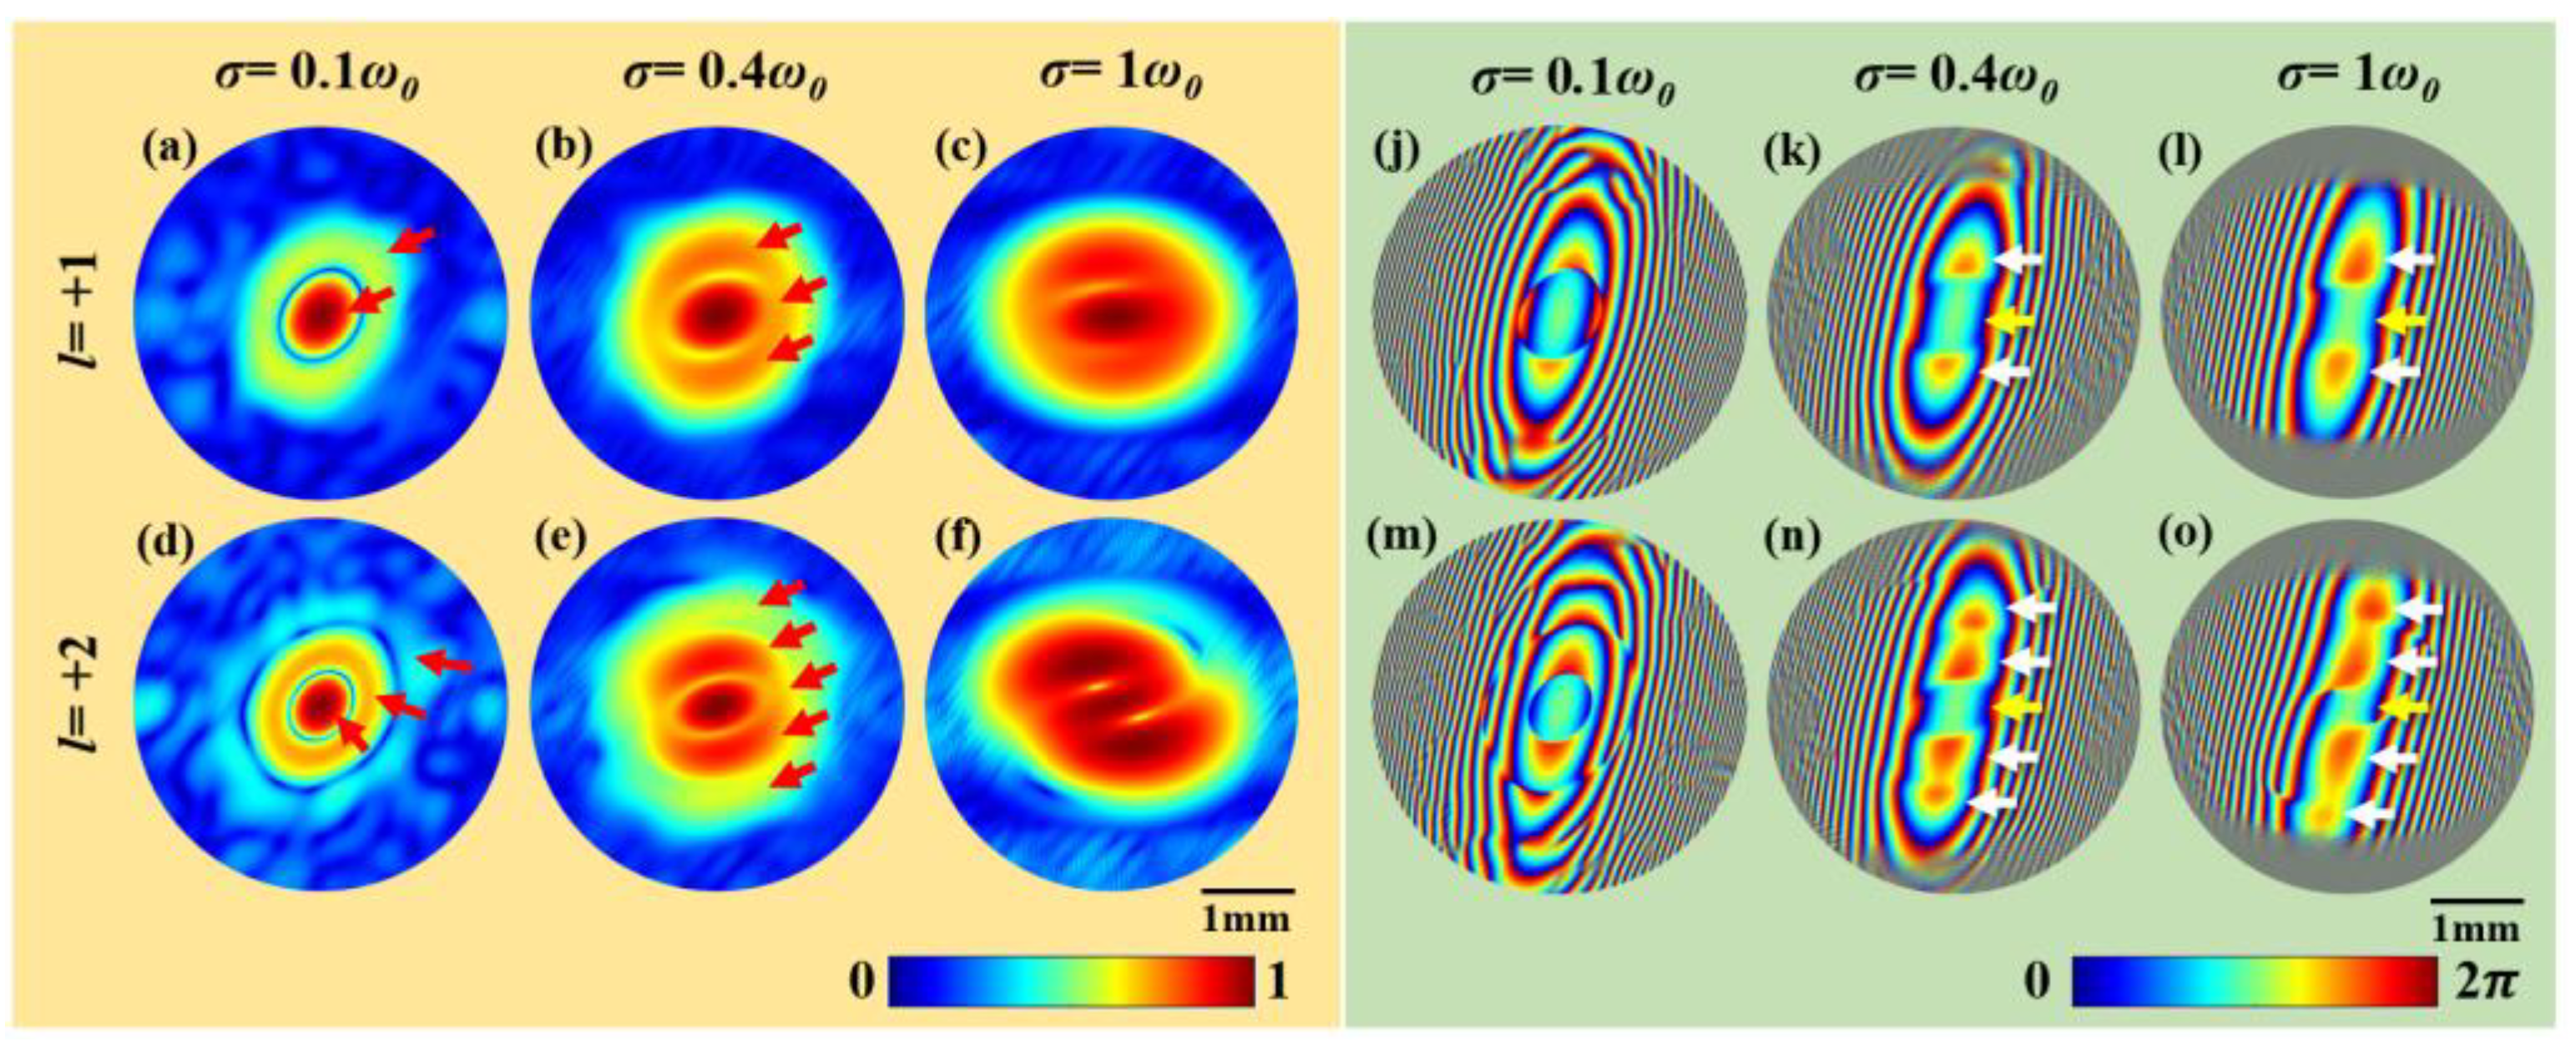
Figure 5 shows the numerical simulation results of the CSD amplitude and phase for different TCs and coherence widths when the included angle of two cylindrical lenses was 30°. The number of stripes or rings in the CSD amplitude (Figure 5a–f) did not show a clear relationship with the TC. In comparison, the number of “dumbbell pieces and handles” in the phase pattern indicated a more reliable relationship, i.e., N = 2|l| + 1. For the case of extremely low coherence, i.e., σ g = 0.1 ω 0 , N can be determined by analyzing the dark rings in the CSD amplitude whose number equal to the TC. Additionally, CSD phase measurements for cylindrical lenses angles of 90° and 30° could be performed to double check the measurement of the TC. In fact, this is the main highlight of this study as the flexible and adjustable angle of the dual cylindrical lens system allows this scheme to be used in both extremely low coherence and extremely high coherence scenarios.

4. Experiment

Verification of effectiveness of the proposed scheme. A self-reference holography method was introduced to measure the CSD amplitude and phase [33,40]. The target plane was the output plane of the dual cylindrical lens system, where the transmission function A ρ was introduced. Here, A ρ is a square window function, which is used to limit the field-of-view. Subsequently, a Fourier lens was used to focus the beam on the recording plane where the intensity can be expressed as [40]:
I 0 k = W ρ 1 , ρ 2 A ρ 1 A * ρ 2 × exp i 2 π k ρ 1 ρ 2 d ρ 1 d ρ 2
Here, ρ and k represent the coordinates of the reconstructed plane and recorded planes, respectively. Subsequently, a perturbation point, whose size is significantly smaller than A ρ , is introduced at ρ = ρ 0 . The previous transmission function A ρ evolves into A ρ + P · δ ρ ρ 0 ,where P is a complex value and δ · is the Dirac function. After loading the perturbation point, the intensity on the recording plane can be expressed as:
I k = W ρ 1 , ρ 2 × A ρ 1 + P δ ρ 1 ρ 0 × [ A * ρ 2 + P δ ρ 2 ρ 0 ] * exp i 2 π k ρ 1 ρ 2 d ρ 1 d ρ 2
The inverse Fourier transform of I ( k ) I 0 ( k ) yields.
F 1 I k I 0 k = P × [ W ρ ρ 0 , ρ 0 A ρ ρ 0 ] * + P * × W ρ + ρ 0 , ρ 0 A ρ + ρ 0
Subsequently, two other different perturbations with values of P + / are introduced, respectively, to the PCLG vortex beam. Finally, in total three intensities are obtained, i.e., I + , I , and I 0 . By solving Equation (8) and applying a coordinate shifting, the final expression of the CSD to be measured can be written as:
W ρ , ρ 0 = F 1 P I + k I 0 k P + I k I 0 k P + * P P * P +

4.1. Experimental Setup

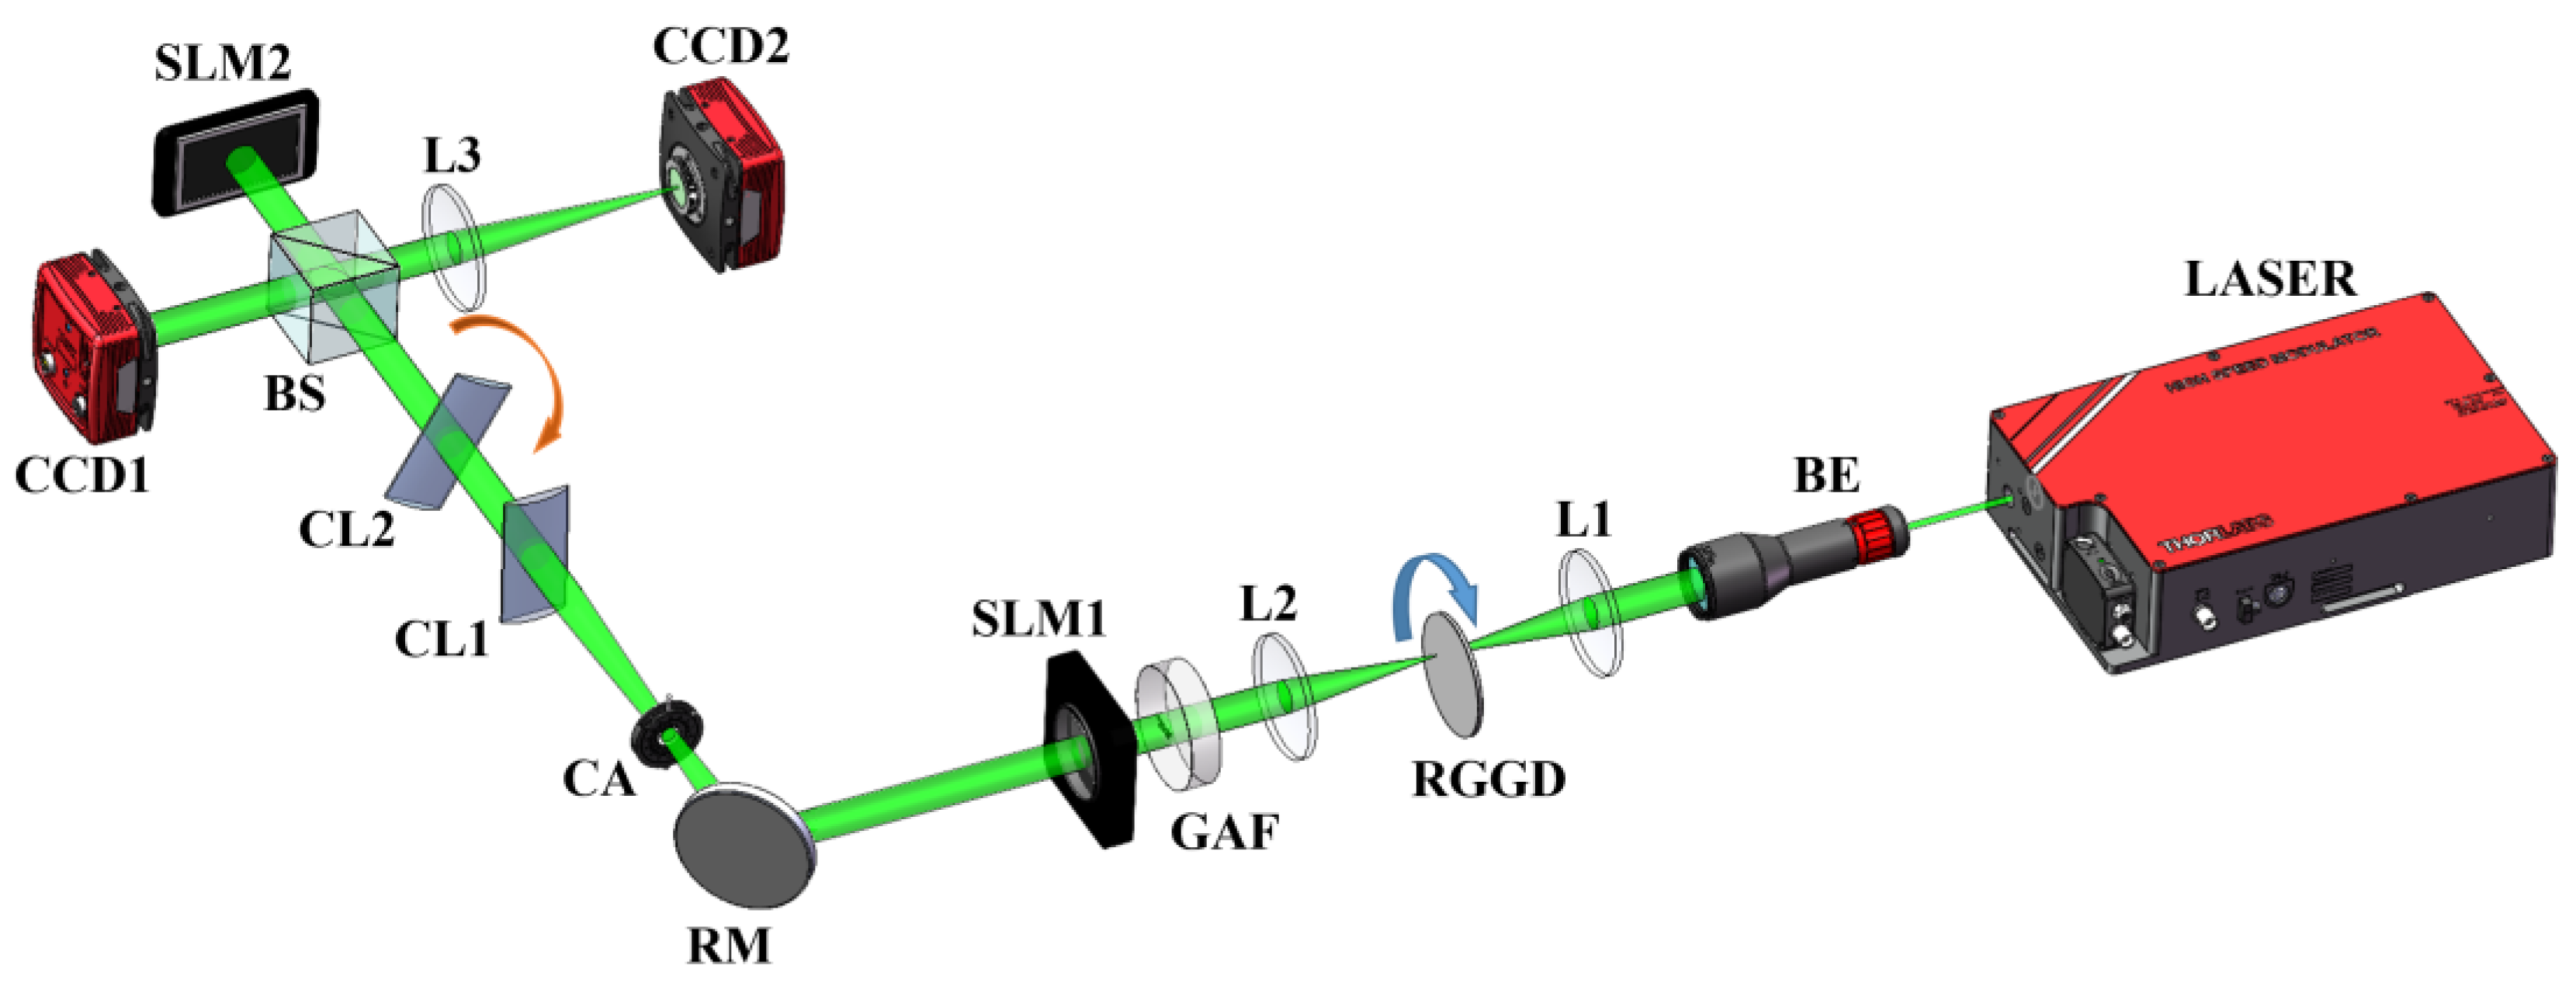
The experimental setup for generating and measuring the PCLG vortex beam is shown in Figure 6. A coherent laser beam was emitted from a pumped solid-state laser (λ = 532 nm) and extended using a beam expander. After passing through lens L1 (f = 100 mm), the expanded beam was focused onto a rotating ground-glass disk. Based on the van Cittert–Zernike theorem, a partially coherent beam was generated after the collimated lens L2 (f = 100 mm). The coherence width is related to the size of the light spot on the rotating ground-glass disk. The larger the spot size, the lower the coherence. After the Gaussian amplitude filter and a transmitted space light modulator (SLM, 1024 × 768 pixels with pixel size = 18 µm) loaded with a computer-designed hologram, a linearly polarized PCLG vortex beam was obtained [34]. Subsequently, a circular aperture was used to filter out the useless diffraction orders.
Subsequently, the PCLG vortex beam propagated through two cylindrical lenses (CL1 and CL2), and the beam splitter split the beam into two paths. One path was directed toward the first camera (CCD1), which was used to monitor the intensity distribution, and the other path illuminated a phase-only SLM (SLM2, 3840 × 2160 pixels with pixel size = 3.74 µm), which was used to load the window function and perturbations. The distance from CL2 to SLM2 was the same as that from CL2 to CCD1, that is, z = 300 mm. The perturbation point was significantly smaller than the field-of-view (e.g., 1/10). The perturbation values were set as P+ = exp(2iπ/3), P = exp(−2iπ/3), and 0 (i.e., no perturbation), and the corresponding intensities, i.e., I+, I, and I0, respectively, were captured by CCD2 placed at the back focal plane of L3 (f = 300 mm).

4.2. Experimental Results and Discussions

Figure 6 shows the experimental result of the PCLG vortex beam’s CSD amplitude and phase with medium coherence width (σg = 0.4ω0), TC = −2, and different cylindrical lenses angles. When the cylindrical lenses angle was changed, the CSD amplitude and phase differed. Stripes were observed in the amplitude, and their quantity is expressed as N = 2|l| + 1. As predicted from the simulation (Figure 4), dumbbell-like phase patterns were observed, particularly at 30° (Figure 7b,f). The number of “dumbbell pieces and handles” obeyed N = 2|l| + 1. Compared with the amplitude distribution, the TC magnitude can be determined more intuitively from the phase patterns.
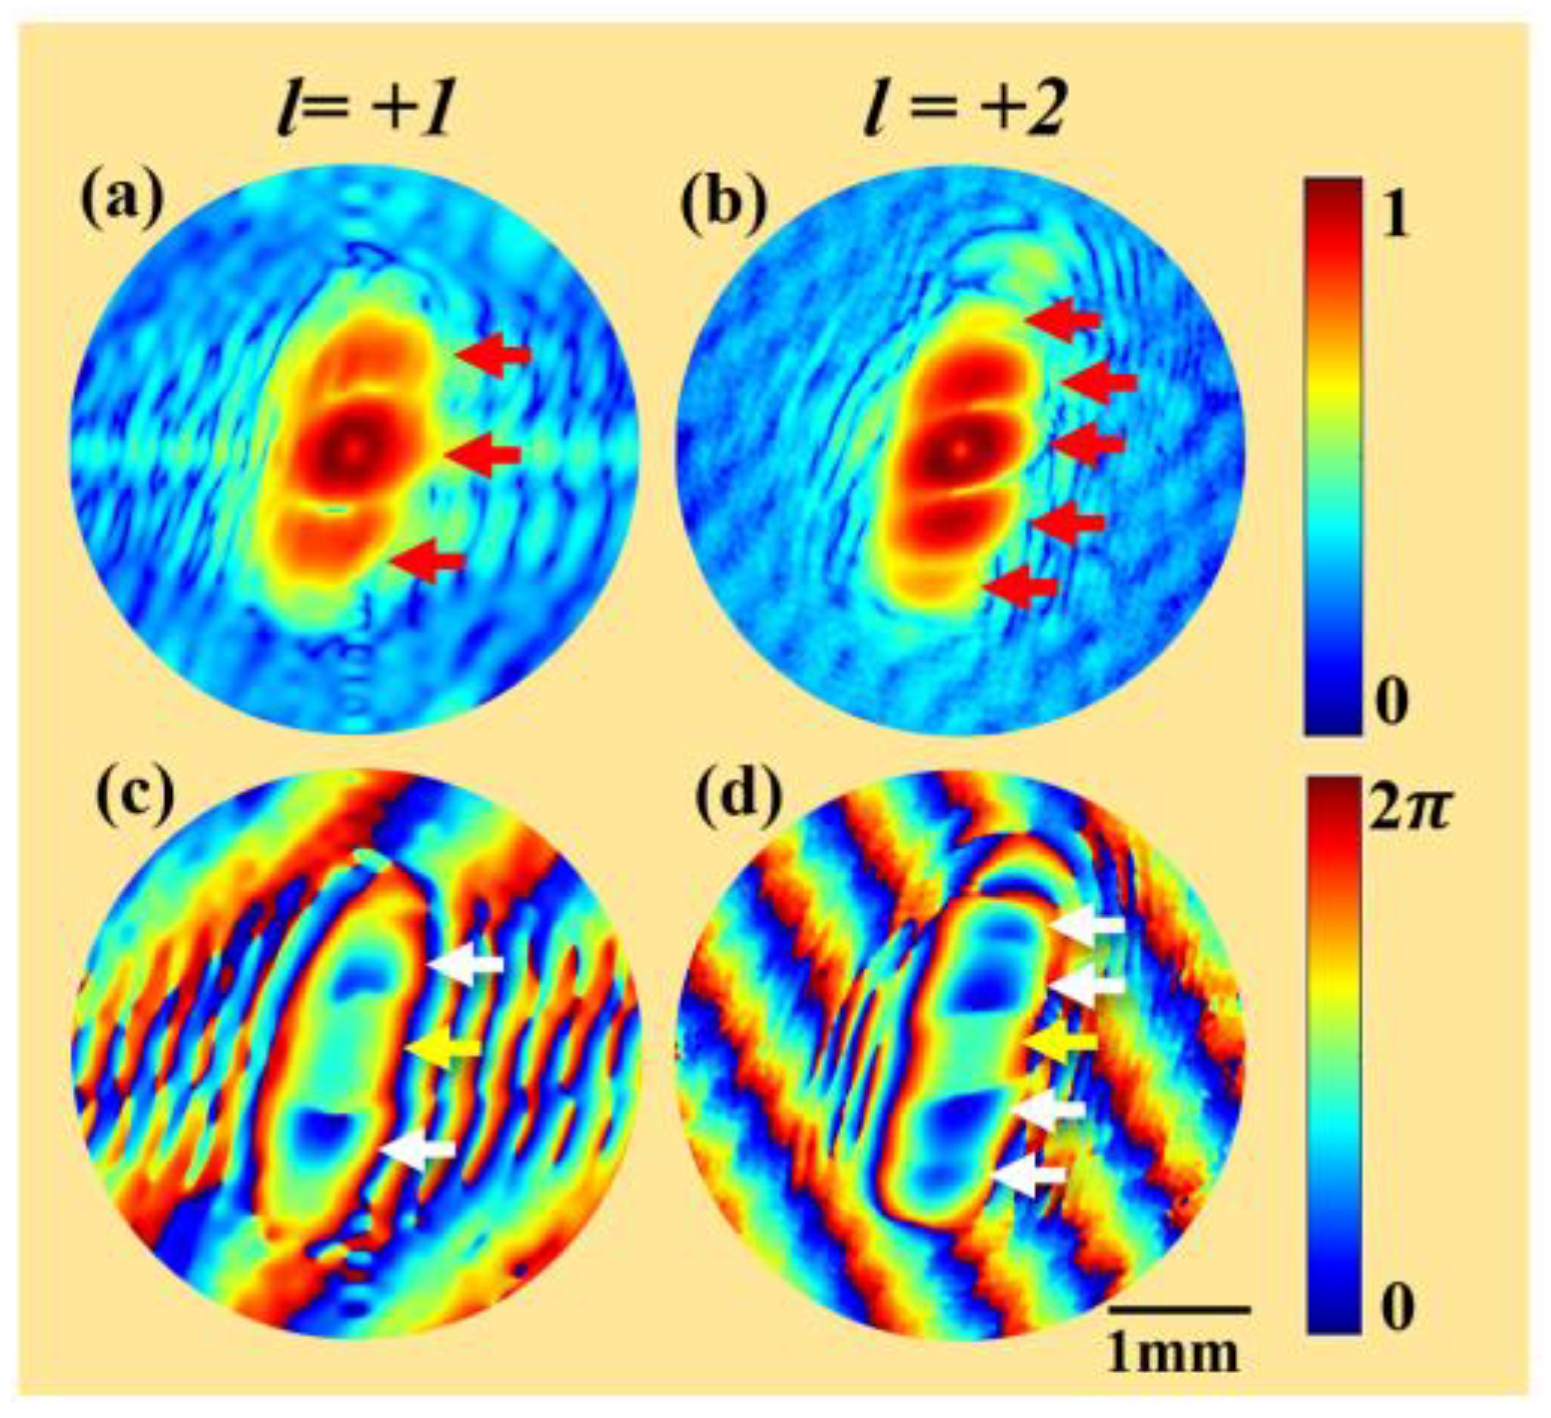
Finally, we experimentally measured the CSD amplitude and phase of the PCLG vortex beam with l = +1 and l = +2. The coherence width was σg = 0.4ω0 and the cylindrical lenses angle was 30°. Figure 8 shows that the relationship between the number of stripes and the TC can be expressed as N = 2|l| + 1, which is consistent with simulation results shown in Figure 5. In the phase distribution, the number of ‘dumbbell piece and handle’ in the phase pattern also obeyed N = 2|l| + 1 for different TCs. Quantitative relationships based on the CSD amplitude or phase distributions allow one to determine the magnitude and sign of the TC in the PCLG vortex beam.

5. Discussions

This study provides a general scheme for the TC measurement of a PCLG vortex beam, which includes cases of coherence from extremely low to extremely high. It is suggested that when the coherence and TC are unknown, one can study both the CSD amplitude and phase. If the CSD amplitude exhibits stripes rather than singularities, it indicates a low degree of coherence, and the TC can be determined based on the number of bright stripes. If the CSD amplitude exhibits singularities rather than stripes, it indicates a medium or high degree of coherence. At this time, the number of visible singularities has no evident relationship with TC, while the number of “dumbbell” structure in CSD phase at 30° obeys N = 2|l| + 1.
In addition, this scheme works well for low TC. After propagation, the singularities were concealed in the CSD function. However, as the coherence decreased, the singularities exited from of the envelope of the CSD amplitude and could not be measured (Figure 2l and Figure 3l). For a larger TC, the TC measurements can be realized by measuring the CSD phase on the source plane, where the phase singularities will present a perfect distribution resembling a “pizza”. If the full four-dimensional CSD is measured and the propagation matrix is known, then the source CSD can also be inversely calculated from the CSD of any propagation plane.
Furthermore, we performed the TC measurements without atmospheric perturbations. For turbulent atmospheric cases, measuring the TC accurately for a partially coherent vortex beam is challenging. In addition to the distortion of the OAM mode, one of the main problems with the measurement technique is the introduction of three phase perturbations, which makes the scheme unsuitable for rapidly changing turbulence. This problem can be solved by designing a hologram (loaded onto SLM2) that contains three phase perturbations, thus allowing the CSD phase to be measured in real time.

6. Conclusions

In this study, we theoretically and experimentally analyzed the CSD distributions of a PCLG vortex beam transmitted through two cylindrical lenses at varying angles. When the cylindrical lenses were placed vertically, the orientation of the CSD magnitude can be used to distinguish the TC sign. However, the TC magnitude can only be determined for extremely low-coherence cases using the relationship between the number of CSD stripes and the TC, i.e., N = 2|l| +1. As the coherence increased, the stripes evolved into singularities, the number of which did not correlate with the TC. However, when the cylindrical lens’s angle was changed gradually from 90° to 0°, stripes reappeared in the CSD amplitude for the case of medium and high coherences. Meanwhile, the magnitude of the TC in the PCLG vortex beams can be determined by the number of bright stripes in the amplitude or the dumbbell structure in the phase patterns. The quantitative relationship was N = 2|l| +1. Compared with the findings regarding the CSD amplitude, this conclusion was more evident in the CSD phase patterns. Our findings can facilitate the development of applications in the field of free-space, turbulence-atmosphere optical communication, and information encryption.

Author Contributions

Conceptualization, X.L. (Xingyuan Lu) and X.L. (Xiaotan Lu); methodology, X.L. (Xiaotan Lu) and Z.W.; formal analysis, X.L. (Xiaotan Lu) and Z.W.; investigation, X.L. (Xiaotan Lu); writing—original draft preparation, X.L. (Xiaotan Lu) and X.L. (Xingyuan Lu); writing—review and editing, X.L. (Xingyuan Lu) and C.Z.; supervision, X.L. (Xingyuan Lu), C.Z. and Y.C.; project administration, X.L. (Xingyuan Lu); funding acquisition, X.L. (Xingyuan Lu), C.Z. and Y.C. All authors have read and agreed to the published version of the manuscript.

Funding

This work was supported by the National Key Research and Development Program of China (No. 2022YFA1404800 and No. 2019YFA0705000), National Natural Science Foundation of China (No. 12204340, No. 12174280, No. 12192254, No. 11974218, and No. 92250304), China Postdoctoral Science Foundation (2022M722325), Priority Academic Program Development of Jiangsu Higher Education Institutions, Tang Scholar, Local Science and Technology Development Project of the Central Government (No. YDZX20203700001766), and Key Lab of Modern Optical Technologies of Jiangsu Province (KJS2138). Hui Chun Chin and Tsung Dao Lee Chinese Undergraduate Research Endowment (CURE).

Institutional Review Board Statement

Not applicable.

Informed Consent Statement

Not applicable.

Data Availability Statement

Data underlying the results presented in this paper are not publicly available at this time but may be obtained from the authors upon reasonable request.

Conflicts of Interest

The authors declare no conflict of interest.

References

  1. Coullet, P.; Gil, L.; Rocca, F. Optical vortices. Opt. Commun. 1989, 73, 403–408. [Google Scholar] [CrossRef]
  2. Allen, L.; Beijersbergen, M.W.; Spreeuw, R.J.C.; Woerd-man, J.P. Orbital angular momentum of light and the transformation of Laguerre-Gaussian laser modes. Phys. Rev. A 1992, 45, 8185–8196. [Google Scholar] [CrossRef] [PubMed]
  3. He, H.; Friese, M.E.J.; Heckenberg, N.R.; RubinszteinDunlop, H. Direct Observation of Transfer of Angular Momentum to Absorptive Particles from a Laser Beam with a Phase Singularity. Phys. Rev. Lett. 1995, 75, 826–831. [Google Scholar] [CrossRef] [PubMed]
  4. Dong, M.; Jiang, D.; Luo, N.; Yang, Y. Trapping two types of Rayleigh particles using a focused partially coherent anomalous vortex beam. Appl. Phys. B Lasers Opt. 2019, 125, 903–907. [Google Scholar] [CrossRef]
  5. Zhao, C.L.; Cai, Y.J.; Lu, X.H.; Eyyuboğlu, H.T. Radiation force of coherent and partially coherent flat-topped beams on a Rayleigh particle. Opt. Express 2009, 17, 1753–1765. [Google Scholar] [CrossRef]
  6. Wang, J. Advances in communications using optical vortices. Photonics Research. Photon. Res. 2016, 4, B14–B28. [Google Scholar] [CrossRef]
  7. Walker, G.; Arnold, A.S.; Franke-Arnold, S. Trans-spectral orbital angular momentum transfer via four-wave mixing in Rb vapor. Phys. Rev. Lett. 2012, 108, 243601. [Google Scholar] [CrossRef]
  8. Yousif, B.B.; Elsayed, E.E. Performance enhancement of an orbital-angular-momentum-multiplexed free-space optical link under atmospheric turbulence effects using spatial-mode multiplexing and hybrid diversity based on adaptive MIMO equalization. IEEE. Access 2019, 7, 84401–84412. [Google Scholar] [CrossRef]
  9. Liang, C.; Monfared, Y.E.; Liu, X.; Qi, B.; Wang, F.; Korotkova, O.; Cai, Y. Optimizing illumination’s complex coherence state for overcoming Rayleigh’s resolution limit. Chin. Opt. Lett. 2021, 19, 052601. [Google Scholar] [CrossRef]
  10. Willig, K.I.; Rizzoli, S.O.; Westphal, V.; Jahn, R.; Hell, S.W. STED microscopy reveals that synaptotagmin remains clustered after synaptic vesicle exocytosis. Nature 2006, 440, 935–939. [Google Scholar] [CrossRef]
  11. Wang, B.; Tanksalvala, M.; Zhang, Z.; Esashi, Y.; Jenkins, N.W.; Murnane, M.M.; Henry, C.K.; Liao, C.T. Coherent Fourier Scatterometry Using Orbital Angular Momentum Beams for Defect Detection. Opt. Express 2021, 29, 3342–3358. [Google Scholar] [CrossRef]
  12. McCarter, M.R.; Saleheen, A.I.; Singh, A.; Tumbleson, R.; Woods, J.S.; Tremsin, A.S.; Lance, E.D.L.; Hastings, J.T.; Morley, S.A.; Roy, S. Antiferromagnetic real-space configuration probed by dichroism in scattered X-ray beams with orbital angular momentum. Phys. Rev. B. 2023, 107, L060407. [Google Scholar] [CrossRef]
  13. Tamburini, F.; Thidé, B.; Della Valle, M. Measurement of the spin of the M87 black hole from its observed twisted light. Mon. Not. R. Astron. Soc. Lett. 2020, 492, 22–27. [Google Scholar] [CrossRef]
  14. Wang, B.; Brooks, N.J.; Johnsen, P.C.; Jenkins, N.W.; Esashi, Y.; Binnie, I.; Tanksalvala, M.; Kapteyn, H.C.; Murnane, M.M. High-fidelity ptychographic imaging of highly periodic structures enabled by vortex high harmonic beams. arXiv 2023, arXiv:2301.05563. [Google Scholar]
  15. Liu, X.; Shen, Y.; Liu, L.; Wang, F.; Cai, Y. Experimental demonstration of vortex phase-induced reduction in scintillation of a partially coherent beam. Opt. Lett. 2013, 38, 5323–5326. [Google Scholar] [CrossRef]
  16. Gori, F.; Santarsiero, M.; Borghi, R.; Vicalvi, S. Partially coherent sources with helicoidal modes. J. Mod. Opt. 1998, 45, 539–554. [Google Scholar] [CrossRef]
  17. Dogariu, A.; Amarande, S. Propagation of partially coherent beams: Turbulence-induced degradation. Opt. Lett. 2003, 28, 10–12. [Google Scholar] [CrossRef]
  18. Ge, D.; Cai, Y.; Lin, Q. Partially coherent flat-topped beam and its propagation. Appl. Opt. 2004, 43, 4732–4738. [Google Scholar] [CrossRef]
  19. Ricklin, J.C.; Davidson, F.M. Atmospheric turbulence effects on a partially coherent Gaussian beam: Implication for free-space laser communication. J. Opt. Soc. Am. A 2002, 19, 1794–1802. [Google Scholar] [CrossRef]
  20. Peng, X.; Lu, X.; Liu, X.; Zhao, C.; Lin, R.; Liu, L.; Cai, Y. Generation and Propagation of a Hermite-Gaussian Correlated Schell-Model LG0l Beam. Appl. Sci. 2019, 9, 610. [Google Scholar] [CrossRef]
  21. Cai, Y.; Chen, Y.; Wang, F. Generation and propagation of partially coherent beams with nonconventional correlation functions: A review. J. Opt. Soc. Am. A 2014, 31, 2083–2096. [Google Scholar] [CrossRef] [PubMed]
  22. Kovalev, A.A.; Kotlyar, V.V.; Nalimov, A.G. Topological charge and asymptotic phase invariants of vortex laser beams. Photonics 2021, 8, 445. [Google Scholar] [CrossRef]
  23. Lan, B.; Liu, C.; Rui, D.; Chen, M.; Shen, F.; Xian, H. The topological charge measurement of the vortex beam based on dislocation self-reference interferometry. Phys. Scr. 2019, 94, 055502. [Google Scholar] [CrossRef]
  24. Kovalev, A.A.; Kotlyar, V.V.; Kozlova, E.S.; Butt, M.A. Dividing the Topological Charge of a Laguerre–Gaussian Beam by 2 Using an Off-Axis Gaussian Beam. Micromachines 2022, 13, 1709. [Google Scholar] [CrossRef] [PubMed]
  25. Stoklasa, B.; Motka, L.; Rehacek, J.; Hradil, Z.; Sánchez-Soto, L.L. Wavefront sensing reveals optical coherence. Nat. Commun. 2014, 5, 3275. [Google Scholar] [CrossRef]
  26. Vaughan, J.M.; Willetts, D.V. Interference properties of a light beam having a helical wave surface. Opt. Commun. 1979, 30, 263–267. [Google Scholar] [CrossRef]
  27. Brandao, P.A.; Cavalcanti, S.B. Topological charge identification of partially coherent light diffracted by a triangular aperture. Phys. Lett. A 2016, 380, 4013–4017. [Google Scholar] [CrossRef]
  28. Berkhout, G.C.G.; Beijersbergen, M.W. Method for probing the orbital angular momentum of optical vortices in electromagnetic waves from astronomical objects. Phys. Rev. Lett. 2008, 101, 100801. [Google Scholar] [CrossRef]
  29. Mourka, A.; Baumgartl, J.; Shanor, C.; Dholakia, K.; Wright, E.M. Visualization of the birth of an optical vortex using diffraction from a triangular aperture. Opt. Express 2011, 19, 5760–5771. [Google Scholar] [CrossRef]
  30. Esashi, Y.; Liao, C.T.; Wang, B.; Brooks, N.; Dorney, K.M.; Hernández-García, C.; Kapteyn, H.; Adams, D.; Murnane, M. Ptychographic amplitude and phase reconstruction of bichromatic vortex beams. Opt. Express 2018, 26, 34007–34015. [Google Scholar] [CrossRef]
  31. Dong, M.; Lu, X.Y.; Zhao, C.; Cai, Y.; Yang, Y. Measuring topological charge of partially coherent elegant Laguerre-Gaussian beam. Opt. Express 2018, 26, 33035–33043. [Google Scholar] [CrossRef]
  32. Chen, J.; Liu, X.; Yu, J.; Cai, Y. Simultaneous determination of the sign and the magnitude of the topological charge of a partially coherent vortex beam. Appl. Phys. B 2016, 122, 201. [Google Scholar] [CrossRef]
  33. Lu, X.; Zhao, C.; Shao, Y.; Zeng, J.; Konijnenberg, S.; Zhu, X.; Popov, S.; Urbach, H.P.; Cai, Y. Phase detection of coherence singularities and determination of the topological charge of a partially coherent vortex beam. Appl. Phys. Lett. 2019, 114, 201106. [Google Scholar] [CrossRef]
  34. Chen, T.; Lu, X.; Zeng, J.; Wang, Z.; Zhang, H.; Zhao, C.; Hoenders, B.J.; Cai, Y. Young’s double-slit experiment with a partially coherent vortex beam. Opt. Express 2020, 28, 38106–38114. [Google Scholar] [CrossRef]
  35. Denisenko, V.; Shvedov, V.; Desyatnikov, A.S.; Neshev, D.N.; Krolikowski, W.; Volyar, A.; Soskin, M.; Kivshar, Y.S. Determination of topological charges of polychromatic optical vortices. Opt. Express 2009, 17, 23374–23379. [Google Scholar] [CrossRef]
  36. Kotlyar, V.V.; Kovalev, A.A.; Porfirev, A.P. Astigmatic transforms of an optical vortex for measurement of its topological charge. Appl. Opt. 2017, 56, 4095–4104. [Google Scholar] [CrossRef]
  37. Wang, F.; Cai, Y.; Korotkova, O. Partially coherent standard and elegant Laguerre-Gaussian beams of all orders. Opt. Express 2009, 17, 22366–22379. [Google Scholar] [CrossRef]
  38. Lin, Q.; Cai, Y. Tensor ABCD law for partially coherent twisted anisotropic Gaussian–Schell model beams. Opt. Lett. 2002, 27, 216–218. [Google Scholar] [CrossRef]
  39. Tong, R.; Dong, Z.; Chen, Y.; Wang, F.; Cai, Y.; Setälä, T. Fast calculation of tightly focused random electromagnetic beams: Controlling the focal field by spatial coherence. Opt. Express 2020, 28, 9713–9727. [Google Scholar] [CrossRef]
  40. Shao, Y.; Lu, X.; Sander, K.; Zhao, C.; Cai, Y.; Paul, U.H. Spatial coherence measurement and partially coherent diffractive imaging using self-referencing holography. Opt. Express 2018, 26, 4479–4490. [Google Scholar] [CrossRef]
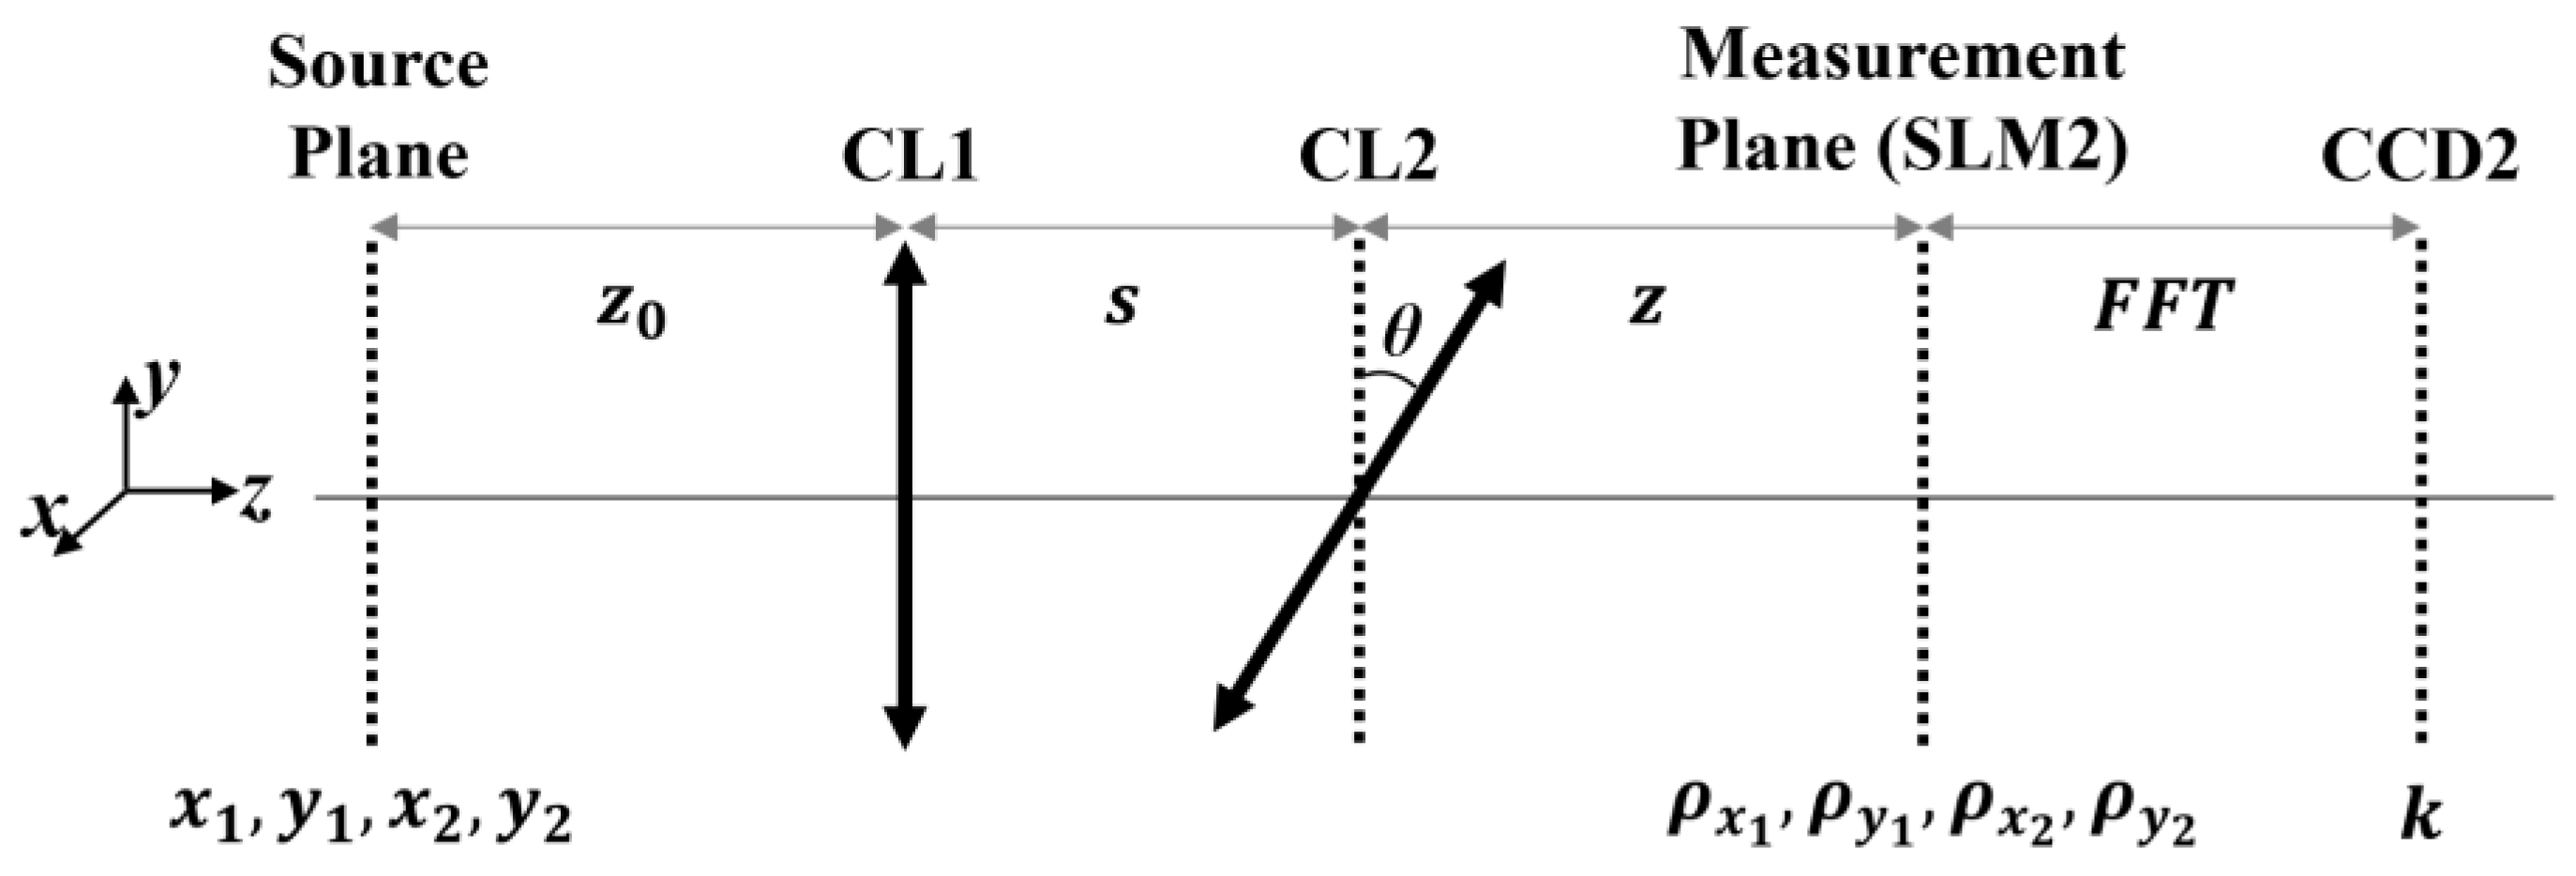
Figure 1. Schematic diagram of a PCLG vortex beam passing through a dual cylindrical lens system. CL1 and CL2, cylindrical lenses. θ is the included angle between the cylindrical lens and y-axis. SLM2, spatial light modulator. CCD2, charge-coupled device. The labels of SLM2 and CCD2 are consistent with those in the diagram of experimental set up.
Photonics 10 00444 g001
Figure 2. Theoretical simulation results of CSD amplitude of PCLG vortex beams in log scale, i.e., log [1 + W ρ x 1 , ρ y 1 , 0 , 0 ]. CSD amplitude distributions for (ad) low coherence, (eh) medium coherence and (il) high coherence cases with four different TCs. The arrows mark the positions of stripes in the CSD amplitude.
Photonics 10 00444 g002
Figure 3. Numerical simulation results for normalized distribution of log [1 + W ρ x 1 , ρ y 1 , 0 , 0 ] of PCLG vortex beams with different TCs and coherence widths. CSD amplitude distributions for (ad) low coherence, (eh) medium coherence and (il) high coherence cases with four different TCs. The arrows mark the positions of stripes in the CSD amplitude.
Photonics 10 00444 g003
Figure 4. Numerical simulation results of CSD amplitude and phase distribution for different cylindrical lenses angles.
Photonics 10 00444 g004
Figure 5. Numerical simulation results of CSD amplitude and phase for different TCs and coherence widths when the included angle of two cylindrical lenses was 30°. CSD amplitude distributions for (ac) TC equal to +1 and (df) TC equal to +2. The arrows mark the positions of stripes or rings in the CSD amplitude. CSD phase distributions for (jl) TC equal to +1 and (mo) TC equal to +2. The arrows mark the positions of “dumbbell pieces and handles” in the CSD phase.
Photonics 10 00444 g005
Figure 6. Schematic illustration of the experimental CSD measurement of a partially coherent Laguerre–Gaussian vortex beam. BE, beam expander; L1–L3, thin lenses; RGGD, rotating ground-glass disk; CA, circular aperture; SLM1, transmissive spatial light modulator; SLM2, reflective phase-only spatial light modulator; RM, reflecting mirror; GAF, Gaussian amplitude filter; BS, beam splitter; CL1, CL2, cylindrical lenses; CCD1, CCD2, charge-coupled devices.
Photonics 10 00444 g006
Figure 7. Experimental results for the CSD amplitude and phase distribution with medium coherence width (σg = 0.4ω0), TC = −2, and different included angles of cylindrical lenses. CSD amplitude distributions for angle equal to (a) 15°, (b) 30°, (c) 45° and (d) 60°. The arrows mark the positions of the stripes in the CSD amplitude. CSD phase distributions for angle equal to (e) 15°, (f) 30°, (g) 45° and (h) 60°. The arrows mark the positions of the “dumbbell pieces and handles” in the CSD phase.
Photonics 10 00444 g007
Figure 8. Experimental results for the CSD amplitude and phase distribution with medium coherence width (σg = 0.4ω0) and different TCs. Included angles of cylindrical lenses was 30°. CSD amplitude distributions for TC equal to (a) +1, and (b) +2. The arrows mark the positions of the stripes in the CSD amplitude. CSD phase distributions for TC equal to (c) +1, and (d) +2. The arrows mark the positions of the “dumbbell pieces and handles” in the CSD phase.
Photonics 10 00444 g008
Disclaimer/Publisher’s Note: The statements, opinions and data contained in all publications are solely those of the individual author(s) and contributor(s) and not of MDPI and/or the editor(s). MDPI and/or the editor(s) disclaim responsibility for any injury to people or property resulting from any ideas, methods, instructions or products referred to in the content.