Abstract
In the process of image reconstruction of compressed sensing algorithms, building a measurement matrix related to the parameters of the imaging system is necessary to improve its imaging quality. Additionally, building a compressed ultrafast imaging system based on a streak camera, which includes aberrations in the imaging system, is necessary. However, the aberration coefficient of the streak tube can be obtained only by numerical calculation based on the known internal structure of the streak tube, and it does not apply to a tube with an unknown structure. Based on the Lagrange–Helmholtz relation, which is widely established in electronic optical imaging systems, this study proposes a method to obtain the Petzval image plane of a streak tube by measuring only a single image without considering the internal structure of the streak tube. This method provides a reference for the construction of the measurement matrix in the application of the compressed sensing algorithm; additionally, it provides a test scheme for the performance index of the streak tube after assembly in commercial production to further optimize the assembly process and improve the yield of production.
1. Introduction
The streak camera is an ultrafast imaging device that could provide high spatiotemporal resolution. It is widely used in numerous fields, including photosynthesis of plants [1], fluorescence lifetime decay analysis of biological samples [2,3,4,5,6], superluminal propagation occurring in matter detected through a combination with a digital micro-mirror array, and image reconstruction methods [7].
As a wide-beam imaging device, the imaging position of electron beams emitted from different heights on the cathode surface of the streak tube is not on the same plane but rather on a paraboloid sphere. The general streak camera adopts a flat screen or spherical fluorescent screen (but the actual image surface of the electron beam is not a completely spherical surface); hence, the image surface is not completely attached to the fluorescent screen. Consequently, the electron beam at a non-tangent position will be defocused when projected onto the fluorescent screen. Therefore, in the actual test, adjusting the focusing voltage improves the cathode center resolution. At this time, the electron beams at other off-axis positions are not on the best image plane. Therefore, the central axis is the focusing area and a higher static spatial resolution can be obtained, whereas the off-axis area is the defocusing area; therefore, the spatial resolution of the edge decreases.
Recently, compressed sensing ultrafast imaging based on streak cameras has become a popular research [7,8]. The system has a very high frame number in the visible band. However, its spatial resolution is substandard. In this type of imaging system, the key step in image reconstruction is to use a compressed sensing algorithm. However, the compressed sensing algorithm must cooperate with the construction of a measurement matrix related to the coefficients of the imaging system. Therefore, we believe that the reason for the low spatial resolution of the compressed sensing ultrafast imaging system is the absence of a special measurement matrix for the streak tube.
The factor of the measuring matrix must be related to the aberration of the streak tube [9], and as a wide-beam imaging device, the field curvature in the aberration plays a major role [10]. Because the design of streak tubes predominantly adopts a numerical calculation method to solve the Laplace equation, only special structures, such as concentric sphere systems, have an ideal analytical solution. Therefore, the aberration calculation can use only a simple formula for non-concentric sphere system streak tubes that cannot be analyzed by analytical solutions [11].
Nonetheless, the accumulation of aberration of the electron beam during flight is finally reflected on the fluorescent screen; that is, we can directly infer the specific situation of aberration, such as the field curve from the image on the fluorescent screen. Therefore, in our recent research, we proposed a method to directly measure the field curvature of a streak tube experimentally based on a spherical fluorescent screen (this work has only been submitted to the journal).
However, when the assembly coaxially of the streak tube deviates, the spherical fluorescent screen has a certain inclination angle relative to the optical axis. Adopting this method for measuring inevitably leads to errors in the calculation results. In addition, this method requires the use of a spherical fluorescent screen with different curvatures for testing, which implies that the fluorescent screen must be replaced during the experiment. Because the infrared/visible streak tube is integrated (closed type) after preparation and the fluorescent screen cannot be replaced, this method is not applicable in the experimental test of a closed streak tube.
This study selected a more universal planar fluorescent screen to solve this problem. Using the Lagrange–Helmholtz relationship, a method of measuring the Petzval image plane of a streak tube with a single image is proposed. This method provides a reference for the construction of the measurement matrix in the application of the compressed sensing algorithm; additionally, it provides a test plan for the performance index of the streak tube after assembly in commercial production to further optimize the assembly process and improve the yield of production.
2. Principle
In Figure 1, point A is the intersection of the electron beam and the axis, is the length of the streak tube, and the green curve is the shape and position of the Petzval image plane, at which time the electron beam converges to point , with a beam spot diameter of . The distance from the fluorescent screen is d, image height , the electron beam intersects the point P of the planar fluorescent screen, and the corresponding beam spot diameter is .
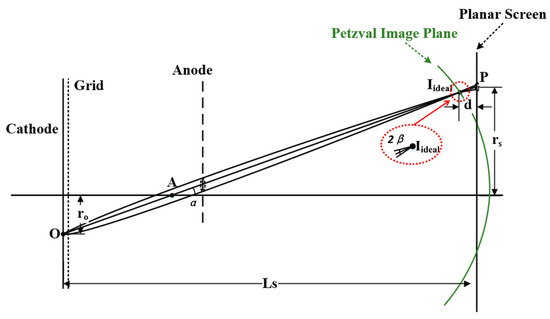
Figure 1.
Shape and position of electron beam image plane.
Therefore, the relationship between the beam spot diameter of the electron beam on the fluorescent screen and the beam spot diameter on the ideal image plane can be deduced from the analytical geometry, as follows.
Expanding the trigonometric expression in Equation (1) yields:
where is the elevation angle between the image height on the fluorescent screen relative to the intersection a of the electron beam highly emitted by the corresponding object and the axis, and is half of the opening angle of the beam spot on the fluorescent screen to the intersection point A.
According to Figure 1,
where the transverse magnification of the streak tube is , is the height of the object, and is the image height.
The common Lagrange–Helmholtz relationship in electronic optical systems [12] is:
where the axial energy of the object point is , is the total anode pressure of the streak tube, and is the angular magnification of the streak tube, which is equal to the ratio of the opening angle of the image point electron beam to that of the object point electron beam.
From Equations (4) and (5), we obtain:
The value of can be considered the most probable energy of the photocathode material. The cathode material of the streak tube is cesium iodide, , and the cathode material is Au, . Therefore, once the cathode material transverse magnification of the streak tube and total anode pressure are known, the right side of the equal sign of the above formula is divided by all parameters outside and can be represented by a constant , except .
where
By combining all the above formulas and substituting them into Equation (2):
In Formula (9), when the streak tube structure has been determined, and can be determined. Therefore, the constant can also be determined. We know that the value of is generally subject to the Lambert distribution; therefore, it can be calculated using the Monte Carlo method sampling . In addition, and can be deduced by reading the image contrast and then using a simple calculation formula of the modulation transfer function [13,14,15,16], which is defined below as:
where is the radius of the beam spot on the image plane in mm, which equal to , and is the spatial frequency in lp/mm, refers to the peak value of the intensity curve, refers to the valley value, and refers to the background noise.
Essentially, the field curve size of the tube can be directly calculated from the fringe image obtained via the experiment using Equation (9).
3. Experiments and Analysis
3.1. Experiments
When using Equation (9) to calculate the field curve of the tube type, in principle, multiple measurements are required for different points on the image plane to obtain the corresponding and , which renders the experimental process cumbersome. In a streak tube with a planar cathode, the initial angular distribution of each emitter point is the same; therefore, it can be inferred from the Lagrange–Helmholtz relationship that when the system parameters are determined, the beam spot size on the ideal image plane should be the same, which has been proved in this study. Therefore, in the subsequent experiment, we need to adjust only the state of the streak tube to the best resolution of any object’s high image point. We can obtain on the ideal image plane, read the image modulation of other positions in the same image, and subsequently, combine it with the simple formula of the modulation transfer function. Additionally, we can obtain the beam spot size of the corresponding image point . Subsequently, the field curve size of the tube type can be determined by substituting Equation (9). Essentially, the field curvature of the tube can be obtained by measuring only one image, which significantly simplifies the experimental process.
Six electrodes with five lens tube types were used for testing. When preparing the photocathode, an aluminum layer was first evaporated on the quartz substrate, followed by photolithography with the reticle image. Subsequently, gold was evaporated on the photolithographed aluminum layer. A plane fluorescent screen was prepared on an optical fiber panel with P20 phosphor. The structural diagram is shown in Figure 2, and Table 1 lists the structural parameters of the streak tube used in the test. During the test, an ultraviolet lamp was used to irradiate the cathode of the streak tube and produce photoelectrons. After focusing, the photoelectron beam bombards the fluorescent screen and replaces it with fluorescence. A scientific CCD camera (PI 2048 × 2048) [17] from Teledyne Princeton Instrument Company (3660 Quakerbridge Road, Trenton, NJ 08619 USA) was used for image acquisition.
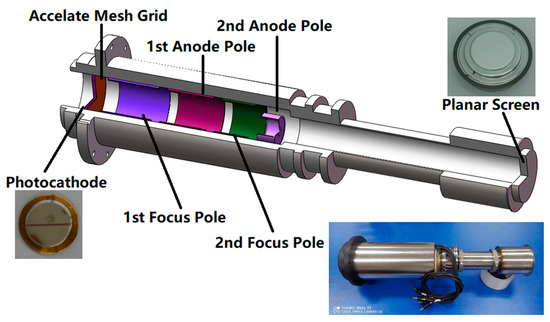
Figure 2.
Structural diagram of streak tube used in the test.

Table 1.
Structural parameters of streak tube.
Because the mechanical position of the fluorescent screen is fixed after installation, the adjustment of the focusing voltage changes the relative position between the actual image plane and screen, as shown in Figure 2. From left to right, it corresponds to the situation under-focusing (the actual image plane moves towards the cathode) to over-focusing (the actual image plane moves away from the cathode). Therefore, the position of any small area on the image plane must overlap with the screen during the adjustment process, and the modulation degree of the observed image is the highest at this time. Because the images in the defocused state or the over-focused state are in the defocused state, the resolution of the obtained images is not high; therefore, the test scheme can select only the focused state (b) in the state shown in Figure 3, and the obtained experimental images are shown in Figure 4.
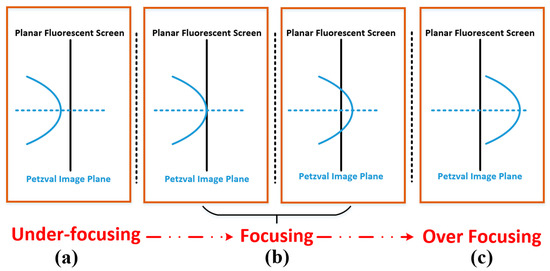
Figure 3.
Distance between Petzval image plane and planar fluorescent screen.
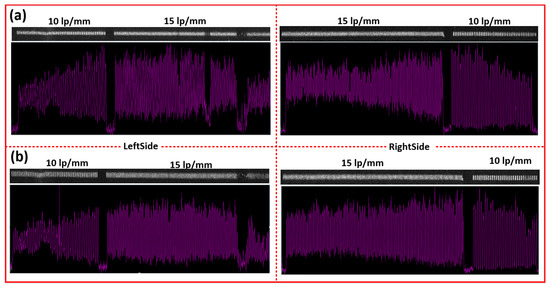
Figure 4.
Experimental test results of different tube lengths; the upper part is the streak image, and the lower part is the distribution curve after obtaining the average intensity along the vertical direction in the selected area: (a) 424 mm tube length; (b) 478 mm tube length.
3.2. Analysis
As shown in Figure 5, by considering the vicinity of the image center as the reference point and the range of 0.25 mm for each point on both sides, the average value of its modulation degree was calculated; subsequently, the obtained value was substituted into the simple calculation formula of the modulation transfer function [13,14,15,16]. Thus, the corresponding beam spot size of each image point was obtained, as summarized in Table 2.
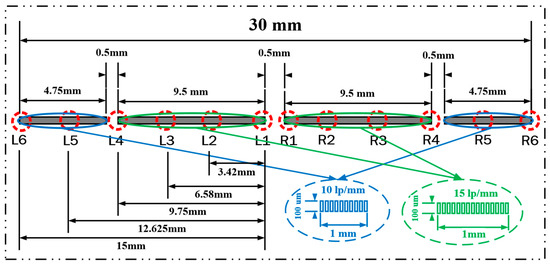
Figure 5.
Schematic of experimental test points.

Table 2.
Data of different tube length with planar screen.
As listed in Table 1, the photocathode material is gold, and the most probable initial emission energy of gold can be taken as , . Therefore, according to Equation (8), with transverse magnification and tube length , and with and . During the calculation, according to the corresponding column of beam spot size listed in Table 2, was set as the mean value of the beam spot at the intersection of Petzval image plane and planar screen, i.e., and .
According to the data in Table 2 and the above formula, the Monte Carlo method was used to perform sampling that complies with the Lambert distribution to ensure the effectiveness of sampling; the number of electronic samples was set to 10,000. After multiplying the sampling result of and the coefficient , it was substituted into Equation (9) and expressed using a histogram. According to the spline width difference corresponding to different energy ratios (70–90%, of which 70% corresponds to FWHM), the axial distance d between the optimal image plane position of each tube length and the image center of each point on the plane fluorescent screen were obtained, as listed in Table 3.

Table 3.
Distance between different tube lengths on Petzval image plane and planar screen (mm).
Considering the length of each tube as the reference plane, according to the data in Table 3, cubic polynomial fitting was used to determine the corresponding Petzval image plane equation, as shown below.
For 424 mm tube length:
For 478 mm tube length:
The curvature coefficient of the electron optical imaging system is proportional to the product of the quadratic of the object height and aperture diameter , and transverse magnification of the system. In Equations (11)–(16), under the same energy ratio, the field curvature of the 478 mm tube length () was significantly greater than that of the 424 mm tube length (). The larger the aperture diameter is, the larger the angle through which electrons are allowed to pass, and the larger the energy proportion. Therefore, for the same tube length, the field curvature with a large energy proportion is more intense, which conforms to the variation law of the field curvature coefficient , as shown in Figure 6. Moreover, Figure 6 reveals that the Petzval image plane equations are not symmetrical about the cathode center, which is caused by the influence of the geomagnetic field [18].
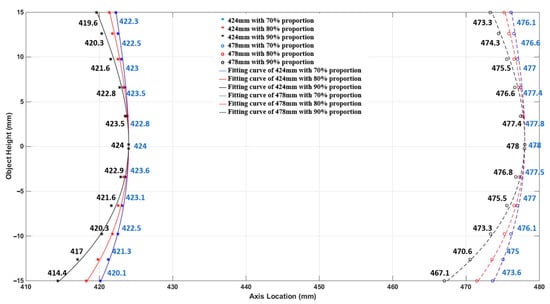
Figure 6.
Point selection and fitting results.
4. Conclusions
Based on the Lagrange–Helmholtz relation, this study was carried out based on a universal planar fluorescent screen, deduced the approximate calculation formula of the field curvature of the streak tube, and verified the effectiveness of the formula through experimental verification. The derivation of this formula does not require knowledge of the internal structure of the streak tube. The field curvature of the tube can be obtained only from known parameters and by measuring a picture. It not only provides a reference for the construction of the measurement matrix in the application of the compressed sensing algorithm but also provides a test scheme for the performance indicators after the assembly of the streak tube in commercial production to further optimize the assembly process and improve the production yield.
However, this study only considered the shape function measurement scheme of a one-dimensional meridian Bezier image surface. The experiments involved in this study were obtained only under static test conditions. Therefore, in future studies, we will extend the field curve measurement method to the measurement of the two-dimensional field curve shape function in the dynamic working state to meet the requirements of field curve correction and compensation in later image reconstruction.
Author Contributions
Conceptualization/Supervision: Q.Y.; Writing—Original Draft Preparation: H.C.; Writing—Review and Editing: L.N.; Software/Formal Analysis: Y.W.; Methodology: J.Z. and F.Z.; Funding Acquisition: J.Z., F.Z. and H.C. All authors have read and agreed to the published version of the manuscript.
Funding
This study was funded by the following. (1) National Nature Science Foundations of China (NSFC): No. 12175153, No. 12075156; (2) Guangdong Basic and Applied Basic Research Foundation: 2021A1515010048, 2019A1515011474; (3) Shenzhen Science and Technology Program: JCYJ20210324095007020, JCYJ20200109105201936, 20200803105052010, JCYJ20190808115605501.
Institutional Review Board Statement
Not applicable.
Informed Consent Statement
Not applicable.
Data Availability Statement
Data underlying the results presented in this paper are not publicly available at this time but may be obtained from the authors upon reasonable request.
Conflicts of Interest
The authors declare no conflict of interest.
References
- Meezan, N.B.; Edwards, M.J.; Hurricane, O.A.; Patel, P.K.; Callahan, D.A.; Hsing, W.W.; Town, R.P.J.; Albert, F.; Amendt, P.A.; Berzak Hopkins, L.F.; et al. Indirect drive ignition at the National Ignition Facility. Plasma Phys. Control. Fusion 2017, 59, 014021. [Google Scholar] [CrossRef]
- Liu, L.; Li, Y.; Sun, L.; Li, H.; Peng, X.; Qu, J. Fluorescence lifetime imaging microscopy using a streak camera. Proc.SPIE 8948, Multiphoton Microsc. Biomed. Sci. XIV 2014, 8948, 1–5. [Google Scholar]
- Heng, L.; Yong-hong, S.; Yan, W.; Jun-le, Q.; Han-ben, N. Improving the precision of fluorescence lifetime measurement using a streak camera. Chin. Opt. Lett. 2010, 8, 934–936. [Google Scholar]
- Qu, J.; Liu, L.; Guo, B.; Lin, Z.; Hu, T.; Tian, J.; Wang, S.; Zhang, J.; Niu, H. Development of a multispectral multi-photon fluorescence lifetime imaging microscopy system using a streak camera. Proc. SPIE 2005, 5630, 510–516. [Google Scholar]
- Becker, W. Fluorescence lifetime imaging—Techniques and applications. J. Microsc. 2012, 247, 119–136. [Google Scholar] [CrossRef] [PubMed]
- Krishman, R.V.; Saitoh, H.; Terada, H.; Centonze, V.E.; Herman, B. Development of a multiphoton fluorescence lifetime imaging microscopy system using a streak camera. Rev. Sci. Instrum. 2003, 74, 2714–2721. [Google Scholar] [CrossRef]
- Gao, L.; Liang, J.; Li, C. Single-shot compressed ultrafast photography at one hundred billion frames per second. Nat. Lett. 2014, 516, 74–77. [Google Scholar] [CrossRef] [PubMed]
- Liang, J.; Wang, P.; Zhu, L.; Wang, L.V. Single-shot stereo-polarimetric compressed ultrafast photography for light-speed observation of high-dimensional optical transients with picosecond resolution. Nat. Commun. 2020, 11, 5252. [Google Scholar] [CrossRef] [PubMed]
- Meng, J.; Liu, C.; Zheng, J.; Lin, R.; Song, L. Compressed sensing based virtual-detector photo-acoustic microscopy in vivo. J. Biomed. Opt. 2014, 19, 36003. [Google Scholar] [CrossRef] [PubMed]
- Jing-Jin, Z.; Ai-lin, L.; Qin-lao, Y.; Fang-ke, Z.; Bao-ping, G. Design of a large-format high-resolution streak camera with a planar photocathode. Nucl. Instrum. Methods Phys. Res. Sect. A 2020, 953, 163076. [Google Scholar] [CrossRef]
- Zhang, J.J.; Yang, Q.L.; Zong, F.K. Calculation and experimental verification of spatial resolution consistency on Petzval image plane of streak tube. Optik 2020, 208, 164443. [Google Scholar] [CrossRef]
- Liwei, Z. Electron Optics with Wide Beam Focusing; Beijing Institute of Technology Press: Beijing, China, 1993; pp. 110–116. [Google Scholar]
- Csorba, I.P. Modulation transfer function of image tube lenses. Appl. Opt. 1977, 16, 2647–2650. [Google Scholar] [CrossRef] [PubMed]
- Kecon, A.; Jiye, X.; Liwei, Z. Relativistic aberration theory for a combined electromagnetic focusing deflection systems possessing a spherical cathode. Optik 1987, 75, 112–120. [Google Scholar]
- Kecong, A.; Jiye, X.; Liwei, Z. Aberration theory for angularly and transversely large beams in electromagnetic focusing system with curved axes. Chin. J. Electron. 1991, 1, 1–7. [Google Scholar]
- Kecong, A.; Liwei, Z.; Jiye, X. On the aberration theory for wide and narrow electron beams in a combined electromagnetic focusing system possessing a spherical cathode. Optik 1987, 75, 101–108. [Google Scholar]
- Available online: http://www.princetoninstruments.com (accessed on 5 March 2023).
- Jing-jin, Z.; Ai-lin, L.; Bao-ping, G.; Qin-lao, Y.; Fang-ke, Z. Influence of geomagnetic field on the imaging performance of a streak tube. Nucl. Inst. Methods Phys. Res. A 2020, 950, 162808. [Google Scholar] [CrossRef]
Disclaimer/Publisher’s Note: The statements, opinions and data contained in all publications are solely those of the individual author(s) and contributor(s) and not of MDPI and/or the editor(s). MDPI and/or the editor(s) disclaim responsibility for any injury to people or property resulting from any ideas, methods, instructions or products referred to in the content. |
© 2023 by the authors. Licensee MDPI, Basel, Switzerland. This article is an open access article distributed under the terms and conditions of the Creative Commons Attribution (CC BY) license (https://creativecommons.org/licenses/by/4.0/).