Abstract
The classical theory of single-electron dynamics in focused laser pulses is the foundation of both the relativistic ponderomotive force (RPF), which underlies models of laser-collective-plasma dynamics, and the discovery of novel strong-field radiation dynamics. Despite this bedrock importance, consensus eludes the community as to whether acceleration of single electrons in vacuum has been observed in experimental conditions. We analyze an early experiment on the RPF with respect to several features that were neglected in modeling and that can restore consistency between theory predictions and experimental data. The right or wrong pulse profile function, laser parameters, or initial electron distribution can each make or break the agreement between predictions and data. The laser phase at which the electron’s interaction with the pulse begins has a large effect, explaining why much larger energies are achieved by electrons liberated in the focal region by photoionization from high-Z atoms and by electrons ejected from a plasma mirror. Finally, we compute the difference in a typical electron spectrum arising from fluctuating focal spot size in state-of-the-art ultra-relativistic laser facilities. Our results emphasize the importance of thoroughly characterizing laser parameters in order to achieve quantitatively accurate predictions and the precision required for discovery science.
1. Introduction
High-intensity laser experiments are entering a new stage of research [1], attempting discovery science goals [2,3,4], and developing more consistent outcomes in order to support medical and industrial applications [5]. Both basic research and application development require robust and quantitative predictions, but cutting edge high-intensity laser experiments often move faster than accurate predictions and simulations.
To demonstrate, we examine theory and experiment on a basic process, single-electron acceleration by lasers in vacuum. The theory is relatively simple for experiments with (peak) intensities up to W/cm [6,7,8,9,10,11,12,13], because single-particle dynamics are accurately described by the Lorentz force. Classical radiation reaction and high-energy photon emission remain small for fields of these magnitudes, unless the electrons are counterpropagating to the laser with GeV [14]. The physics of single-electron-laser scattering is essential to many discovery goals, from theories of strong-field ionization [7,8,9,10] to strong-field corrections to particle dynamics from quantum electrodynamics [15,16] and radiation reaction [3,4]. Additionally, the relativistic ponderomotive force (RPF) should be valid around W/cm [17], and therefore relevant to explaining electron acceleration in vacuum. The RPF underlies models of laser acceleration in more general plasma conditions [18,19,20,21,22,23,24,25].
Despite this key role, an early experiment [6] raised questions how the experimental data could be consistent with the theory of single-electron motion in a laser field [17,26]. While these questions have been revisited in the intervening years and the original experiment may no longer be considered sound, its analysis provides a good example of what is needed in relating theory derivation to experimental reality.
To this end, we discuss four experimental inputs that are often not well-known and their effect on the predictions of the theory of single-particle acceleration by laser fields: temporal pulse profile, phase of injection, initial momentum, and shot-to-shot variations in the laser. These four features do not exhaust the possible differences between the experiment and the theoretical models, but they suggest additional experimental measurements that become necessary to enhance confidence in the interpretation of the experiment outcome.
This work is thus a demonstration and call for the recent and coming laser-plasma experiments, in which the ultra-high intensity and beam geometry greatly increase the difficulty in measurements at ultra-high intensity. Pulse profiles are usually measured using a subaperture beam, often before full amplification and never at full pulse energy. Focal spot sizes are measured without a target present and at reduced intensity, and laser energies are also inferred from percent-level fractions of the beam. This reduction in knowledge increases uncertainty in predictions at higher intensity. Specifically the same uncertainty that hobbles analysis of Ref. [6] translates to a much larger discrepancy in an observable as intensities rise to W/cm and beyond.
2. Theory
The theory is relatively simple for experiments with (peak) intensities up to W/cm [6,7,8,9,10,11,12,13], because single-particle dynamics are accurately described by the Lorentz force. Classical radiation reaction and high-energy photon emission remain small for fields of these magnitudes as long as the electrons are not counterpropagating to the laser with GeV. We are concerned with particles accelerated from low energy , e.g., from gas targets.
2.1. When Acceleration Occurs
Before addressing the general case of 3-dimensional focused laser fields, we recall a general and elementary explanation how and under what conditions plane wave fields can accelerate charged particles [27]. For a plane wave, the field tensor and vector potential are functions of only one lightcone coordinate , taking the z-direction to be aligned with the propagation direction, and are subject to constraining symmetries [28]. Only the momentum conjugate (namely ) is not conserved; all three other components, , are conserved. In this case, the Lorentz force can be integrated directly, or the action solved [29]. The resulting 4-momentum is
where is the initial 4-momentum of the particle [30]. To assure ourselves is the physically measurable momentum, we write this in terms of gauge invariant quantities only by noting that in this case the 4-potential can be defined as the integral of the field tensor [28]
where is an orthogonal pair of polarization vectors satisfying for and the index j is implicitly summed over. The lower bound on the integral is taken to assuming that the electromagnetic field vanishes sufficiently quickly as so that the initial momentum is well-defined before the particle interacts with the field.
The final momentum of the particle is the value of as , which, therefore, differs from the initial momentum if, and only if, . Expressing in frequency space reveals that is proportional to the zero-frequency mode. In other words, the particle is accelerated if, and only if, the plane wave field contains a zero-frequency mode [27],
where is the Fourier transform of . The magnitude of the momentum change in a planewave field is proportional to the amplitude of its zero-frequency component. This result is modified in very strong fields as classical radiation losses imply that is no longer conserved [14].
Note that many models of laser pulses use the slow-envelope approximation, which in frequency space corresponds to a relatively narrow distribution around the central frequency . Under this slow-envelope condition, the amplitude of the zero-frequency component is exponentially suppressed. In contrast, square (box-car) pulses and sine-squared pulses violate this condition and have zero-frequency modes that are only power-law suppressed. Square pulses, in particular, notoriously result in unphysically large accelerations and heating, though they may be useful models for some very specific cases, as discussed below.
To generalize this insight to focused laser pulses and motion in 3 spatial dimensions, we observe from the classical action that for all points the mechanical 4-momentum of the particle is given by
While many field configurations, including the Gaussian beam, can be modeled with 4-potentials that vanish at (null) infinity, these do not manifest the change in momentum of a massive particle. We have just seen that for a planewave, the particle acquires a non-vanishing change in the gauge potential, which is exactly the change in momentum. This is an example of the recently discussed memory effect, being a phase (for a quantized particle) that can be removed by a change in gauge but nevertheless representing a physical (measurable) difference in states. The problem reduces to determining the 4-potential at time-like infinity.
This reasoning also demonstrates the importance of the relativistic effects in the acceleration. If the change in momentum is small , the trajectory is unperturbed, and one can simply Fourier transform the field in the lab frame along an inertial trajectory, as an approximation to a highly relativistic particle crossing the laser field. The absence of a zero-frequency mode, or in the particular case of the Gaussian beam field its derivation from a potential [26], then proves the absence of acceleration. However, in general, particularly for electrons initially nonrelativistic, the relativistic momentum of the particle in an imply that the particle does not see a time-symmetric electromagnetic field on its trajectory. To visualize this effect, in Figure 1 we compare the electric field of a laser pulse as measured by an observed fixed at the center of the focal spot to the electric field of the same laser pulse as measured on the trajectory of an electron that begins initially at rest at the center of the focal spot. We have chosen an example in which the electron sees a sudden jump from zero field to , such as ionization from a high-Z atom. In this case, the electron sees less than a half-cycle of the laser oscillation and, therefore, retains much of the energy provided to it by the transverse field. Additional intuition for this outcome is provided by introducing the ponderomotive force.
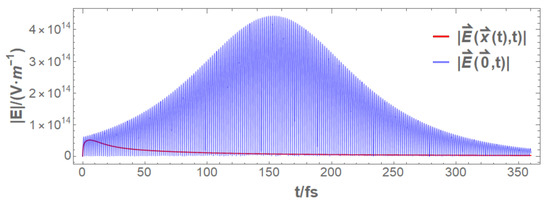
Figure 1.
The magnitude of the electric field of the laser pulse measured by an observed fixed at the center of the focal spot compared to the electric field of the same laser pulse as measured on the trajectory of an electron that begins initially at rest at the center of the focal spot . The laser parameters are , m, and fs with hyperbolic secant temporal profile.
2.2. Relativistic Ponderomotive Force
The ponderomotive force can be derived from the single particle equation of motion by splitting the momentum into a fast, oscillating component and slow, secular component [17]. The oscillating component approximately solves the planewave equation of motion, and the resulting equation of motion is
This equation is valid to first order in , a small parameter quantifying how slowly the field strength varies from one cycle to the next. The zeroth order motion is the planewave motion which changes the energy of the particle only in proportion to the amplitude of the zero-frequency component of the field, which is typically exponentially suppressed for well-defined pulses and therefore smaller than the effect of the RPF Equation (3).
The ponderomotive force equation Equation (5) shows that the secular, cycle-averaged momentum evolves in response to a gradient in the intensity. This feature alone is insufficient to derive acceleration, i.e., a net gain in energy. Most models of laser pulses, and probably most real pulses near their peak intensity, are symmetric along the propagation axis. If the particle were (approximately) stationary, as for non-relativistic dynamics in lasers with , then any forward force from the slowly increasing intensity before the peak is exactly balanced by a backward force from the slowly decreasing intensity after the peak. The symmetry between the forward force and backward force is broken at order by focusing of the laser, because there is a small gradient pointing away from the focal plane. As a consequence of the dynamics, the particle translates even though the net transfer of momentum is (nearly) zero. When the dynamics become relativistic, for lasers , the symmetric shape of the laser pulse plays less of a role, because the particle is driven forward, co-propagating with the wave until the intensity drops again, typically as the laser is diverging. In this case, the particle never sees a gradient anti-parallel to the propagation direction. The particle gains forward momentum and energy. In this way, the RPF offers an intuitive explanation for the proof given in the previous subsection.
Similar reasoning applies to the transverse dynamics. For axi-symmetric models of the laser field, such as the Gaussian beam model, Equation (5) shows that the transverse momentum transfer to a particle interacting with the laser is radial from the beam axis. If the particle has zero initial transverse momentum, then its final transverse momentum is in the same direction as its displacement from the beam axis. Thus, an axisymmetric distribution of at-rest or copropagating- particles is scattered into a axisymmetric distribution with , as found in [17]. However, if the particle has nonzero initial transverse momentum, the outcome depends on the magnitude of the momentum transfer. For small momentum transfer , the initial momentum (distribution) dominates, and for large momentum transfer the final transverse momentum distribution displays the axisymmetry of the scattering field. The more general question of whether a particle crossing the laser field with initial transverse momentum depends on the timing of the particle’s crossing of the focal region, for the same reasons as the case discussed in the previous paragraph. We will demonstrate these features numerically below.
By general analysis, we have determined the conditions for a charged particle to be accelerated by a planewave or focused laser field. The general analysis also provides qualitative guidance to the outcomes of electron-laser scattering. More specific and more quantitative analysis of outcomes may be considered phenomenology of vacuum laser acceleration, i.e., the conversion of general features of the theory to more specific signals in experiment.
3. Phenomenology
The theory analysis in the previous section provides general insights into the necessary and sufficient conditions for laser acceleration in vacuum, as well as characteristics of the dynamics. Laboratory experiments differ in many ways from the thought experiment-style analysis that aids a theory investigation. We investigate four features of a realistic experimental setup: (1) the laser pulse profile, (2) the time the interaction begins, (3) the angle (relative to the beam axis) at which the electrons are traveling before the interaction begins, and (4) shot-to-shot variation in the summary parameters of the laser pulse (energy, spot size, pulse duration). Three of the four can be consistent with the application of RPF theory and, by highlighting significantly different outcomes for the same theory, point to measurements that are necessary for accurate interpretation of experimental outcomes.
3.1. Numerical Approach
We numerically integrate the Lorentz force with the electromagnetic fields modeled by the Gaussian beam. The Gaussian beam field distributions and are given explicitly in Appendix A. Next-to-leading-order corrections in the paraxial series expansion give rise to additional components of the force compared to the leading-order field. We include the first order corrections in both the weak focusing parameter and the slow-envelope parameter . Here, and are the laser wavelength and angular frequency, is the focal spot radius ( times smaller than the intensity full-width half-max diameter), and is the temporal intensity profile full-width half-max. For consistency of comparisons, we fix m for all simulations. These expansion parameters were denoted and , respectively, in Ref. [17].
Individual particle trajectories are solved with standard ordinary differential equation solvers. In initial testing, multiple solvers were compared for convergence. Matlab’s ode45 solver could be used in most cases, which also enabled running larger sample sizes in parallel. Truncation conditions based on time and electromagnetic field strength were checked to ensure the momentum of the particles had converged to inertial trajectories to well-within the noise level to define the final distributions. Distributions are generated by the Monte Carlo method, using several thousand samples for each parameter set: initial conditions ( at ) are randomly-generated according to the distributions described below. With these solvers, we verified quantitatively that the RPF Equation (5) gives results indistinguishable from the Lorentz force across the range of applicable parameters considered in this paper. In practice we use the Lorentz force solver in all cases and especially in Section 3.2 below where conditions of the RPF violated.
3.2. Laser Pulse Profile
The temporal profile of a laser pulse is less frequently provided in experimental descriptions. For experiments with overdense targets, the effect of ionizing prepulses creating preplasma up to picoseconds before the peak has been investigated to some extent [31,32]. For underdense plasma or vacuum laser acceleration, the choice of temporal profile is essential for predicting the energy gain.
For example, while Ref. [6] does not provide the temporal profile of the laser pulse in the experiment, the authors modeled their pulse with a sine-squared function. According to Ref. [26], the acceleration found using sine-squared and Gaussian profiles is unphysical, arising from the fact that these profiles do not satisfy
a condition derived together with the Gaussian beam spatial field distribution. This requires an at most exponential dependence on ; hence Ref. [26] recommends hyperbolic secant. Consistency in the approximation scheme can be restored by including order corrections in the Gaussian beam fields [17]. In order to compare to previous simulation results and discuss the impact of these modeling choices we simulate with three profiles:
where is the dimensionless phase and is linearly related to pulse duration, usually measured as the full-width half-max in intensity.
Although Gaussian profiles are formally inconsistent with Maxwell’s equations, they remain useful because measured laser pulse profiles are often fit passably by Gaussians and not often fit by hyperbolic secant functions. Further, several ultra-high-intensity systems have observed multiple peaks in the temporal profile. In Figure 2, we fit a single Gaussian, a three-peak Gaussian, a hyperbolic secant function and sine-squared function to the temporal profile of the 4PW Ti:Sapphire laser system at the Center for Relativistic Laser Science (CoReLS) in Gwangju, Korea. The central peak is best fit by a Gaussian, but a model with more degrees of freedom incorporates relevant features at ∼10% peak intensity. The three-peak fit loses information, but we have found that the additional features visible in the measured profile have a small effect on the accelerated electron distribution compared to the main peaks. The early-time features at less than the peak intensity effect small changes to the energy gain as long as they correspond to . This reasoning would not hold for peak , such as achieved for f/1 focusing on many petawatt-class systems. The late-time features generally have a negligible effect on the electron energies, because the electrons have been ponderomotively ejected from the focal region before these features catch up.
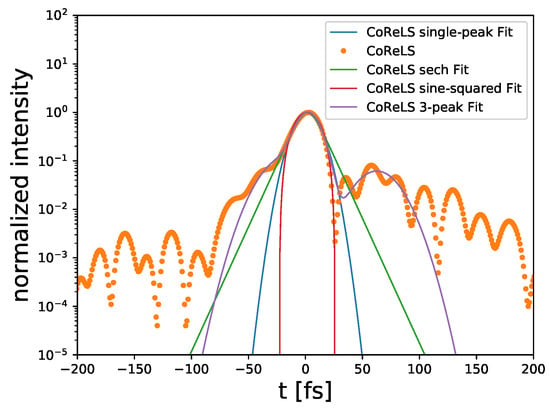
Figure 2.
Temporal profile measured on CoReLS (points) compared to four possible fit functions.
Figure 3 compares the final energy distribution of electrons accelerated by four different temporal profiles, including sine-squared and the recommended hyperbolic secant. The laser has peak intensity corresponding to , focal spot radius m, and full-width half-max duration (measured on intensity) of fs. The electrons are initially zero temperature with initial velocity parallel to the laser propagation axis, , corresponding to kinetic energy keV. The electrons are initially uniformly distributed in a cubic 3-dimensional volume around the focal spot within of the beam axis. Increasing the volume covered by electron initial positions would result in more electrons receiving small or negligible acceleration and thereby increase the weight of around the initial kinetic energy without significantly affecting the fit at higher energies.
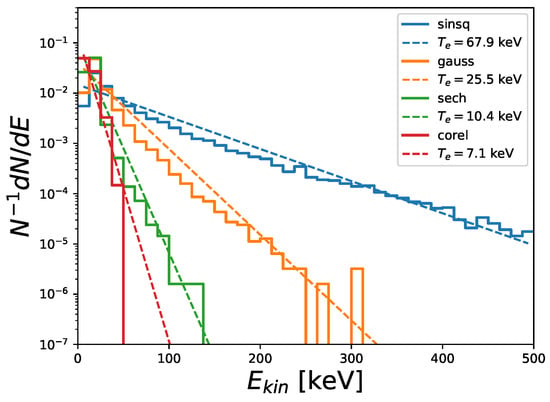
Figure 3.
Normalized electron energy distributions for sine-squared, Gaussian, hyperbolic secant and three-peaked pulse measured at CoReLS. Laser parameters are , m and fs. Maxwellian fits are plotted with the fit temperature shown in the key.
Recalling that the mean energy per particle in a Maxwellian distribution is , we see that sine-squared and Gaussian temporal profiles result in a significant gain in average energy. Compared to the sech profile, Gaussian and sine-squared profiles generally over-estimate energy gain [26]. The three-peaked Gaussian predicts even less energy gain and less heating than the hyperbolic secant. While the hyperbolic secant does not significantly change the average energy, the electron distribution is significantly heated, evolving from a zero-temperature distribution to a finite temperature distribution. Some electrons gain energy, while other electrons lose energy, showing that the reasoning of Ref. [26] is incomplete. This observation of heating without significant change in mean energy is consistent (at the provided, qualitative level) with a more recent experiment at and much longer pulse duration ( ps) [11].
3.3. Phase of Injection
Another reason Ref. [26] may not apply is that the electron–laser interaction is finite in duration, contrary to the setup of the authors’ calculation. Infinite interaction time, in practice, assumes the interaction begins early enough that the switch to laser-dominated dynamics does not occur suddenly. There are two ways this assumption can be violated. First, the presence of nearby charges screens the laser field so that an individual charge is subject to a net force only after the laser field strength becomes greater than the typical electric field in the plasma , which varies greatly depending on the creation of the plasma. This effect explains the success of plasma-mirror injection [13], since electrons are released into free space (ejected from the plasma) near the peak laser intensity and, thus, see a sudden jump from nearly zero average force in plasma to large Lorentz force in the laser field. Second, in case the electrons arise from photoionization, the ionization threshold means that electrons become free only when the laser achieves a field strength comparable to the Coulomb field of the atom. For hydrogen and helium plasmas, this effect is negligible, but for heavy inert gases such as argon or xenon, electrons may be liberated only within one or two decades of the peak intensity, which is the subject of considerable study, e.g., Refs. [9,33,34] and references therein.
A simple model of sudden turn-on is obtained by considering the net force on the particle zero until it passes a given threshold. For simulations, we modify the profile function with a step-function , with the Heaviside function. With the step occurs at . Preceding dynamics are incorporated into the initial distribution of electron positions and momenta. If the threshold arises from screening, the electrons are free but have non-zero momentum, and we assume a maximum entropy distribution (Maxwellian).
The sharp turn-on clearly violates Equation (6), as well as the slowly-varying condition inherent in the RPF [17,35], and we expect both a greater energy gain and a significant asymmetry in the transverse momentum distribution of the final particles. As a consequence, the final particle energy and momentum distribution become sensitive to carrier–envelope phase and other non-ponderomotive effects. Only the Lorentz force solver provides accurate results in this case. The largest asymmetry arises when the electron is injected at a phase corresponding to a maximum of the electric field, and the final electron energy becomes less sensitive to the pulse profile function than the phase at which the interaction begins, in agreement with ionization studies [34].
Figure 4 shows the distribution of final transverse momentum for , which is chosen among many possible values of that can yield electrons with kinetic energy up to ≃900 keV. Notice that the distribution is not azimuthally symmetric with additional higher momenta in the direction, corresponding to particles that first enter the laser field near the focal spot where the laser fields are maximum. As shown by the color-coding these particles also achieve the highest energy, consistent with our reasoning. This effect is particularly large for photo-ionized electrons, which begin free propagation when the peak laser field is in focal region [33]. The anisotropy arises from the maximum of the E field coinciding with the peak of the profile due to the specific value of the carrier–envelope phase in our model of the fields.
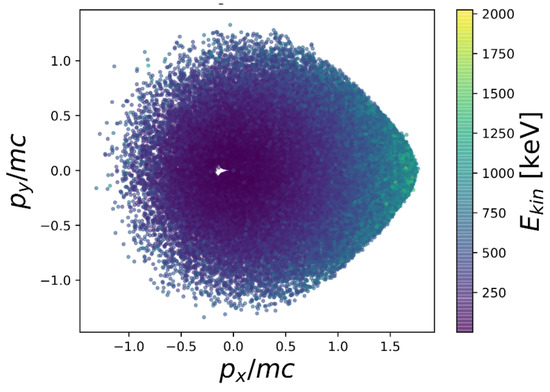
Figure 4.
Scatter plot of final momenta for electrons scattered by a sech-profile pulse (, m, fs) and initial step at .
Measuring the number of free electrons in the laser spot requires a probe with time resolution smaller than the high-intensity laser pulse, which is experimentally very difficult. For this reason, phase of injection as a parameter would probably have to be fit to the data in post-processing and analysis. Such fitting is addressed in part by ongoing efforts to observe strong-field ionization processes and validate theory calculations of the ionization rate.
3.4. Initial Transverse Momentum
In the experiment of Ref. [6], the electrons were generated by laser-ablation of a solid target situated off the axis of the acceleration laser’s propagation. The schematic in Figure 1 of Ref. [6] does not give the off-axis distance, but the fact that acceleration laser was focused with an f/3 OAP suggests that the angle from which the electrons entered the focal region was greater than tan. Equivalently .
Although the RPF is azimuthally symmetric for a Gaussian beam model of a laser field, the final distribution of electrons scattered by the laser is azimuthally symmetric if, and only if, the initial distribution is azimuthally symmetric. Ref. [17] observed a ring in the – plane (their Figure 9) because they initialized the electrons in an infinitely thin disk centered on the beam axis with velocity co-linear to the pulse propagation. The initial transverse momentum present in the experiment breaks the azimuthal symmetry of the scattering, and a broader three-dimensional distribution of electron initial positions shows many electrons scattering into smaller final states. Azimuthal symmetry will be visible for very large energy gain , because in this limit the initial state momentum is negligible compared to the final momentum.
To illustrate, we simulate electrons traveling toward the focal region at a angle from the beam axis. The electrons are initially uniformly distributed off-axis between the laser pulse and focal plane and all have the same speed . The laser pulse has a Gaussian temporal profile, peak intensity , focal spot size 20 m and duration 350 fs. We verified that the same results are generated by solving either the RPF or the Lorentz force.
The distribution of final electron momentum in Figure 5 shows that most electrons remain in the injection plane, whether aligned with polarization or not. Electrons that interact with only the edges of the pulse (in space or time) are accelerated less and diverted less from their initial momentum vectors. For this reason, it remains surprising that Ref. [6] did not observe electrons upon rotating the plane of polarization; the electron source and detector remained in the same plane and only the laser’s polarization changed by . This suggests that more than one revision to the model of the experiment will be necessary to fit the data.
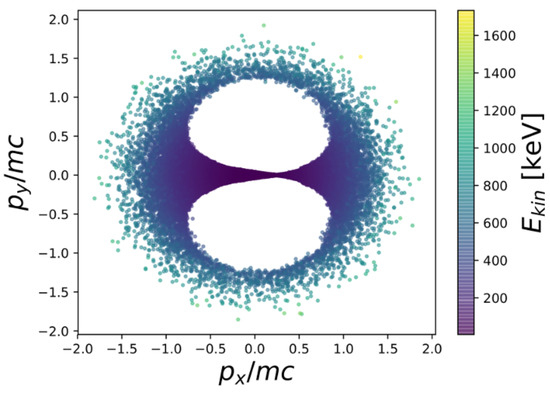
Figure 5.
Scatter plot of final momenta for electrons scattered by a sine-squared profile pulse (, m, fs). Electrons have and enter the focal region at from the laser axis.
The highest energy electrons are scattered more nearly isotropically, but only if the initial distribution of electrons accesses the full transverse distribution of the laser fields. If the electrons responsible for the detector signal arrive in the focal region before the pulse does, then they homogeneously sample the transverse intensity gradients, with different electrons seeing gradients in different radial directions. On the other hand, if the electron energy and time-of-arrival at the focal region are correlated (e.g., due to dynamics at the source), then time-of-arrival becomes another model parameter.
Figure 6 shows the final (in polarization plane) as a function of the initial position for the same parameters as Figure 5. With the magnitude of the velocity fixed for all particles, initial position completely determines the time-of-arrival. Electrons arriving in the focal region ahead of the laser pulse scatter in the direction, because, with the highest intensity on axis and behind them, they experience a ponderomotive force in the direction. In contrast, electrons arriving slightly later than the laser pulse, see the ponderomotive force pointing in the direction. Therefore, a 100 fs variation in the source dynamics (much smaller than the ablation time scale in the experiment) enhances or suppresses the number of electrons reaching the detector, which was placed on only one side of the beam axis.
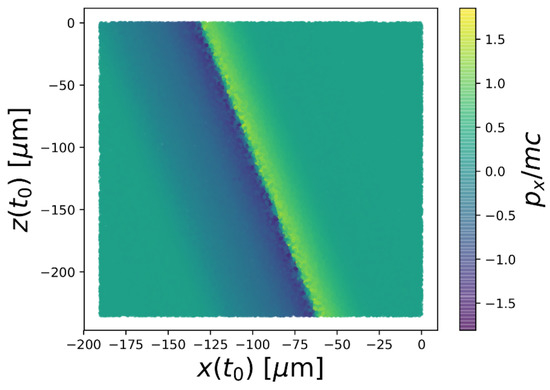
Figure 6.
In-plane momentum (normalized to mass, ) as a function of initial position for the simulation that above reproduced data of [6] using initial transverse velocity.
In future experiments, the source of electrons must be thoroughly characterized before data shots with the scattering laser on. Moreover, this characterization must be accompanied by analysis of the uncertainties in order to distinguish the signal from random fluctuations of the source once the scattering laser is on.
3.5. Shot-to-Shot Variations in the Laser
Laser systems fluctuate. The energy input during amplification, the spectrum of the pulse and the pointing all vary from shot to shot. These fluctuations mean the on-target pulse profile, focal spot size, and intensity distribution in space and time [36] differ from shot to shot. Systematic changes could have a similar or greater impact: in Ref. [6] changing the polarization of the laser with an optical element could result in uncontrolled changes to the wavefront, impacting both focus quality and pulse duration.
Many changes in the laser cannot be accounted for by the gaussian beam model used here. Physically, most causes of shot-to-shot variances will result also in departures from the nominal model of the near-focus laser fields. Since approximations such as the Gaussian beam and RPF depend on the laser parameters, the accuracy of predictions also varies with the fluctuations in the laser. Even so, varying the parameters of the Gaussian beam model provides an estimate of the impact of shot-to-shot (statistical) variation in observables. Comparing spectra shows that an error or fluctuation in spot size leads to an order of magnitude difference in the number of electrons detected.
In order to quantify the typical shot-to-shot difference arising from incorrect or fluctuating laser parameters, we introduce a crude error functional,
which compares for two sets () of laser and plasma initial conditions and outputs a number. The error Equation (10) could be experimentally measured, provided a laser system with sufficiently precise control to run statistically distinct experiments at the parameter sets (1) and (2), in which case the average and the standard deviation of the spectrum could be obtained over shots at a given parameter set. Equation (10) can be thought of as the simplest metric on the abstract space of spectra, though it is neither a standard measure of error nor a prediction interval. For the present it provides an intuitive measure of the difference between a predicted electron spectrum and a measured result in case of few shots where a proper average cannot be constructed.
The particle spectrum is frequently measured with magnetic spectrometers, which require pinholes or similar mechanisms to reduce the acceptance and ensure accurate reconstruction of the particle energy. Consequently, experimental spectra are measured along narrow, predetermined sight-lines from the focal point. The small acceptance introduces additional shot-to-shot noise in the measurement, which we estimate by Monte Carlo, computing Equation (10).
Intuition from the ponderomotive force described above suggests that acceleration should strongly depend on the laser spot size, since the spot size sets the scale of transverse gradients, as well as the Rayleigh range. Spatiotemporal coupling effects in high intensity beams can produce spot size variation of order [36], resulting in significant difference in the accelerated electron distribution. Figure 7 shows the error functional as the spot size deviates from the expected spot size of 10 m. The two curves correspond to spectra measured on sight lines at and from the laser axis. These two sight lines are selected due to their appearance in Ref. [6]. They are representative for more recent experiments as well, because electron spectrometers typically remain off-axis while a primary diagnostic (e.g., ion spectrometer) occupies the laser axis () position. The laser energy is 20 J, pulse duration 367 fs, and the temporal profile Gaussian. The laser begins 20 Rayleigh lengths from the focal plane, and the electrons are initially uniformly distributed in a box between the laser and the focal plane extending 13 microns from the beam axis. The electrons have initial momentum co-linear to the laser propagation axis and initial energy following a Maxwellian distribution with temperature 10 keV.
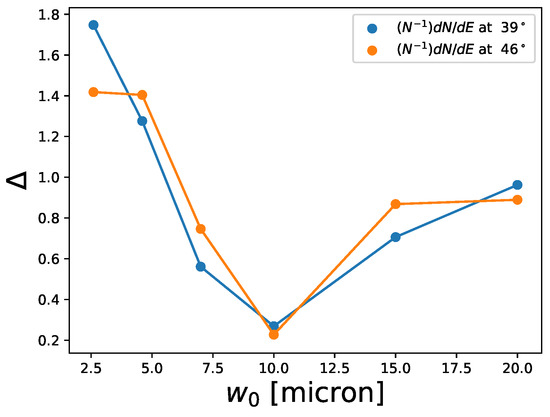
Figure 7.
The error functional Equation (10) along two sight lines, 39 and 46 from the beam axis for a 20 J, 367 fs laser pulse for varying waist size .
The error measure is non-zero at 10 m because we have run two simulations with identical parameters but different random seeds which produces microscopically different electron distributions. The value at 10 m is, thus, a measure of the shot-to-shot noise in the measurement. Smaller spot sizes significantly increase the gradients and hence the acceleration leading to broader distributions and slightly fewer electrons significantly accelerated. Both effects enhance the error functional. Larger spot sizes decrease the gradients but have a smaller effect on the number of electrons significantly accelerated since the field strengths and gradients in the larger focal region have been reduced. The quantitative size of these effects also depends on the error measure chosen. This reasoning suffices to predict a larger difference when the spot size is smaller than expected as observed in Figure 7. On the other hand, effects such as spatiotemporal coupling are more likely to cause error in the direction of larger spot size than expected.
Addressing the shot-to-shot variances of laser systems will require both new measurement techniques and data analysis techniques. High-intensity lasers are technically difficult to diagnose, often because the intensity and/or physical size of the beam is too great for well-established optical diagnostics. In many cases the experimental setup precludes measuring laser parameters on-shot. These facts require complementary development of statistical analysis of laser performance, especially issues, such as the correlation between partial-beam measurements (e.g., of energy and temporal profile) to full-beam measurements.
Some measurements, such as the complete spatio-temporal profile, are only possible in scanning mode with only a tiny fraction of the full pulse energy (–). Single shot measurements do not exist, and, therefore, the variation between two single shots at full energy is unknown. At higher peak intensities, even percent or per mille level fluctuations can have an effect. Full energy shots at the largest laser systems are essentially experiments in their own right. Since experimental campaigns on large single-shot (100–1000 J) class lasers consist of a few tens of shots at most, using a significant number of those for laser characterization would have a large impact on the actual experiment. As laser performance parameters are liable to evolve over time, one would have to repeat this characterization for every experiment. Only systematic development and constant calibration of new on-shot diagnostics can rectify this situation.
4. Fitting an Example Experiment
The interpretation of the data in Ref. [6] was criticized as being incompatible with the theory of laser acceleration in a vacuum. In the experiment, an W/cm laser interacted with low energy ( keV) electrons and accelerated electrons to 200–900 keV, observed in the polarization plane but not perpendicular to it. The angle and energy distributions were considered consistent with a simple model of the laser fields. However, others argued that in the laser’s parameter regime, electrons should not be able to gain energy [26], and an equal number of electrons should be observed in the plane perpendicular to laser polarization, because the RPF scatters electrons into an azimuthally symmetric distribution about the laser axis [17].
More recent experiments have also set out to measure energy gain by free electrons interacting with a laser in vacuum, but do not provide insight into the older experiment. Both Refs. [11,12] report energy gain much smaller () than reported by [6] (), and, in fact, the data provided in those works are insufficient to determine whether significant energy gain was detected. In both Refs. [11,12] electrons initially have finite kinetic energy and significant dispersion in energy. One qualitatively observes increased dispersion, showing that some electrons gain energy, but does not show that the average energy of the electron increases [11]. The other omits the data necessary to distinguish increased dispersion from an increased average energy [12]. Acceleration of photoionized electrons is not comparable, because the electron becomes free to move under influence of the laser field only at a finite time, typically close the peak laser intensity. As we discuss below, this semi-infinite interaction time has an important impact on the electron dynamics and possibility of energy gain. However, in one experiment, measurements in the plane perpendicular to polarization suggest that photoionized electrons may have been accelerated into a more azimuthally symmetric distribution [37].
Theory and experiment work has suggested that improved modeling of the electrons’ initial momentum distribution could help explain the discrepancy [33], but dedicated modeling of the experiment conditions is necessary to see whether or not a particular missing effect suffices to explain the data in Ref. [6]. Indeed, a significant reason for the disagreement is that theory contributions often work on generalities, simulate special cases, and, therefore, miss the impact of experiments’ specific conditions.
We may now proceed to explain the data of Ref. [6]. The most difficult feature to fit is the absence of electrons perpendicular to the polarization plane. To compare electron numbers in-plane of polarization to out-of-plane of polarization, the authors kept the apparatus fixed and rotated the polarization of laser. However, this method actually changes two parameters, both the initial momentum vector and the observation line of sight being rotated into the plane perpendicular to polarization. Thus, the experiment did not measure how much electrons are scattered out of the initial plane, which is defined by the initial momentum and laser propagation vectors. As noted above (cf. Section 3.4), the RPF leads one to expect the highest energy electrons are scattered azimuthally symmetrically while lower energy electrons remain closer to the initial plane. The absence of signal even at low energy suggests that the result may be partially due to different numbers of electrons from the source on different shots.
Nevertheless, we fit the data assuming the electron source remains consistent between shots to demonstrate the importance of the missing pieces of the model we identified above. Each of the four effects can enhance or suppress the number of electrons detected along the chosen sightline by a factor 10, and each alone is insufficient to explain the ≳100-times difference in electron number between the in-plane and out-of-plane shots. To obtain the ∼100-fold difference, we combine a change in laser spot size with either the sudden turn-on or the initial transverse momentum. Although, in a simplistic model, varying may be the most relevant change in the laser since wavefront differences from rotating the polarization can easily translate into less energy enclosed in the FWHM central disk.
The first fit is shown in Figure 8. In comparing to the data, we fix the laser energy, pulse duration and select an injection phase by fitting at and in the plane of polarization. We set the overall normalization of the predicted to fit the data, since it reflects the total number of electrons in the experiment (which in turn depends on efficiency of the source) and is not part of our modeling. We then vary the spot size to obtain a second prediction such that the out-of-polarization-plane prediction fits the (absence of) signal. We plot the predictions together with the data in the same manner as Figure 2 of Ref. [6].
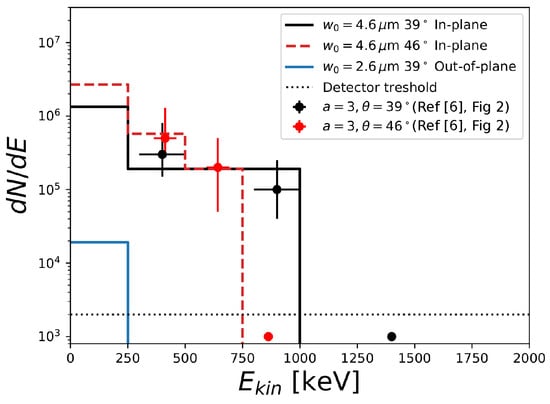
Figure 8.
Measured spectra for a 20 J, 367 fs laser pulse, allowing to differ between in-plane (m) and out-of-plane (m) measurements.
For this first fit, we use a Gaussian temporal profile. The specific parameters that fit the data depend on the pulse profile function, but we have found fitting parameters for each profile function.
In the second fit, Figure 9, we follow the same procedure, choosing the laser parameters and initial transverse momentum to fit the in-plane measurements of and then varying the spot size to reproduce the relative suppression of out-of-plane electron number. In this case, we use a sine-squared temporal profile, which yields higher energy electrons without any sudden turn-on (recall Figure 3). Computing for the in-plane and out-of-plane measurements, we obtain 1.98 and 1.87 at and , respectively, showing how the functional signifies a nearly 0 or 1 difference in signal.
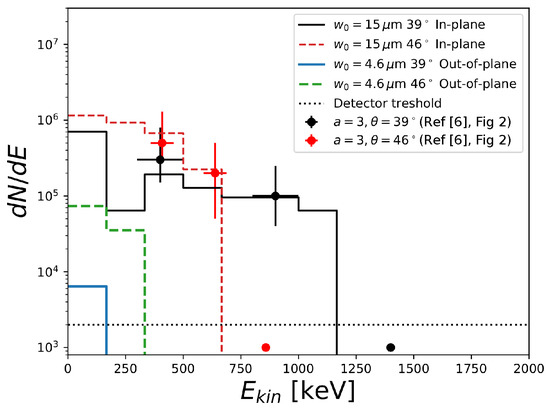
Figure 9.
Measured spectra for a 16 J, 350 fs laser pulse, allowing to differ between in-plane (m) and out-of-plane (m) measurements.
Quantifying the goodness of fit is not productive in this case, because even this almost-minimal modeling has more parameters than the data have points to fit. Qualitative comments are in order though: the goodness of the fit depends also on how the simulation and experiment data are binned. We have chosen bin sizes roughly equal to the displayed uncertainty in the energy measurements presented in Ref. [6]. If we reduce the bin size, more information in the spectrum would become visible, which might provide more information about the physics of the interaction. However, even constrained to the bin size suggested by the experimental resolution, the fit can be improved or degraded by changing bin size.
5. Conclusions
We have investigated how several unmeasured and unmodeled conditions of the experiment in Ref. [6] affect widely-recognized phenomenological features of laser acceleration in vacuum. We showed that these differences between application of the theory and the experiment suffice to change qualitatively the predicted electron distributions and, thus, could have obscured the physics in the experiment. Our results suggest that any one or more of these unaccounted effects can make predictions consistent the experimental data, but too little information makes it impossible to fit the data uniquely. We cannot conclude with an overall “best fit” interpretation of the data.
Since that early publication, other experiments have added data, all of which are consistent with the theoretical understanding of laser acceleration in vacuum. Very long laser pulses interacting with low-energy free electrons result in very little average energy gain but do increase electrons’ energy spread [11,12]. The sudden turn-on of the laser–electron interaction, whether due to ionization near the peak intensity [7,8,9,10,34] or ejection from a dense plasma [13], can yield much higher energy gain. Sudden turn-on makes the electron energy less sensitive to the temporal profile and more sensitive to precise magnitude of the field and initial momentum distribution of the electrons at the beginning of the interaction.
Some of the lessons of this exercise have appeared in the laser-plasma literature, but in our opinion remain under-appreciated. For instance, simulations including the dynamic development of preplasma [31] emphasize the importance of the initial plasma or electron distribution. Measuring the laser’s shot-to-shot variations in performance is now recognized as important to stabilizing Wakefield accelerators [38]. Knowing the laser pulse’s temporal profile is important when the electrons are likely to see the early-time features, whether a slow exponential turn-on (such as a sech profile) or an extra peak in the pre-pulse. It is less important when the electrons start to interact with the laser later in the pulse, particularly near the peak. Provided this more detailed information of the conditions, we can try to fit the more-difficult-to-measure parameters, such as the time at which the free particle–laser interaction begins. For example, ion energy correlates with focal spot size [39], pointing the way toward an in situ measurement of peak intensity. Such an approach must be validated with correct statistical analysis.
Developing these measurement and data analysis procedures is essential to discovery goals in future laser–plasma experiments. Precise single-electron dynamics are crucial to validating theories of radiation reaction and strong-field ionization, particularly as experiments continue to much higher intensity. To demonstrate the importance of accurate knowledge of laser parameters, we compute Equation (10) for deviations from nominal parameters at selected high-intensity laser facilities given in Table 1. We compare predictions for two different values of the laser spot size , one the nominal focal spot size given in the table and second a focal spot twice as large. Only the laser spot size differs for the spectra compared in each value of ; all other laser parameters and electron initial conditions remain the same. The pulse temporal profile is Gaussian and the spectra are integrated over .

Table 1.
The pulse duration is measured as intensity full-width half-max. The pulse profile is always Gaussian. Malka 1 uses the laser energy and pulse duration of Ref. [6] with the nominal best focus for an f/3 mirror. Malka 2 has mostly the same laser parameters as Malka 1 but is compressed to 50 fs, as would be possible with current laser technology.
Figure 10 shows a large difference in the accelerated electron spectra. For comparison, the baseline value of for two simulations with the same laser parameters but different randomized electron positions and momenta is less than 0.2 as shown in Figure 7. increases with intensity, suggesting that uncertainty arising from unknown or fluctuating laser parameters becomes a more serious problem on higher-intensity laser systems. The four issues addressed here do not cover all the myriad ways in which experiments depart from theorists’ idealized conditions. Our concern is that without improved modeling and data-analytic efforts, experiments can misidentify as signal what is actually shot-to-shot fluctuation in laser or plasma conditions.
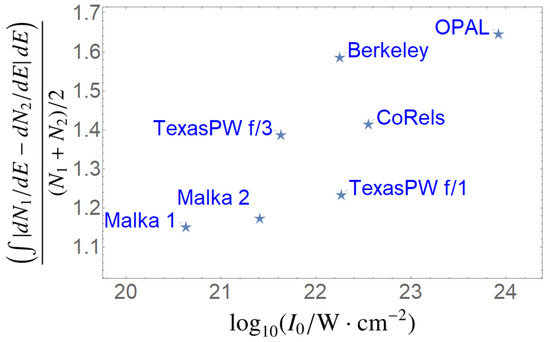
Figure 10.
The error measure for current and future laser facilities’ nominal operating parameters in Table 1. For each point marked by a star plotted at the facility’s nominal peak intensity, laser energy is constant while the waist size increased by a factor 2. Other laser and electron parameters remain the same between the simulated spectra.
Author Contributions
Conceptualization, B.M.H., L.L. and O.Z.L.; methodology, L.L. and O.Z.L.; software, O.Z.L.; validation, L.L. and O.Z.L.; formal analysis, L.L. and O.Z.L.; investigation, L.L. and O.Z.L.; data curation, L.L. and O.Z.L.; writing—original draft preparation, L.L.; writing—review and editing, B.M.H.; visualization, L.L. and O.Z.L.; supervision, B.M.H.; project administration, B.M.H.; funding acquisition, B.M.H. All authors have read and agreed to the published version of the manuscript.
Funding
This work is supported by Air Force Office of Scientific Research (FA9550-14-1-0045), the Los Alamos National Lab Office of Experimental Sciences (RFP475852), and Tau Systems, Inc.
Institutional Review Board Statement
Not applicable.
Informed Consent Statement
Not applicable.
Data Availability Statement
Experimental data are previously published in Ref. [6].
Acknowledgments
L.L. and O.Z.L. thank the Center for Relativistic Laser Science at the Gwangju Institute for Science and Technology for hospitality and Lynn Labun for continuing support.
Conflicts of Interest
The authors declare no conflict of interest.
Appendix A. Gaussian Beam Model
If we assume the intensity distribution in the focal plane is Gaussian, the solution to Maxwell’s equations reproduces the Gaussian beam as an expansion in powers of [17]
In practice, with the upper bound attained by the most strongly focused systems where the waist size is similar to the wavelength . Second order corrections are, therefore, of the same order as shot-to-shot variance in other laser parameters and smaller than corrections to wavefronts [36,41]. As coefficients of the higher order corrections appear to grow less than factorially [42], the series should be reasonably convergent. No new field components appear at higher orders at the expansion, meaning that new qualitative changes to the trajectories are excluded. Together, these facts justify truncating after .
Finite pulse duration effects on the field distribution can be derived analytically [17], and the corresponding expansion parameter is defined as
We do not model here experimental effects due to variations in the amplification spectrum [36].
The resulting set of fields is,
for linear polarization,
where is a polarization unit vector orthogonal to the wavevector , is the waist radius, , and is the peak electric field. The beam radius varies as a function of distance from the focal plane,
and the phase is also a function of distance from the focal plane,
The fields differ for each profile function and are derived by expanding the Fourier transform with respect to t,
where the second term is since the derivative on the profile function brings in powers of .
Using superscripts to denote the order in each of the respective small parameters , we have
to order implemented in our simulations. The same form holds for .
References
- Falcone, R.; Albert, F.; Beg, F.; Glenzer, S.; Ditmire, T.; Spinka, T.; Zuegel, J. Workshop Report: Brightest Light Initiative (March 27–29 2019, OSA Headquarters, Washington, DC). arXiv 2020, arXiv:2002.09712. [Google Scholar] [CrossRef]
- Hegelich, B.M.; Labun, L.; Labun, O.Z. Finding quantum effects in strong classical potentials. J. Plasma Phys. 2017, 83, 595830301. [Google Scholar] [CrossRef]
- Cole, J.; Behm, K.; Gerstmayr, E.; Blackburn, T.; Wood, J.; Baird, C.; Duff, M.J.; Harvey, C.; Ilderton, A.; Joglekar, A.; et al. Experimental evidence of radiation reaction in the collision of a high-intensity laser pulse with a laser-wakefield accelerated electron beam. Phys. Rev. X 2018, 8, 011020. [Google Scholar] [CrossRef]
- Poder, K.; Tamburini, M.; Sarri, G.; Di Piazza, A.; Kuschel, S.; Baird, C.; Behm, K.; Bohlen, S.; Cole, J.; Corvan, D.; et al. Experimental signatures of the quantum nature of radiation reaction in the field of an ultraintense laser. Phys. Rev. X 2018, 8, 031004. [Google Scholar] [CrossRef]
- Jaroszynski, D.; Bingham, R.; Brunetti, E.; Ersfeld, B.; Gallacher, J.; van Der Geer, B.; Issac, R.; Jamison, S.; Jones, D.; De Loos, M.; et al. Radiation sources based on laser–plasma interactions. Philos. Trans. R. Soc. Lond. A Math. Phys. Eng. Sci. 2006, 364, 689–710. [Google Scholar] [CrossRef]
- Malka, G.; Lefebvre, E.; Miquel, J.L. Experimental Observation of Electrons Accelerated in Vacuum to Relativistic Energies by a High-Intensity Laser. Phys. Rev. Lett. 1997, 78, 3314. [Google Scholar] [CrossRef]
- McNaught, S.; Knauer, J.; Meyerhofer, D. Photoelectron initial conditions for tunneling ionization in a linearly polarized laser. Phys. Rev. A 1998, 58, 1399. [Google Scholar] [CrossRef]
- Moore, C.; Ting, A.; McNaught, S.; Qiu, J.; Burris, H.; Sprangle, P. A laser-accelerator injector based on laser ionization and ponderomotive acceleration of electrons. Phys. Rev. Lett. 1999, 82, 1688. [Google Scholar] [CrossRef]
- DiChiara, A.; Ghebregziabher, I.; Sauer, R.; Waesche, J.; Palaniyappan, S.; Wen, B.; Walker, B. Relativistic MeV photoelectrons from the single atom response of argon to a 1019 W/cm2 laser field. Phys. Rev. Lett. 2008, 101, 173002. [Google Scholar] [CrossRef]
- Payeur, S.; Fourmaux, S.; Schmidt, B.; MacLean, J.; Tchervenkov, C.; Légaré, F.; Piché, M.; Kieffer, J. Generation of a beam of fast electrons by tightly focusing a radially polarized ultrashort laser pulse. Appl. Phys. Lett. 2012, 101, 041105. [Google Scholar] [CrossRef]
- Cline, D.; Shao, L.; Ding, X.; Ho, Y.; Kong, Q.; Wang, P. First observation of acceleration of electrons by a laser in a vacuum. J. Mod. Phys. 2013, 4, 26491. [Google Scholar] [CrossRef]
- Carbajo, S.; Nanni, E.A.; Wong, L.J.; Miller, R.; Kärtner, F.X. Direct laser acceleration of electrons in free-space. arXiv 2015, arXiv:1501.05101. [Google Scholar] [CrossRef]
- Thévenet, M.; Leblanc, A.; Kahaly, S.; Vincenti, H.; Vernier, A.; Quéré, F.; Faure, J. Vacuum laser acceleration of relativistic electrons using plasma mirror injectors. Nat. Phys. 2016, 12, 355–360. [Google Scholar] [CrossRef]
- Hadad, Y.; Labun, L.; Rafelski, J.; Elkina, N.; Klier, C.; Ruhl, H. Effects of Radiation-Reaction in Relativistic Laser Acceleration. Phys. Rev. 2010, 82, 096012. [Google Scholar] [CrossRef]
- Bula, C.; McDonald, K.T.; Prebys, E.J.; Bamber, C.; Boege, S.; Kotseroglou, T.; Melissinos, A.C.; Meyerhofer, D.D.; Ragg, W.; Burke, D.L.; et al. Observation of nonlinear effects in Compton scattering. Phys. Rev. Lett. 1996, 76, 3116–3119. [Google Scholar] [CrossRef]
- Bamber, C.; Boege, S.J.; Koffas, T.; Kotseroglou, T.; Melissinos, A.C.; Meyerhofer, D.D.; Reis, D.A.; Ragg, W.; Bula, C.; McDonald, K.T.; et al. Studies of nonlinear QED in collisions of 46.6-GeV electrons with intense laser pulses. Phys. Rev. 1999, 60, 092004. [Google Scholar] [CrossRef]
- Quesnel, B.; Mora, P. Theory and simulation of the interaction of ultraintense laser pulses with electrons in vacuum. Phys. Rev. 1998, 58, 3719–3732. [Google Scholar] [CrossRef]
- Beg, F.; Bell, A.; Dangor, A.; Danson, C.; Fews, A.; Glinsky, M.; Hammel, B.; Lee, P.; Norreys, P.; Tatarakis, M. A study of picosecond laser–solid interactions up to 1019 W cm−2. Phys. Plasmas 1997, 4, 447–457. [Google Scholar] [CrossRef]
- Key, M.; Cable, M.; Cowan, T.; Estabrook, K.; Hammel, B.; Hatchett, S.; Henry, E.; Hinkel, D.; Kilkenny, J.; Koch, J.; et al. Hot electron production and heating by hot electrons in fast ignitor research. Phys. Plasmas 1998, 5, 1966–1972. [Google Scholar] [CrossRef]
- Wilks, S.; Langdon, A.; Cowan, T.; Roth, M.; Singh, M.; Hatchett, S.; Key, M.; Pennington, D.; MacKinnon, A.; Snavely, R. Energetic proton generation in ultra-intense laser–solid interactions. Phys. Plasmas 2001, 8, 542–549. [Google Scholar] [CrossRef]
- Esirkepov, T.; Yamagiwa, M.; Tajima, T. Laser ion-acceleration scaling laws seen in multiparametric particle-in-cell simulations. Phys. Rev. Lett. 2006, 96, 105001. [Google Scholar] [CrossRef] [PubMed]
- Haines, M.; Wei, M.; Beg, F.; Stephens, R. Hot-electron temperature and laser-light absorption in fast ignition. Phys. Rev. Lett. 2009, 102, 045008. [Google Scholar] [CrossRef] [PubMed]
- Yang, J.; Craxton, R.; Haines, M. Explicit general solutions to relativistic electron dynamics in plane-wave electromagnetic fields and simulations of ponderomotive acceleration. Plasma Phys. Control Fusion 2011, 53, 125006. [Google Scholar] [CrossRef]
- Ebisuzaki, T.; Tajima, T. Pondermotive acceleration of charged particles along the relativistic jets of an accreting blackhole. Eur. Phys. J. Spec. Top. 2014, 223, 1113–1120. [Google Scholar] [CrossRef]
- Lau, C.; Yeh, P.C.; Luk, O.; McClenaghan, J.; Ebisuzaki, T.; Tajima, T. Ponderomotive acceleration by relativistic waves. Phys. Rev. Spec.-Top.-Accel. Beams 2015, 18, 024401. [Google Scholar] [CrossRef]
- McDonald, K.T. Comment on Experimental observation of electrons accelerated in vacuum to relativistic energies by a high-intensity laser. Phys. Rev. Lett. 1998, 80, 1350. [Google Scholar] [CrossRef]
- Dinu, V.; Heinzl, T.; Ilderton, A. Infra-Red Divergences in Plane Wave Backgrounds. Phys. Rev. 2012, D86, 085037. [Google Scholar] [CrossRef]
- Schwinger, J.S. On gauge invariance and vacuum polarization. Phys. Rev. 1951, 82, 664–679. [Google Scholar] [CrossRef]
- Landau, L.; Lifshitz, E. The Classical Theory of Fields, Course of Theoretical Physics; Pergamon Press: Oxford, UK, 1971. [Google Scholar]
- Sarachik, E.; Schappert, G. Classical theory of the scattering of intense laser radiation by free electrons. Phys. Rev. D 1970, 1, 2738. [Google Scholar] [CrossRef]
- Sentoku, Y.; Iwata, N.; Koga, J.; Dover, N.; Nishiuchi, M. Plasma formation and target preheating by prepulse of PW laser light. In Proceedings of the APS Division of Plasma Physics Meeting Abstracts, Milwaukee, WI, USA, 23–27 October 2017; Volume 2017, p. PP11.00016. [Google Scholar]
- Kumar, S.; Gopal, K.; Gupta, D.N. Proton acceleration from overdense plasma target interacting with shaped laser pulses in the presence of preplasmas. Plasma Phys. Control Fusion 2019, 61, 085001. [Google Scholar] [CrossRef]
- Chowdhury, E.A.; Ghebregziabher, I.; MacDonald, J.; Walker, B.C. Electron momentum states and bremsstrahlung radiation from the ultraintense field ionization of atoms. Opt. Express 2004, 12, 3911–3920. [Google Scholar] [CrossRef] [PubMed]
- Yandow, A.; Toncian, T.; Ditmire, T. Direct laser ion acceleration and above-threshold ionization at intensities from 1021 W/cm2 to 3 × 10²³ W/cm2. Phys. Rev. A 2019, 100, 053406. [Google Scholar] [CrossRef]
- Startsev, E.; McKinstrie, C. Multiple scale derivation of the relativistic ponderomotive force. Phys. Rev. E 1997, 55, 7527. [Google Scholar] [CrossRef]
- Pariente, G.; Gallet, V.; Borot, A.; Gobert, O.; Quéré, F. Space–time characterization of ultra-intense femtosecond laser beams. Nat. Photonics 2016, 10, 547. [Google Scholar] [CrossRef]
- Kalashnikov, M.; Andreev, A.; Ivanov, K.; Galkin, A.; Korobkin, V.; Romanovsky, M.; Shiryaev, O.; Schnuerer, M.; Braenzel, J.; Trofimov, V. Diagnostics of peak laser intensity based on the measurement of energy of electrons emitted from laser focal region. Laser Part. Beams 2015, 33, 361–366. [Google Scholar] [CrossRef]
- Maier, A.R.; Delbos, N.M.; Eichner, T.; Hübner, L.; Jalas, S.; Jeppe, L.; Jolly, S.W.; Kirchen, M.; Leroux, V.; Messner, P.; et al. Decoding sources of energy variability in a laser-plasma accelerator. Phys. Rev. X 2020, 10, 031039. [Google Scholar] [CrossRef]
- Vais, O.; Thomas, A.; Maksimchuk, A.; Krushelnick, K.; Bychenkov, V.Y. Characterizing extreme laser intensities by ponderomotive acceleration of protons from rarified gas. New J. Phys. 2020, 22, 023003. [Google Scholar] [CrossRef]
- Nakamura, K.; Mao, H.S.; Gonsalves, A.J.; Vincenti, H.; Mittelberger, D.E.; Daniels, J.; Magana, A.; Toth, C.; Leemans, W.P. Diagnostics, control and performance parameters for the BELLA high repetition rate petawatt class laser. IEEE J. Quantum Electron. 2017, 53, 1–21. [Google Scholar] [CrossRef]
- Tiwari, G.; Gaul, E.; Martinez, M.; Dyer, G.; Gordon, J.; Spinks, M.; Toncian, T.; Bowers, B.; Jiao, X.; Kupfer, R.; et al. Beam distortion effects upon focusing an ultrashort petawatt laser pulse to greater than 1022 W/cm2. Opt. Lett. 2019, 44, 2764–2767. [Google Scholar] [CrossRef]
- Salamin, Y.I. Fields of a Gaussian beam beyond the paraxial approximation. Appl. Phys. B 2007, 86, 319. [Google Scholar] [CrossRef]
Disclaimer/Publisher’s Note: The statements, opinions and data contained in all publications are solely those of the individual author(s) and contributor(s) and not of MDPI and/or the editor(s). MDPI and/or the editor(s) disclaim responsibility for any injury to people or property resulting from any ideas, methods, instructions or products referred to in the content. |
© 2023 by the authors. Licensee MDPI, Basel, Switzerland. This article is an open access article distributed under the terms and conditions of the Creative Commons Attribution (CC BY) license (https://creativecommons.org/licenses/by/4.0/).