Communication

A Fiber-Coupled Quartz-Enhanced Photoacoustic Sensor for Dissolved Gas Detection

1
Changchun Institute of Optics, Fine Mechanics and Physics, Chinese Academy of Sciences, Changchun 130033, China
2
University of Chinese Academy of Sciences, Beijing 100049, China
*
Author to whom correspondence should be addressed.
Photonics 2023, 10(2), 127; https://doi.org/10.3390/photonics10020127
Submission received: 5 January 2023 / Revised: 18 January 2023 / Accepted: 24 January 2023 / Published: 27 January 2023
(This article belongs to the Special Issue Applications of Laser Spectroscopy)

Abstract

:
Detection of dissolved gases in oceans is critically needed for global carbon cycle investigation. However, most in situ optical detection techniques, as far as we know, have restricted measurement efficiency due to large gas consumption. Herein, we develop a sub-mL photoacoustic gas sensor with a simple configuration. A single-mode fiber directly guides the incident laser into the photoacoustic cell without any other free-space optics. Thus, a reduced inner size of 12 mm × 6 mm × 4 mm enables the effective detection of limited dissolved gas. We employ methane (CH4) as an example to demonstrate its sensing performance. The sensor achieves a good linear response with an R-square value of 0.9989 and a minimum detection limit of 1.1 ppmv, corresponding to a normalized noise equivalent absorption coefficient of 7.75 × 10⁻⁸ W·cm−1·Hz−1/2.

1. Introduction

As an important part of the global carbon cycle, oceans store 38,000 Gt of carbon [1], which is dozens of times greater than that achieved by atmospheric and terrestrial carbon storage. Greenhouse gases such as methane (CH4) and carbon dioxide (CO2) are crucial dissolved gases, especially in the extreme window of cold springs and hydrothermal solutions [2,3]. Precise measurement of the components, concentrations and spatiotemporal distribution of dissolved gases is essential to investigate the global carbon cycle, the deep sea ecological environment, and global climate change [4,5,6]. The main current techniques for dissolved gas detection include sampling analysis and in situ optical detection. Sampling analysis with precise laboratory instruments, such as gas chromatography [7,8,9], is a common method to analyze dissolved gases in surface seawater in the early stage of marine detection. However, potential sample change and discontinuous sampling may result in systematic errors, which must be considered in data analysis. Spectroscopic technologies, such as evanescent wave and Raman spectroscopy, have been implemented for high-concentration dissolved gas measurement [10,11], demonstrating the advantages of high precision and non-contact measurement, as well as the challenges of limited sensitivity. Further, the emergence of polymer materials with hydrophobic permeability [12] enables in situ deep-sea dissolved gas detection by encapsulating instruments in a cavity with high pressure-bearing capacity and separating the dissolved gases from seawater [13,14,15].
Infrared absorption-based spectroscopic sensors with high sensitivity and high selectivity have been developed for dissolved gas measurement. These techniques include non-dispersive infrared spectroscopy (NDIR), tunable diode laser absorption spectroscopy (TDLAS) and cavity-enhanced absorption spectroscopy (CEAS). Using a broadband laser as light source, the NDIR selects strong absorption lines of target gases for detection with filters [16]. TDLAS uses a narrow linewidth laser to obtain high spectral resolution and leverages wavelength modulation spectroscopy to further improve its sensitivity and immunity to interference [17]. CEAS enhances the detection sensitivity by significantly increasing the light–gas interaction length for a limited chamber size. Using the CEAS with an off-axis integrated cavity, Wankel et al. measured the dissolved CH4 and its isotopes in oceans [18]. A long optical path contributes to the improvement of detection sensitivity. However, an increased gas consumption of as large as several hundred milliliters is needed. Limited by the low permeation rate of the water–gas separation membrane such as polydimethylsiloxane (PDMS), typically 20–40 μL/min [19], the equilibration of the detection system could take a very long time. Therefore, real-time dissolved gas detection remains unsolved for absorption-based spectroscopic techniques.
Photoacoustic spectroscopy (PAS) enables target gas measurement by the detection of the gas-absorption-induced acoustic wave using an acoustic transducer rather than the attenuated laser after long-distance absorption [20,21,22,23,24,25,26]. Therefore, PAS could offer a choice with low gas consumption. Since 2002, the invention of quartz-enhanced photoacoustic spectroscopy (QEPAS) used a tiny quartz tuning fork (QTF), known as the wrist watch crystal, as the acoustic transducer [27]. Its unique properties enable QEPAS gas sensors with excitation wavelength independence, low gas consumption and high noise immunity [28]. Continuous efforts have been contributed to this field towards practical measurement of numerous atmospheric trace gases, such as CO2 with a minimum detection limit of 300 ppt and 90 ppb for CH4 [29,30], and even state-of-the-art performance with an ultra-low detection limit and an ultra-wide dynamic range [31,32]. Usually, QEPAS systems force the laser to pass through the gap between the QTF prongs to avoid touching any surfaces by the employment of collimators, matching lenses and other spatial filtering mechanics if necessary [33]. This limits the further optimization of the QEPAS sensor footprint, which still requires gas samples of a few to a dozen mL for effective analysis.
In this paper, we develop a QEPAS sensor with sub-mL gas consumption for dissolved gas measurement. The spectrophone has a simple configuration with a micro-resonator for acoustic wave enhancement and a standard QTF for signal detection. Only a piece of single-mode fiber guides the excitation laser into the spectrophone without any other free-space optics. All the above components are assembled inside a stainless chamber with a total gas consumption of ~300 μL. We selected CH4, as an example, to evaluate the sensor performance. An in situ dissolved CH4 measurement has been carried out at the Haima Cold Spring Area of the South China Sea.

2. Materials and Methods

When the incident laser frequency is consistent with the molecular absorption line of the detection gas, the gas molecules absorb the optical radiation and release heat, which causes local expansion of the gas [34]. For QEPAS, a QTF serves as the acoustic transducer instead of a microphone in traditional PAS. Commercially standard QTFs have a resonant frequency of approximately 32.768 kHz. When the acoustic wave has the same frequency, QTF prongs symmetrically vibrate to generate piezoelectric signal, which can be governed by [35]
S = C α P Q f
where α is the absorption coefficient per unit concentration of the target gas, C is a constant describing the transfer function, P is the laser power, Q is the quality factor of the folk, and f is the resonant frequency. The QTF has a typical Q-factor of >100,000 in vacuum, while approximately 10,000 under atmospheric pressure due to the environmental gas-induced damping effect. In the QEPAS system, the resonant frequency and absorption coefficient can be precisely calibrated, thus the target gas absorption coefficient per unit concentration can be obtained by detecting the PAS signal.
In the implementation, we use a short microtube to further amplify the weak acoustic signal. It works as a one-dimensional resonator to form a standing wave along its length [36,37], and the acoustic wave can thus be enhanced at the antinode of the standing wave. The resonator operates as an orifice ended tube with a short gap of 50 μm between the QTF and the resonator.

3. Sensor Configuration and Experimental Setup

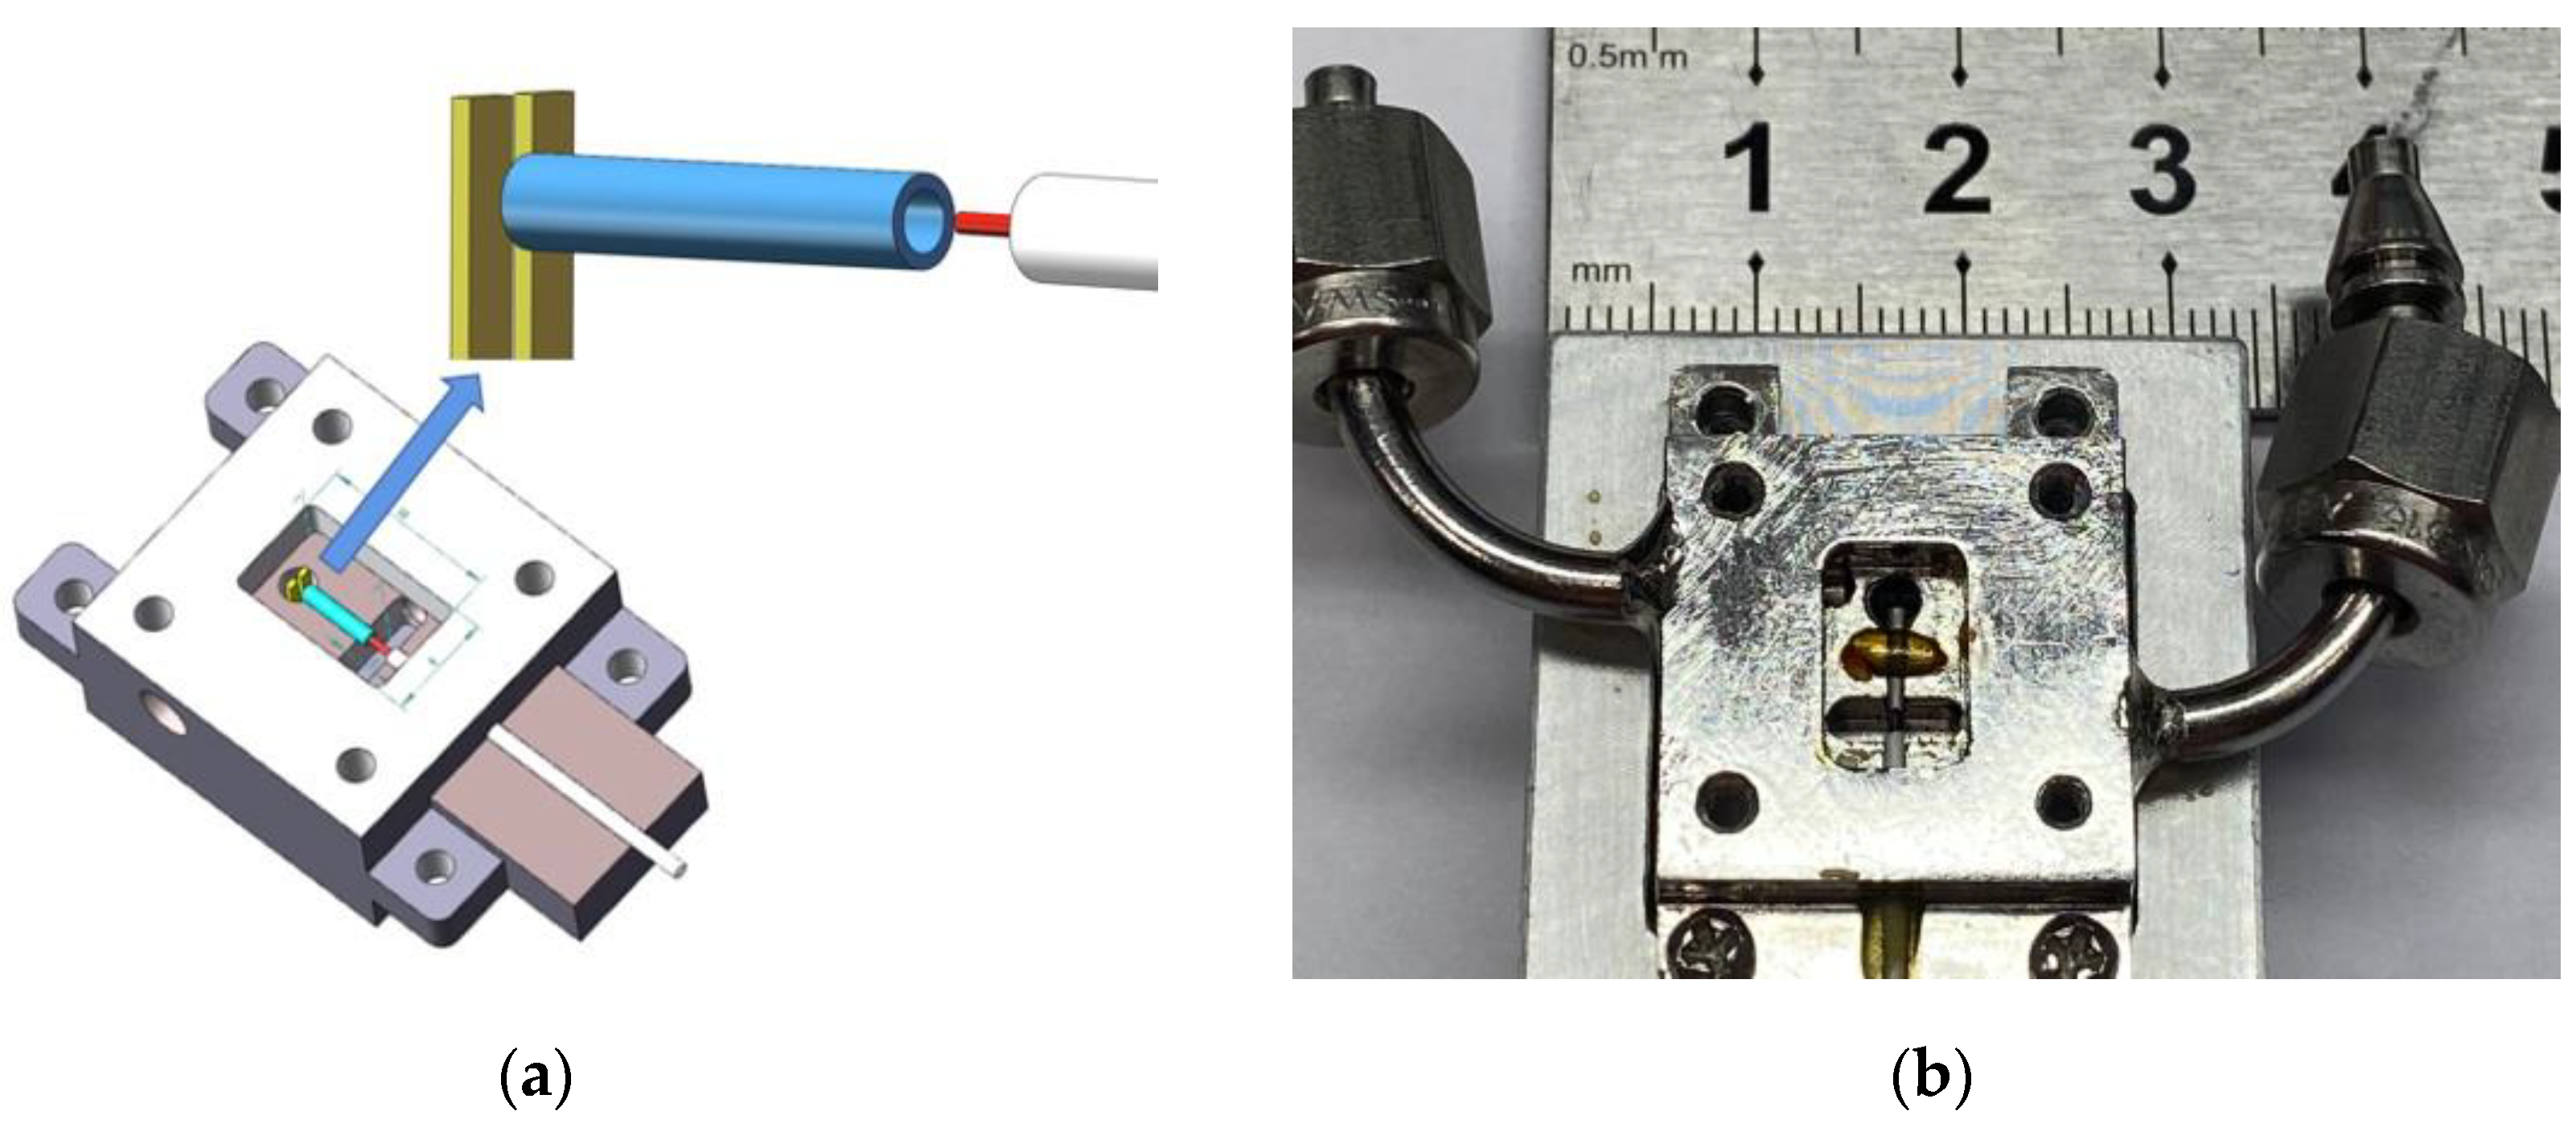
3.1. Fiber-Coupled Spectrophone

We design a spectrophone with an external size of 30 mm × 20 mm × 10 mm as depicted in Figure 1. Different from the on-beam resonators widely used in QEPAS [38,39], a half on-beam configuration [40] is used to amplify the acoustic wave and to minimize the internal size to 12 mm × 6 mm × 4 mm. Without other free-space optics for collimation and convergence, the fiber pigtail directly guides laser to the spectrophone. A groove with a diameter of 1 mm is etched for coaxial installation of the fiber and the micro-resonator tube. Vertical distance from the top surface of QTF prongs to resonator’s axis is adjusted to maximize the QEPAS signal by referring to the experimentally optimized result [41]. A through hole with a 2 mm diameter holds the QTF. To suppress potential airflow disturbance on the acoustic detection, the gas inlet is designed at the corner with a buffer (2 mm × 6 mm × 4 mm) etched. The total gas consumption is evaluated to be approximately 300 μL, which is at least 100-fold less than most direct absorption-based gas cells.

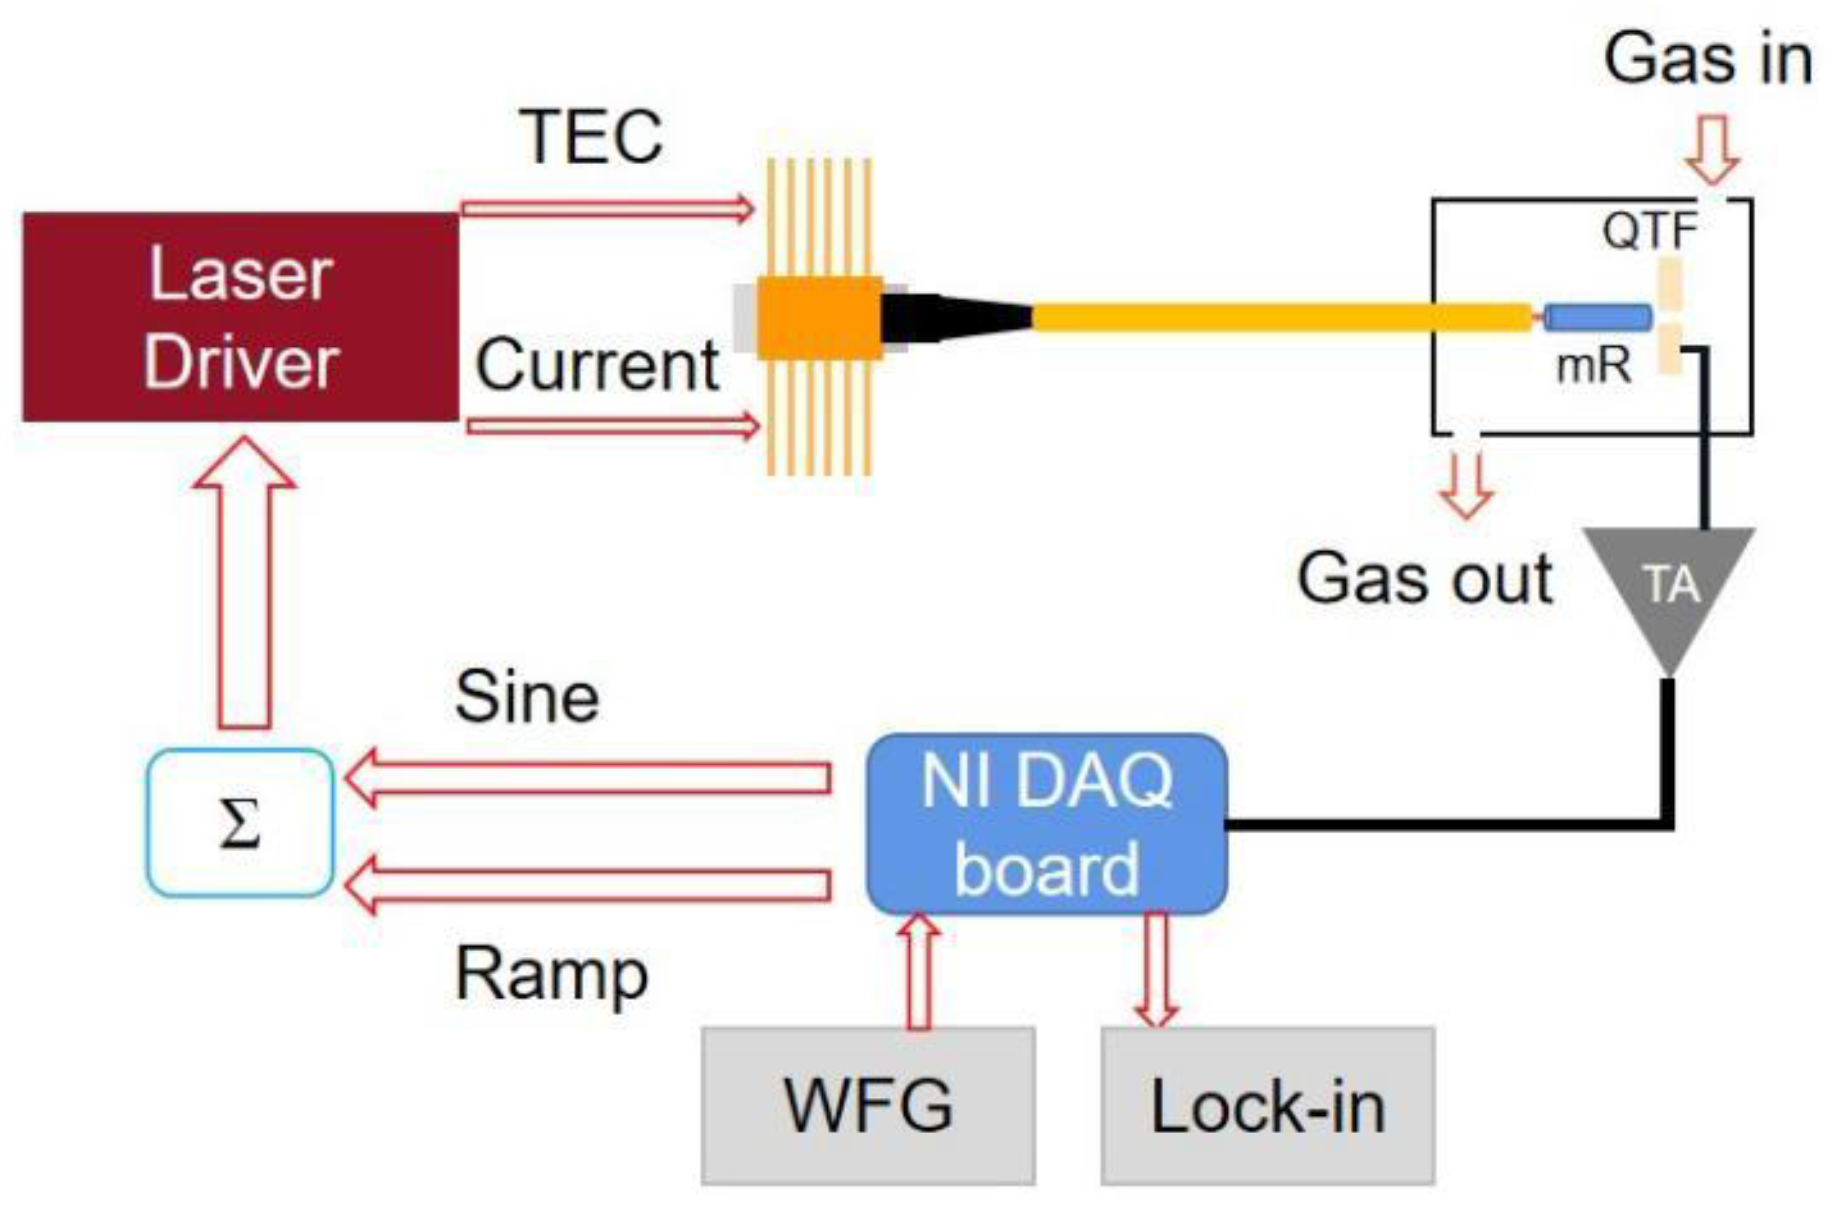
3.2. Experimental Setup

The QEPAS sensor with the fiber-coupled spectrophone is illustrated in Figure 2. A distributed feedback (DFB) diode laser with an emission at 1653.73 nm, as the excitation source, targets the absorption of CH4. The laser wavelength is controlled by a commercial laser driver (LDC 501, Stanford Research System, Montana, USA) with its temperature fixed at 20℃. A LabVIEW program simultaneously scans and modulates the laser wavelength by superposing a sinusoidal modulation on a ramp current from 62.5 to 87.5 mA. To perform the second harmonic detection, modulation frequency is chosen at half of the QTF resonant frequency, which is calibrated to be f0 = 32.716 kHz. The 0.2 Hz ramp scanning signal leads to a response time of 5 s. Acoustic wave-induced piezoelectric current is converted into voltage signal by a transimpedance amplifier, which is then digitized for demodulation by a software-based lock-in amplifier.

4. Experimental Results and Discussion

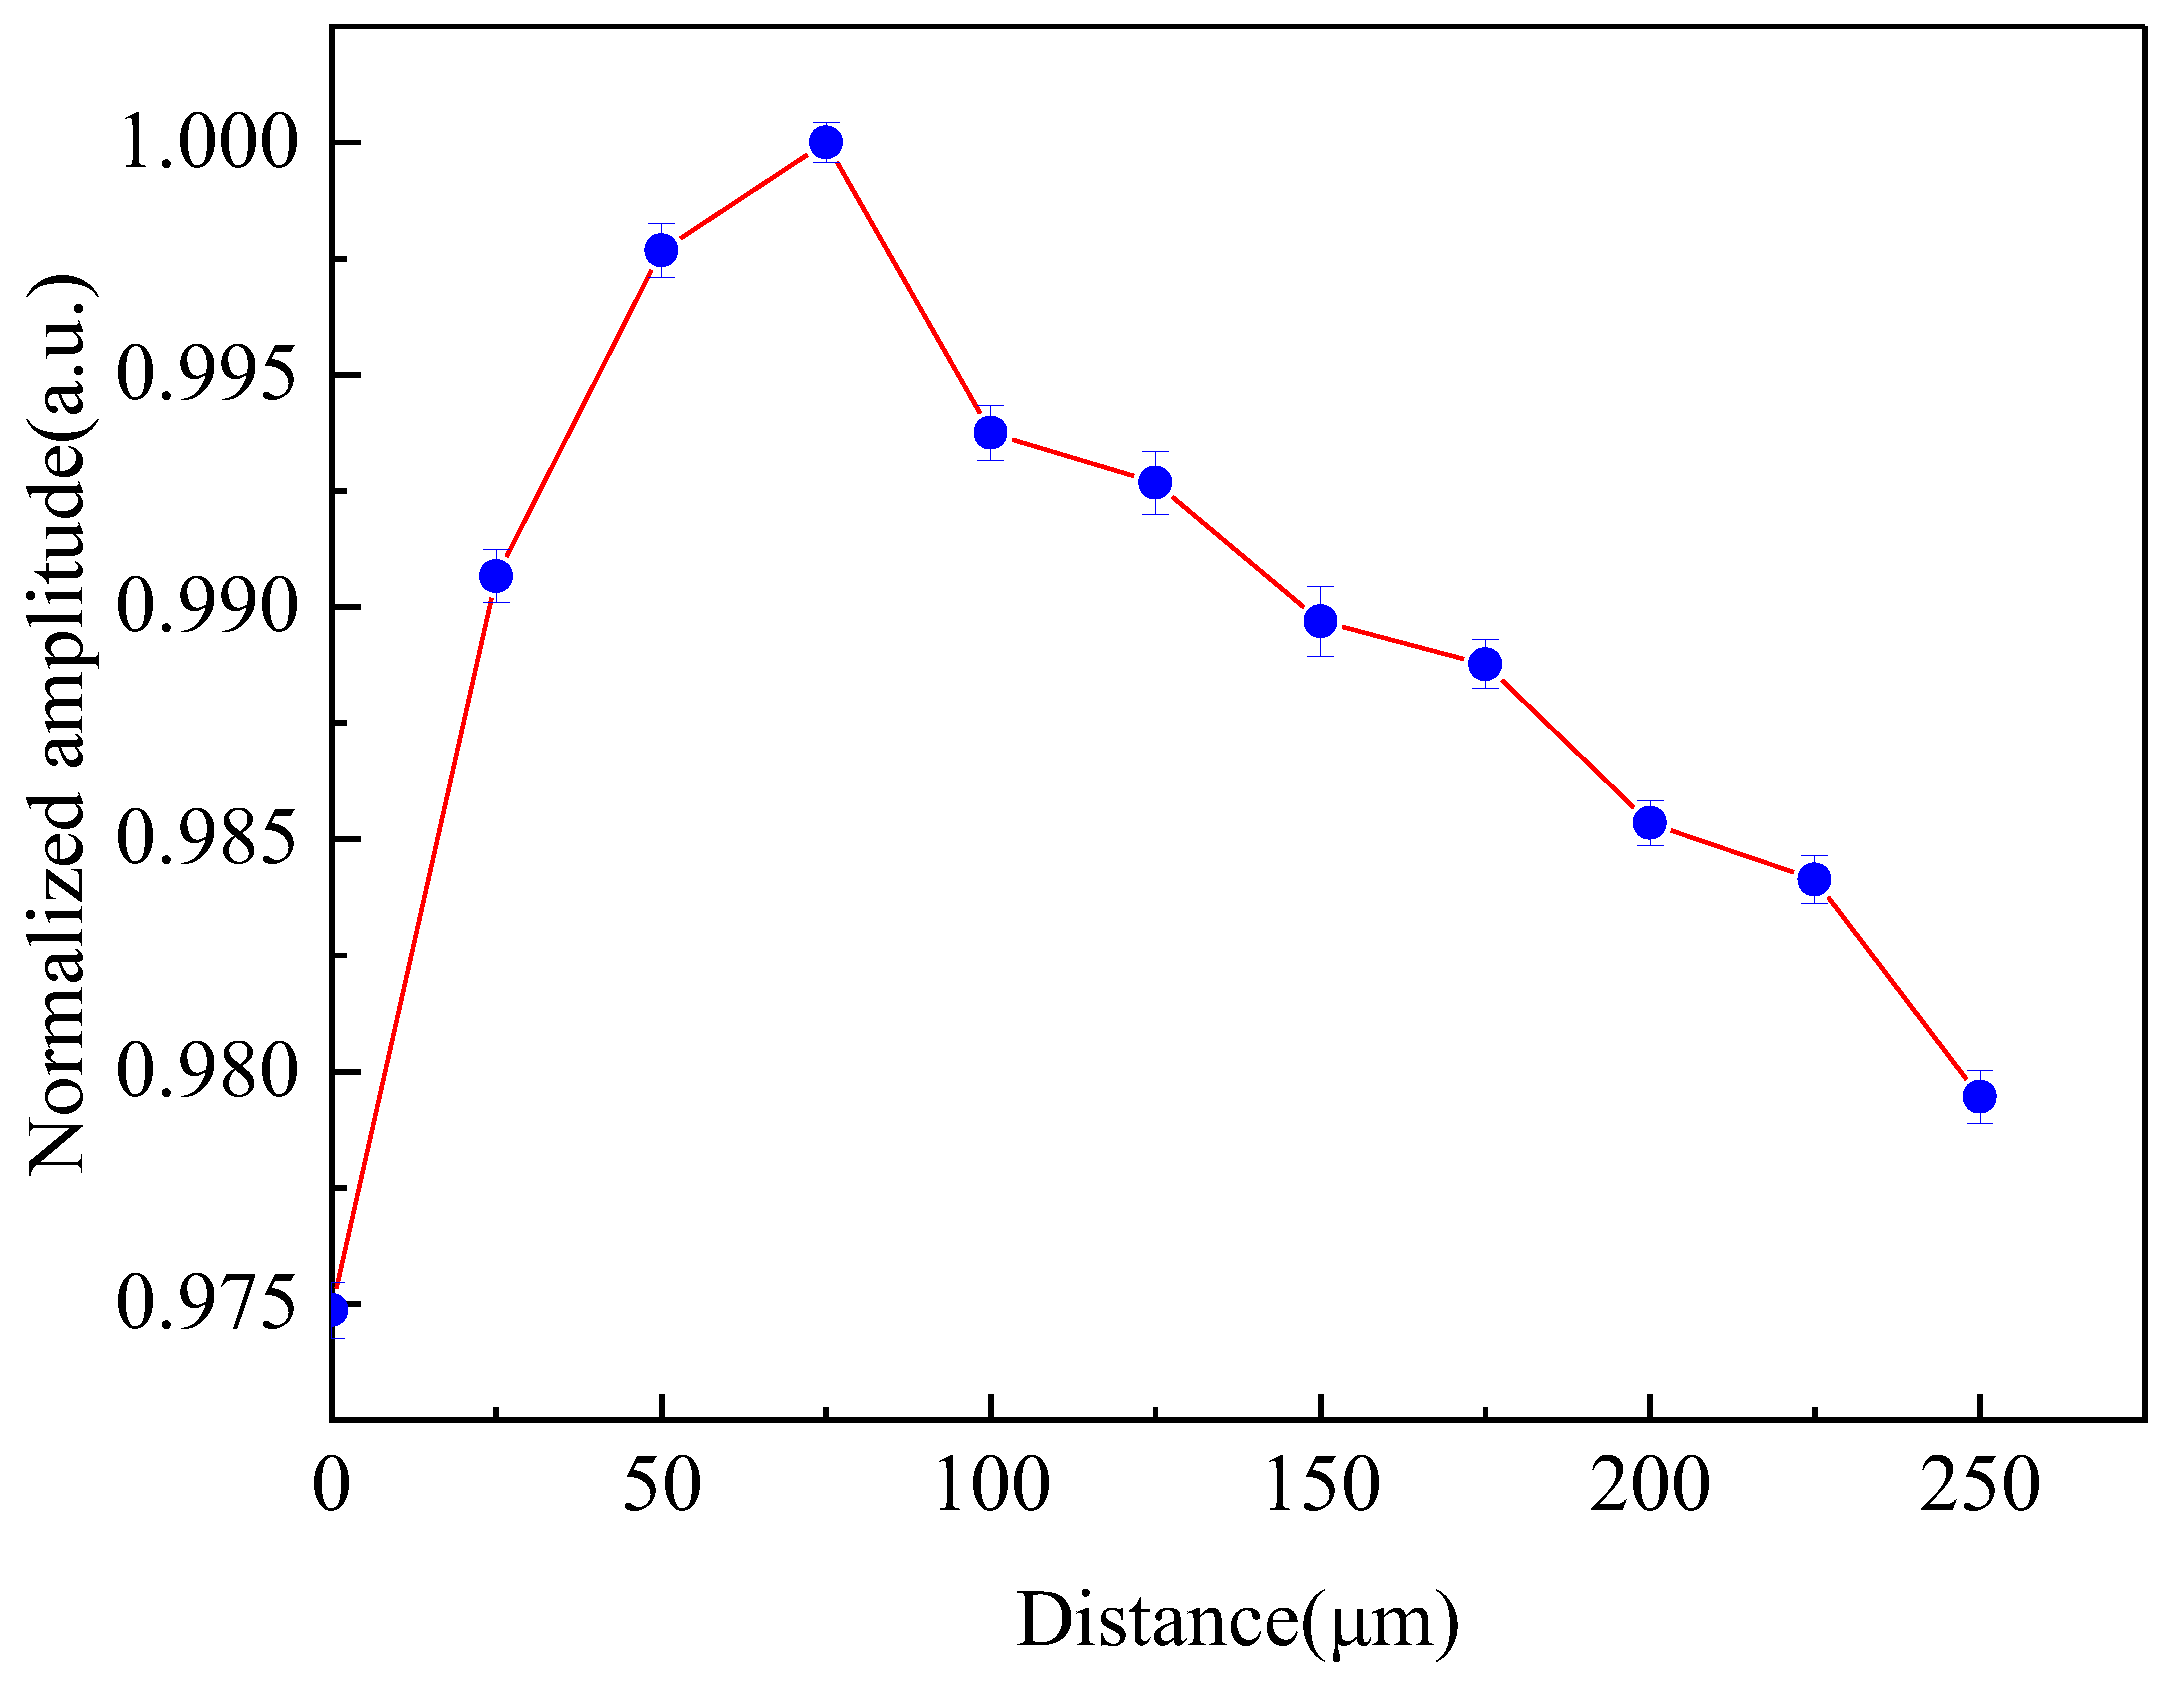
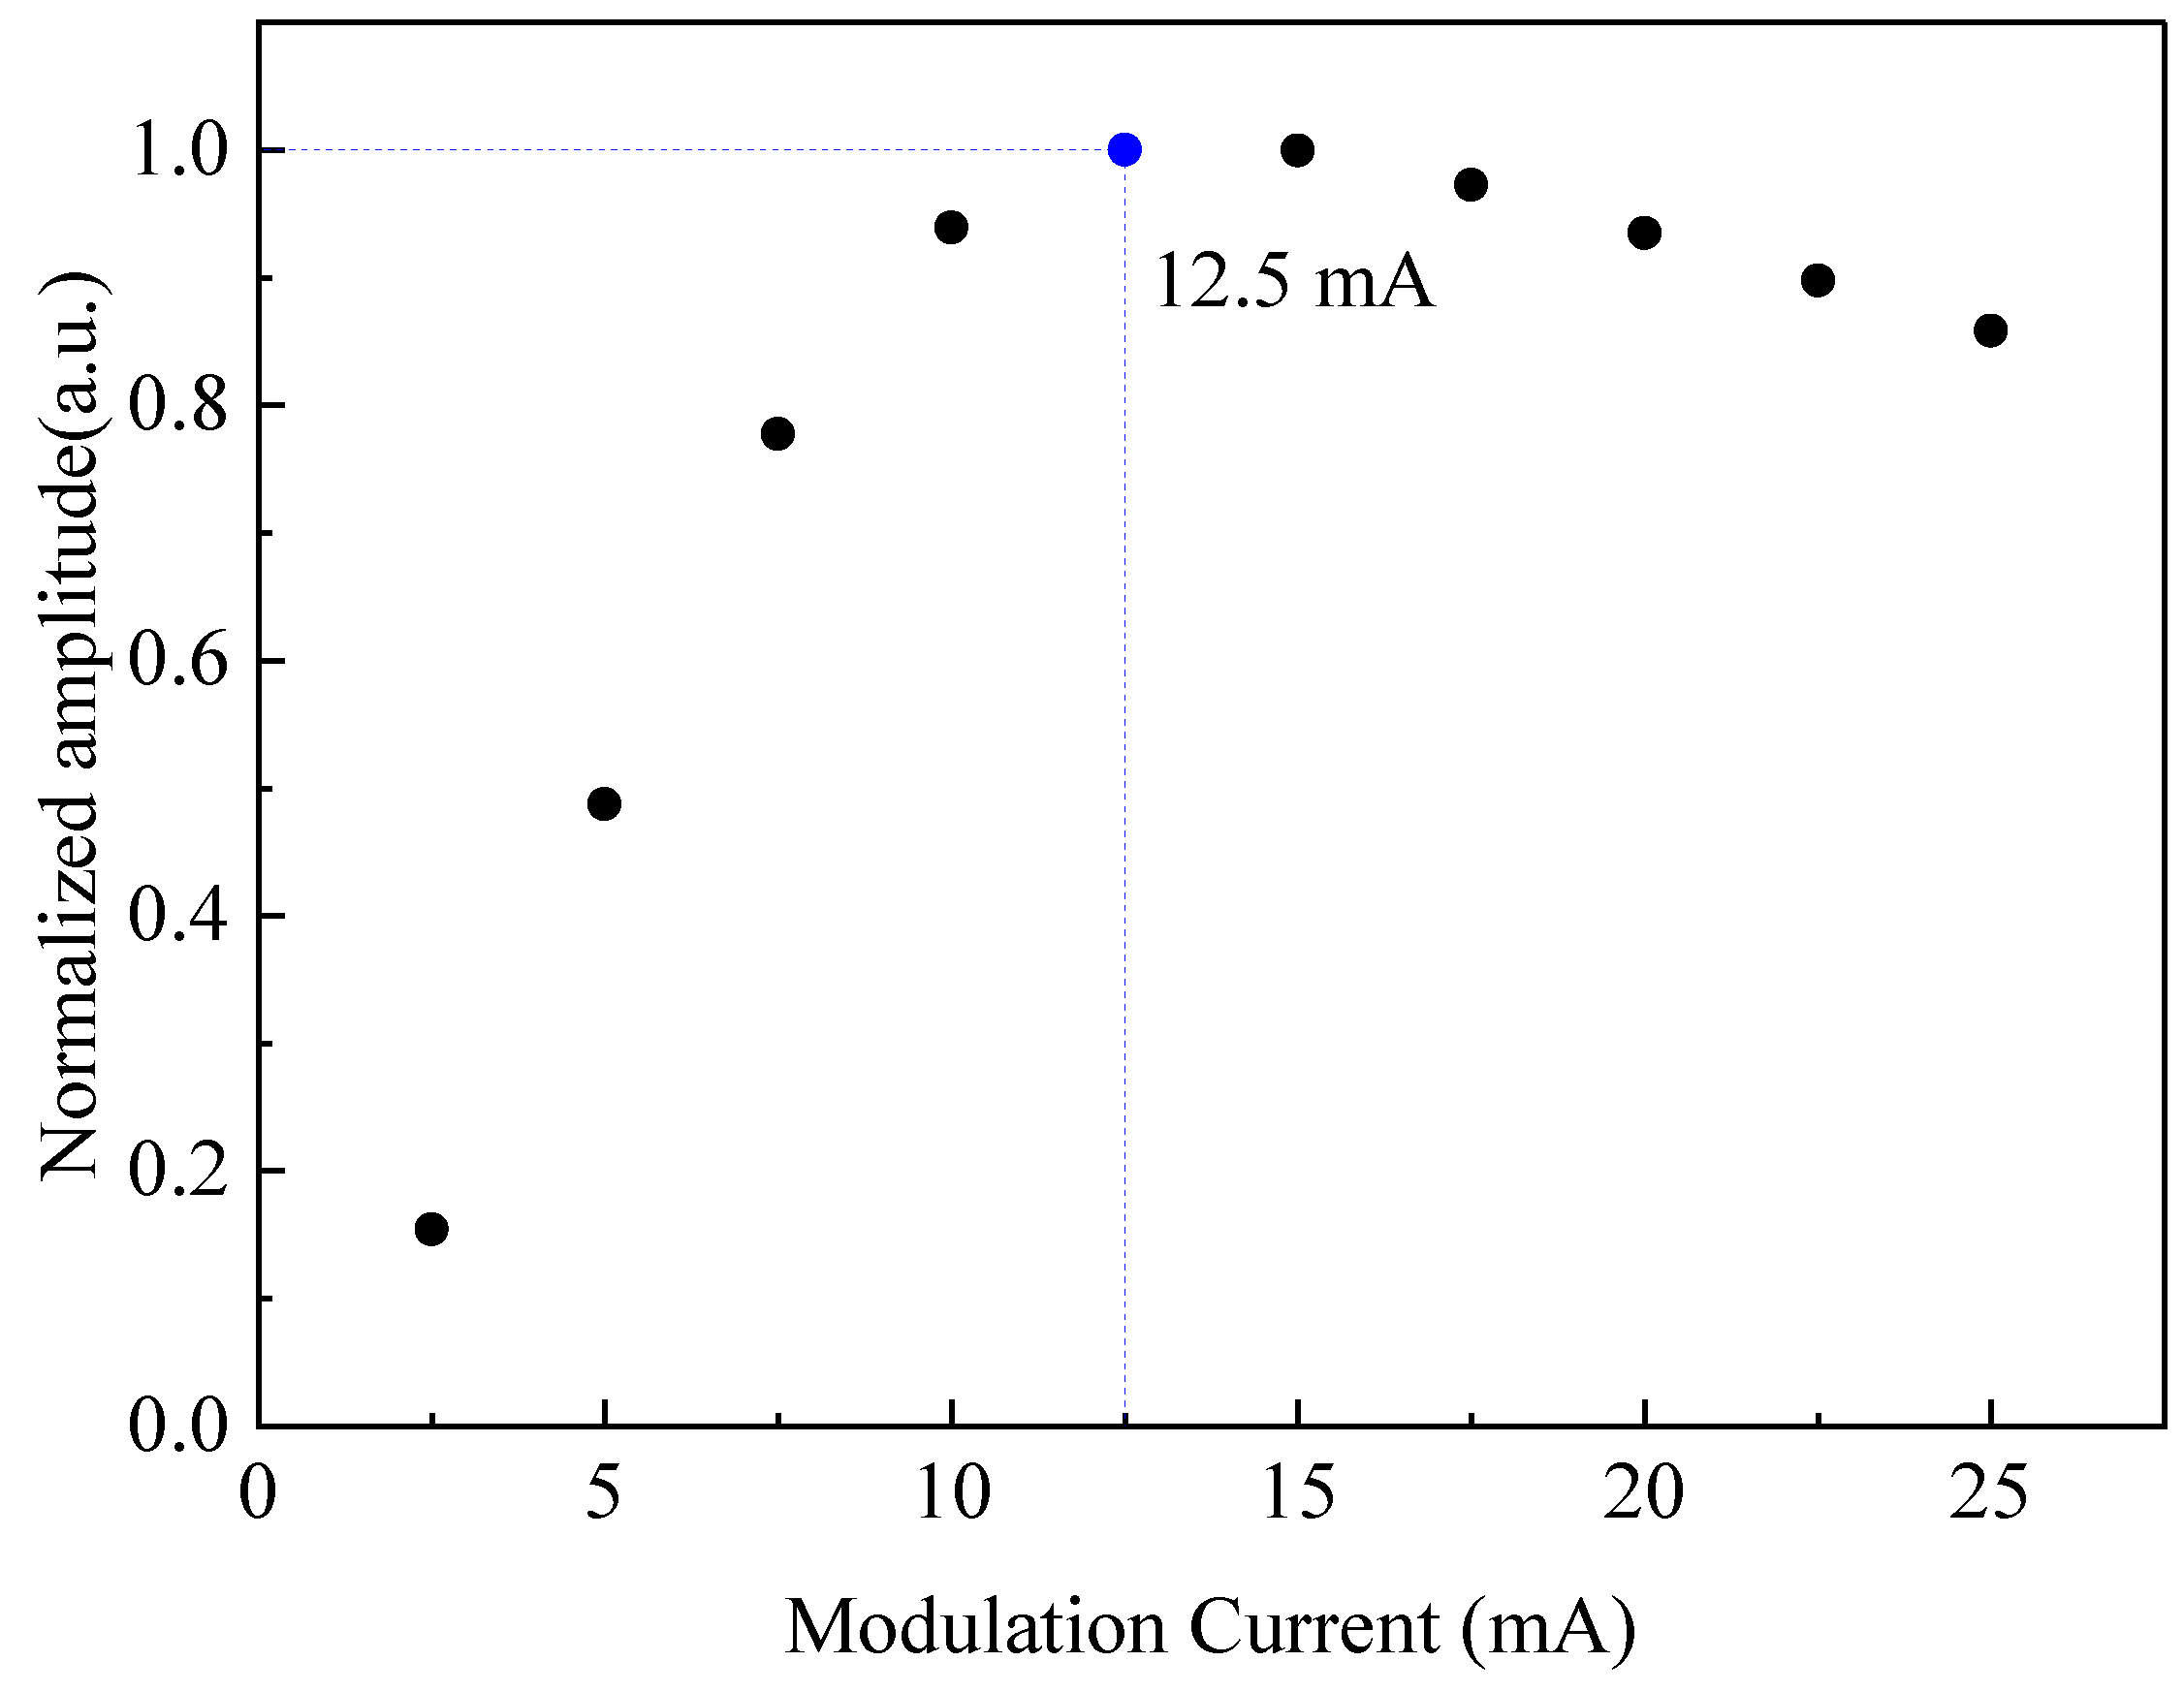
4.1. System Parameter Optimization

For the half on-beam QEPAS configuration, the micro-resonator generates enhanced acoustic signal by constructive interference. To demonstrate the performance of the half on-beam configuration, we compared the QEPAS signal of 5000-ppmv CH4 with a base QTF to that with a micro-resonator. As shown in Figure 3a, the magnification contributed by the micro-resonator (length: 4.7 mm) is evaluated to be approximately 8 fold. When the modulation frequency is fixed at f0/2, the enhancement performance would depend on the micro-resonator size, especially its length, which will affect how much the signal can be amplified. Figure 3b plots the normalized QEPAS signals with micro-resonators at varying lengths for a selected diameter of 0.6 mm.
Different from the laser beam in common acoustic detection modules, the laser emitted from the fiber has a non-negligible divergence angle. In the case of a long distance between the fiber end and the resonator, the divergent laser could hit on the tube wall or be partially blocked by the QTF. While in the case of a too short or negative distance, less gas molecules would be illuminated by the laser at the entrance of the resonator. The fiber end location from the acoustic resonator can hence affect laser-gas interaction efficiency, then the QEPAS signal.
When the laser passes through the resonator tube, the sound waves generated by the interaction between the laser and the gas oscillate inside the resonator tube. The higher the intensity of the sound wave amplified by the resonator tube is, the stronger the photoacoustic signal will be. An experiment to optimize the fiber location was carried out. The fiber was moved by a 1D precision stage to obtain accurate position information. As the results shown in Figure 4, the signal amplitude presents the strongest value at a distance of 75 μm.
The QEPAS signal also relates to the modulation depth. With a small modulation depth, it is difficult for the sinusoidal modulation to cover the gas absorption line width, generating a small second harmonic signal from a Lorentz absorption profile. Similarly, a degraded signal amplitude can also be inferred from an excessive modulation [42]. We experimentally obtained the response of the photoacoustic signal to the modulation depth, which was adjusted by varying the modulation current applied on the laser source. A calibrated 5000 ppmv CH4 was sealed inside the acoustic detection module. As shown in Figure 5, the amplitude of QEPAS signal increases at the onset of the curve and then decreases slowly. According to the experimental results, the optimized modulation current of 12.5 mA was chosen in the following experiments.

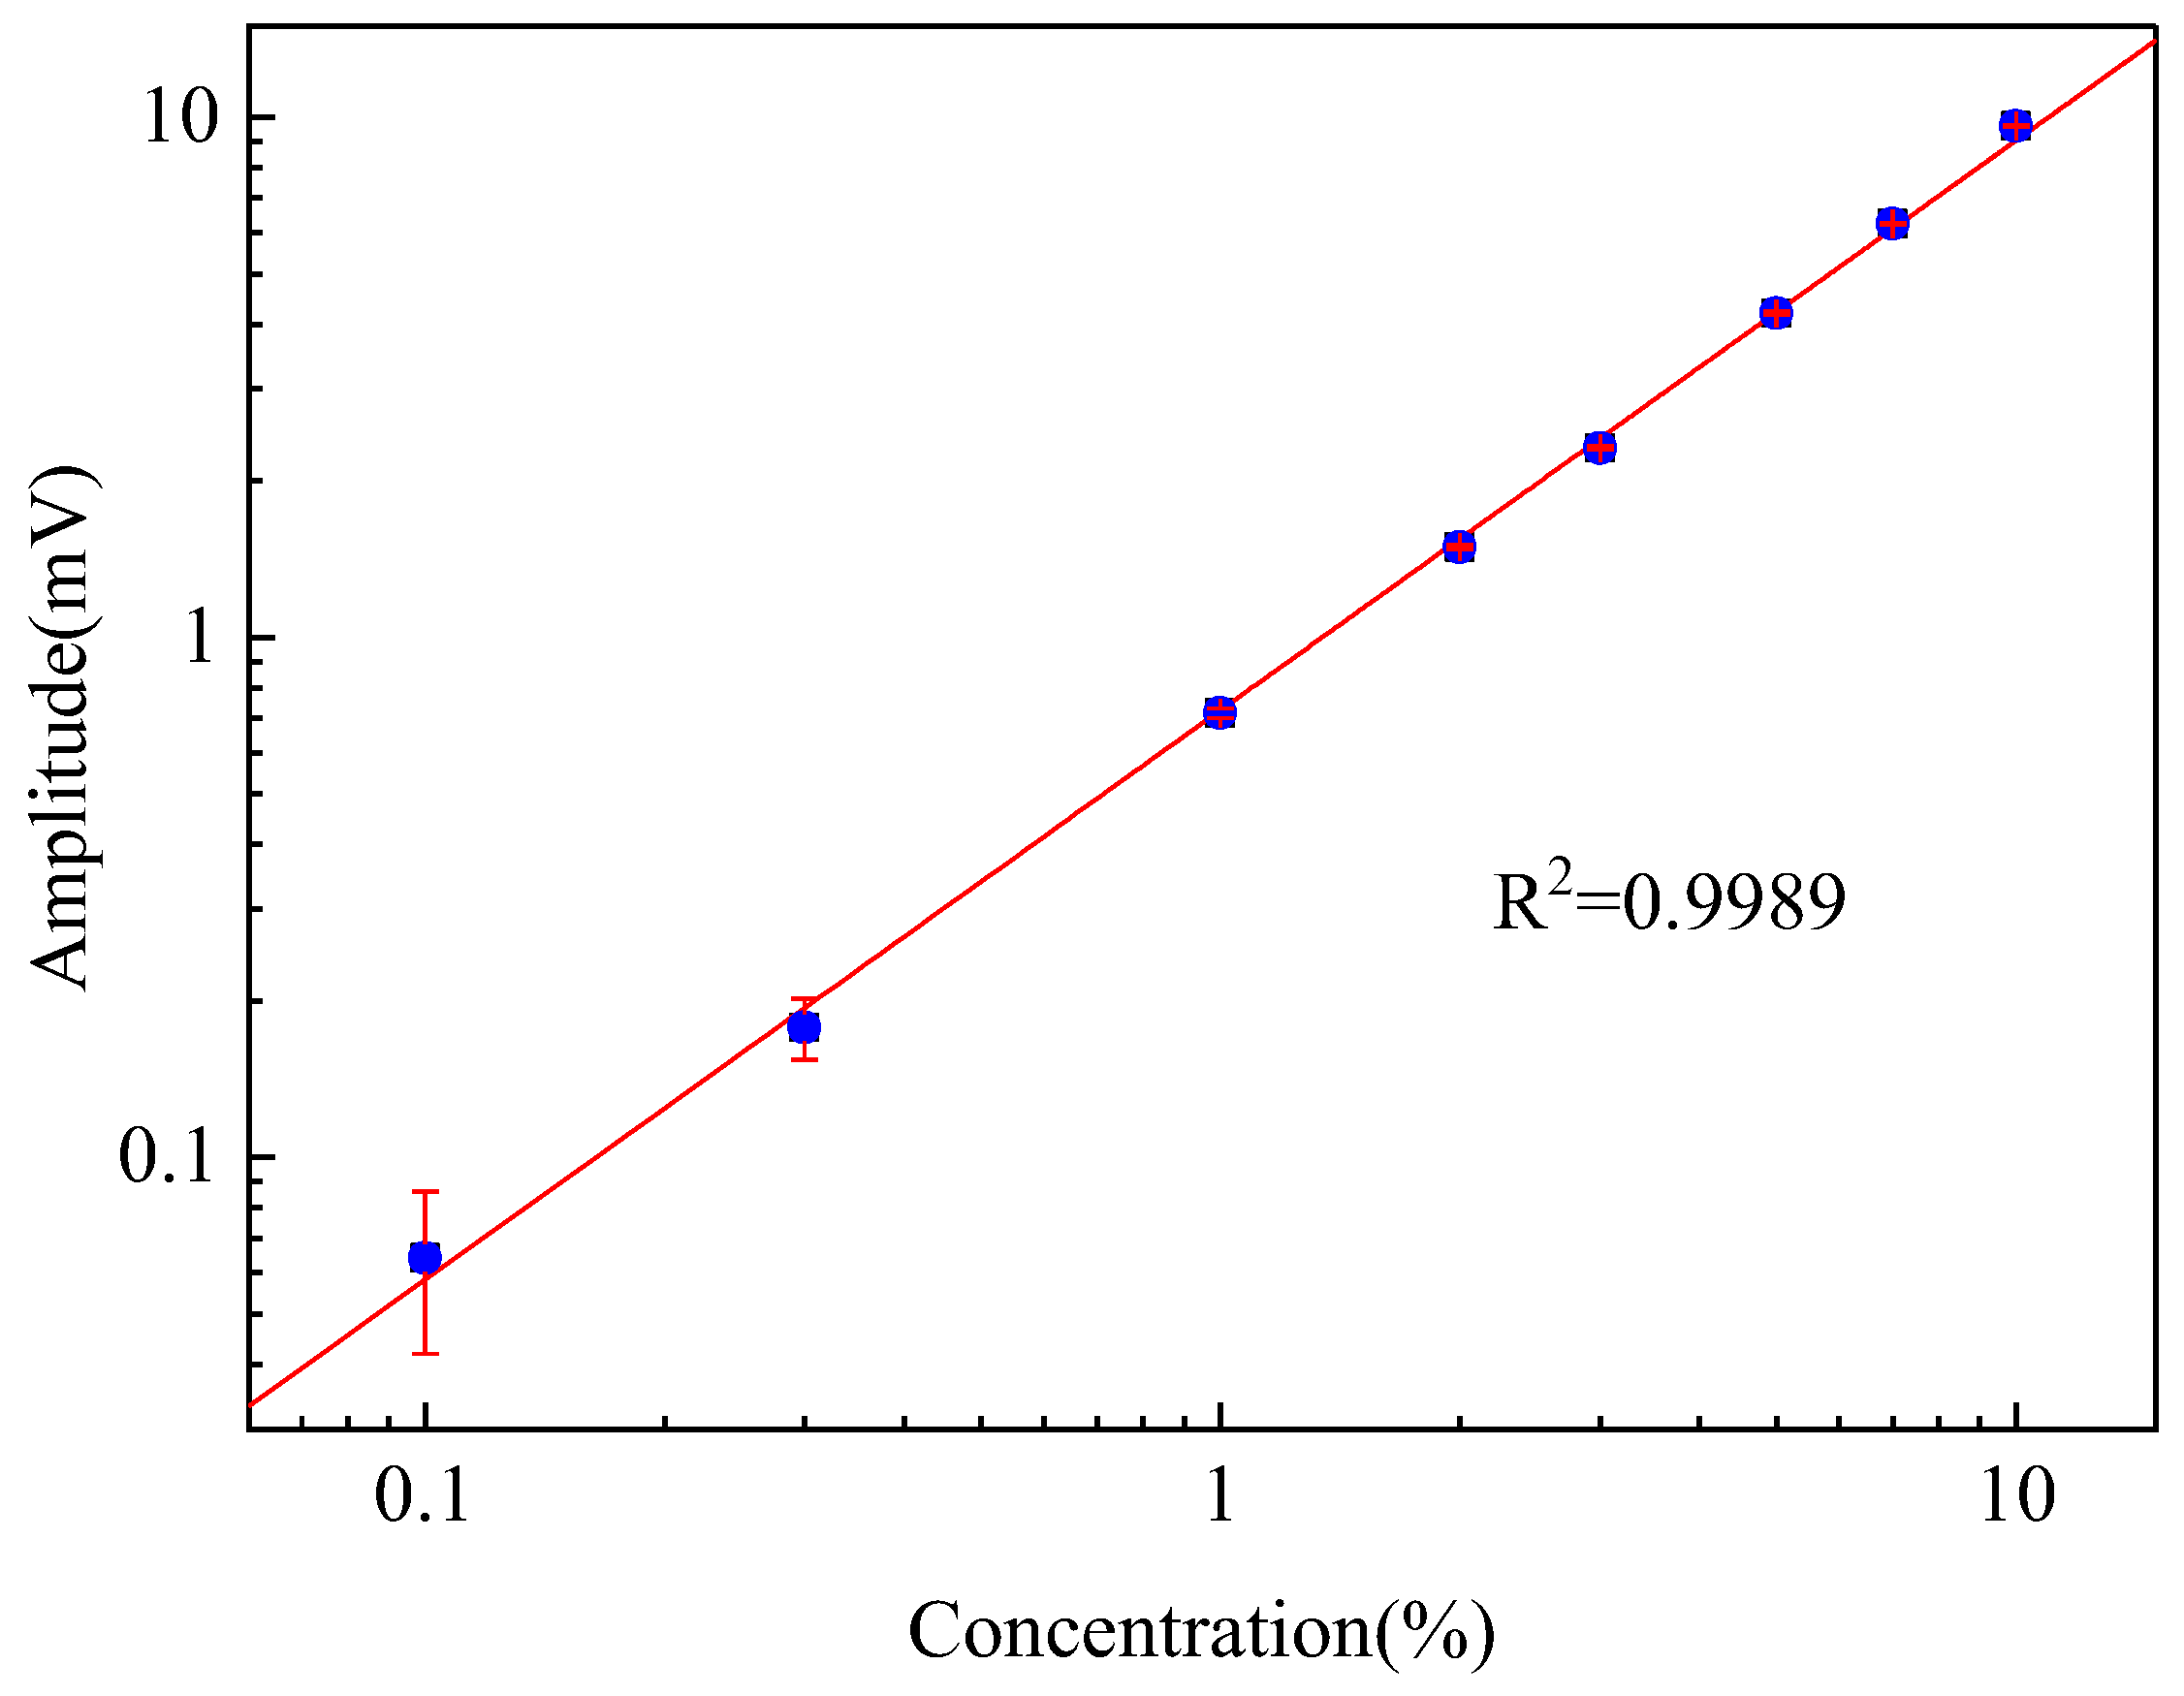
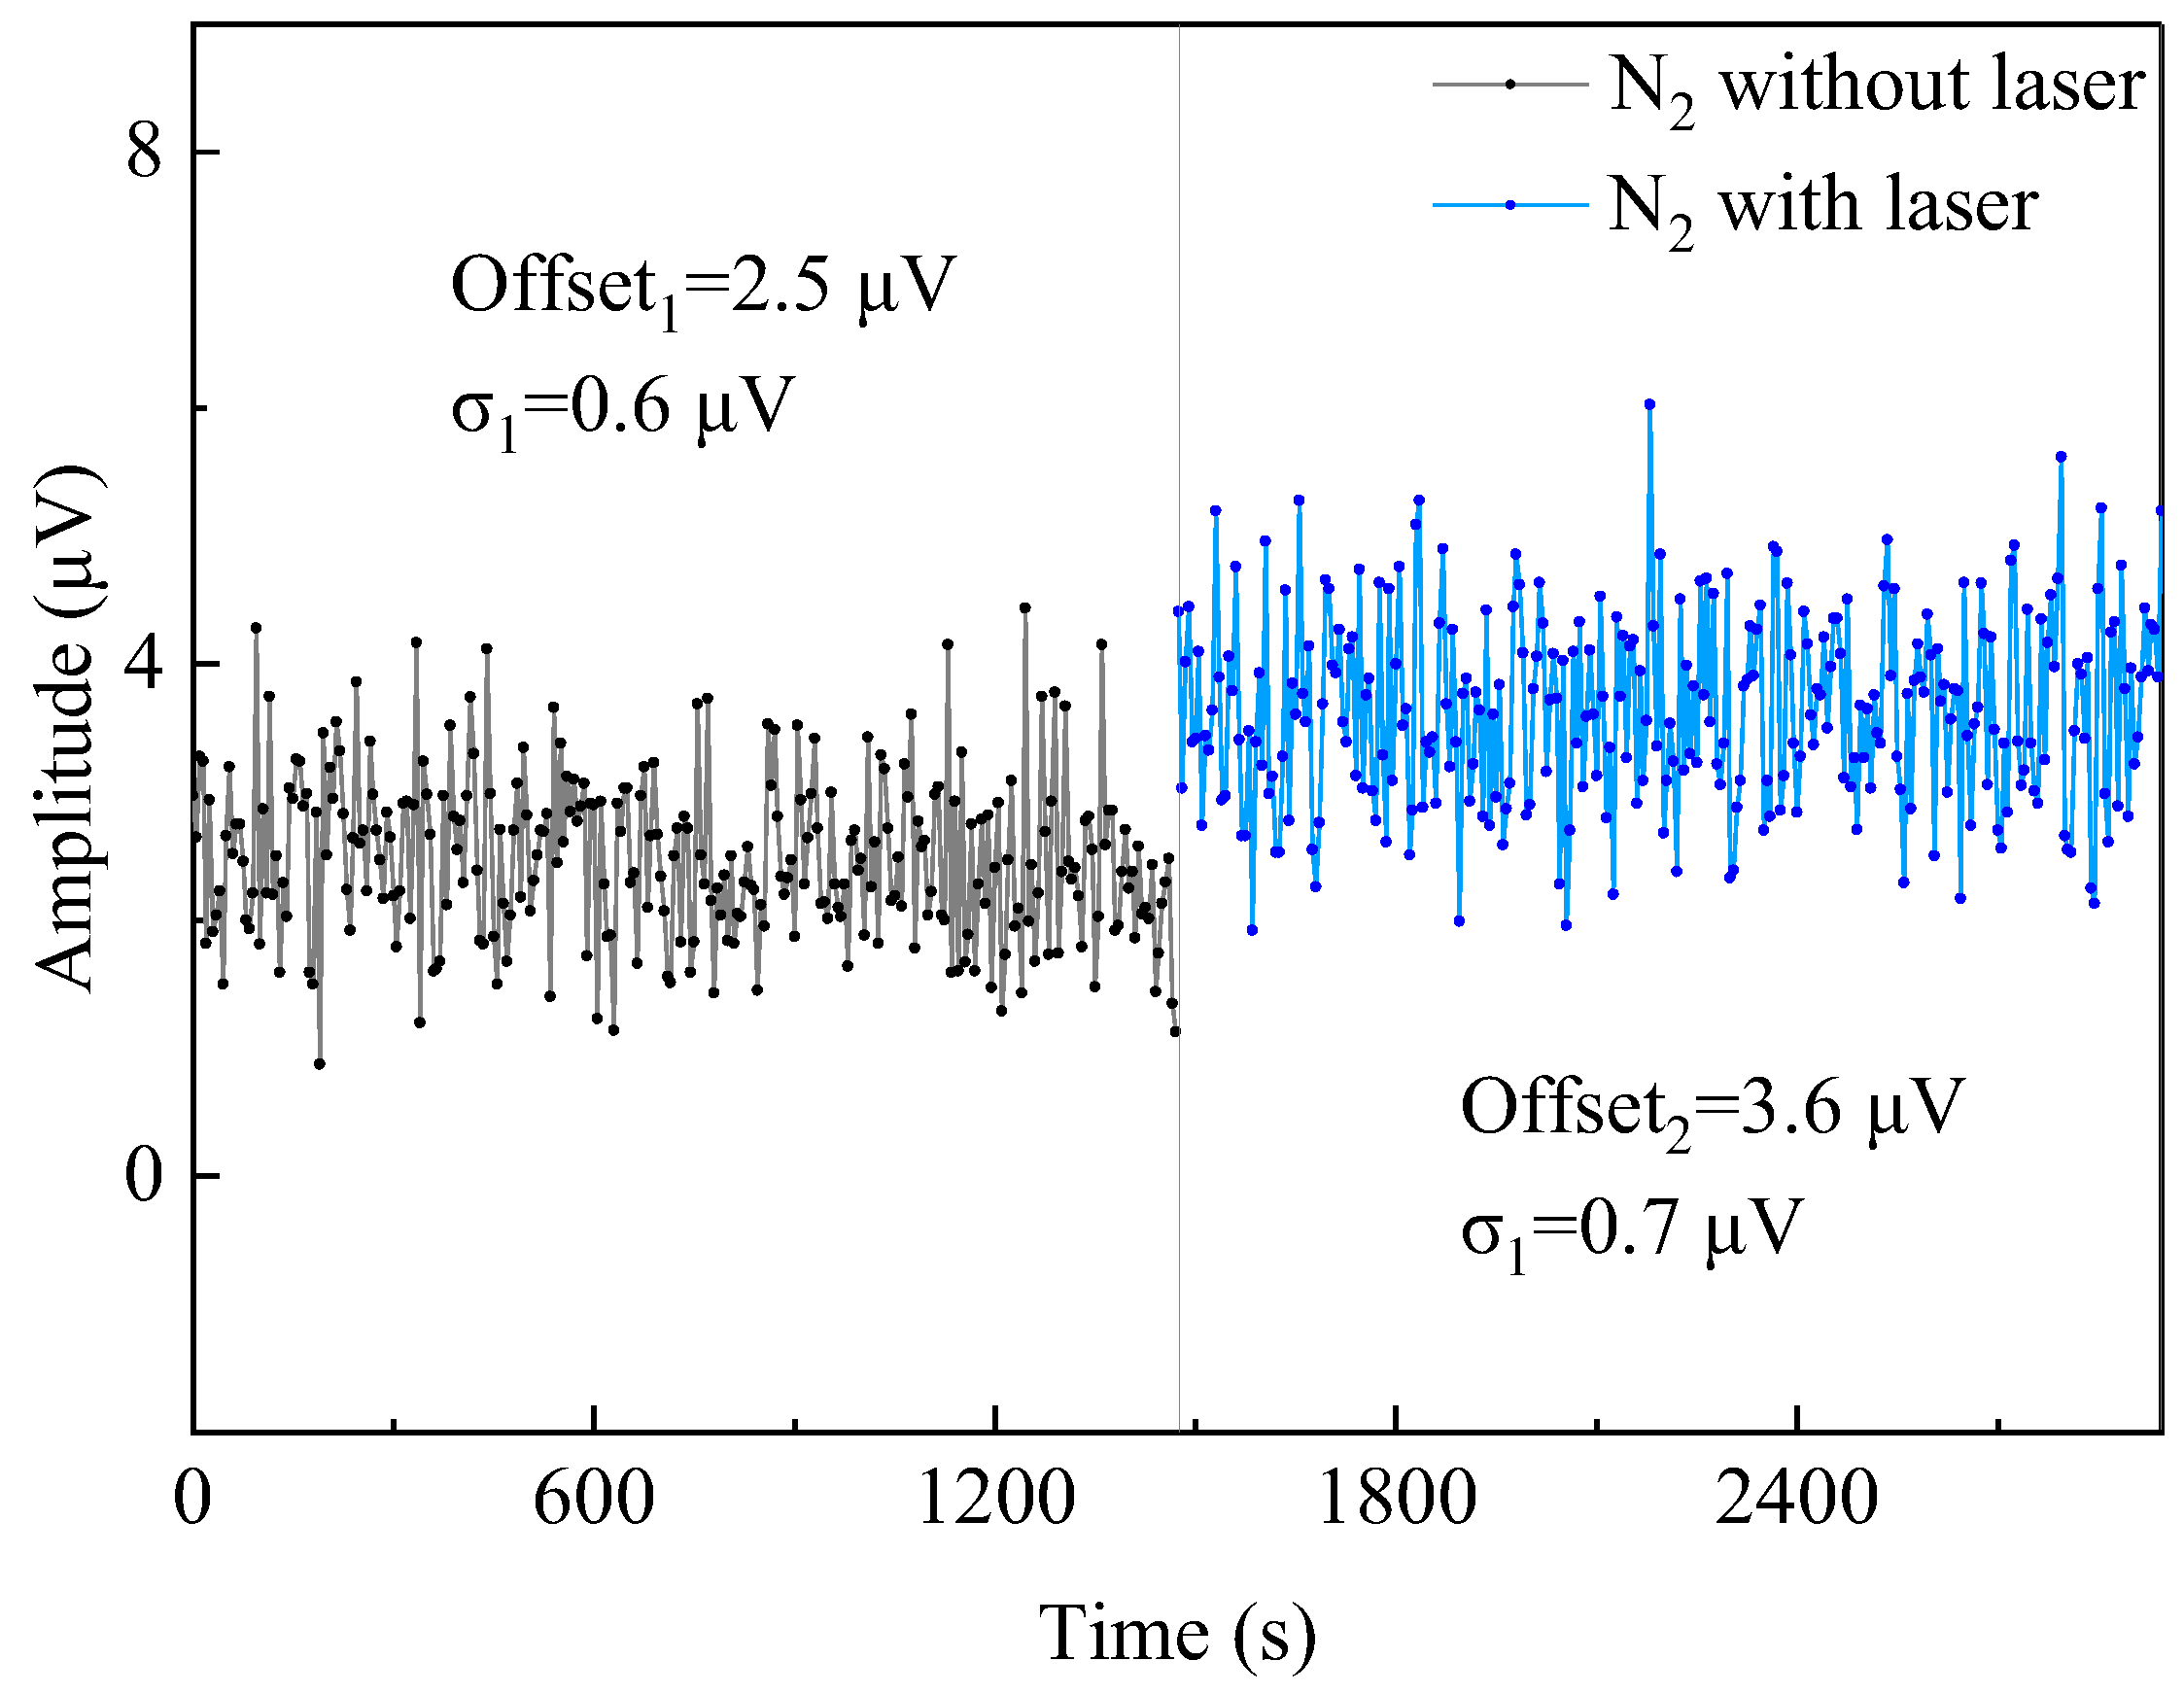
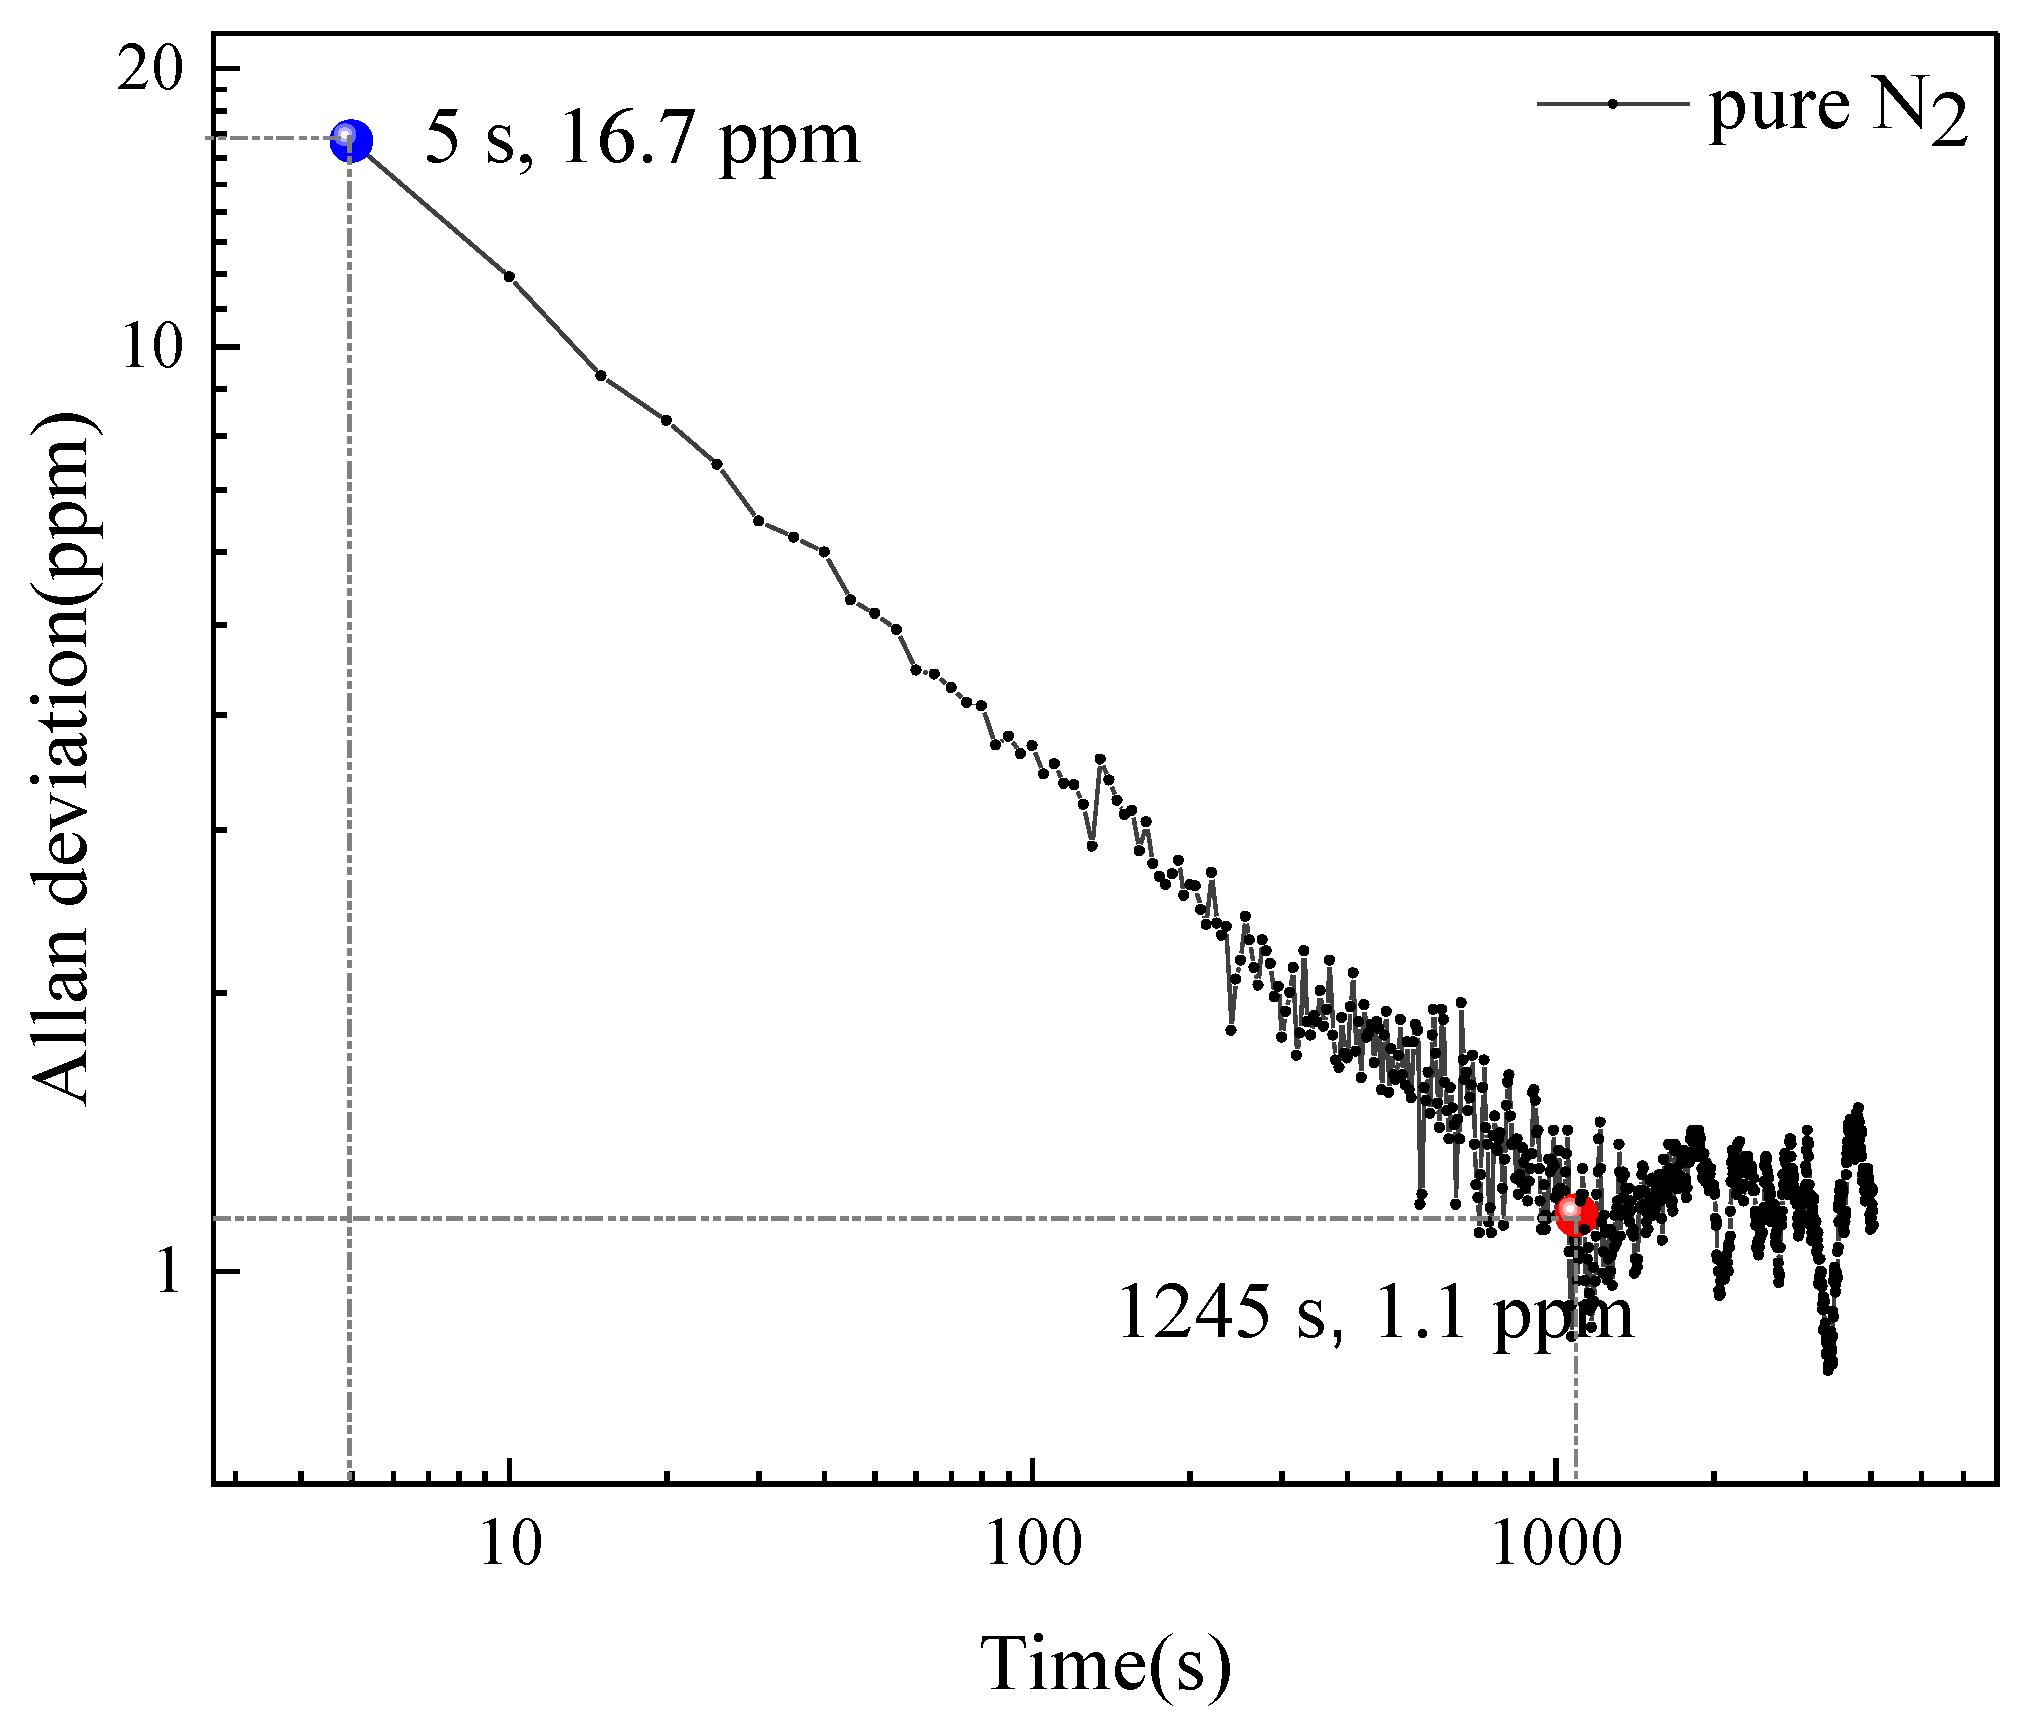
4.2. Sensor Performance

We measured the photoacoustic signal under different CH4 concentrations to acquire the linear relationship between the signal amplitude and gas concentration. The CH4 samples ranging from 1000 ppmv to 10% were generated by diluting the calibrated pure CH4 with pure N2. A continuous measurement of each sample was performed over 10 min and the result is shown in Figure 6. The R-square of the fitted curve can reach 0.9989, which proves the good linearity of this sensor.
As the laser is not collimated or shaped by the free-space optics, its influence on the system noise should be investigated. The laser diameter from the fiber end is approximately 10 μm, while the gap between QTF prongs is approximately 300 μm [43]. Considering the fiber divergence angle of approximately 8° and the resonator length of 4.7 mm, the spot diameter is approximately 400 μm when the uncollimated laser passes through the QTF. Thus, the laser will inevitably touch the micro-resonator during its propagation. Further, part of laser also hits the QTF prongs. Periodic laser intensity variations during the turning could lead to thermal deformation, which therefore generates the thermoelastic noise [44,45]. Thanks to the large irradiated area, corresponding to a low power intensity, the noise is much smaller than that of imperfectly shaped free-space laser. To numerically evaluate the effect of fiber coupling on system noise, we conducted a comparative experiment while the cell was filled with pure N2. The noise with modulated incident laser and without laser was successively measured. As the experimental data shown in Figure 7, within 1500 s, the averaged signal amplitude with incident laser is Offset1 = 3.6 μV, while the averaged amplitude without laser is Offset2 = 2.5 μV. The standard deviations are σ1 = 0.6 and σ2 = 0.7 μV, respectively. Experimental results show that fiber-coupled operation has a little impact on the amplitude of the system noise.
To evaluate the stability and minimum detection limit of the system in the long-term detection, an Allan–Werle deviation analysis was performed with the results shown in Figure 8. The measurement was conducted for 5 h at 760 Torr with pure N2. The detection limit is determined to be 16.7 ppmv at an averaging time of 5 s. The ultimate detection limit can be improved to 1.1 ppmv at a much longer averaging time of 1245 s, within which the white noise dominates, demonstrating a very stable performance for the fiber-coupled spectrophone. Taking the laser power into consideration, we calculate the normalized noise equivalent absorption (NNEA) coefficient as 7.75 × 10⁻⁸ W·cm−1·Hz−1/2, which is comparable to the traditional QEPAS technology.

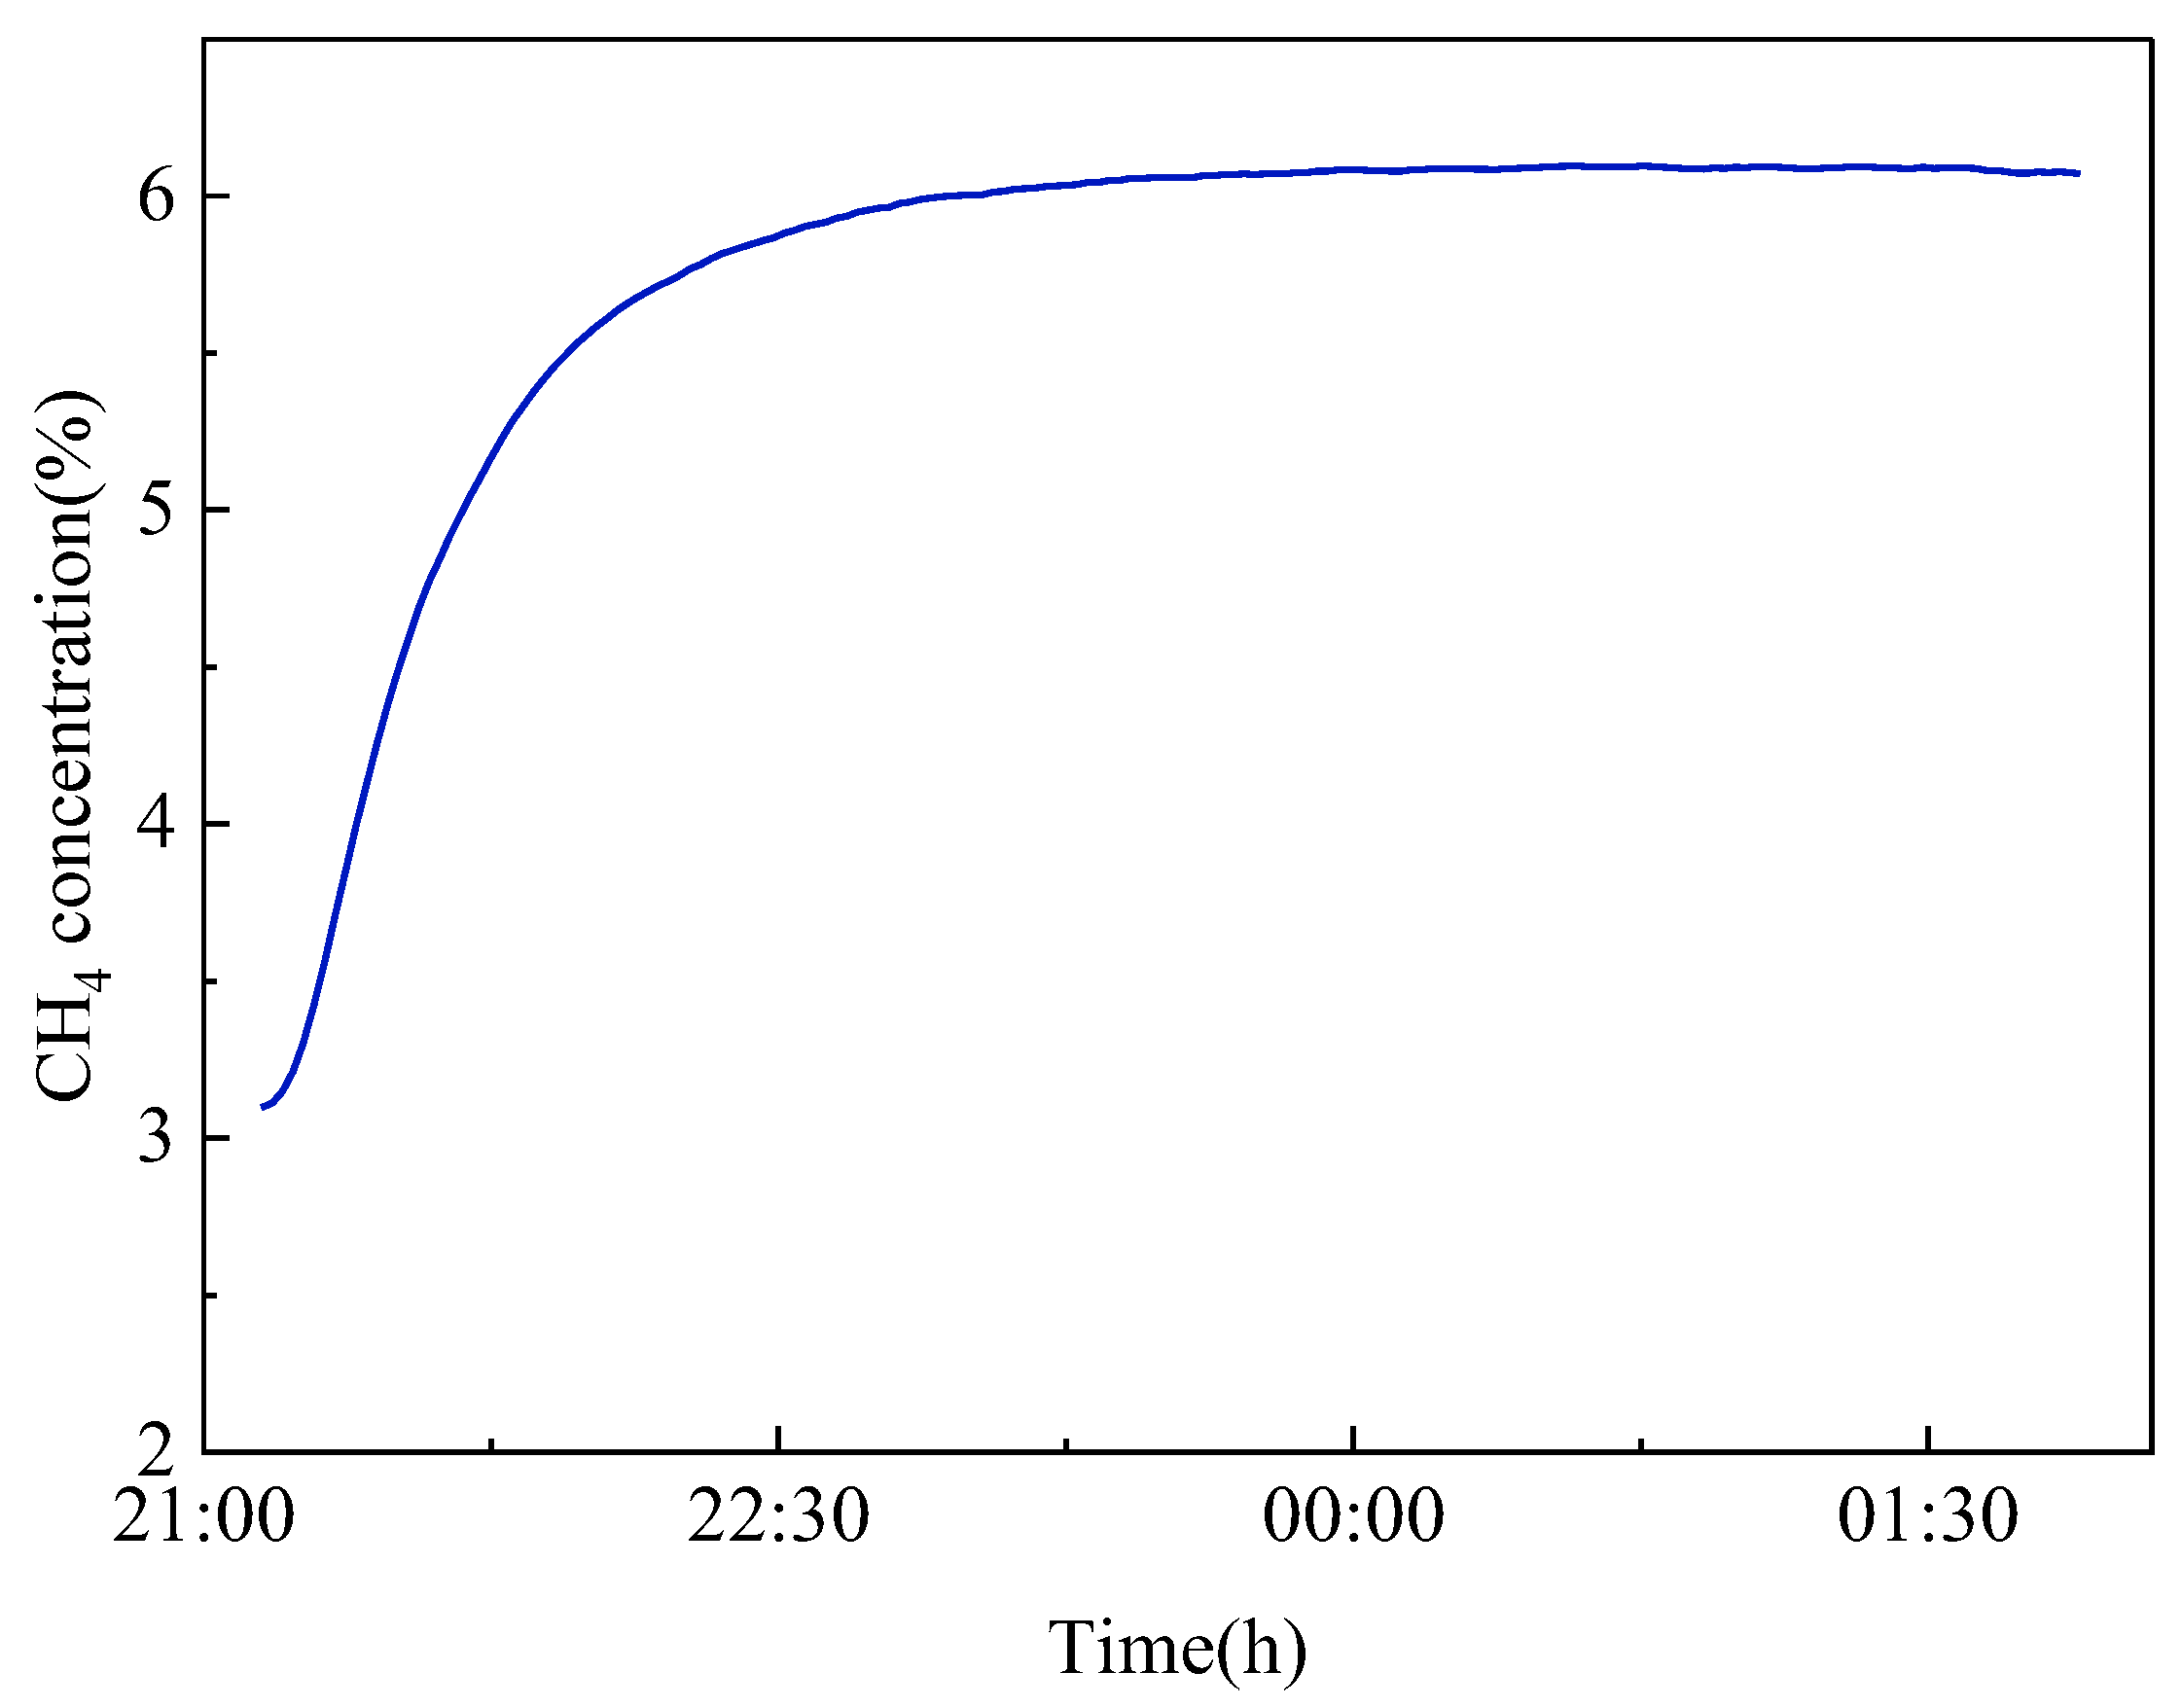
4.3. In situ Detection of Deep-Sea Dissolved CH4

With the fiber-coupled sensor calibrated, we performed an in situ measurement of dissolved CH4 at the Haima Cold Spring Area in the South China sea. In this measurement, our sensor was integrated into a metal cavity that can protect the inside instruments from a seawater pressure as high as 35 MPa. The acoustic detection module and the dissolved gas separation unit with a PDMS membrane were connected by a short 1/8 stainless steel pipe. The gas separated from the PDMS membrane diffused into the photoacoustic cell for measurement with the result shown in Figure 9. The instrument was placed by the submersible near the cold spring vent and then began to operate after 1 h. With a low separating rate of 30 μL/min, the measured dissolved CH4 concentration reached a plateau level of approximately 6% after 90 min. Compared with a recently reported demonstration of near-coast CO2 using cavity ring-down spectroscopy (CRDS) technique, the balancing time has been shortened by more than 7 fold [46]. This measurement illustrates that the dissolved CH4 concentration near the vent of the cold spring is much higher than that of the background seawater, which is usually approximately 10–20 ppmv [47].

5. Conclusions

In conclusion, we have reported a sub-mL QEPAS sensor with a compact spectrophone for the detection of deep-sea dissolved gases. It has a gas consumption of approximately 300 μL, at least two orders of magnitude smaller than traditional optical absorption-based gas chambers, which is important to reduce the balance time for in situ dissolved gas detection. Instead of free-space laser alignment, the use of fiber coupling without any other optics offers a simple configuration for assembly. The detection limit and linearity have been experimentally evaluated, achieving a minimum detection limit of 1.1 ppmv for CH4 measurement and a good linear response with an R-square value of 0.9989. The normalized noise equivalent absorption (NNEA) coefficient is calculated to be 7.75 × 10⁻⁸ W·cm−1·Hz−1/2. An in situ dissolved gas measurement was carried out at the Haima Cold Spring Area to verify the practicability of this sensor.

Author Contributions

Conceptualization, H.Z. (Huiyuan Zhao) and Q.W.; methodology, H.Z. (Hui Zhang) and H.Z. (Huiyuan Zhao); software, Q.W.; validation, M.H. (Mai Hu); formal analysis, H.Z. (Hui Zhang) and M.H. (Mengpeng Hu); investigation, H.Z. (Hui Zhang); resources, Q.W.; data curation, H.Z. (Huiyuan Zhao) and Y.Z.; writing—original draft preparation, HZ. (Huiyuan Zhao); writing—review and editing, Q.W. and J.L.; visualization, H.Z. (Huiyuan Zhao) and H.Z. (Hui Zhang); supervision, Q.W.; project administration, Y.Z.; funding acquisition, Q.W. All authors have read and agreed to the published version of the manuscript.

Funding

This research was funded by the National Key Research and Development Program (2019YFB2006003), the National Natural Science Foundation of China (NSFC) (62005267), Young Talent of Lifting Engineering for Science and Technology in Jilin, China (QT202106), and the Strategic Priority Research Program of Chinese Academy of Sciences (XDA17040513 and XDA22020502).

Institutional Review Board Statement

Not applicable.

Informed Consent Statement

Not applicable.

Data Availability Statement

Not applicable.

Conflicts of Interest

The authors declare no conflict of interest.

References

  1. Falkowski, P.; Scholes, R.J.; Boyle, E.; Canadell, J.; Canfield, D.; Elser, J.; Gruber, N.; Hibbard, K.; Högberg, P.; Linder, S.; et al. The global carbon cycle: A test of our knowledge of earth as a system. Science 2000, 290, 291–296. [Google Scholar] [CrossRef] [Green Version]
  2. Reeburgh, W.S. Oceanic methane biogeochemistry. Chem. Rev. 2007, 107, 486–513. [Google Scholar] [CrossRef] [PubMed] [Green Version]
  3. Roberts, H.H.; Aharon, P. Hydrocarbon-derived carbonate buildups of the northern Gulf of Mexico continental slope: A review of submersible investigations. Geo-Mar. Lett 1994, 14, 135–148. [Google Scholar] [CrossRef]
  4. Wankel, S.D.; Germanovich, L.N.; Lilley, M.D.; Gence, G.; Christopher, J.D.; Alexander, S.B.; Eric, J.O.; Peter, R.G. Influence of subsurface biosphere on geochemical fluxes from diffuse hydrothermal fluids. Nat. Geosci. 2011, 4, 461–468. [Google Scholar] [CrossRef]
  5. Martens, C.S.; Blair, N.E.; Green, C.D.; Marais, D.J. Seasonal variations in the stable carbon isotopic signature of biogenic methane in a coastal sediment. Science 1986, 233, 1300–1303. [Google Scholar] [CrossRef] [PubMed]
  6. Friedlingstein, P.; Cox, P.; Betts, R.; Bopp, L.; von Bloh, W.; Brovkin, V.; Cadule, P.; Doney, S.; Eby, M.; Fung, I.; et al. Climate–carbon cycle feedback analysis: Results from the C4MIP model intercomparison. J. Clim. 2006, 19, 3337–3353. [Google Scholar] [CrossRef] [Green Version]
  7. Butler, J.H.; Elkins, J.W. An automated technique for the measurement of dissolved N2O in natural waters. Mar. Chem. 1991, 34, 47–61. [Google Scholar] [CrossRef]
  8. Cai, M.; Huang, P.; Zhang, M.; Li, W. A Purge and Trap Gas Chromatographic Method for Detection of Chlorofluorocarbons in Seawater. Chin. J. Anal. Chem. 2013, 41, 268–272. [Google Scholar] [CrossRef]
  9. Zhang, H.; Li, J.; Yang, G.; Song, Y.; Jin, N. Purge- trap Gas Chromatography and Mass Spectrometric Method for Analysis of Isoprene in Natural Waters. Chin. J. Anal. Chem. 2015, 43, 333–337. [Google Scholar] [CrossRef]
  10. Grilli, R.; Darchambeau, F.; Chappellaz, J.; Mugisha, A.; Triest, J.; Umutoni, A. Continuous in situ measurement of dissolved methane in Lake Kivu using a membrane inlet laser spectrometer. Geosci. Instrum. Methods Data Syst. 2020, 9, 141–151. [Google Scholar] [CrossRef]
  11. Zhang, X.; Du, Z.; Zheng, R.; Luan, Z.; Qi, F.; Cheng, K.; Wang, B.; Ye, W.; Liu, X.; Lian, C.; et al. Development of a new deep-sea hybrid Raman insertion probe and its application to the geochemistry of hydrothermal vent and cold seep fluids. Deep. Sea Res. Part I Oceanogr. Res. Pap. 2017, 123, 1–12. [Google Scholar] [CrossRef]
  12. Watson, J.; Payne, P. A study of organic compound pervaporation through silicone rubber. J. Membr. Sci. 1990, 49, 171–205. [Google Scholar] [CrossRef]
  13. Lv, Y.; Huang, K.; Zhang, W.; Ran, S.; Chi, F.; Yang, B.; Liu, X. High-performance gas-sensing properties of octahedral NiO crystals prepared via one-step controllable synthesis route. Cryst. Res. Technol. 2014, 49, 109–115. [Google Scholar] [CrossRef]
  14. Domon, B.; Aebersold, R. Mass Spectrometry and Protein Analysis. Science 2006, 312, 212–217. [Google Scholar] [CrossRef] [Green Version]
  15. Zheng, K.; Zheng, C.; Zhang, H.; Guan, G.; Zhang, Y.; Wang, Y.; Tittel, F.K. A novel gas sensing scheme using near-infrared multi-input multi-output off-axis integrated cavity output spectroscopy (MIMO-OA-ICOS). Spectrochim. Acta Part A Mol. Biomol. Spectrosc. 2021, 256, 119745. [Google Scholar] [CrossRef]
  16. Tan, X.; Zhang, H.; Li, J.; Wan, H.; Guo, Q.; Zhu, H.; Liu, H.; Yi, F. Non-dispersive infrared multi-gas sensing via nanoantenna integrated narrowband detectors. Nat. Commun 2020, 11, 5245. [Google Scholar] [CrossRef]
  17. Vallon, R.; Soutade, J.; Vérant, J.-L.; Meyers, J.; Paris, S.; Mohamed, A. A Compact Tunable Diode Laser Absorption Spectrometer to Monitor CO2 at 2.7 µm Wavelength in Hypersonic Flows. Sensors 2010, 10, 6081–6091. [Google Scholar] [CrossRef]
  18. Wankel, S.D.; Huang, Y.-W.; Gupta, M.; Provencal, R.; Leen, J.B.; Fahrland, A.; Vidoudez, C.; Girguis, P.R. Characterizing the Distribution of Methane Sources and Cycling in the Deep Sea via in Situ Stable Isotope Analysis. Environ. Sci. Technol. 2012, 47, 1478–1486. [Google Scholar] [CrossRef]
  19. Mohtada, S.; Mohammad, A.; Kazem, S.; Toraj, M. Gas permeation through a synthesized composite PDMS/PES membrane. J. Membr. 2009, 342, 236–250. [Google Scholar]
  20. Wu, H.; Dong, L.; Zheng, H.; Yu, Y.; Ma, W.; Zhang, L.; Yin, W.; Xiao, L.; Jia, S.; Tittel, F.K. Beat frequency quartz-enhanced photoacoustic spectroscopy for fast and calibration-free continuous trace-gas monitoring. Nat. Commun. 2017, 8, 15331. [Google Scholar] [CrossRef] [Green Version]
  21. Wei, T.; Zifarelli, A.; Russo, S.D.; Wu, H.; Menduni, G.; Patimisco, P.; Sampaolo, A.; Spagnolo, V.; Dong, L. High and flat spectral responsivity of quartz tuning fork used as infrared photodetector in tunable diode laser spectroscopy. Appl. Phys. Rev. 2021, 8, 041409. [Google Scholar] [CrossRef]
  22. Yin, X.; Dong, L.; Wu, H.; Gao, M.; Zhang, L.; Zhang, X.; Liu, L.; Shao, X.; Tittel, F.K. Compact QEPAS humidity sensor in SF6 buffer gas for high-voltage gas power systems. Photoacoustics 2021, 25, 100319. [Google Scholar] [CrossRef] [PubMed]
  23. Ma, Y.; Hu, Y.; Qiao, S.; Lang, Z.; Liu, X.; He, Y.; Spagnolo, V. Quartz tuning forks resonance frequency matching for laser spectroscopy sensing. Photoacoustics 2022, 25, 100329. [Google Scholar] [CrossRef] [PubMed]
  24. Zhang, Q.; Chang, J.; Wang, Q.; Wang, Z.; Wang, F.; Qin, Z. Acousto-Optic Q-Switched Fiber Laser-Based Intra-Cavity Photoacoustic Spectroscopy for Trace Gas Detection. Sensors 2018, 18, 42. [Google Scholar] [CrossRef] [PubMed] [Green Version]
  25. Li, M.; Hu, M.; Zhang, H.; Wang, J.; Tang, T.; Hu, M.; Wang, Q. All-Fiber Photoacoustic Gas Sensing with Interferometric Location. Photonics 2022, 9, 546. [Google Scholar] [CrossRef]
  26. Zhang, Q.; Chang, J.; Cong, Z.; Sun, J.; Wang, Z. QEPAS sensor for simultaneous measurements of H2O, CH4, and C2H2 using different QTFs. IEEE Photon. J. 2018, 10, 1–8. [Google Scholar] [CrossRef]
  27. Kosterev, A.A.; Bakhirkin, Y.A.; Curl, R.F.; Tittel, F.K. Quartz-enhanced photoacoustic spectroscopy. Opt. Lett. 2002, 27, 1902–1904. [Google Scholar] [CrossRef] [Green Version]
  28. Wang, F.; Cheng, Y.; Xue, Q.; Wang, Q.; Liang, R.; Wu, J.; Sun, J.; Zhu, C.; Li, Q. Techniques to enhance the photoacoustic signal for trace gas sensing: A review. Sens. Actuator A Phys. 2022, 345, 113807. [Google Scholar] [CrossRef]
  29. Borri, S.; Patimisco, P.; Galli, I.; Mazzotti, D.; Giusfredi, G.; Akikusa, N.; Yamanishi, M.; Scamarcio, G.; De Natale, P.; Spagnolo, V. Intracavity quartz-enhanced photoacoustic sensor. Appl. Phys. Lett. 2014, 104, 091114. [Google Scholar] [CrossRef]
  30. Sampaolo, A.; Csutak, S.; Patimisco, P.; Giglio, M.; Menduni, G.; Passaro, V.; Tittel, F.K.; Deffenbaugh, M.; Spagnolo, V. Methane, ethane and propane detection using a compact quartz enhanced photoacoustic sensor and a single interband cascade laser. Sens. Actuators B Chem. 2018, 282, 952–960. [Google Scholar] [CrossRef]
  31. Wang, Z.; Wang, Q.; Zhang, H.; Borri, S.; Galli, I.; Sampaolo, A.; Patimisco, P.; Spagnolo, V.L.; De Natale, P.; Ren, W. Doubly resonant sub-ppt photoacoustic gas detection with eight decades dynamic range. Photoacoustics 2022, 27, 100387. [Google Scholar] [CrossRef]
  32. Zhang, H.; Wang, Z.; Wang, Q.; Borri, S.; Galli, I.; Sampaolo, A.; Patimisco, P.; Spagnolo, V.L.; Natale, P.D.; Ren, W. Parts-per-billion-level detection of hydrogen sulfide based on doubly resonant photoacoustic spectroscopy with line-locking. Photoacoustics 2023, 29, 100436. [Google Scholar] [CrossRef]
  33. Wang, F.; Chang, J.; Wang, Q.; Liu, Y.; Liu, Z.; Qin, Z.; Zhu, C. Improvement in QEPAS system based on miniaturized collimator and flat mirror. Opt. Commun. 2016, 381, 152–157. [Google Scholar] [CrossRef]
  34. Kosterev, A.A.; Tittel, F.K.; Serebryakov, D.V.; Malinovsky, A.L.; Morozov, I.V. Applications of quartz tuning forks in spectroscopic gas sensing. Rev. Sci. Instrum. 2005, 76, 043105. [Google Scholar] [CrossRef] [Green Version]
  35. Liu, K.; Li, J.; Wang, L.; Tan, T.; Zhang, W.; Gao, X.; Chen, W.; Tittel, F.K. Trace gas sensor based on quartz tuning fork enhanced laser photoacoustic spectroscopy. Appl. Phys. B Laser Opt. 2009, 94, 527–533. [Google Scholar] [CrossRef]
  36. Dong, Y.; Chen, J.; Luo, L.; Forsberg, E.; He, S.; Yan, C. Modeling and implementation of a fiber-based quartz-enhanced photoacoustic spectroscopy system. Appl. Opt. 2015, 54, 4202–4206. [Google Scholar] [CrossRef]
  37. Ma, Y.; He, Y.; Yu, X.; Zhang, J.; Sun, R.; Tittel, F.K. Compact all-fiber quartz-enhanced photoacoustic spectroscopy sensor with a 30.72 kHz quartz tuning fork and spatially resolved trace gas detection. Appl. Phys. Lett. 2016, 108, 091115. [Google Scholar] [CrossRef] [Green Version]
  38. Lewicki, R.; Wysocki, G.; Kosterev, A.A.; Tittel, F.K. QEPAS based detection of broadband absorbing molecules using a widely tunable, cw quantum cascade laser at 8.4 μm. Opt. Express 2007, 15, 7357–7366. [Google Scholar] [CrossRef] [Green Version]
  39. Liu, K.; Yi, H.; Kosterev, A.A.; Chen, W.; Dong, L.; Wang, L.; Tan, T.; Zhang, W.; Tittel, F.K.; Gao, X. Trace gas detection based on off-beam quartz enhanced photoacoustic spectroscopy: Optimization and performance evaluation. Rev. Sci. Instrum. 2010, 81, 103103. [Google Scholar] [CrossRef]
  40. Yi, H.; Chen, W.; Guo, X.; Sun, S.; Liu, K.; Tan, T.; Zhang, W.; Gao, X. An acoustic model for microresonator in on-beam quartz-enhanced photoacoustic spectroscopy. Appl. Phys. B Laser Opt. 2012, 108, 361–367. [Google Scholar] [CrossRef]
  41. Qiao, S.; He, Y.; Ma, Y. Trace gas sensing based on single-quartz-enhanced photoacoustic–photothermal dual spectroscopy. Opt. Lett. 2021, 46, 2449–2452. [Google Scholar] [CrossRef] [PubMed]
  42. Cao, Y.; Jin, W.; Ho, H.L.; Qi, L.; Yang, Y.H. Acetylene detection based on diode laser QEPAS: Combined wavelength and residual amplitude modulation. Appl. Phys. B Laser Opt. 2012, 109, 359–366. [Google Scholar] [CrossRef]
  43. Lin, C.; Zhu, Y.; Wei, W.; Wang, N.; Bao, W. A Novel QEPAS with Microresonator in the Open Environment. Int. J. Thermophys. 2012, 34, 1413–1420. [Google Scholar] [CrossRef]
  44. Rahimi, M.; Chae, I.; Hawk, J.E.; Mitra, S.K.; Thundat, T. Methane sensing at room temperature using photothermal cantilever deflection spectroscopy. Sens. Actuators B Chem. 2015, 221, 564–569. [Google Scholar] [CrossRef]
  45. Sgobba, F.; Menduni, G.; Russo, S.D.; Sampaolo, A.; Patimisco, P.; Giglio, M.; Ranieri, E.; Passaro, V.M.N.; Tittel, F.K.; Spagnolo, V. Quartz-Enhanced Photoacoustic Detection of Ethane in the Near-IR Exploiting a Highly Performant Spectrophone. Appl. Sci. 2020, 10, 2447. [Google Scholar] [CrossRef] [Green Version]
  46. Hu, M.; Chen, B.; Yao, L.; Yang, C.; Chen, X.; Kan, R. A Fiber-Integrated CRDS Sensor for In-Situ Measurement of Dissolved Carbon Dioxide in Seawater. Sensors 2021, 21, 6436. [Google Scholar] [CrossRef]
  47. Feng, J.; Yang, S.; Wang, H.; Liang, J.; Fang, Y.; Luo, M. Methane Source and Turnover in the Shallow Sediments to the West of Haima Cold Seeps on the Northwestern Slope of the South China Sea. Geofluids 2019, 2019, 18. [Google Scholar] [CrossRef]
Figure 1. The schematic of the fiber-coupled spectrophone. The QTF, micro-resonator tube and fiber are fixed with epoxy resin. (a) The diagram of QEPAS cell design. (b) Photo of the spectrophone.
Photonics 10 00127 g001
Figure 2. Schematic of sub-mL QEPAS system. WFG: Waveform Generator; NI DAQ board: National Instruments data acquisition board; TEC: Thermoelectric Cooler; mR: micro-resonator tube; QTF: quartz tuning fork; TA: transimpedance amplifier.
Photonics 10 00127 g002
Figure 3. (a) The QEPAS signals with and without the micro-resonator. (b) The QEPAS signals with micro-resonator tubes at different lengths.
Photonics 10 00127 g003
Figure 4. The QEPAS signal as a function of distance between fiber end and micro-resonator tube. Error bars show the standard deviation from 60 measurements and the magnitudes of the error bars are scaled up by 10 fold.
Photonics 10 00127 g004
Figure 5. QEPAS signal as a function of modulation depth.
Photonics 10 00127 g005
Figure 6. Linearity of QEPAS signal to concentrations of CH4. Error bars show the standard deviation from 60 measurements and the magnitudes of the error bars are scaled up by 10 fold.
Photonics 10 00127 g006
Figure 7. Influence of incident laser on system noise.
Photonics 10 00127 g007
Figure 8. Allan–Werle deviation at 760 Torr for detection of N2.
Photonics 10 00127 g008
Figure 9. In situ measurement of dissolved CH4 at the Haima Cold Spring Area in the South China sea.
Photonics 10 00127 g009
Disclaimer/Publisher’s Note: The statements, opinions and data contained in all publications are solely those of the individual author(s) and contributor(s) and not of MDPI and/or the editor(s). MDPI and/or the editor(s) disclaim responsibility for any injury to people or property resulting from any ideas, methods, instructions or products referred to in the content.

