Slot-Waveguide Based All-Optical RF Spectrum Analyzer


 ,
,
Abstract
:1. Introduction
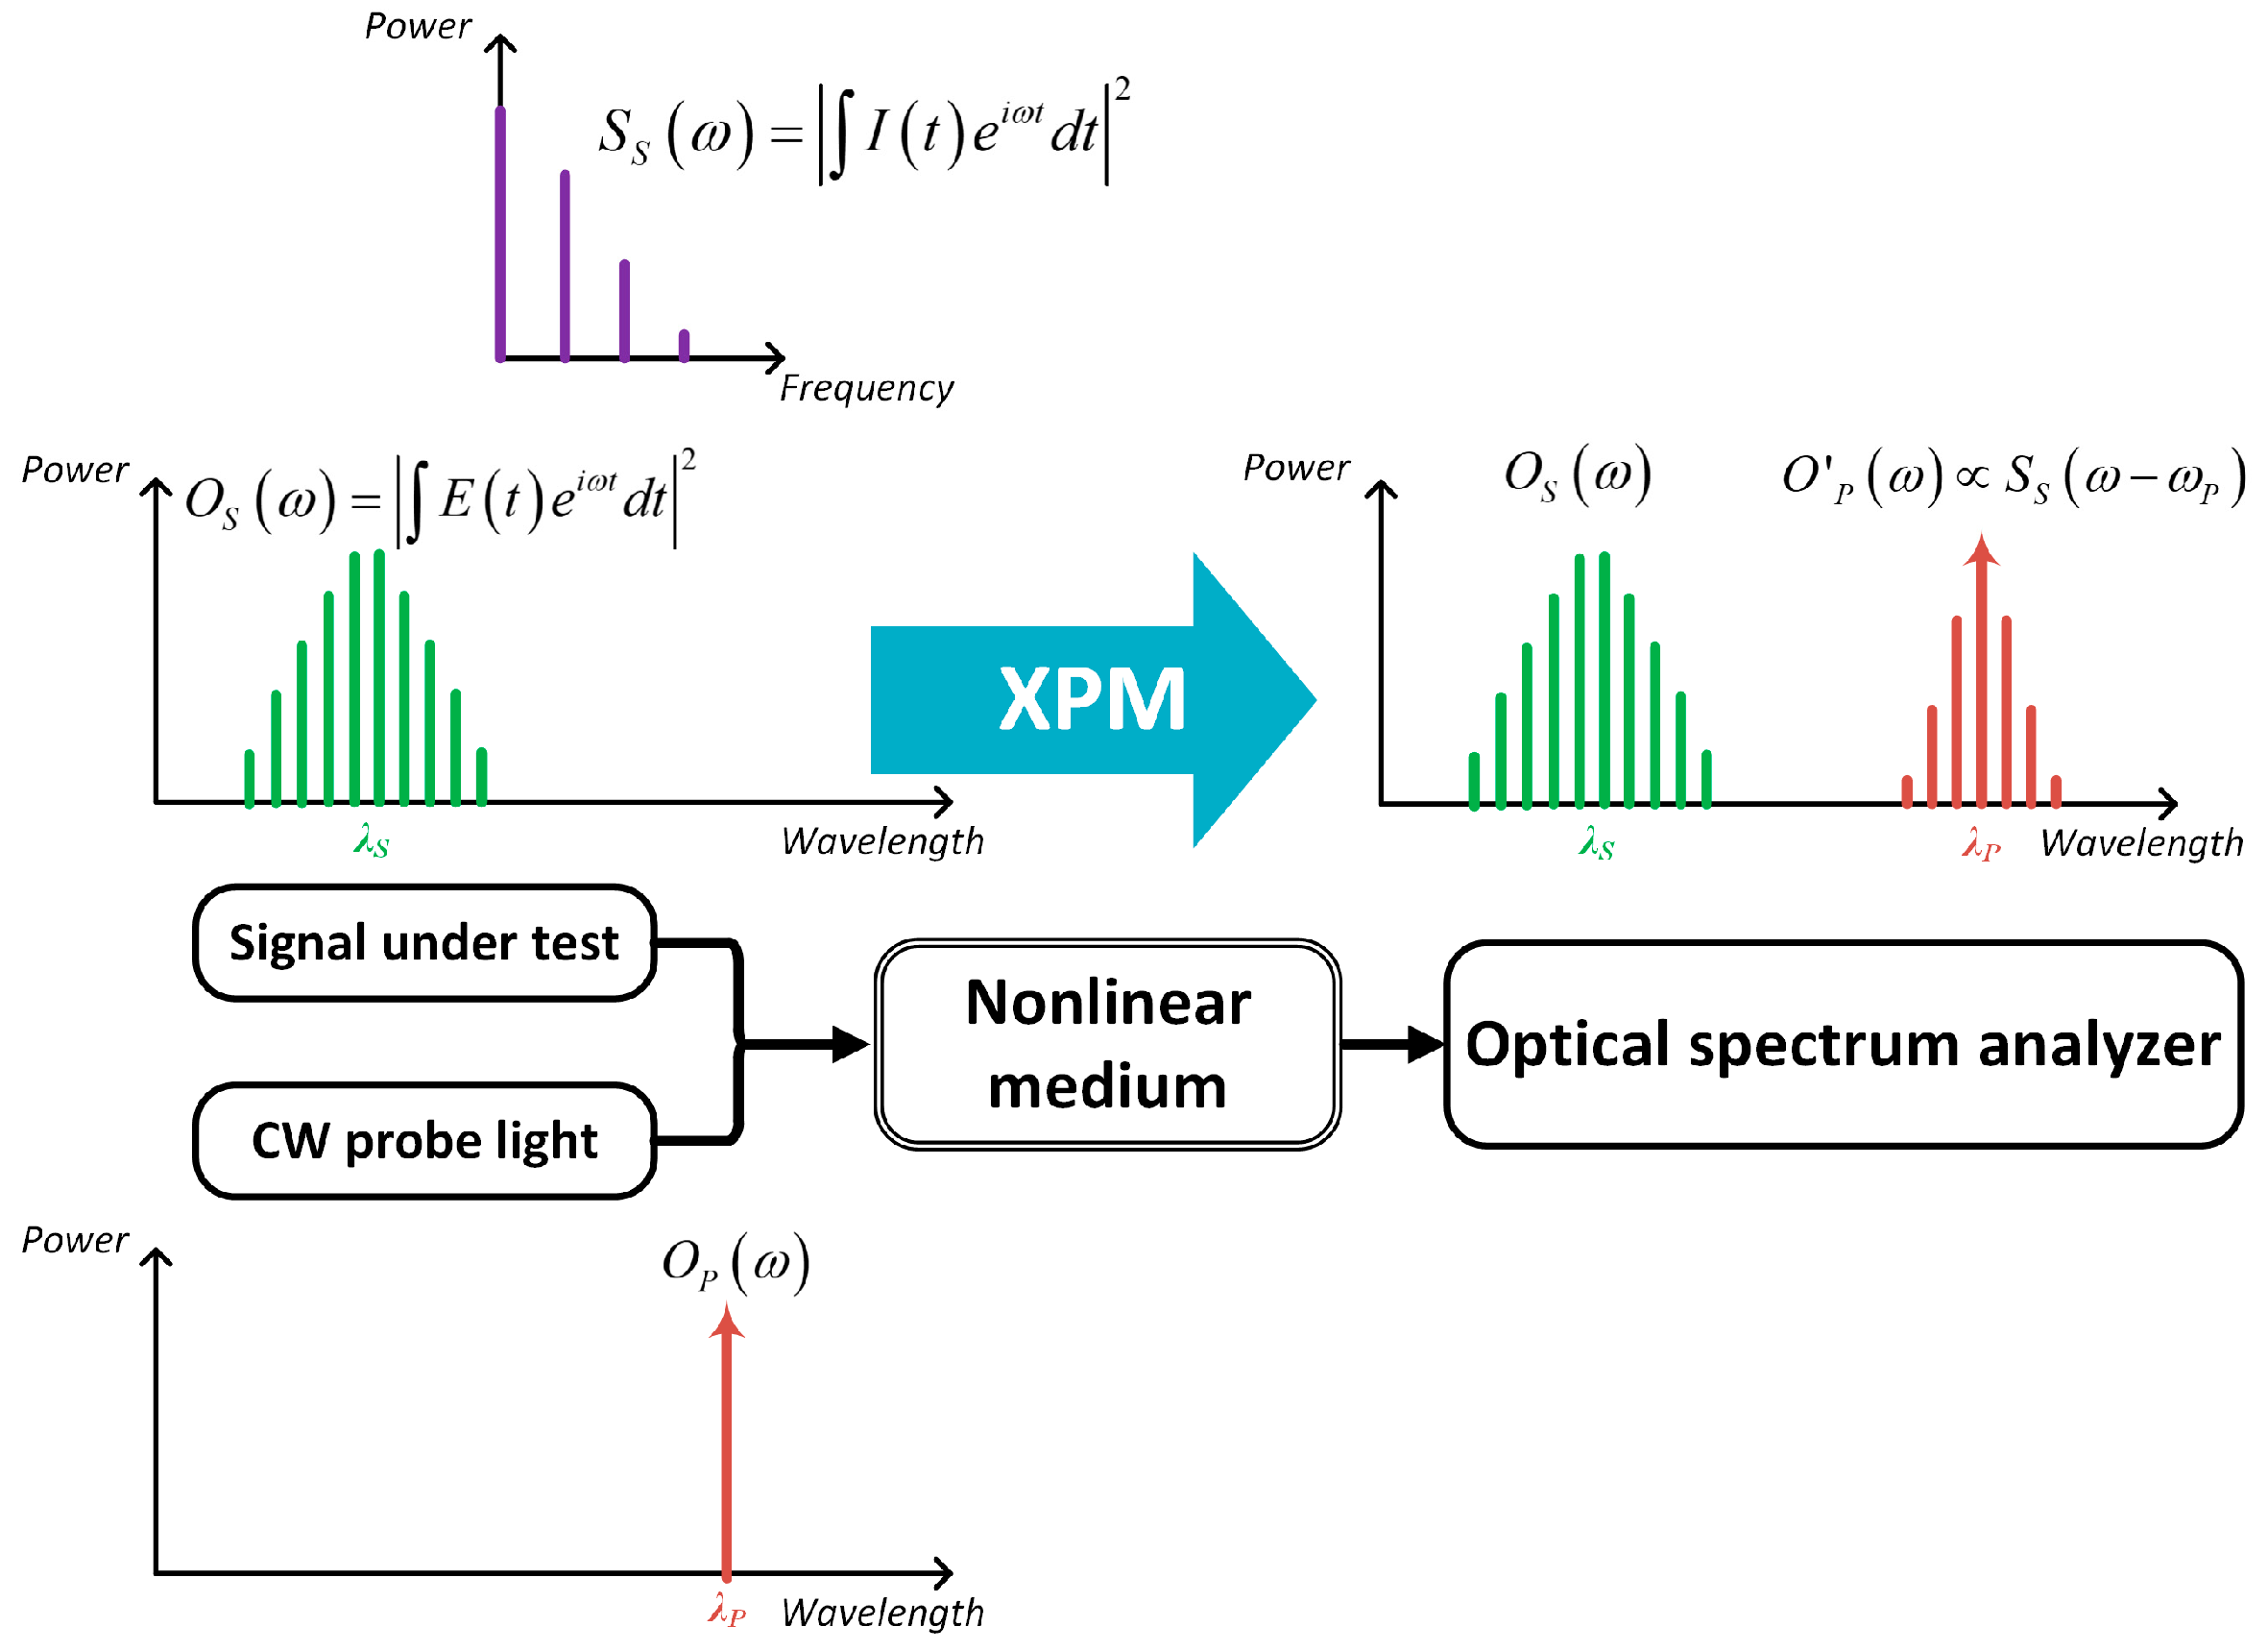
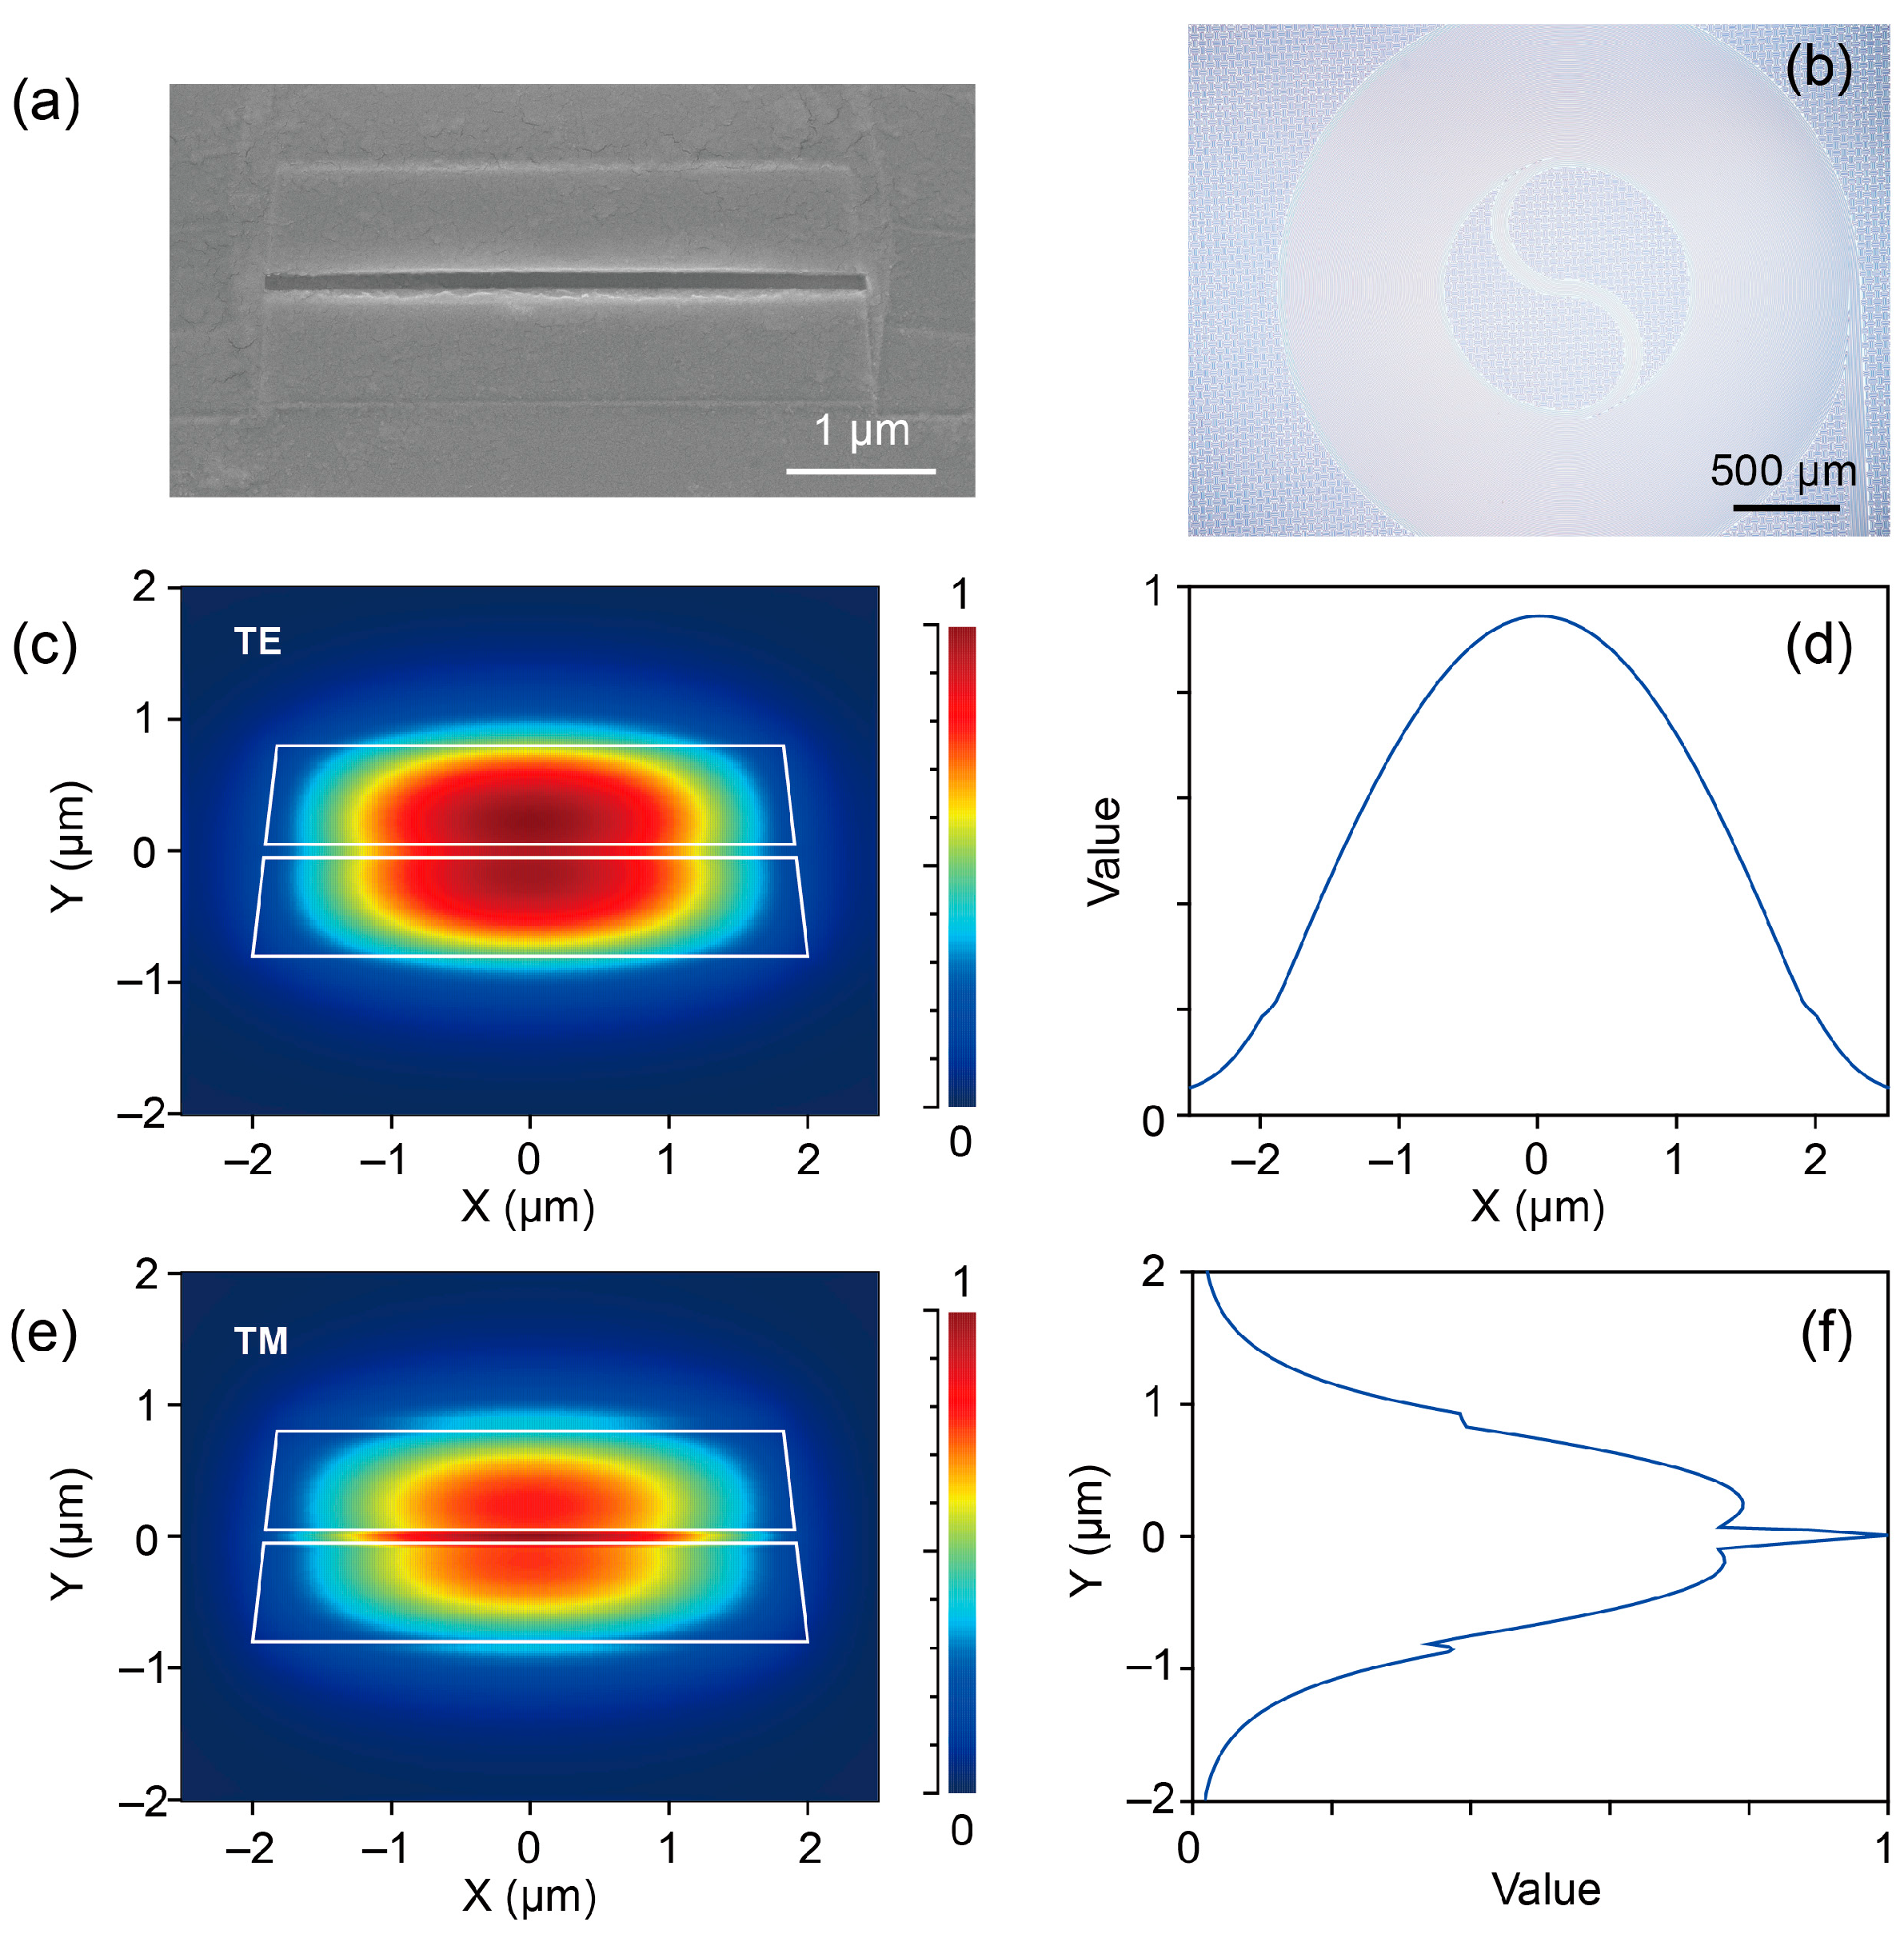
2. Methods
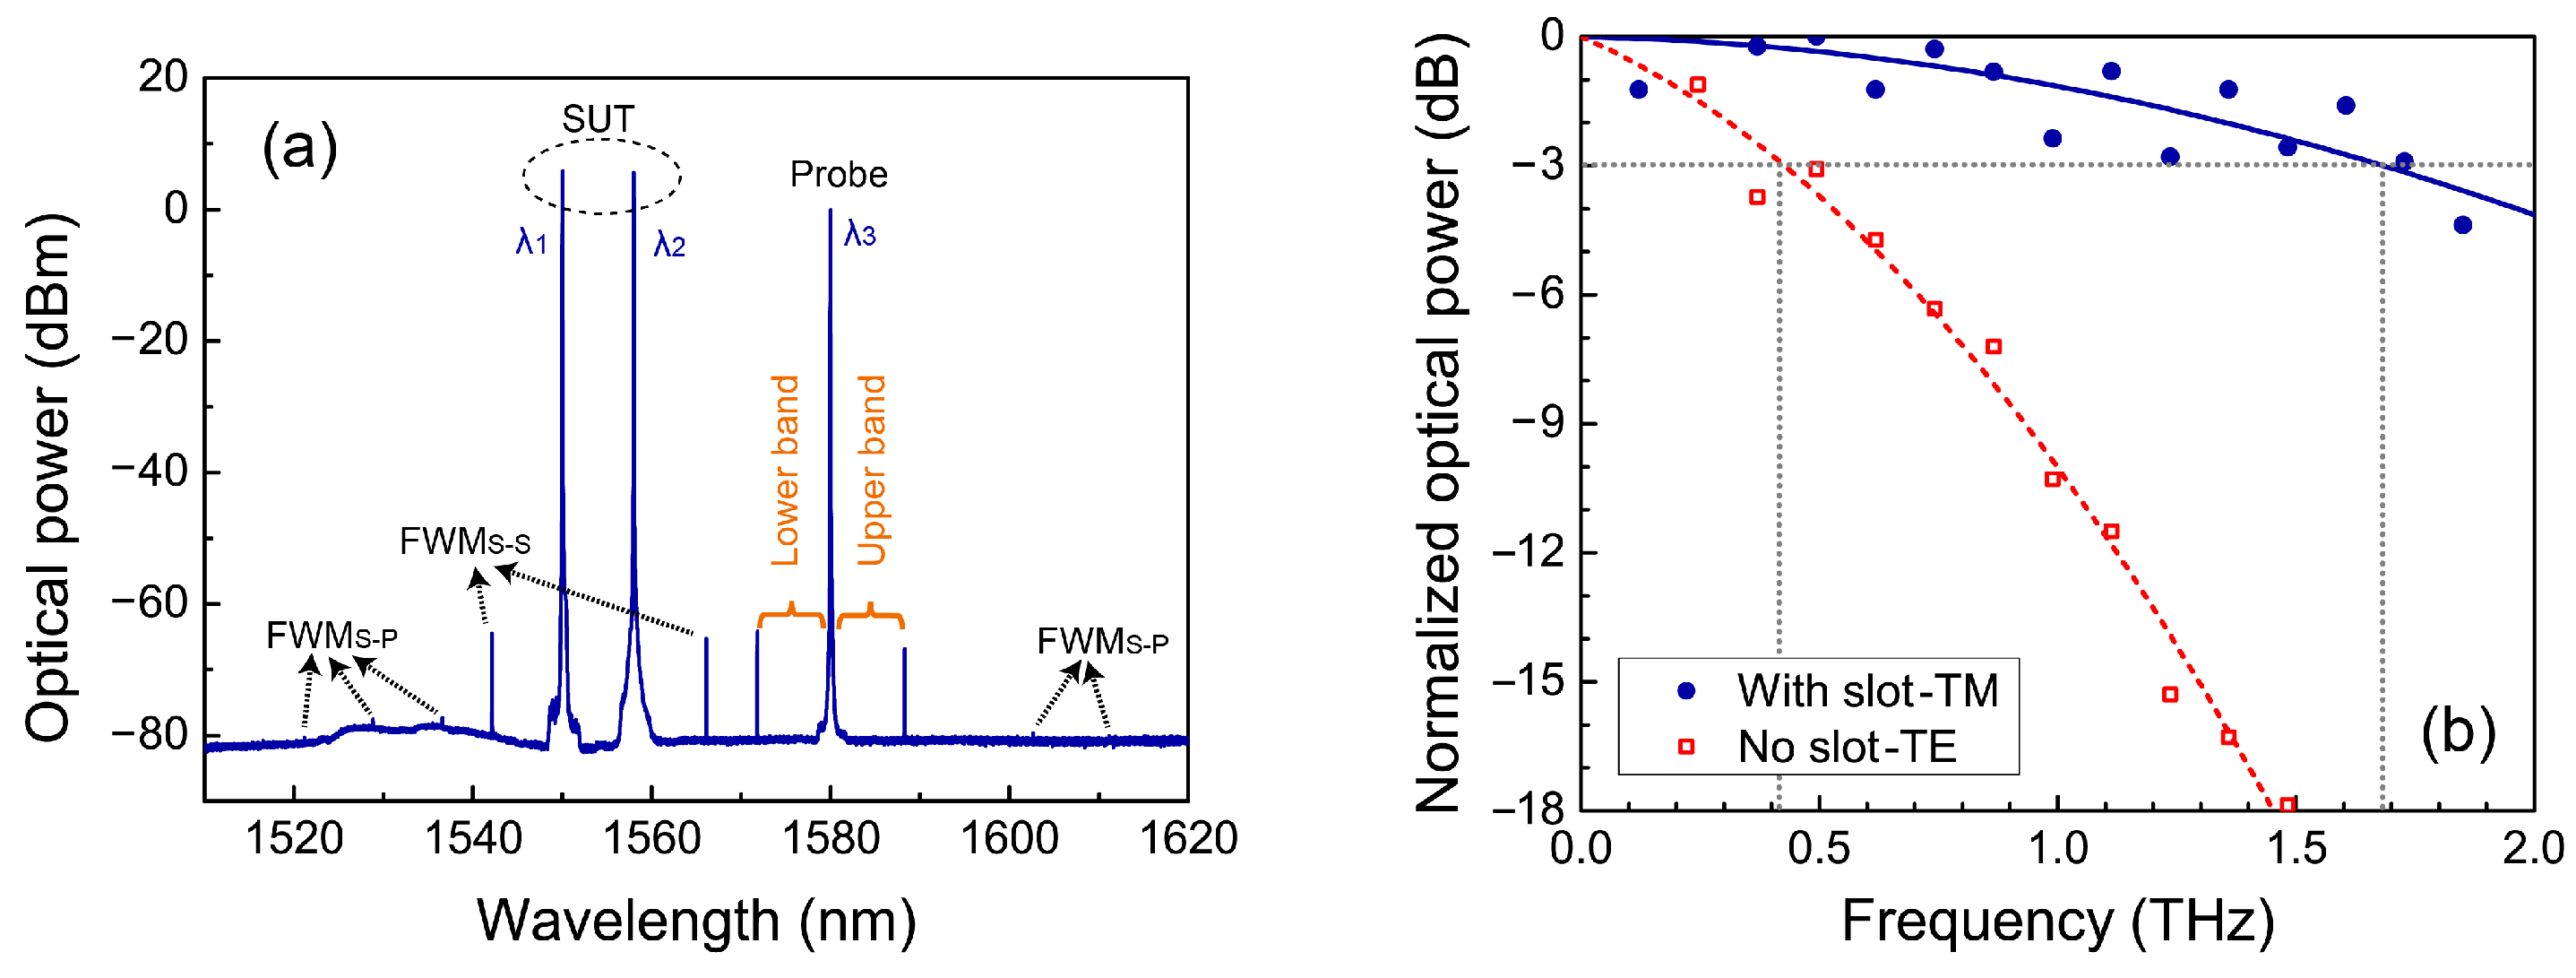
3. Experiment
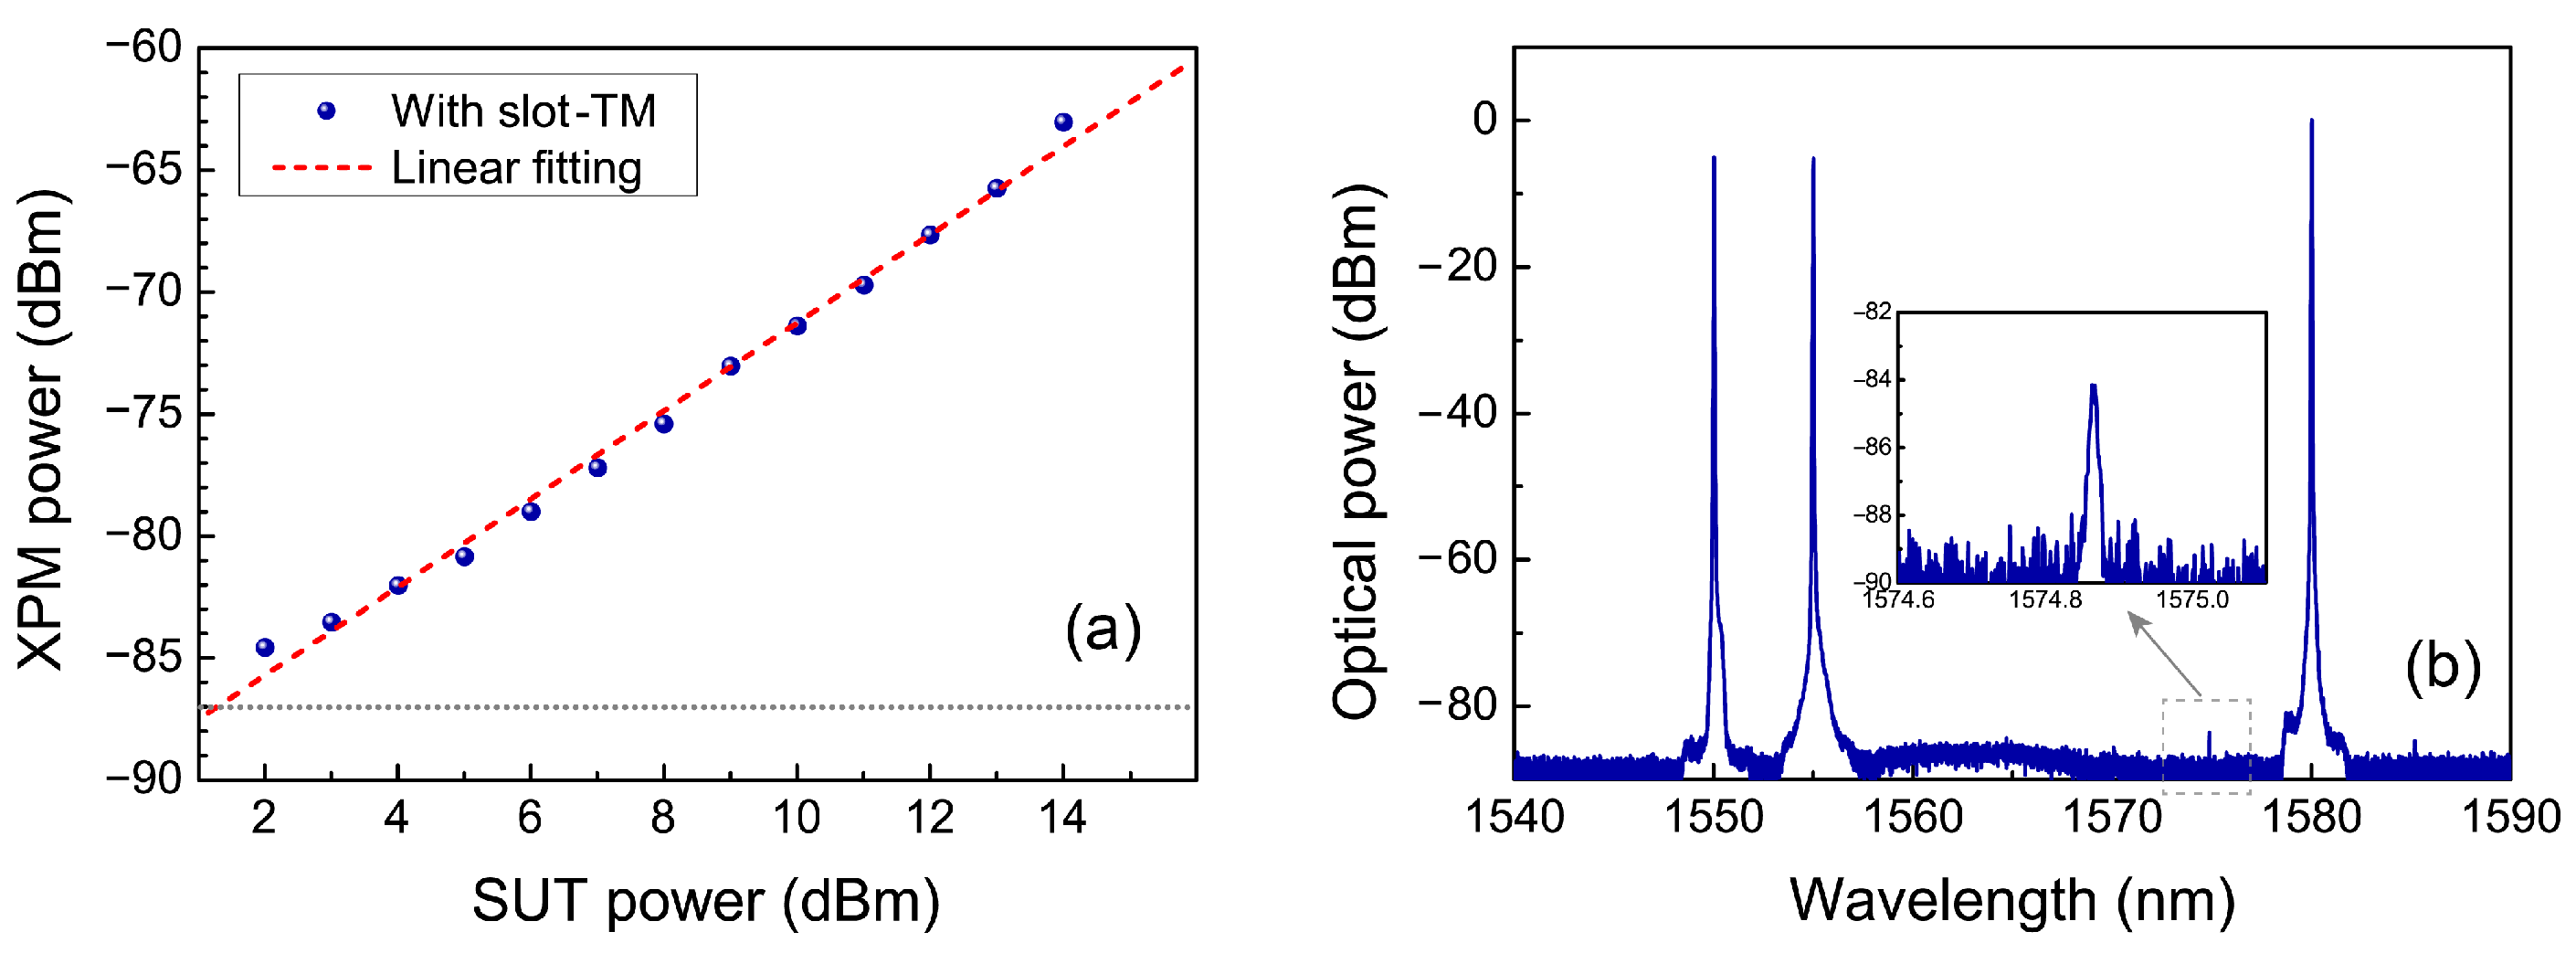
4. Experimental Results and Discussion
4.1. Bandwidth
4.2. Sensitivity
4.3. Wavelength-Dependence
4.4. Polarization-Dependence
5. Conclusions
Author Contributions
Funding
Data Availability Statement
Conflicts of Interest
References
- Weber, H.-G.; Ludwig, R. Ultra-high-speed OTDM transmission technology. In Optical Fiber Telecommunications VB; Elsevier: New York, NY, USA, 2008; pp. 201–232. [Google Scholar]
- Vo, T.D.; Pelusi, M.D.; Schroder, J.; Corcoran, B.; Eggleton, B.J. Multi-impairment monitoring at 320 Gb/s based on cross-phase modulation radio-frequency spectrum analyzer. IEEE Photonics Technol. Lett. 2010, 22, 428–430. [Google Scholar] [CrossRef]
- Vo, T.; Pelusi, M.; Schroeder, J.; Luan, F.; Madden, S.; Choi, D.-Y.; Bulla, D.; Luther-Davies, B.; Eggleton, B. Simultaneous multi-impairment monitoring of 640 Gb/s signals using photonic chip based RF spectrum analyzer. Opt. Express 2010, 18, 3938–3945. [Google Scholar] [CrossRef] [PubMed]
- Walmsley, I.A.; Dorrer, C. Characterization of ultrashort electromagnetic pulses. Adv. Opt. Photonics 2009, 1, 308–437. [Google Scholar] [CrossRef]
- Von der Linde, D. Characterization of the noise in continuously operating mode-locked lasers. Appl. Phys. B 1986, 39, 201–217. [Google Scholar] [CrossRef]
- Capmany, J.; Novak, D. Microwave photonics combines two worlds. Nat. Photonics 2007, 1, 319. [Google Scholar] [CrossRef]
- Ou, H.; Ye, C.; Zhu, K.; Hu, Y.; Fu, H. Millimeter-wave harmonic signal generation and distribution using a tunable single-resonance microwave photonic filter. J. Lightwave Technol. 2010, 28, 2337–2342. [Google Scholar]
- Pelusi, M.; Luan, F.; Vo, T.D.; Lamont, M.R.; Madden, S.J.; Bulla, D.A.; Choi, D.-Y.; Luther-Davies, B.; Eggleton, B.J. Photonic-chip-based radio-frequency spectrum analyser with terahertz bandwidth. Nat. Photonics 2009, 3, 139–143. [Google Scholar] [CrossRef]
- Eggleton, B.J.; Vo, T.D.; Pant, R.; Schr, J.; Pelusi, M.D.; Yong Choi, D.; Madden, S.J.; Luther-Davies, B. Photonic chip based ultrafast optical processing based on high nonlinearity dispersion engineered chalcogenide waveguides. Laser Photonics Rev. 2012, 6, 97–114. [Google Scholar] [CrossRef]
- Chen, L.; Duan, Y.; Zhou, H.; Zhou, X.; Zhang, C.; Zhang, X. Real-time broadband radio frequency spectrum analyzer based on parametric spectro-temporal analyzer (PASTA). Opt. Express 2017, 25, 9416–9425. [Google Scholar] [CrossRef]
- Dorrer, C.; Maywar, D. RF spectrum analysis of optical signals using nonlinear optics. J. Lightwave Technol. 2004, 22, 266. [Google Scholar] [CrossRef]
- Corcoran, B.; Vo, T.D.; Pelusi, M.D.; Monat, C.; Xu, D.-X.; Densmore, A.; Ma, R.; Janz, S.; Moss, D.J.; Eggleton, B.J. Silicon nanowire based radio-frequency spectrum analyzer. Opt. Express 2010, 18, 20190–20200. [Google Scholar] [CrossRef] [PubMed]
- Ma, M.; Adams, R.; Chen, L.R. Integrated photonic chip enabled simultaneous multichannel wideband radio frequency spectrum analyzer. J. Light. Technol. 2017, 35, 2622–2628. [Google Scholar] [CrossRef]
- Vo, T.D.; Corcoran, B.; Schroder, J.; Pelusi, M.D.; Xu, D.-X.; Densmore, A.; Ma, R.; Janz, S.; Moss, D.J.; Eggleton, B.J. Silicon-chip-based real-time dispersion monitoring for 640 Gbit/s DPSK signals. J. Lightwave Technol. 2011, 29, 1790–1796. [Google Scholar] [CrossRef]
- Pelusi, M.; Vo, T.D.; Luan, F.; Madden, S.J.; Choi, D.-Y.; Bulla, D.; Luther-Davies, B.; Eggleton, B.J. Terahertz bandwidth RF spectrum analysis of femtosecond pulses using a chalcogenide chip. Opt. Express 2009, 17, 9314–9322. [Google Scholar] [CrossRef] [PubMed]
- Ferrera, M.; Reimer, C.; Pasquazi, A.; Peccianti, M.; Clerici, M.; Caspani, L.; Chu, S.T.; Little, B.E.; Morandotti, R.; Moss, D.J. CMOS compatible integrated all-optical radio frequency spectrum analyzer. Opt. Express 2014, 22, 21488–21498. [Google Scholar] [CrossRef] [PubMed]
- Li, Y.; Kang, Z.; Zhu, K.; Ai, S.; Wang, X.; Davidson, R.R.; Wu, Y.; Morandotti, R.; Little, B.E.; Moss, D.J.; et al. All-optical RF spectrum analyzer with a 5 THz bandwidth based on CMOS-compatible high-index doped silica waveguides. Opt. Lett. 2021, 46, 1574–1577. [Google Scholar] [CrossRef] [PubMed]
- Dizaji, M.R.; Krückel, C.J.; Fülöp, A.; Andrekson, P.A.; Chen, L.R. Silicon-rich nitride waveguides for ultra-broadband nonlinear signal processing. Opt. Express 2017, 25, 12100–12108. [Google Scholar] [CrossRef]
- Liu, Q.; Gao, S.; Li, Z.; Xie, Y.; He, S. Dispersion engineering of a silicon-nanocrystal-based slot waveguide for broadband wavelength conversion. Appl. Opt. 2011, 50, 1260–1265. [Google Scholar] [CrossRef]
- Mas, S.; Caraquitena, J.; Galán, J.V.; Sanchis, P.; Martí, J. Tailoring the dispersion behavior of silicon nanophotonic slot waveguides. Opt. Express 2010, 18, 20839–20844. [Google Scholar] [CrossRef]
- Zhang, L.; Yan, Y.; Yue, Y.; Lin, Q.; Painter, O.; Beausoleil, R.G.; Willner, A.E. On-chip two-octave supercontinuum generation by enhancing self-steepening of optical pulses. Opt. Express 2011, 19, 11584–11590. [Google Scholar] [CrossRef]
- Zhu, M.; Liu, H.; Li, X.; Huang, N.; Sun, Q.; Wen, J.; Wang, Z. Ultrabroadband flat dispersion tailoring of dual-slot silicon waveguides. Opt. Express 2012, 20, 15899–15907. [Google Scholar] [CrossRef] [PubMed]
- Boggio, J.C.; Bodenmüller, D.; Fremberg, T.; Haynes, R.; Roth, M.; Eisermann, R.; Lisker, M.; Zimmermann, L.; Böhm, M. Dispersion engineered silicon nitride waveguides by geometrical and refractive-index optimization. JOSA B 2014, 31, 2846–2857. [Google Scholar] [CrossRef]
- Zhang, L.; Yue, Y.; Xiao-Li, Y.; Beausoleil, R.G.; Willner, A.E. Highly dispersive slot waveguides. Opt. Express 2009, 17, 7095–7101. [Google Scholar] [CrossRef]
- Li, Y.; Li, J.; Huo, Y.; Chen, M.; Yang, S.; Chen, H. Spatial-mode-coupling-based dispersion engineering for integrated optical waveguide. Opt. Express 2018, 26, 2807–2816. [Google Scholar] [CrossRef]
- Moss, D.J.; Morandotti, R.; Gaeta, A.L.; Lipson, M. New CMOS-compatible platforms based on silicon nitride and Hydex for nonlinear optics. Nat. Photonics 2013, 7, 597–607. [Google Scholar] [CrossRef]
- Ferrera, M.; Razzari, L.; Duchesne, D.; Morandotti, R.; Yang, Z.; Liscidini, M.; Sipe, J.; Chu, S.; Little, B.E.; Moss, D.J. Low-power continuous-wave nonlinear optics in doped silica glass integrated waveguide structures. Nat. Photonics 2008, 2, 737–740. [Google Scholar] [CrossRef]
- Xu, Q.; Almeida, V.R.; Panepucci, R.R.; Lipson, M. Experimental demonstration of guiding and confining light in nanometer-size low-refractive-index material. Opt. Lett. 2004, 29, 1626–1628. [Google Scholar] [CrossRef]
- Xiao-Li, Y. Light guiding in a slot waveguide that includes an additional confining core region. Opt. Express 2010, 18, 6408–6416. [Google Scholar] [CrossRef]
- Vallaitis, T.; Bogatscher, S.; Alloatti, L.; Dumon, P.; Baets, R.; Scimeca, M.L.; Biaggio, I.; Diederich, F.; Koos, C.; Freude, W. Optical properties of highly nonlinear silicon-organic hybrid (SOH) waveguide geometries. Opt. Express 2009, 17, 17357–17368. [Google Scholar] [CrossRef]


| Waveguide/Mode | Dispersion @1555 nm (ps/nm/km) | Dispersion Slope @1550 nm (ps/nm2/km) | Propagation Loss @1550 nm (dB/cm) | γ (/W/km) |
|---|---|---|---|---|
| With slot/TM | 10.5 | −0.42 | 0.11 | 190 |
| With slot/TE | 17.7 | −0.42 | 0.10 | 130 |
| No slot/TM | 55.1 | −0.39 | 0.09 | 180 |
| No slot/TE | 44.0 | −0.36 | 0.07 | 100 |
Disclaimer/Publisher’s Note: The statements, opinions and data contained in all publications are solely those of the individual author(s) and contributor(s) and not of MDPI and/or the editor(s). MDPI and/or the editor(s) disclaim responsibility for any injury to people or property resulting from any ideas, methods, instructions or products referred to in the content. |
© 2023 by the authors. Licensee MDPI, Basel, Switzerland. This article is an open access article distributed under the terms and conditions of the Creative Commons Attribution (CC BY) license (https://creativecommons.org/licenses/by/4.0/).
Share and Cite
Li, Y.; Kang, Z.; Ho, W.-L.; Davidson, R.R.; Little, B.E.; Chu, S.-T.; Zhu, K. Slot-Waveguide Based All-Optical RF Spectrum Analyzer. Photonics 2023, 10, 1380. https://doi.org/10.3390/photonics10121380
Li Y, Kang Z, Ho W-L, Davidson RR, Little BE, Chu S-T, Zhu K. Slot-Waveguide Based All-Optical RF Spectrum Analyzer. Photonics. 2023; 10(12):1380. https://doi.org/10.3390/photonics10121380
Chicago/Turabian StyleLi, Yuhua, Zhe Kang, Wai-Lok Ho, Roy R. Davidson, Brent E. Little, Sai-Tak Chu, and Kun Zhu. 2023. "Slot-Waveguide Based All-Optical RF Spectrum Analyzer" Photonics 10, no. 12: 1380. https://doi.org/10.3390/photonics10121380
APA StyleLi, Y., Kang, Z., Ho, W.-L., Davidson, R. R., Little, B. E., Chu, S.-T., & Zhu, K. (2023). Slot-Waveguide Based All-Optical RF Spectrum Analyzer. Photonics, 10(12), 1380. https://doi.org/10.3390/photonics10121380