Article

Metasurface Enhanced Upconversion Efficiency for High-Performance Pixel-Less Thermal Imaging

1
School of Information Science and Technology, North China University of Technology, Beijing 100144, China
2
Institute of Applied Physics and Computational Mathematics, Beijing 100088, China
3
National Key Laboratory of Computational Physics, Beijing 100088, China
4
School of Science, Beijing University of Posts and Telecommunications, Beijing 100876, China
5
Microsystem & Terahertz Research Center, China Academy of Engineering Physics (CAEP), Chengdu 610200, China
6
Institute of Electronic Engineering, China Academy of Engineering Physics (CAEP), Mianyang 621900, China
7
Beijing Dongfang Botai Radio Spectrum Technology Research Institute, Beijing 101200, China
8
Department of Engineering Physics, Tsinghua University, Beijing 100084, China
*
Authors to whom correspondence should be addressed.
These authors contributed equally to this work.
Photonics 2023, 10(12), 1301; https://doi.org/10.3390/photonics10121301
Submission received: 25 October 2023 / Revised: 19 November 2023 / Accepted: 22 November 2023 / Published: 24 November 2023
(This article belongs to the Special Issue Multifunctional Metasurfaces: Design Strategies and Applications)

Abstract

:
High-performance infrared thermal imaging devices are widely used in military, biomedical and other fields. Upconversion pixel-less imaging is promising for infrared imaging. In this paper, we propose a hybrid metasurface to achieve high upconversion efficiency of the integrated quantum well infrared photodetector and light-emitting diodes (QWIP-LED). Systematical investigations on the performance of the QWIP-LED, including optical coupling efficiency, light extraction efficiency, and upconversion efficiency, have been carried out via theoretical simulation. We also present the integration time for different devices with different optical coupling structures. Numerical results show that 45° edge-coupled QWIP-LED is not suitable for imaging applications for the low upconversion efficiency. Traditional grating-coupled QWIP-LED can be optimized for real-time thermal imaging. The hybrid-metasurface-based QWIP-LED can achieve a high frame rate above 300 Hz due to the enhanced upconversion efficiency. This work gives a precise description of QWIP-LED performance with different device structures and opens the way for large format upconversion pixel-less imaging.

1. Introduction

Long-wavelength infrared (LWIR) thermal imaging is promising for applications ranging from military, industrial monitoring, biomedicine to epidemic prevention, astronomy and astrophysics [1,2,3,4,5]. Compared with thermal detectors, photon-type detectors have greater practical advantages due to their high sensitivity and fast response capabilities [6]. HgCdTe (MCT) detectors, quantum well photodetectors (QWIPs) and type II superlattice (T2SL) detectors are typical detectors used for LWIR thermal imaging [7,8,9,10].
The HgCdTe infrared detector is highly sensitive to infrared light due to its adjustable bandgap and has a high infrared absorption efficiency [11]. Since its invention, it has been the first choice for infrared detector manufacturing and it is currently the most mature infrared detector [12]. However, the HgCdTe detectors that dominate the short-wavelength infrared (SWIR) and mid-wavelength infrared (MWIR) bands have disadvantages such as high substrate cost, poor material uniformity, low yield, difficult fabrication technology, and low mechanical strength in the LWIR range [13,14].
QWIP is another well-developed LWIR detector based on a periodic heterostructure material [15]. Thanks to the development of molecular beam epitaxy (MBE), GaAs-based and InP-based quantum well materials have been widely and deeply studied. Quantum wells can realize the adjustment of the detection wavelength through structural design. The defect density of QWIP during material growth is low, and the detector manufacturing process is stable [16]. At present, some LWIR QWIPs have been commercialized [17]. However, the selection rule of the intersubband transition determines that QWIP responds to light only parallel to the growth direction of the quantum wells [18]. The absorption coefficient and quantum efficiency are both low [19]. Although high quantum efficiency (HQE) QWIP has also been reported, this type of HQE-QWIP often requires complex surface microstructure design and a high-precision fabrication process [20].
InAs/GaSb T2SL is another periodic low-dimensional quantum structure material with flexible and adjustable energy bands, which can cover the MWIR to the far-infrared band [21]. T2SL is compatible with III-V compound semiconductor fabrication technology and can realize high-performance infrared detection. In the LWIR and very long-wavelength infrared (VLWIR) bands, it has excellent material and device uniformity, and is a promising infrared detection technology. It is also a hotspot in the current infrared imaging research [22,23]. However, its high processing cost and low yield in large format fabrication are still problems that need to be overcome [24].
To achieve thermal imaging, the above three detectors require the integration of photonic focal plane array (FPA) detectors and Si-based readout integrated circuits (ROIC). FPA and ROIC are interconnected using indium bumps in the standard flip-chip packaging process [25]. The difference in the thermal expansion coefficient of the materials (Si/In/detector) is likely to cause pixel failure after the repeated heating and cooling process. To solve this problem, H.C. Liu et.al proposed upconversion pixel-less imaging [26]. The core of this imaging scheme is an upconversion device integrated into series by QWIP and LED using MBE growth technology. The entire LWIR image is transmitted in the detector, then is restored by near-infrared (NIR) light-emitting diodes (LED) and is finally detected by a Si charge-coupled device (CCD) [26]. The greatest advantage of such pixel-less imaging method is that no ROIC is required [27]. Therefore, it solves the thermal mismatch problem of the traditional FPA-ROIC and makes it promising in large format infrared thermal imaging [28]. This technique makes use of an upconverter instead of separate pixel elements in the optical receiving terminal, which simplifies the fabrication process significantly [29]. After more than 10 years of development, pixel-less imaging technology has achieved a temperature resolution below 60 mK [30]. Unfortunately, its response speed is slow. The reason is that the upconversion efficiency of QWIP-LED is low, which leads to a long integration time for CCD (several seconds or tens of seconds) to collect the upconverted NIR photons [31]. However, this problem has not been solved, which prevents the pixel-less imaging from making progress.
In this paper, the finite-different time-domain (FDTD) method has been used to study the light-coupling efficiency (CE) of QWIP and light extraction efficiency of LED in traditional QWIP-LED devices (both 45° edge-coupled device and grating coupled device) theoretically. The reason for the low upconversion efficiency of QWIP-LED devices has been clarified. In particular, we systematically investigate the upconversion performance of QWIP-LED by analyzing the light CE of QWIP port and light extraction efficiency of LED port. We also demonstrate the relation between the frame rate of the pixel-less imaging and upconversion efficiency. Moreover, the optimized design of hybrid-metasurface-coupled QWIP-LED is presented and the performances of optimally designed QWIP-LED are also given and discussed in detail. Owing to the special 45° edge-coupled structure, there is no room for improvement in upconversion efficiency. The CE of grating coupled QWIP-LED could be significantly enhanced due to the tunability of peak-coupling wavelength in metallic two-dimensional gratings.

2. Principle of Pixel-Less Thermal Imaging

The principle of QWIP-LED upconversion pixel-less imaging is shown in Figure 1a. The LWIR image is focused on the upconversion device through the optical system. After passing through the upconversion device, the LWIR image is upconverted into an NIR image, which is then “seen” by the silicon-based CCD. The microscopic mechanism of upconversion is shown in Figure 1b. LWIR is first absorbed in the quantum well region, which excites the excited bound state electrons in the well to continuous state electrons, thereby generating photo-carriers. Driven by an electric field, carriers transport to the LED active area for radiative recombination, then producing NIR radiation. The response spectrum of QWIP and the emission spectrum of LED are shown in Figure 1c. The peak response of the QWIP port in the upconverter is at 9 μm, while the peak emission wavelength of the LED is 870 nm. The inset of Figure 1c shows the upconversion process, where LWIR radiation (9 μm) is upconverted into NIR radiation (870 nm) after passing through an upconverter (QWIP-LED). The detailed epitaxial structure of the device simulated in this paper is shown in Figure 1d [30]. From bottom to top are the 700 nm GaAs n-type contact layer (with Si doped to 1.5 × 1018 cm−3), the 10-period quantum well structure (GaAs[5.4 nm]/AlGaAs[35 nm]), followed by the undoped sandwich structure LED (40 nm AlxGa1−xAs[x varying from 0.24 to 0.1]/30 nm GaAs/40 nm AlxGa1−xAs[x varying from 0.1 to 0.24]), and then the material growth transitions from two AlxGa1−xAs layers (100 nm and 50 nm, x = 0.24 and x vary from 0.24 to 0.1, respectively), the p-type-doped Al0.14Ga0.86As contact layer (1100 nm, with Si doped to 1 × 1019 cm−3), and finally a p-type-doped GaAs contact layer (with Si doped to 2 × 1019 cm−3). All structures simulated and optimized in this paper are based on the above QWIP-LED structure. The dielectric functions of GaAs/AlGaAs are calculated in terms of a classical dielectric function for damped harmonic oscillators in combination with a Drude model [32], and the dielectric functions are shown in Appendix D.

3. 45° Edge-Coupled Upconverter

In this paper, we first study the QWIP CE of devices with different structures. Then, we study the LEE of LEDs and consider the upconversion efficiency of different structures (detailed setting parameters and dielectric functions are shown in Appendix C). QWIP with a 45° edge-coupled structure has always been a benchmark in QWIP detector research, and its CE has been studied in detail in LWIR and terahertz QWIP [32,33]. However, the typical optimized QWIP-LED structure has only ten periods of quantum well (the detailed parameters are shown in Appendix A and Appendix B), which causes the active area structure of QWIP in the upconverter to be much smaller than the single QWIP. How to realize high-optical CE in QWIP-LED should be further systematically studied. As shown in Figure 2a, it is a schematic diagram of a 45° edge-coupled QWIP-LED. According to the definition of quantum efficiency in Ref [32]:
η e m = n α 0 2 d | E 0 | 2 A R | E y | 2 d S
n is the refractive index, d is the length of the detector in the horizontal direction, and α0 is the coefficient of light absorption in the vertical direction. The above parameters can be treated as constants. E0 is the total intensity of the incident electric field that we set ourselves, and Ey is the self-consistent electric component vertical to the growth direction in the region. Thereby we define the CE as [33]:
η c = A R | E y | 2 d S A R | E 0 | 2 d S
Since the thickness of the substrate is much thicker than the wavelength of the incident light, it can be considered that the light propagating downward to the interface will no longer affect the active area. The same is true on the right side, so we set the four boundary conditions as Perfect Match Layer (PML). It should be noted that the AlGaAs top contact layer reserved for the grating in the typical structure is no longer needed in this structure. Therefore, only 404 nm QWIP, 260 nm LED structures and adjusTable 700 nm bottom contact layer are considered in our calculation process. L. Li et al. conducted detailed research on different electrode structures of 45° QWIP devices [33]. If the QWIP-LED device uses solid electrodes, the LED will not emit light. Therefore, we adopt a ring electrode structure in a 45° upconverter.
The y component of electric field distribution is shown in Figure 2b. When the incident light enters the interior of the device, it will be reflected at the GaAs-Air interface and interfere with the incident light, thereby enhancing the electric field inside the device. The electric field distribution in the active area of QWIP-LED for 9 μm incident radiation is shown in the inset of Figure 2c. The maximum value of the interference light is located exactly within the active area. Therefore, it can be considered that for 9 μm incident light, the 45° edge-coupled structure is already the optimal device structure. The CE improvement of the device by optimizing the device size is very limited. If we want to improve the CE, we can only optimize the quantum well structure. But at present, there is no effective way to improve the CE of QWIP through this method. And because it cannot respond to normal incident light, the light receiving surface is very small. Moreover, this edge-coupled structure will also cause distortion of the image. As shown in the schematic diagram in Figure 2a, when a circle is upconverted, due to the incident 45° facet, the image shape will be stretched by a factor of 2 , causing the imaging pattern to be distorted into an ellipse. Therefore, the 45° edge-coupling structure is not suitable as an upconversion pixlless imaging device, and other structures need to be used for optical coupling.

4. Metasurface Enhanced Upconverter

Metasurface is an alternative approach that can be used to manipulate light information at sub-wavelengths, which is a promising method to improve the performance of upconverter [34,35]. Two-dimensional grating is a simple metasurface which has been systematically explored in the early QWIP research and widely used in commercial thermal imaging cameras. Liu et al. naturally applied the two-dimensional diffraction grating structure to QWIP-LED devices for normal incidence response and thermal imaging. The schematic diagram of the two-dimensional grating-coupled device structure is displayed in Figure 3a. A two-dimensional grating is etched on the surface of QWIP-LED. A thin layer of gold is sputtered on the surface to achieve near total reflection of infrared light (the detailed parameters are shown in Appendix A and Appendix B). The two-dimensional grating is then flip-chip bonded onto a sapphire substrate using optical adhesive. Because the refractive index (n) of optical adhesive and sapphire substrate is close (n ≈ 1.5 at 870 nm). The situation of NIR radiation passing through gold and entering the solidified optical adhesive is similar to that of entering air directly (n = 1). Therefore, we made a simplification in the calculation process, that is, the refractive index of the dielectric layer on the gold layer defaults to 1. Although there may be some fluctuations in light extraction efficiency, this does not affect the optimization process and final conclusion of this paper. The substrate at the bottom of the QWIP is removed by mechanical thinning and chemical polishing like the fabrication process of the traditional QWIP focal plane array. Finally, the electrode preparation and packaging of the device are completed. The detailed structural parameters and fabrication processes of the device can be found in Ref [30]. This approach has been proven to be an effective pixel-less imaging method. However, experimental results indicate that this method cannot achieve effective real-time imaging due to the long integration time. We carried out FDTD simulations to study the essential points of this problem. Due to the anisotropy of optical field distribution within the two-dimensional grating structure device, the two-dimensional simulation approximation of the 45° edge-coupled structure fails in this case. Only the three-dimensional simulation of the optical field distribution can reveal the real physical image inside the device. Therefore, in this case, the CE of QWIP is defined as [36]:
η c = A R | E y | 2 d Ω A R | E 0 | 2 d Ω
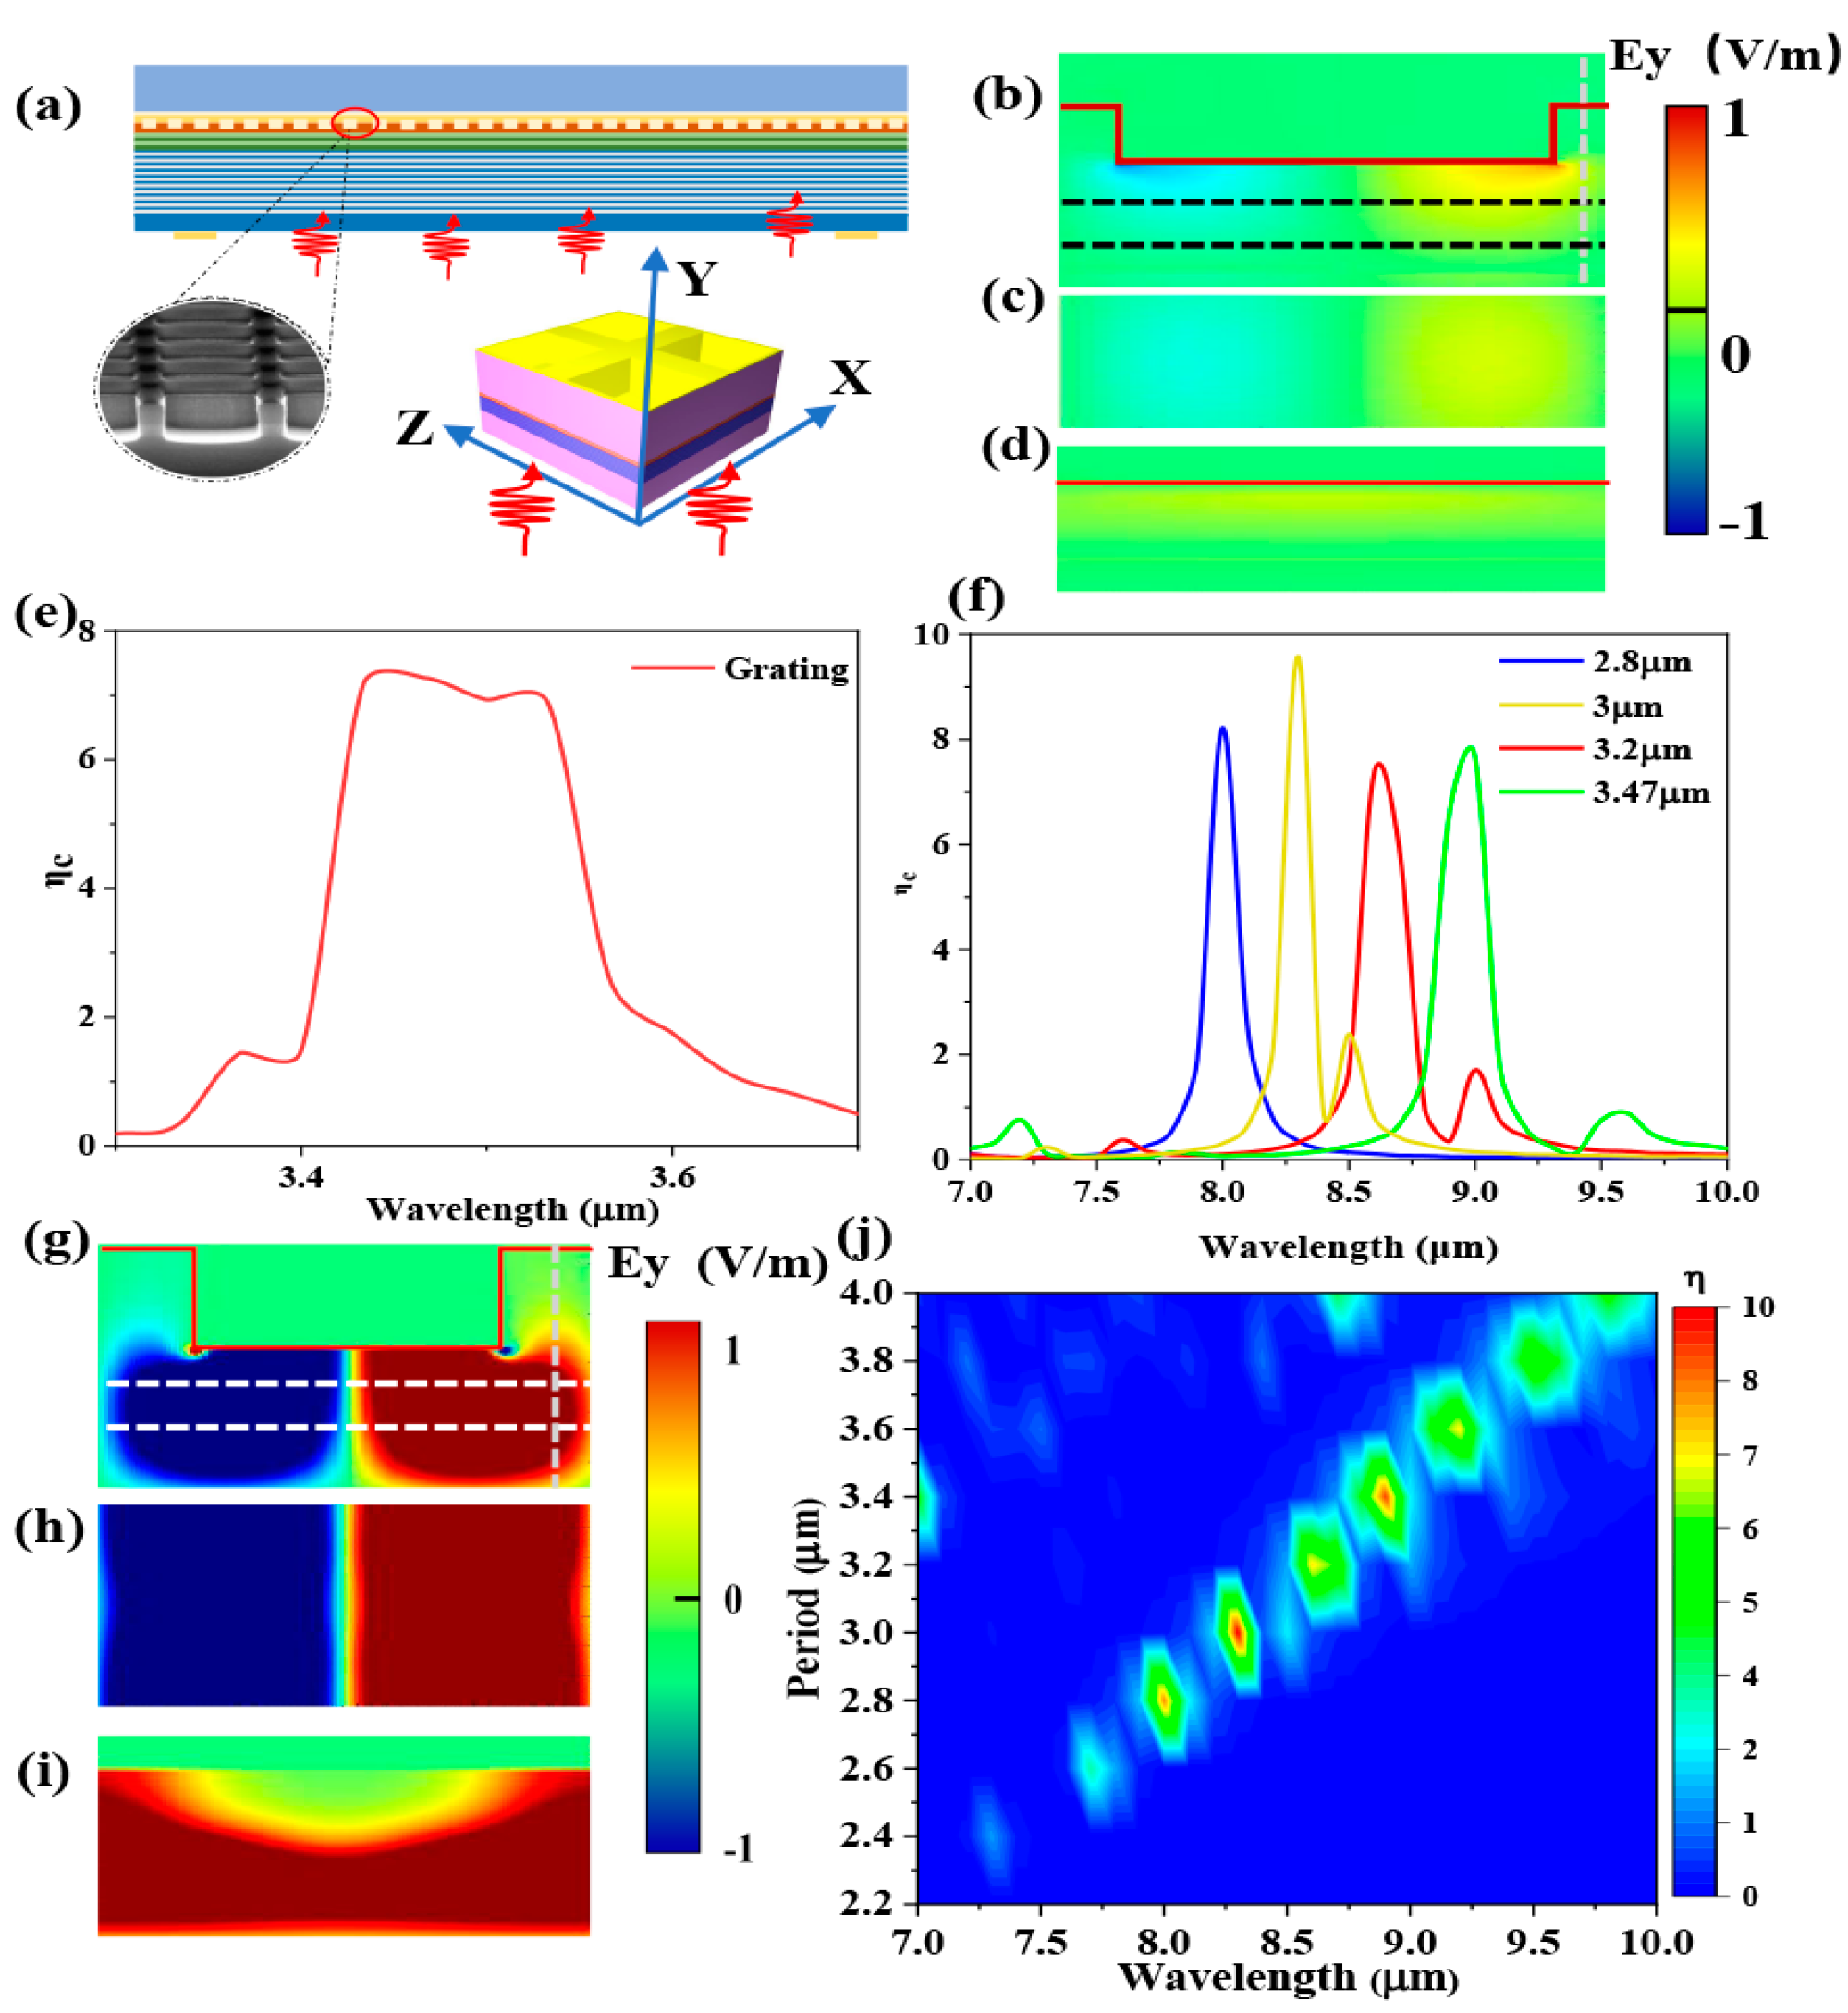
Firstly, we simulated the CE of QWIP-LED device reported by E. M. Dupont in Ref [29]. The results show that for the QWIP with a peak response wavelength of 9 μm, the current two-dimensional grating structure is not the optimal structure. Figure 3b–d shows the optical field distribution inside the device for the period of 2.8 μm with the incident wavelength of 9 μm. We can find that the y component of the electric field in the QWIP active layer region is not strong, which directly leads to lower CE. Since QWIP is a narrow-band detector, the normal incidence response depends on the optical coupling structure. This results in that the CE of the device with specific quantum well parameters is highly sensitive to the geometric structure. Subtle structural differences will lead to huge changes in CE. Furthermore, in order to suppress the number of electroluminescence (EL) hot spots as much as possible for achieving large-area pixel-less imaging, QWIP-LED devices only use 10 period quantum wells. The thickness of the active area is one order of magnitude smaller than traditional thermal imaging devices. This makes the grating parameter determination method of traditional QWIP invalid in QWIP-LED [18]. Therefore, it is necessary to optimize the two-dimensional grating parameters theoretically. As shown in Figure 3e, when the grating period changes from 3.3 μm to 3.7 μm, the CE shows significant enhancement in the range of 3.4–3.55 μm, with the incident wavelength of 9 μm. The green line of Figure 3f shows the CE of the device with a grating period of 3.47 μm, in which a high value of 7.6815 was achieved. The optimized CE is two orders of magnitude higher than that of the unoptimized structure. During the optimization process, we found that as the period changes from 2.8 to 3.47 μm, the peak wavelength of the CE also increases from 8 to 9 μm (Figure 3f). As shown in Figure 3g–i, under the condition of 3.47 μm period, the internal optical field distribution (Ey) of the optimized structure has been significantly enhanced compared to the unoptimized one. We preliminarily attribute this to surface plasmon polariton (SPP) enhancement in the metal–dielectric–air (MDA)-coupling structure. In order to further clarify the mechanism of the enhancement, we extend the simulation range of the period from 2.2 to 4 μm, and an obvious red shift phenomenon is shown in Figure 3j. The variation of the resonance wavelength with the grating period is a typical feature of SPP [37]. The simulation results confirm that metasurface-based SPP can significantly enhance the CE of QWIP over traditional grating structures.
It is worth noting that QWIP-LED is not a pure detector. The LWIR photons absorbed by QWIP need to be further converted into NIR photons by LED. Therefore, we must pay attention to the external quantum efficiency of LEDs. For GaAs-based LEDs optimized for low-temperature operation, the internal quantum efficiency can approach 100% [38]. Light extraction efficiency (LEE) is a key factor in determining the external quantum efficiency of LEDs. The two light emission modes of QWIP-LED mentioned above are the planar light emission mode involving the GaAs/air interface, and the grating light emission mode involving the GaAs/Au/air interface. Here, we carried out the three-dimensional optical simulations with the FDTD method to calculate the LEE for devices with different geometries. The LED devices with planar structure and grating structure are shown in Figure 4a,b, below which are the cross-sectional electric field distribution (|E|) for each geometry.
We found that the LEE of the planar structure is very low, which is caused by the total internal reflection of light at the GaAs/air interface. This is also consistent with the calculation results of Fresnel’s reflection law. Less than 2% of the light can be coupled out of the device, and 98% of the light is trapped inside the device. Unexpectedly, the light field distribution in Figure 4b shows that the LEE of the grating structure is even lower than that of the planar structure. This is because the grating structure is covered by a gold layer on the surface of the etched grating to achieve the normal incident light response of QWIP. The Au film greatly weakens the LEE of LED. This result reminds us that the optimal structure for QWIP is likely to significantly suppress the LEE of the LED. To achieve efficient upconversion, we must trade off the optical CE of the QWIP against the LEE of the LED. It has been proved that the microlens-based metasurface could enhance the LEE of the LED efficiently [39,40]. Previous studies have shown that surface microlenses with a radius of one micron can effectively enhance the light extraction efficiency of GaAs LEDs [41]. In order to simultaneously achieve the enhancement of QWIP optical CE and LED’s LEE, we propose a hybrid metasurface based on gratings and microlenses. For LEDs, microlenses can significantly suppress total internal reflection, thereby enhancing LEE. As shown in Figure 4c, although the surface of the microlens is covered with an Au film, there is still a lot of light coupled out. The LEE of hybrid metasurface LEDs is significantly higher than that of planar structures and grating metasurfaces (as shown in Figure 4d)
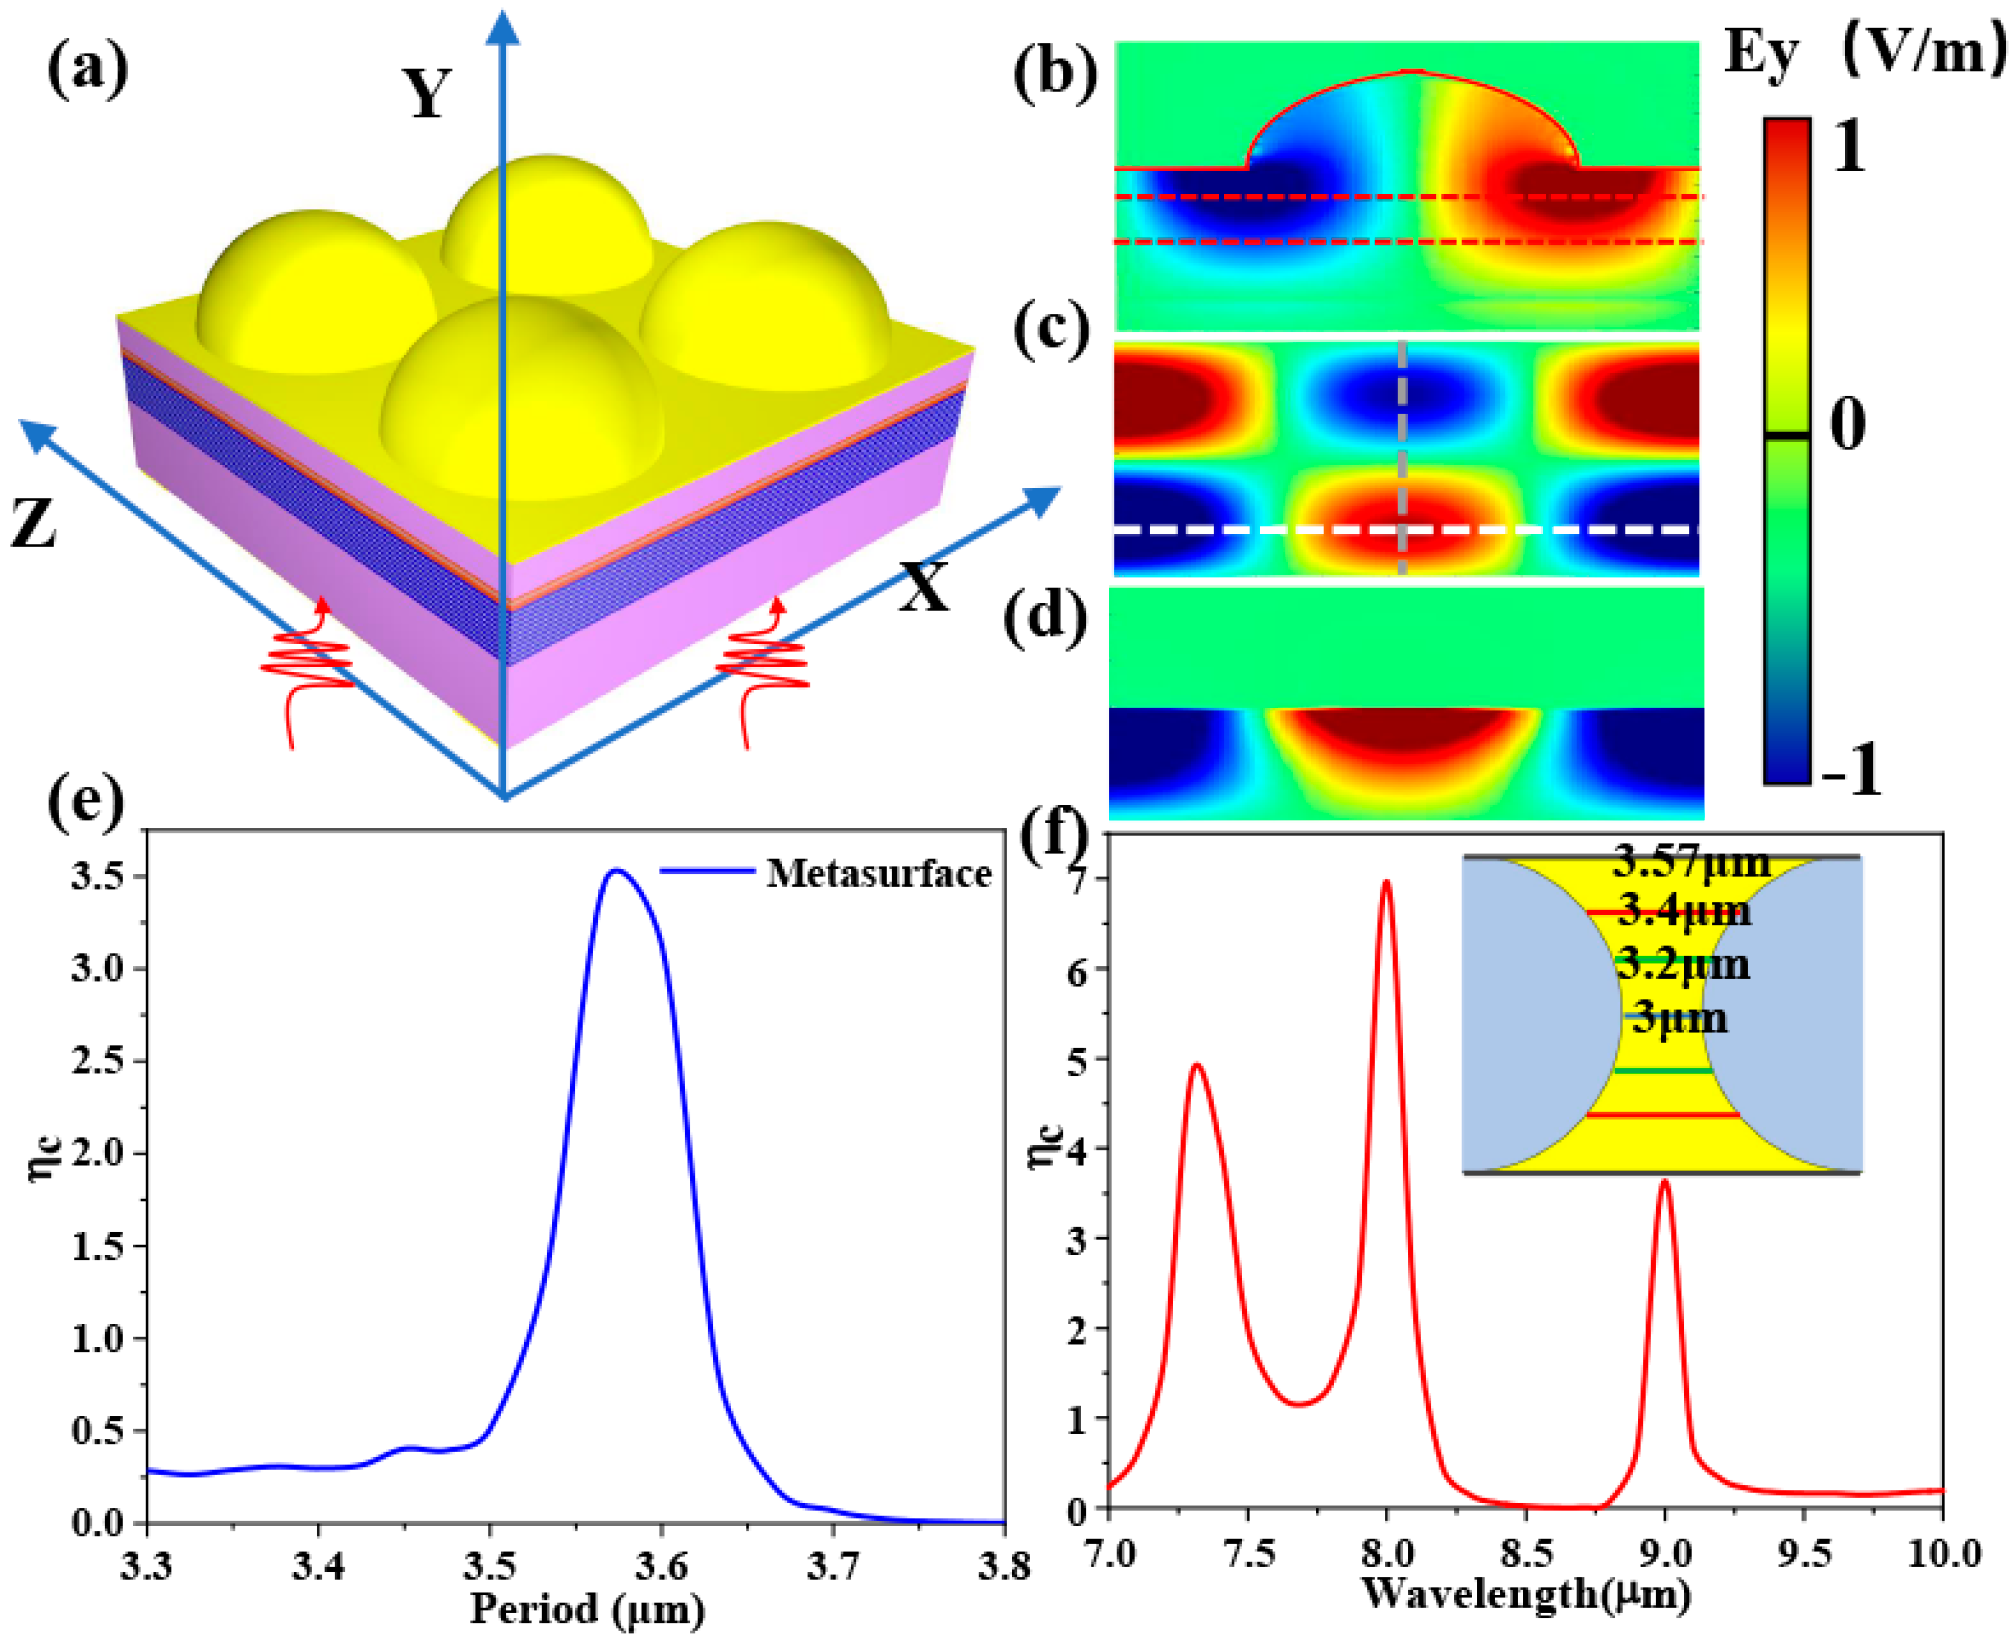
We also simulated the QWIP CE of the hybrid metasurface structure (detailed parameters are shown in Appendix A and Appendix B). The device structure is shown in Figure 5a. The simulated cross-sectional light field distribution of gold-coated microlens (radius = 1 μm) with a period of 3.47 μm is shown in Figure 5b–d. We can find that the SPP mode of the internal grating on the hybrid metasurface still exists. QWIP still has a relatively high optical CE.
When the incident light wavelength is fixed at 9 μm, by scanning the period of the hybrid metasurface, we can obtain the period parameters that determine the optimal CE of the device (as shown in Figure 5e). However, when we performed a wavelength scan for this optimal period parameter, we found that three peaks appeared in the CE curve. This is due to the geometric structure of the spherical microlens and the surface plasmon inside the grating. For a certain periodic structure, the sphere at the periodic center does not directly contribute to the QWIP CE. QWIP CE is mainly controlled by the planar structure in the hybrid metasurface. Due to the existence of the spherical microlens structure, the size of the planar structure changes from the constant of the grating to a changing value (as shown in the inset of Figure 5f). The resonance wavelength of SPP changes numerically with this period, resulting in multiple peaks.

5. Discussion

The most obvious advantage of pixel-less imaging is that the readout circuit is no longer needed, and the electrical readout of the traditional focal plane array is changed to the optical readout of the CCD. This solution overcomes the thermal mismatch problem of the traditional QWIP focal plane and it has great superiority in large-format imaging devices.
Previous experimental results show that the imaging speed of pixel-less imaging devices’ upconversion is slow. The integration time is on the order of 10 s, making it impossible for real-time imaging. In this paper, we simulate QWIP-LEDs with different structures in detail. The QWIP optical CE, LED light extraction efficiency, relative upconversion efficiency coefficient and corresponding integration time of different structures are shown in Table 1. We performed theoretical simulations on the 45° edge-coupling structure and the two-dimensional grating structure, revealing that a low upconversion efficiency is the main reason for the slow imaging speed. Due to the special incident angle and small light-receiving surface, it cannot be used for imaging.
On this basis, we optimized the parameters of the two-dimensional grating structure. After optimizing the design, we can obtain the optimal QWIP-LED structural parameters of the grating structure, in which the CE of QWIP can be improved by two orders of magnitude. Unfortunately, since the grating surface is covered by a gold film, the LEE of LED is even one order of magnitude lower than that of the planar structures. The above simulation results show that in order to make the upconversion efficiency meet the requirements of real-time imaging, the CE of QWIP and the LEE of LED must be optimized at the same time. Therefore, we proposed and optimized the hybrid metasurface structure, which greatly improved its CE and LEE at the same time. Although the light CE of QWIP is only half that of the optimized grating structure, the LEE of LED is increased by nearly 26 times. In order to intuitively show the difference of the performance between the different upconverters, we defined upconversion efficiency as CE (ηc) multiplied by light extraction efficiency (LEE870nm). The upconversion efficiency of the optimized two-dimensional grating is one order of magnitude higher than that of the optimized grating structure. The upconversion efficiency of the hybrid metasurface structure is one order of magnitude higher than that of the optimized grating structure. Here we used the integration time of the experiment results in a traditional grating-coupled upconverter as a reference. We calculated the theoretical integration time of other structures. It can be found that although the 45° structure can greatly reduce the integration time, it still cannot meet the frame rate (>24 Hz) requirements of real-time imaging. The optimized grating structure benefits from the high QWIP CE and can perform near real-time imaging, but the frame rate is still less than 50 Hz. The corresponding upconversion efficiency of the hybrid metasurface also far exceeds real-time imaging requirements. Theoretically, the integration time of the device can be shortened to 3.3 ms (corresponding to a maximum frame rate of 300 Hz). This result proves that it is entirely possible to use QWIP-LED for high-speed upconversion pixel-less imaging. This work provides solid theoretical guidance for the realization of high-speed upconversion pixel-less imaging.

6. Conclusions

In conclusion, we have reported a systematic theoretical investigation on the QWIP-LED devices towards high-speed upconversion pixel-less thermal imaging. By simulating the optical CE of QWIP and the LEE of the LED in QWIP-LED devices with different structures, the reason for the long integration time of the traditional grating-coupled QWIP-LED has been clarified. Meanwhile, the upconversion efficiency of the 45° edge-coupled structure has been studied, and the imaging performance also has been discussed. Accordingly, based on previous grating-coupled studies, we also gave the optimized structure parameters for the QWIP-LED with a detection peak wavelength of 9 μm. Simulated results indicate that a grating period of 3.47 μm is expected to achieve a high optical CE of 7.6815. Furthermore, taking account of the LEE of the LED, we proposed a hybrid metasurface structured upconverter. The LEE of the LED has been improved and the overall high upconversion efficiency can also achieve a frame rate as high as 300 Hz.

Author Contributions

Conceptualization, P.B., W.C., Z.Z. and J.Z.; methodology, Y.W. (Yi Wang), P.B., N.Y. and H.W.; software, Z.Z., S.H. and Y.W. (Yi Wang); validation, P.B., W.C. and Z.Z.; formal analysis, M.C., Y.W. (Yingxin Wang), J.L. and Y.W. (Yi Wang); investigation, J.C., Y.X. and Y.W. (Yi Wang); writing—original draft preparation, Y.W. (Yi Wang); writing—review and editing, Y.W. (Yi Wang), P.B. and J.L.; visualization, Y.W. (Yi Wang); supervision, P.B.; project administration, W.C.; funding acquisition, N.Y. All authors have read and agreed to the published version of the manuscript.

Funding

This research was funded by Natural Science Foundation of China (12104061) Project funded by China Postdoctoral Science Foundation (2020M680458), Open Project funded by Key Laboratory of Artificial Structures and Quantum Control (2020-03).

Institutional Review Board Statement

Not applicable.

Informed Consent Statement

Not applicable.

Data Availability Statement

The data presented in this study are available on request from the corresponding authors.

Conflicts of Interest

The authors declare no conflict of interest.

Appendix A

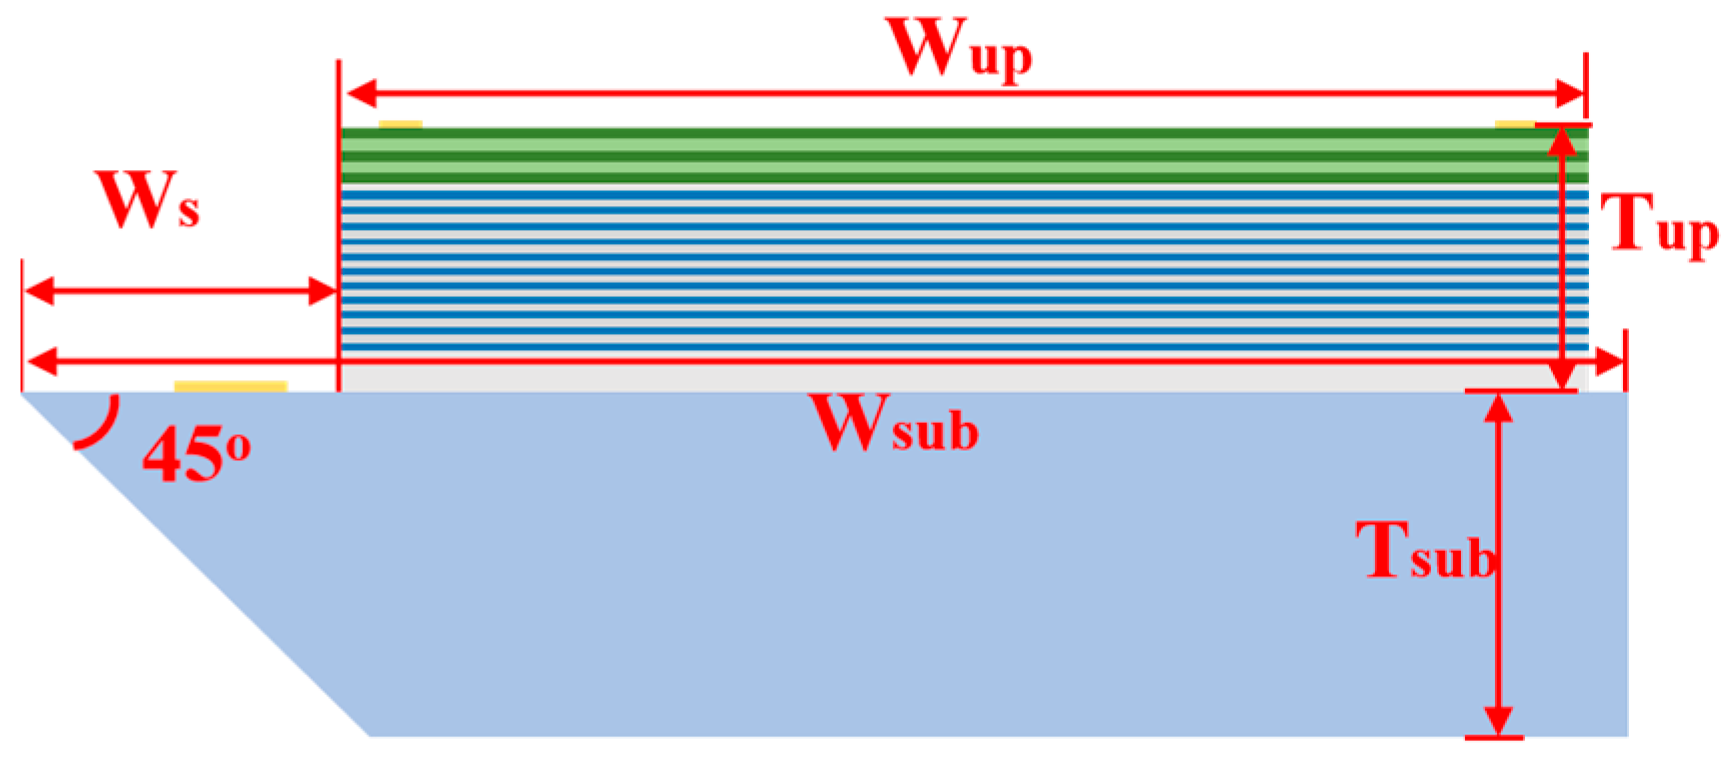
The structural parameters of the 45° edge-coupled upconverter:
Figure A1. Schematic of the 45° edge-coupled upconverter with structural parameters indicated.
Photonics 10 01301 g0a1
Table A1. Structural parameters of 45° edge-coupled upconverter.
ValueUnit
Wup36μm
Wsub40μm
Ws3μm
Tup1364nm
Tsub38μm
where Wup is the width of the upconversion area (width of QWIP and LED), Wsub is the width of the substrate, Tup is the thickness of upconversion area and bottom contact layer, Tsub is the thickness of substrate, Ws is the size of that substrate over the upconversion area. That figure is only a schematic diagram not the actual size ratio. The total thickness of upconversion area is 1364 nm.
The structural parameters of the unoptimized 2D grating upconverter are as follows:
Figure A2. Schematic of the 2D grating coupled upconverter with structural parameters indicated.
Photonics 10 01301 g0a2
Table A2. Structural parameters of unoptimized 2D grating upconverter.
ValueUnit
Wetch2080nm
W720nm
Hetch1000nm
Htotal2479nm
TAu30nm
P2800nm
where P is the period of this structure, Wetch is the width of etched grating, W is width of unetched area, Detch is the depth of etched grating, Htotal is the total height except the Au layer, TAu is the thickness of Au layer.
Detailed parameters of the hybrid metasurface structure are presented as follows:
Figure A3. Schematic of the hybrid metasurface upconverter with structural parameters indicated.
Photonics 10 01301 g0a3
Table A3. Structural parameters of hybrid metasurface upconverter.
ValueUnit
Pmeta3.57μm
Rsphere1μm
Htop1.165μm
Htotal1.479μm
where Pmeta is the period of metasurface structure, Rsphere is the radius of the sphere, Htop is the top contact that not be etched, and Htotal is the height of the device except the sphere and Au layer.
The radius of 1 μm microlens structure is shaped by the etched top contact layer, which means the total height (Htotal = 1.479 μm) is 1 μm less than the two-dimensional grating structure.

Appendix B

Detailed material thickness and material composition of 45° edge-coupled structure devices are as follows:
Table A4. Detailed material thickness and material composition of the devices (from top to bottom).
MaterialCompositionThickness (nm)Dopant Concentration (cm−3)Name of Layer
AlxGa1−xAsx varying
from 0.24 to 0.14
50Be1 × 1019LED
AlxGa1−xAsx = 0.24100Befrom 3 × 10¹⁸
to 1 × 10¹⁹
AlxGa1−xAsx varying
from 0.1 to 0.24
40
GaAs 30
AlxGa1−xAsx varying
from 0.24 to 0.1
40
GaAs 5.4Si5 × 101110-period QWIP
AlxGa1−xAsx = 0.2435
GaAs 700Si1.5 × 1018Bottom contact
GaAs 380,000 Substrate
Detailed material thickness and material composition of the unoptimized two-dimensional grating coupled structure devices are as follows:
Table A5. Detailed material thickness and material composition of the unoptimized 2D grating coupled devices.
MaterialCompositionThickness (nm)Dopant Concentration (cm−3)Name of Layer
Au 30 Metal contact
GaAs 15Be2 × 1019Top contact
AlxGa1−xAsx = 0.141100Be1 × 1019LED
AlxGa1−xAsx varying
from 0.24 to 0.14
50Be1 × 1019
AlxGa1−xAsx = 0.24100Befrom 3 × 10¹⁸
to 1 × 10¹⁹
AlxGa1−xAsx varying
from 0.1 to 0.24
40
GaAs 30
AlxGa1−xAsx varying
from 0.24 to 0.1
40
GaAs 5.4Si5 × 101110-period QWIP
AlxGa1−xAsx = 0.2435
GaAs 700Si1.5 × 1018Bottom contact

Appendix C

The simulation parameters and dielectric functions are shown in the following:
Table A6. Simulation parameters of this manuscript.
Simulation Setting45°2D GratingMetasurface
Dimensions2D simulation3D simulation3D simulation
Boundary conditions (x)PMLPeriodicPeriodic
Boundary conditions (y)PMLPMLPML
Boundary conditions (z) PeriodicPeriodic
Simulation of LED3D simulation3D simulation3D simulation
Type of incident lightPlane wavePlane wavePlane wave
Wavelength of incident9 μm9 μm9 μm
Emitting wavelength870 nm870 nm870 nm
Type of LEDDipoleDipoleDipole
Perfect matched layer (PML) means the light hit this boundary will not be reflected back.

Appendix D

Dielectric functions ε(ω) of GaAs are as follows [42]:
ε ( ω ) = ε [ 1 ω p 2 ω ( ω + i δ P ) ] + ω TO 2 ( ε s ε ) ω TO 2 ω 2 i ω δ TO
the first term in the right describes the free carrier absorption. ωp = N d q 2 / ε 0 ε s m e * is the plasma frequency. The second term is the Reststrahlen term, which describes the interaction with optical phonons. wTO is the transverse optical (TO) phonon frequency. es = 12.85, e = 10.88, ωTO = 2p × 8.02 THz, δTO = 2p × 0.06 THz.
Dielectric functions ε(ω) of metal are as follows [42]:
ε M ( ω ) = 1 [ ω M 2 ω ( ω + i δ M ) ]
ωM = 1.11 × 10⁴ THz and δM = 83.3 ps−1.
Dielectric functions ε(ω) of AlGaAs are as follows [43]:
ε ( ω ) = ε + j = 2 2 S j ω toj 2 ω toj 2 ω 2 i ω Γ j ω ω p 2 ε ω ( ω i γ )
is used for each layer where j = 1 refers to GaAs and j = 2 refers to AlAs. The ternary, AlxGal1−xAs, requires the summation since it exhibits mixed mode behaviour. In Equation (A3), ω toj is the transverse optic phonon frequency, Γ j the lattice damping constant, and Sj is the j th oscillator strength. For the electronic contribution, ω p is the plasma frequency and γ the electron damping constant. The high frequency dielectric constant is ε which is assumed to vary linearly with alloy composition. From the lattice contribution, the longitudinal optic phonon frequency, ω toj .

References

  1. Mizaikoff, B. Mid-IR fiber-optic sensors. Anal. Chem. 2003, 75, 258A–267A. [Google Scholar] [CrossRef]
  2. Gunapala, S.D.; Bandara, S.V.; Liu, J.K.; Luong, E.M.; Stetson, N.; Shott, C.A.; Bock, J.J.; Rafol, S.B.; McKelvey, M.J. Long-wavelength 256/spl times/256 GaAs/AlGaAs quantum well infrared photodetector (QWIP) palm-size camera. IEEE Trans. Electron Devices 2000, 47, 326–332. [Google Scholar] [CrossRef]
  3. Yuffa, A.J.; Gurton, K.P.; Videen, G. Three-dimensional facial recognition using passive long-wavelength infrared polarimetric imaging. Appl. Opt. 2014, 53, 8514–8521. [Google Scholar] [CrossRef] [PubMed]
  4. Gunapala, S.D.; Bandara, S.V.; Bock, J.J.; Ressler, M.E.; Liu, J.K.; Mumolo, J.M.; Rafol, S.B.; David, Z.T.; Werner, M.W. Large-format long-wavelength GaAs/AlGaAs multiquantum well infrared detector arrays for astronomy. Photodetect. Mater. Devices 2001, 4288, 278–285. [Google Scholar]
  5. Netinant, P.; Vasprasert, P.; Rukhiran, M. Evaluations of effective on LWIR micro thermal camera IoT and digital thermometer for human body temperatures. In Proceedings of the 5th International Conference on E-Commerce, E-Business and E-Government, Rome, Italy, 28–30 April 2021. [Google Scholar]
  6. Slussarenko, S.; Pryde, G.J. Photonic quantum information processing: A concise review. Appl. Phys. Rev. 2019, 6, 041303. [Google Scholar] [CrossRef]
  7. Reine, M.B. HgCdTe photodiodes for IR detection: A review. Photodetectors Mater. Devices VI 2001, 4288, 266–277. [Google Scholar]
  8. Klipstein, P.C.; Avnon, E.; Azulai, D.; Benny, Y.; Fraenkel, R.; Glozman, A.; Hoiman, E.; Klin, O.; Krasovitsky, L.; Langof, L.; et al. Type II superlattice technology for LWIR detectors. Infrared Technol. Appl. XLII 2016, 9819, 216–225. [Google Scholar]
  9. Arslan, Y.; Çolakoglu, T.; Torunoglu, G.; Aktas, O.; Besikci, C. Enhanced performance QWIP FPAs. Infrared Phys. Technol. 2013, 59, 108–111. [Google Scholar] [CrossRef]
  10. Bois, P.; Guériaux, V.; de l’Isle, N.B.; Manissadjian, A.; Facoetti, H.; Marcadet, X.; Costard, E.; Nedelcu, A. QWIP status and future trends at Thales. Quantum Sens. Nanophotonic Devices IX 2012, 8268, 566–576. [Google Scholar]
  11. Nielsen, M.P.; Pusch, A.; Sazzad, M.H.; Pearce, P.M.; Reece, P.J.; Ekins-Daukes, N.J. Thermoradiative power conversion from HgCdTe photodiodes and their current–voltage characteristics. ACS Photonics 2022, 9, 1535–1540. [Google Scholar] [CrossRef]
  12. Li, Q.; Xie, R.; Wang, F.; Liu, S.; Zhang, K.; Zhang, T.; Gu, Y.; Guo, J.; He, T.; Wang, Y.; et al. SRH suppressed PGI design for very long-wavelength infrared HgCdTe photodiodes. Opt. Express 2022, 30, 16509–16517. [Google Scholar] [CrossRef] [PubMed]
  13. Rogalski, A.; Martyniuk, P.; Kopytko, M. Type-II superlattice photodetectors versus HgCdTe photodiodes. Prog. Quantum Electron. 2019, 68, 100228. [Google Scholar] [CrossRef]
  14. Rogalski, A. Toward third generation HgCdTe infrared detectors. J. Alloys Compd. 2004, 371, 53–57. [Google Scholar] [CrossRef]
  15. Smith, J.S.; Chiu, L.C.; Margalit, S.; Yariv, A.; Cho, A.Y. A new infrared detector using electron emission from multiple quantum wells. J. Vac. Sci. Technol. B Microelectron Process. Phenom. 1983, 1, 376–378. [Google Scholar] [CrossRef]
  16. Goldberg, A.; Choi, K.K.; Cho, E.; McQuiston, B. Laboratory and field performance of megapixel QWIP focal plane arrays. Infrared Phys. Technol. 2005, 47, 91–105. [Google Scholar] [CrossRef]
  17. Bahrehmand, M.; Gacemi, D.; Vasanelli, A.; Li, L.; Davies, A.G.; Linfield, E.; Sirtori, C.; Todorov, Y. Auto-Calibrated Charge-Sensitive Infrared Phototransistor at 9.3 µm. Sensors 2023, 23, 3635. [Google Scholar] [CrossRef]
  18. Schneider, H.; Liu, H.C. Quantum Well Infrared Photodetectors, 3rd ed.; Springer Nature: Berlin, Germany, 2007; pp. 13–41. [Google Scholar]
  19. Liu, H.C.; Dudek, R.; Shen, A.; Dupont, E.; Song, C.Y.; Wasilewski, Z.R.; Buchanan, M. High absorption (>90%) quantum-well infrared photodetectors. Appl. Phys. Lett. 2001, 79, 4237–4239. [Google Scholar] [CrossRef]
  20. Palaferri, D.; Todorov, Y.; Bigioli, A.; Mottaghizadeh, A.; Gacemi, D.; Calabrese, A.; Vasanelli, A.; Li, L.; Davies, A.G.; Linfield, E.H.; et al. Room-temperature nine-µm-wavelength photodetectors and GHz-frequency heterodyne receivers. Nature 2018, 556, 85–88. [Google Scholar] [CrossRef]
  21. Olson, B.V.; Murray, L.M.; Prineas, J.P.; Flatté, M.E.; Olesberg, J.T.; Boggess, T.F. All-optical measurement of vertical charge carrier transport in mid-wave infrared InAs/GaSb type-II superlattices. Appl. Phys. Lett. 2013, 102, 202101. [Google Scholar] [CrossRef]
  22. Jiang, D.; Xiang, W.; Guo, F.; Hao, H.; Han, X.; Li, X.C.; Wang, G.; Xu, Y.; Yu, Q.; Niu, Z. Very high quantum efficiency in InAs/GaSb superlattice for very long wavelength detection with cutoff of 21 μm. Appl. Phys. Lett. 2016, 108, 121110. [Google Scholar] [CrossRef]
  23. Wang, L.; Xu, Z.; Xu, J.; Dong, F.; Wang, F.; Bai, Z.; Zhou, Y.; Xuliang, C.; Li, H.; Ding, R.; et al. Fabrication and characterization of InAs/GaSb type-II superlattice long-wavelength infrared detectors aiming high temperature sensitivity. J. Light. Technol. 2020, 38, 6129–6134. [Google Scholar] [CrossRef]
  24. Huang, Y.; Ryou, J.-H.; Dupuis, R.; D’Costa, V.; Steenbergen, E.; Fan, J.; Zhang, Y.-H.; Petschke, A.; Mandl, M.; Chuang, S.-L. Epitaxial growth and characterization of InAs/GaSb and InAs/InAsSb type-II superlattices on GaSb substrates by metalorganic chemical vapor deposition for long wavelength infrared photodetectors. J. Cryst. Growth 2011, 314, 92–96. [Google Scholar] [CrossRef]
  25. Jiang, J.; Tsao, S.; O’Sullivan, T.; Razeghi, M.; Brown, G.J. Fabrication of indium bumps for hybrid infrared focal plane array applications. Infrared Phys. Technol. 2004, 45, 143–151. [Google Scholar] [CrossRef]
  26. Luo, H.; Ban, D.; Liu, H.C.; Poole, P.J.; Buchanan, M. Pixel-less imaging device using optical up-converter. IEEE Electron Device Lett. 2004, 25, 129–131. [Google Scholar] [CrossRef]
  27. Liu, H.C.; Li, J.; Wasilewski, Z.R.; Buchanan, M. Integrated quantum well intersub-band photodetector and light emitting diode. Electron. Lett. 1995, 31, 832–833. [Google Scholar] [CrossRef]
  28. Liu, H.C.; Dupont, E.; Byloos, M.; Buchanan, M.; Song, C.Y.; Wasilewski, Z.R. QWIP-LED pixel-less thermal imaging device. Int. J. High Speed Electron. Syst. 2002, 12, 891–905. [Google Scholar] [CrossRef]
  29. Dupont, E.; Byloos, M.; Gao, M.; Buchanan, M.; Song, C.Y.; Wasilewski, Z.R.; Liu, H.C. Pixel-less thermal imaging with integrated quantum-well infrared photodetector and light-emitting diode. IEEE Photonics Technol. Lett. 2002, 14, 182–184. [Google Scholar] [CrossRef]
  30. Dupont, E.; Byloos, M.; Oogarah, T.; Buchanan, M.; Liu, H.C. Optimization of quantum-well infrared detectors integrated with light-emitting diodes. Infrared Phys. Technol. 2005, 47, 132–143. [Google Scholar] [CrossRef]
  31. Magnan, P. Detection of visible photons in CCD and CMOS: A comparative view. Nucl. Instrum. Methods Phys. Res. Sect. A Accel. Spectrometers Detect. Assoc. Equip. 2003, 504, 199–212. [Google Scholar] [CrossRef]
  32. Choi, K.K. Electromagnetic modeling of edge-coupled quantum well infrared photodetectors. J. Appl. Phys. 2012, 111, 124507. [Google Scholar] [CrossRef]
  33. Li, L.; Bai, P.; Zhang, Y.; Shen, W.; Cao, J. Optical field simulation of edge-coupled terahertz quantum well photodetectors. AIP Adv. 2018, 8, 035214. [Google Scholar] [CrossRef]
  34. Chen, L.; Ma, Q.; Luo, S.; Ye, F.; Cui, H.; Cui, T. Touch Programmable Metasurface for Various Electromagnetic Manipulations and Encryptions. Small 2022, 18, e2203871. [Google Scholar] [CrossRef]
  35. Huang, Y.; Xiao, T.; Chen, S.; Xie, Z.; Zheng, J.; Zhu, J.; Su, Y.; Chen, W.; Liu, K.; Tang, M.; et al. All-optical controlled-NOT logic gate achieving directional asymmetric transmission based on metasurface doublet. Opto-Electron. Adv. 2023, 6, 220073. [Google Scholar] [CrossRef]
  36. Lian, X.R.; Wang, K.; Bai, X.Q.; Bai, P.; Li, X.H.; Huang, S.H.; Song, W.J.; Shen, W.Z.; Xu, G.Y.; Zhang, Y.H. E-shaped patch antenna for GaAs-based broadband THz detectors. J. Phys. D Appl. Phys. 2022, 55, 475101. [Google Scholar] [CrossRef]
  37. Dang, T.H.; Cavallo, M.; Khalili, A.; Dabard, C.; Bossavit, E.; Zhang, H.; Ledos, N.; Prado, Y.; Lafosse, X.; Abadie, C.; et al. Multiresonant Grating to Replace Transparent Conductive Oxide Electrode for Bias Selected Filtering of Infrared Photoresponse. Nano Lett. 2023, 18, 8539–8546. [Google Scholar] [CrossRef] [PubMed]
  38. Ban, D.; Luo, H.; Liu, H.C.; Wasilewski, Z.R.; SpringThorpe, A.J.; Glew, R.; Buchanan, M. Optimized GaAs/AlGaAs light-emitting diodes and high efficiency wafer-fused optical up-conversion devices. J. Appl. Phys. 2004, 9, 5243–5248. [Google Scholar] [CrossRef]
  39. Lee, H.W.; Lin, B.S. Improvement of illumination uniformity for LED flat panel light by using micro-secondary lens array. Opt. Express 2012, 20, A788–A798. [Google Scholar] [PubMed]
  40. Eun-Hyun, P. Microlens for efficient coupling between LED and Optical Fiber. IEEE Photonics Technol. Lett. 1999, 11, 439–441. [Google Scholar] [CrossRef]
  41. Bai, P.; Zhang, Y.; Shen, W.; Yang, N.; Chu, W. Optimization of the Cryogenic Light-Emitting Diodes for High-Performance Broadband Terahertz Upconversion Imaging. Front. Phys. 2021, 9, 774524. [Google Scholar] [CrossRef]
  42. Zhang, R.; Guo, X.G.; Cao, J.C.; Liu, H.C. Near field and cavity effects on coupling efficiency of one-dimensional metal grating for terahertz quantum well photodetectors. J. Appl. Phys. 2011, 109, 073110. [Google Scholar] [CrossRef]
  43. Durschlag, M.S.; De Temple, T.A. Infrared optical characterization of GaAs/AlxGa1−xAs submicron heterostructures. Solid State Commun. 1981, 40, 307–310. [Google Scholar] [CrossRef]
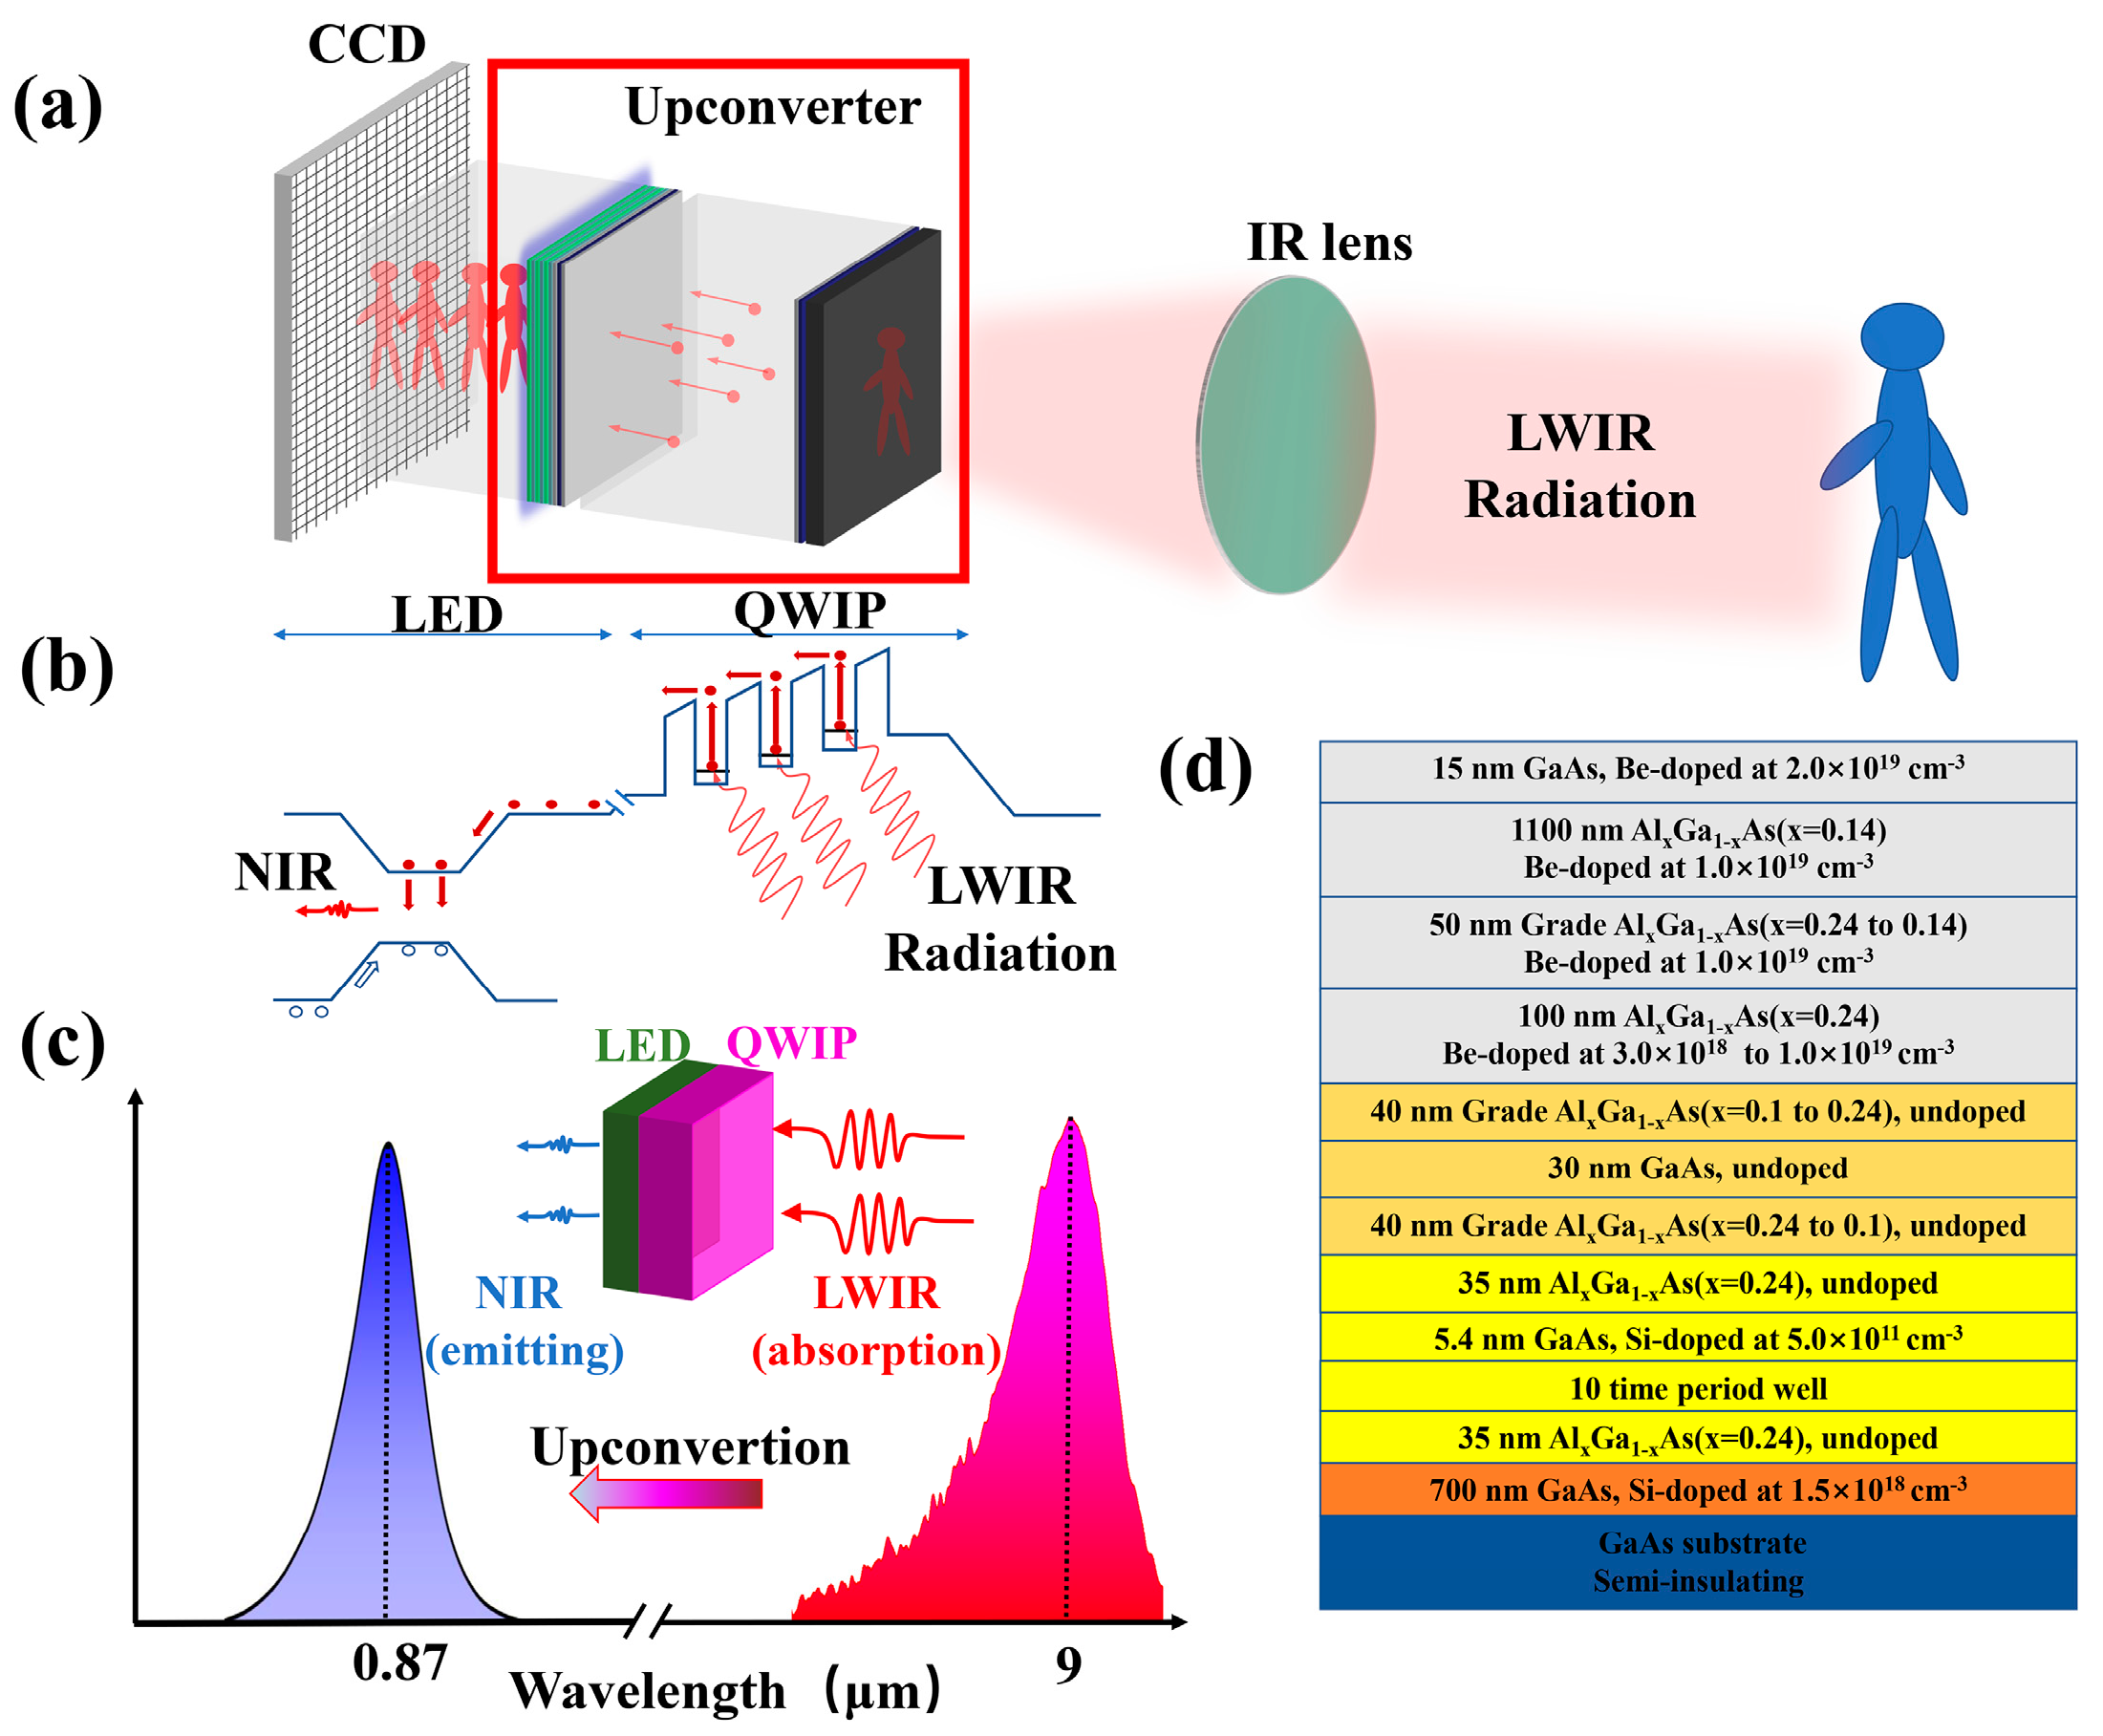
Figure 1. (a) Schematic of upconversion pixel-less imaging (the key device of the imaging technology is the upconverter framed by the red square). (b) Micro-mechanism of the process inside QWIP-LED device: LWIR photon excites the electron in the QW area. The photo-excited carriers are injected into the LED portion for recombination and emitting NIR photons. (c) The Response spectrum of QWIP and the emission spectrum of LED at 77 K. The inset shows the upconversion process, where LWIR radiation (9 μm) is upconverted to NIR radiation (870 nm) after passing through an upconverter (QWIP-LED). (d) The detailed structural parameters of upconvertor.
Photonics 10 01301 g001
Figure 2. (a) Schematic of distortion image induced by 45° edge-coupled upconverter and optical path inside the device. (b) Schematic diagram of the y component of electric field distribution (Ey) inside the 45°device. (c) The CE of 45° edge-coupled device. The inset shows the electric field distribution Ey in the active area.
Photonics 10 01301 g002
Figure 3. (a) Schematic of 2D grating upconverter and scanning electron microscope picture of grating (the incident light is indicated by the red waving arrow). (b) Cross section of Ey at x–y plane of active area for the period of 2.8 μm with incident light of 9 μm (The area between the black dotted lines is the QWIP area). (c) Ey at x–z plane for the period of 2.8 μm with incident light of 9 μm. (d) Ey at y–z plane for the period of 2.8 μm with incident light of 9 μm (The position indicated by the gray dotted line in Figure 3b). (e) CE of grating structure for period varying from 3.3 μm to 3.7 μm with 9 μm incident light. (f) CE of grating structure for different periods with incident light wavelength varying from 7 μm to 10 μm. (g) Cross section of Ey at x–y plane of active area for the period of 3.47 μm. (h) Ey at x–z plane for the period of 3.47 μm. (i) Ey at y–z plane for the period of 3.47 μm. (j) CE of grating structure of period varying from 2.2 μm to 4 μm, while incident light wavelength varies from 7 μm to 10 μm.
Photonics 10 01301 g003
Figure 4. (a) Schematic of planar structure LED and simulated electric field distribution. (b) Schematic of 2D grating structure LED and simulated electric field distribution. (c) Schematic of hybrid metasurface structure LED and simulated electric field distribution. (d) LEE of a different structure for wavelength change from 810 nm to 900 nm.
Photonics 10 01301 g004
Figure 5. (a) Schematic of hybrid metasurface upconverter with incident light indicated by the red waving arrows. (b) Ey distribution at x–z plane (The position indicated by the gray dotted line in Figure 5c). (c) Ey distribution at the x–y plane. (d) Ey distribution at y–z plane (The position indicated by the white dotted line in Figure 5c). (e) CE of hybrid metasurface structure with period change from 3.3 μm to 3.8 μm. (f) CE of hybrid metasurface structure with incident light wavelength change from 7 μm to 10 μm for the period of 3.57 μm. The inset shows the top view of a single period.
Photonics 10 01301 g005
Table 1. Key performance of different structure.
Device45°2D GratingOptimized
2D Grating
Hybrid
Metasurface
ηc0.20690.04867.68153.6356
LEE870nm (%)1.36730.17270.15694.4120
ηup0.28290.00841.205216.0403
Integration time (s)0.178260.04180.0032
Disclaimer/Publisher’s Note: The statements, opinions and data contained in all publications are solely those of the individual author(s) and contributor(s) and not of MDPI and/or the editor(s). MDPI and/or the editor(s) disclaim responsibility for any injury to people or property resulting from any ideas, methods, instructions or products referred to in the content.