Article

Exploration of Illicit Drug Detection Based on Goos–Hänchen Shift

1
School of Physics and Electronic Information, Weifang University, Weifang 261061, China
2
Research and Development Centre, Shandong North Optical Electronics Co., Ltd., Taian 271000, China
*
Authors to whom correspondence should be addressed.
Photonics 2023, 10(11), 1270; https://doi.org/10.3390/photonics10111270
Submission received: 5 October 2023 / Revised: 9 November 2023 / Accepted: 14 November 2023 / Published: 16 November 2023
(This article belongs to the Special Issue Emerging Topics in High-Power Laser and Light–Matter Interactions)

Abstract

:
Amidst the escalating issue of drug abuse, an urgent need for effective illicit drug detection methods has arisen. This paper introduces a novel optical approach utilizing the Goos–Hänchen Shift (GHS) to explore the possibility of on-site rapid detection of illicit drugs. Delving into the mechanisms, light absorption and attenuation in biological samples are considered through absorption and attenuation coefficients, establishing connections between complex refractive indices, complex dielectric constants, and GHS. A self-assembled GHS detection system measured GHS values across various samples: ultrapure water, serum, methamphetamine, serum–methamphetamine, heroin, and serum–heroin. These experiments unveiled substantial GHS variations among the samples. Refractive indices for serum, serum–methamphetamine, and serum–heroin samples were computed using GHS values and sample extinction coefficients, highlighting GHS’s remarkable sensitivity to refractive index variations as a high-sensitivity refractive index sensing technology. The correlation between the dielectric constant and GHS was explored, yielding refractive indices for pure solutes—serum, methamphetamine, and heroin—of 1.66300, 1.51300, and 1.62300, respectively. Notably, the dielectric constants for these solutes were 2.76557, 2.28917, and 2.63413, emphasizing the dielectric constant’s discriminative potential in identifying illicit drugs. In conclusion, these findings suggest that GHS holds promise for distinguishing various illicit drug types, charting an innovative path for illicit drug detection.

1. Introduction

Illicit drugs dependence and addiction pose severe threats to human mental and physical health, familial relationships, and societal stability. This escalating global concern underscores the urgency of combatting drug abuse. Advances in drug detection technologies have significantly bolstered these efforts [1,2,3]. Current drug detection methods are primarily bifurcated into separation-based detection and direct detection.
Separation-based detection primarily employs techniques such as LC-MS (Liquid Chromatography–Mass Spectrometry) [4,5,6] and CE (Capillary Electrophoresis) [7]. LC-MS, being adept at both qualitative and quantitative drug analyses from complex body fluids and having commendable stability with a detection limit as low as 10 ng/mL [8], is the gold standard for drug testing. Its results can serve as evidence in the criminal justice system [9]. However, LC-MS requires prolonged analysis times (over 5 h), skilled technicians, and costly equipment. Its lab-bound nature renders it unsuitable for rapid drug testing needs [10,11]. CE, while combining the strengths of various separation techniques and being efficient and automated [12], suffers from reproducibility and stability issues due to its short and narrow analytical pathways [13], preventing it from becoming a mainstream drug detection method.
Direct detection predominantly employs Surface Enhanced Raman Spectroscopy (SERS). Optical technologies, such as SERS, offer advantages like minimal sample contact, no pre-treatment, lesser sample requirements, and swift detection processes [14]. SERS is now widely used for drug detection [15,16] and has almost become the only method for directly detecting drug varieties. However, measurements via SERS must be carried out on precious metal nanoparticle substrates, which have hard-to-control enhancement effects, leading to poor reproducibility. The interference of these metal nanoparticles with biological samples also cannot be overlooked [17]. Thus, there is a pressing need to explore a new, highly sensitive, and accurate direct detection method for advancing illicit drug detection technologies.
The GHS (Goos–Hänchen Shift) denotes the lateral displacement of a reflected light beam from its expected geometrical path during total internal reflection [18]. This shift serves as an apt detection signal, unaffected by variations in light source intensity [19]. Since its experimental discovery in 1947, GHS has spurred numerous theoretical and empirical studies and has found applications in sensors [20,21,22], optical switches [23,24], and optical storage [25]. Notably, with GHS’s tight association with the electromagnetic properties of materials (like refractive index), it is emerging as a detection method in chemical and environmental realms [26,27]. Recent research by Min Jin in 2023, for instance, leveraged a specifically designed GHS sensor for detecting aquatic heavy metal ions [20]. Jiangyu Liu explored the feasibility of using a designed terahertz GHS sensor for detecting biological small molecules [26]. Elnaz demonstrated the efficacy of GHS in detecting low-concentration biomolecules [27]. Due to the small value of GHS, it is relatively difficult to measure, so enhancing the GHS displacement has become a research hotspot. SPR sensors based on GHS [20,28,29,30] have been widely used in the detection field and have achieved good detection sensitivity. However, just like the SERS technology, the SPR enhancement effect depends on the presence of metal nanoparticles or nanofilms, and the impact of precious metals on biological samples is still unknown. Therefore, for biological samples, we prefer the direct detection method. These findings intimate that GHS, as a sensitive optical direct detection method, might be well-suited for illicit drug detection, which this study sets out to investigate.
In this study, we constructed the GHS measurement system to detect the GHS values of various samples, encompassing ultrapure water, serum, methamphetamine, heroin, serum–methamphetamine, and serum–heroin mixtures. Considering the absorption and scattering of the samples, we established a relationship between the complex refractive index of the samples and GHS using the steady-state phase method GHS calculation formula. From the experimentally measured GHS and extinction coefficients, we derived the refractive index information for serum, serum–methamphetamine, and serum–heroin samples based on the aforementioned relationship. Using the refractive index calculation formula for mixed solutions, we further analyzed the serum, serum–methamphetamine, and serum–heroin samples. This analysis enabled us to determine the refractive indices and dielectric constants of the three pure substances: serum, methamphetamine, and heroin. Furthermore, we proposed a solution method to determine the dielectric constant of unknown illicit drug components in the serum. Our findings offer valuable insights for distinguishing between different types of illicit drugs in drug detection processes.

2. Principles and Methods

2.1. Principle of Goos–Hänchen Shift

When a light beam transitions from an optically dense medium to a less dense one, and the angle of incidence surpasses the critical angle for total internal reflection, full reflection occurs at the interface. In classical geometric optics, it is conventionally assumed that the phenomenon of total internal reflection adheres to the law of geometric reflection, implying that the incident and reflected rays coincide at the same position. However, this is not entirely accurate. Goos and Hänchen [18], through experimentation, observed that under conditions of total internal reflection, the reflected light beam deviates from the ideal geometric path by a small distance, denoted as the Goos–Hänchen Shift, as shown in Figure 1.
Currently, GHS is primarily studied using the steady-state phase method. The incident light can be considered as a superposition of monochromatic plane waves with different wavevector directions. Consequently, the full reflected beam is composed of various corresponding reflected plane waves, each having different phases, leading to the displacement of the reflected light. TM-polarized light exhibits larger GHS values compared to TE-polarized light. GHS measurements are carried out using polarization-based methods, specifically by measuring the displacement difference in GHS between TE-polarized and TM-polarized light [18]. By subtracting the results obtained under TM and TE conditions, the influence of small measurement errors on the test results can be mitigated, thereby improving the accuracy of the system’s measurements.

2.2. Experimental Device

A GHS measurement system was constructed, as shown in Figure 2. The entire system mainly consists of polarization modulation, incident angle control, displacement generation, and detection components. Parallel beams of light, collimated by a lens assembly, pass through the first polarizer, converting the beams into linearly polarized light (with a polarization direction at a 45° angle to the horizontal plane). Then, the linearly polarized light goes through the second adjustable polarizer to modulate the polarization state of the light into either TE or TM polarization. In this study, a prism was used as the displacement-generating component. The light beam enters the prism from one side of its right-angled surface, and when it contacts the sample interface in the prism’s sloping surface, total internal reflection occurs, resulting in the generation of the GHS. The reflected light exits from the other right-angled side of the prism and is directed onto a detector. The prism is mounted on a rotation stage, and the incident angle of the light beam for total internal reflection can be changed by automatically controlling the rotation stage. The system operates as follows:
A He-Ne laser (1107P, JDSU, Milpitas, CA, USA) emitting light with a wavelength of 632.8 nm produces a collimated light beam with a spot diameter of 1 mm after passing through a lens assembly. The first polarizer (Edmund Optics, Barrington, IL, USA) is used to adjust the polarization angle to 45°, resulting in linearly polarized light. Then, the second polarizer is rotated to adjust the polarization direction of the incident light. When the transmission direction of the second polarizer is set to be horizontal (0°) or vertical (90°), TM- and TE-polarized light are obtained, respectively. Furthermore, the light enters an isosceles right-angle prism (PS911, Thorlabs, Newton, NJ, USA), where it undergoes reflection at the prism’s sloping surface. The reflected light’s position signal, detected by a position-sensitive detector (PSD, ON-TRAK Optics, Milpitas, CA, USA), is amplified through an amplifier (OT-301, ON-TRAK Optics, Milpitas, CA, USA), digitized through A/D conversion, and then input into a computer for data processing.

2.3. Experimental Samples

The methamphetamine and heroin used in this experiment were research-grade and were obtained from the Narcotics Detection Center of the Tianjin Public Security Bureau. The serum (fetal bovine serum, F4135) was purchased from Sigma, Kenilworth, NJ, USA, and all samples were used without further purification. Ultrapure water was used as the solvent, and solutions of serum, methamphetamine, and heroin were prepared with a concentration of 10−3 mol/L. Mixtures of methamphetamine and heroin with serum were also prepared to create serum–methamphetamine and serum–heroin mixed solutions. All experimental images presented in this article represent the average results of five repeated experiments, and there are no significant differences between the results of each repetition.

3. Results and Discussion

To ensure the accuracy of the experimental results, the errors in the GHS measurement system shown in Figure 2 were first analyzed. During the experiment, the light beams were adjusted to either the TM or TE polarization, and the TM and TE polarizations might not have aligned perfectly, resulting in a certain distance between them. Multiple measurements revealed that the distance between them was approximately 2 µm. To eliminate the influence of this distance on GHS measurements, it was necessary to calibrate the zero point of the GHS, i.e., correcting for this factor.
As shown in Figure 3, during the adjustment of the polarizer, there was a distance “L” between the TM and TE polarizations. After passing through the prism, if total internal reflection did not occur, the distance between the two polarizations remained “L.” However, if total internal reflection occurred, the distance between the polarizations became “L + S2-S1,” where “S1” and “S2” represent the GHS values for the TE and TM polarizations, respectively. Therefore, by subtracting “L” from the measured difference between the positions of the two polarizations when total internal reflection occurred (L + S2-S1), the actual relative displacement value could be obtained as “S2-S1.” When total internal reflection did not occur, both the TM and TE polarizations had GHS values of 0, resulting in a GHS value of 0. Thus, the correction value “L” could be obtained by measuring the distance between the different polarization states when total internal reflection did not occur. This correction allowed us to account for the influence of angular changes on GHS measurements by differentiating between the positions of the reflected light beams under different polarizations, effectively preserving only the GHS value.
The quality of reflected light spots at different incident angles was analyzed. Three arbitrary wavelengths of TE-polarized and TM-polarized light, each with a wavelength of 632.8 nm, were incident on the prism–air interface, and the reflected light spots were processed using MATLAB R2020b software. This processing involved obtaining the intensity distribution along a horizontal line passing through the center of the light spot, as shown in Figure 4. During the image processing, the light spots were translated to align their contours to enable a clearer observation of any changes in the light spot’s shape. The results indicate that the shape of the light spots remains essentially unchanged at different incident angles, with energy concentrated at the center of the light spot, and any impact on the beam position detection can be neglected.
Next, the positions of the reflected light beams at the prism–air interface were measured under different incident angles for both TM and TE polarizations, as shown in Figure 5a,b. It can be observed from the figures that with an increase in the incident angle, the light spot moves in the positive direction of the detector’s X-axis. During the experimental measurements, the distance between the TM polarization and the TE polarization when no total internal reflection occurred was measured to be 1.3 µm. By taking the difference in the positions of the light beams between Figure 5a,b and subtracting the correction value of 1.3 µm, the position values of the prism–air interface (GH position) were obtained, as shown in Figure 5c. The prism’s refractive index used in the experiment was 1.515 (laser wavelength: 632.8 nm), and the refractive index of air was 1. Based on calculations, the critical angle for total internal reflection was determined to be 41.30°. To reduce experimental errors, multiple sets of data were measured and averaged, and efforts were made to ensure that the light beam was incident vertically on the PSD photosensitive surface. Near the critical angle for total internal reflection, the measured displacement peak was 7.16 µm, which is approximately 11.3 times the wavelength. As the incident angle increased, the displacement rapidly decreased and then stabilized at around 2 µm. Furthermore, according to the steady-state phase method theory, the theoretical values of the GHS for the prism–air interface were calculated, as shown by the red solid line in Figure 5c. It can be observed that the theoretical values closely matched the experimental measurements, indicating the accuracy of the measurement setup built in this study.
In contrast to the refractive index, the concept of the complex refractive index encompasses fundamental optical parameters such as the refractive index and the absorption coefficient. It stands as a critical physical quantity for characterizing the optical properties of substances and holds significant relevance as an optical parameter for biological samples [31]. Notably, some prior studies, as documented in references [26,27], did not account for the impact of physical phenomena like absorption and attenuation within samples on the refractive index. However, biological samples, typified by serum, exhibit light absorption or attenuation within the ultraviolet to visible wavelength spectrum. These optical behaviors have the potential to influence the characteristics of reflected light and, by extension, the GHS. Consequently, considering the attenuation and absorption of substances in response to light [32,33,34], we conducted thorough derivations and analyses to elucidate the intricate relationship between the GHS and the complex refractive index of materials.
The important formulas are displayed as follows. Please refer to the Supplementary document for detailed formula derivation.
It can be seen that the polarization rate of the medium is complex, therefore, the refractive index of the material can be expressed as a complex number:
n ^ ε r = 1 + χ = n + i η
In the formula, n is the refractive index of the medium, ε r is the dielectric constant, and η is the extinction coefficient of the medium. Furthermore, the complex refractive index can be related to the complex dielectric function:
ε ^ r = 1 + χ = n 2 η 2 + 2 n η i
After rigorous deduction, we can calculate the phase of the reflection coefficients as
ϕ s = Im ln n 1 cos θ 1 n 2 + i μ a + μ s λ 4 π 2 n 1 2 sin 2 θ 1 n 1 cos θ 1 + n 2 + i μ a + μ s λ 4 π 2 n 1 2 sin 2 θ 1
ϕ p = Im ln n 2 + i μ a + μ s λ 4 π 2 cos θ 1 n 1 2 n 2 + i μ a + μ s λ 4 π 2 n 1 2 sin 2 θ 1 ) n 2 + i μ a + μ s λ 4 π 2 cos θ 1 + n 1 2 ( n 2 + i μ a + μ s λ 4 π 2 n 1 2 sin 2 θ 1 )
with these phase values, the GHS can be expressed as
D i = λ 0 2 π n 1 d ϕ i d θ 1 = λ 0 2 π n 1 d Im [ ln ( ϕ i ) ] d θ 1
It can be observed that the magnitude of the GHS is influenced by several factors, including the wavelength of light, polarization state, angle of incidence, and refractive index of the medium, as well as the absorption and scattering coefficients. However, when the wavelength of light, polarization state, and angle of incidence are held constant, the magnitude of the GHS is determined by the refractive index, absorption coefficient, and scattering coefficient, which reflect the electromagnetic properties of the material itself. In essence, the GHS can serve as a characterization of the intrinsic electromagnetic properties of the material.
Currently, illicit drugs are primarily categorized as new drugs and traditional drugs. Methamphetamine represents a typical new drug, often referred to as synthetic drugs, and it is also one of the most widely abused drugs worldwide. Heroin, on the other hand, is a classic example of a traditional drug and accounts for a significant proportion of seized drugs. In the following sections, we will explore the characteristics of these two drugs, methamphetamine and heroin, using a GHS analysis.
Different biological samples were subjected to GHS testing and analysis, employing a 632.8 nm laser source. Experimental measurements of GHS values were conducted on six distinct samples: ultrapure water, serum, methamphetamine, heroin, serum–methamphetamine, and serum–heroin. The resulting GHS data are presented in Figure 6, with a summarized overview available in Table 1. The results clearly illustrate significant variations among these samples, indicating the potential of the GHS to distinguish between them.
Furthermore, a theoretical fitting of the GHS values for these samples is depicted by the red solid line in Figure 6. It is evident that the theoretical model closely aligns with the experimental results, particularly beyond the critical angle for total internal reflection. Notably, the GHS patterns for all samples exhibit consistency, featuring displacement peaks in proximity to the critical angle for total internal reflection, followed by a rapid decline in displacement beyond this critical angle.
The differences in the GHS reflect variations in the refractive indices of the test samples. Based on the relationship between the GHS and the complex refractive index of substances (Equations (3)–(5)), we used serum, serum–methamphetamine, and serum–heroin as examples to analyze the refractive indices of serum, methamphetamine, and heroin (pure substances). We also discussed their potential applications in substance differentiation in the field of drug detection. As shows in Figure 6, the positions of the displacement peaks for serum, serum–methamphetamine, and serum–heroin samples were different. To ensure that total internal reflection occurred and to maximize differentiation, the incident angle was selected as 61.670°. The GHS is related to the absorption and scattering coefficients of the samples, so the total attenuation coefficient needed to be measured in the experiment. We represented the total attenuation coefficient as follows:
μ = ln I t I 0 I r / x
where
I 0 = I r + I t + I α + I s
In the formula, I 0 , I r , I t , I α , and I s represent the intensity of incident, reflected, transmitted, absorbed, and scattered light, respectively. The samples, including serum, serum–methamphetamine, and serum–heroin, were introduced into the flow cell through the sample inlet. The GHS for each sample was measured, and the incident light intensity, reflected light intensity, and transmitted light intensity were measured using a power meter (S120VC, Thorlabs, Newton, NJ, USA). With these measurements, the attenuation coefficients and extinction coefficients of the samples were calculated, respectively. Furthermore, by substituting the calculated extinction coefficients and the measured GHS values into Equations (3)–(6), the refractive indices of the samples were determined, as shown in Table 2. Overall, based on Formulas (3)–(5), by incorporating the parameters from Table 2 into the formula, the reflective index is calculated as a physical quantity. The results indicate that the extinction coefficients and refractive indices of the three samples are relatively close, primarily due to the low concentrations of the samples. With such small differences in refractive indices, it is challenging to differentiate them using other measurement methods, whereas the GHS exhibits significant numerical variations. This indirectly indicates that the GHS is highly sensitive and can serve as a high-sensitivity sensing technique.
If the GHS measurement is to be developed as a detection technique, it is necessary to find a correlation between the intrinsic physical properties of the sample and the GHS. The dielectric constant is a physical property that represents the polarization ability of a dielectric material under the action of an electric field and is an intrinsic physical property. Studies have shown a correlation between the dielectric constant and the refractive index. In the following section, we aim to establish a correlation between the GHS and the dielectric constant of the test sample. In the previous sections, we obtained the GHS, refractive indices, and extinction coefficients for serum, serum–methamphetamine, and serum–heroin samples. However, it is evident that the main component in these samples is water. Next, we will further analyze the samples by excluding water and focusing on the solutes, i.e., the effects of serum, methamphetamine, and heroin (pure substances).
The Arago–Biot formula [35] is one of the theoretical formulas applied to calculate the refractive index of mixed solutions. Taking a two-component mixed solution as an example, the formula is as follows:
n m = ( 1 φ ) n a + φ n b
Above, n m is the refractive index of the mixed solution, n a and n b are the refractive index of the solution component, and φ is the volume fraction of the component. In this study, ultrapure water is employed as the solvent for the serum sample, and the serum molecules constitute the solute. For the serum–methamphetamine sample, ultrapure water serves as the solvent, and a mixture of serum molecules and methamphetamine molecules constitutes the solute. Similarly, for the serum–heroin sample, ultrapure water functions as the solvent, and the solute consists of a mixture of serum molecules and heroin molecules. The concentrations of these samples are pre-established (all at mol/L). Utilizing Equation (8), the refractive indices of serum, methamphetamine, and heroin are calculated as 1.66300, 1.51300, and 1.62300, respectively. Given that these three substances exhibit weak light absorption at 632.8 nm, their extinction coefficients are deemed negligible. Accordingly, the dielectric constants of serum, methamphetamine, and heroin are computed as 2.76557, 2.28917, and 2.63413, respectively, in accordance with Equation (2). This indicates that, compared to refractive indices, the variations in the derived dielectric constants, as an intrinsic parameter, are more pronounced. Using dielectric constants as a parameter to differentiate between sample types offers greater distinctiveness.
In the previous section, we discussed the method of calculating the refractive index and dielectric constant of pure samples such as methamphetamine, serum, and heroin based on experimental results. However, for actual serum samples, the composition and corresponding volume fractions are unknown. Therefore, it is not possible to directly determine the refractive index of the drugs and differentiate them based on GHS values and the mixed solution refractive index formula. We propose an approach to address this problem. Based on the relationship between the GHS of the sample and the complex refractive index, we can obtain the refractive index value for the entire sample. Let us assume that the known volume ratio of water to serum in a standard serum sample is V 1 : V 2 .
For a tested serum sample containing drugs, its refractive index can be expressed as
n s 1 = V 1 V 1 + V 2 + V 3 n 1 + V 2 V 1 + V 2 + V 3 n 2 + V 3 V 1 + V 2 + V 3 n 3
Among them, n 1 , n 2 , n 3 are the refractive indices of water, serum, and drugs, and V1, V2, and V3 are the volumes of water, serum, and drugs, respectively. The unknowns in Equation (9) are n 3 and V 3 . We need to prepare a new sample by taking a small amount of the tested serum sample containing drugs and adding an equal volume of the standard serum (other volume ratios can also be used, but the volume ratio must be known). Then, the refractive index of the new sample can be expressed as
n s 2 = 2 V 1 + V 1 V 3 V 1 + V 2 2 ( V 1 + V 2 + V 3 ) n 1 + 2 V 2 + V 2 V 3 V 1 + V 2 2 ( V 1 + V 2 + V 3 ) n 2 + V 3 2 ( V 1 + V 2 + V 3 ) n 3
By solving Equations (9) and (10), we can obtain Vs and Vd. Subsequently, we can determine the dielectric constant of the unknown drug, differentiating drugs based on their intrinsic properties. The research findings provide a direction for the subsequent exploration of GHS detection in mixed drug samples.

4. Conclusions

Employing the principles of polarization, we have independently engineered a GHS measurement system and assessed its measurement accuracy. Building on this foundation, we measured the GHS values for various samples, including ultrapure water, serum, methamphetamine, serum–methamphetamine, heroin, and serum–heroin, yielding values of 6.00 μm, 5.02 μm, 3.62 μm, 8.19 μm, 3.2 μm, and 4.53 μm, respectively. These results demonstrate the potential of displacement values for distinguishing between different sample types. The introduction of absorption and attenuation coefficients allowed for the establishment of a model linking complex refractive indices with GHS. Based on experimentally measured GHS values and sample extinction coefficients, refractive index values were calculated for serum, serum–methamphetamine, and serum–heroin samples. These findings highlight the remarkable sensitivity of GHS to changes in the refractive index, positioning it as a high-sensitivity refractive index sensing technology. The correlation between the intrinsic physical property, dielectric constant, of the test samples and the GHS was also explored. Calculations based on the formula for determining refractive indices in mixed solutions revealed refractive indices for solutes in the samples, namely serum, methamphetamine, and heroin, to be 1.66300, 1.51300, and 1.62300, respectively. Moreover, the dielectric constants for these solutes were found to exhibit more pronounced differences, at 2.76557, 2.28917, and 2.63413, respectively. These results underscore the potential of the dielectric constant as a more distinguishing parameter for differentiating between illicit drugs, offering a promising avenue for advancing the field of illicit drug detection. In the subsequent work, we will explore drug detection with different concentrations in large sample sizes and various mixed sample types, aiming to further advance and refine GHS drug detection technology.

Supplementary Materials

The following supporting information can be downloaded at: https://www.mdpi.com/article/10.3390/photonics10111270/s1.

Author Contributions

Y.W.: Methodology, Formal analysis, Writing—review and editing, and Data curation. X.Z.: Investigation and Software. X.F.: Funding acquisition and Data curation. X.H.: Methodology and Funding acquisition. L.Z.: Software and Supervision. C.W.: Software and Writing—review and editing. All authors have read and agreed to the published version of the manuscript.

Funding

This research was funded by the National Natural Science Foundation of China under Grant 61805178 and in part by the Natural Science Foundation of Shandong Provincial under Grant ZR2020QA072.

Institutional Review Board Statement

Not applicable.

Informed Consent Statement

Not applicable.

Data Availability Statement

Data are contained within the article and Supplementary Materials.

Conflicts of Interest

The author Xiaodi Zhou is optical engineer in Research and Development Centre, Shandong North Optical Electronics Co., Ltd. The authors declare no conflict of interest.

References

  1. Ju, L.; Lyu, A.; Hao, H.; Shen, W.; Cui, H. Deep Learning-Assisted Three-Dimensional Fluorescence Difference Spectroscopy for Identification and Semiquantification of Illicit Drugs in Biofluids. Anal. Chem. 2019, 91, 9343–9347. [Google Scholar] [CrossRef] [PubMed]
  2. Griffin, A.; Henry, J.; Kirkbride, K.P.; Painter, B.; Linacre, A. A survey of the effects of common illicit drugs on forensic DNA analysis. Forensic Sci. Int. 2022, 336, 111314. [Google Scholar] [CrossRef] [PubMed]
  3. Zulyadi, R. Obstacle Factors on Evidence System of Urine Test Result on Drugs Cases in National Narcotics Board of North Sumatera Province, Indonesia. Bp. Int. Res. Crit. Inst. (BIRCI-J.) Humanit. Soc. Sci. 2020, 3, 1316–1324. [Google Scholar] [CrossRef]
  4. Chen, W.; Li, X.; Huang, H.; Zhu, X.; Jiang, X.; Zhang, Y.; Cen, K.; Zhao, L.; Liu, X.; Qi, S. Comparison of gas chromatography-mass spectrometry and gas chromatography-tandem mass spectrometry with electron ionization for determination of N-nitrosamines in environmental water. Chemosphere 2017, 168, 1400–1410. [Google Scholar] [CrossRef] [PubMed]
  5. Deventer, K.; Pozo, O.J.; Van Eenoo, P.; Delbeke, F.T. Development of a qualitative liquid chromatography/tandem mass spectrometric method for the detection of narcotics in urine relevant to doping analysis. Rapid Commun. Mass Spectrom. 2007, 21, 3015–3023. [Google Scholar] [CrossRef]
  6. Fiorentin, T.R.; Logan, B.K.; Martin, D.M.; Browne, T.; Rieders, E.F. Assessment of a portable quadrupole-based gas chromatography mass spectrometry for seized drug analysis. Forensic Sci. Int. 2020, 313, 110342. [Google Scholar] [CrossRef]
  7. Saar-Reismaa, P.; Brilla, C.A.; Leiman, K.; Kaljurand, M.; Vaher, M.; Kulp, M.; Mazina-Šinkar, J. Use of a newly-developed portable capillary electrophoresis analyser to detect drugs of abuse in oral fluid: A case study. Talanta 2020, 211, 120662. [Google Scholar] [CrossRef]
  8. Trufelli, H.; Palma, P.; Famiglini, G.; Cappiello, A. An overview of matrix effects in liquid chromatography-mass spectrometry. Mass Spectrom. Rev. 2011, 30, 491–509. [Google Scholar] [CrossRef]
  9. Mosekiemang, T.T.; Stander, M.A.; de Villiers, A. Ultra-high pressure liquid chromatography coupled to travelling wave ion mobility-time of flight mass spectrometry for the screening of pharmaceutical metabolites in wastewater samples: Application to antiretrovirals. J. Chromatogr. A 2021, 1660, 462650. [Google Scholar] [CrossRef]
  10. Cîntǎ-Pînzaru, S.; Peica, N.; Küstner, B.; Schlücker, S.; Schmitt, M.; Frosch, T.; Faber, J.H.; Bringmann, G.; Popp, J. FT-Raman and NIR-SERS characterization of the antimalarial drugs chloroquine and mefloquine and their interaction with hematin. J. Raman Spectrosc. 2006, 37, 326–334. [Google Scholar] [CrossRef]
  11. Swerdlow, H.; Gesteland, R. Capillary gel electrophoresis for rapid, high resolution DNA sequencing. Nucleic Acids Res. 1990, 18, 1415–1419. [Google Scholar] [CrossRef] [PubMed]
  12. Xu, Y.; Gao, Y.; Wei, H.; Du, Y.; Wang, E. Field-amplified sample stacking capillary electrophoresis with electrochemiluminescence applied to the determination of illicit drugs on banknotes. J. Chromatogr. A 2006, 1115, 260–266. [Google Scholar] [CrossRef] [PubMed]
  13. Cialla, D.; März, A.; Böhme, R.; Theil, F.; Weber, K.; Schmitt, M.; Popp, J. Surface-enhanced Raman spectroscopy (SERS): Progress and trends. Anal. Bioanal. Chem. 2012, 403, 27–54. [Google Scholar] [CrossRef] [PubMed]
  14. Fan, R.; Liu, Z.; Jin, D.; Luo, T.; Li, N.; Li, S.; Wang, Y.; Xia, Y.; Lu, Z. High temporal waveform fidelity stimulated Brillouin scattering phase conjugate mirror using Novec-7500. Opt. Express 2023, 31, 1878–1887. [Google Scholar] [CrossRef] [PubMed]
  15. Dong, R.; Weng, S.; Yang, L.; Liu, J. Detection and direct readout of drugs in human urine using dynamic surface-enhanced Raman spectroscopy and support vector machines. Anal. Chem. 2015, 87, 2937–2944. [Google Scholar] [CrossRef] [PubMed]
  16. Weng, S.; Dong, R.; Zhu, Z.; Zhang, D.; Zhao, J.; Huang, L.; Liang, D. Dynamic surface-enhanced Raman spectroscopy and Chemometric methods for fast detection and intelligent identification of methamphetamine and 3, 4-Methylenedioxy methamphetamine in human urine. Spectrochim. Acta A Mol. Biomol. Spectrosc. 2018, 189, 1–7. [Google Scholar] [CrossRef]
  17. Fu, B.B.; Tian, X.D.; Song, J.J.; Wen, B.Y.; Zhang, Y.J.; Fang, P.P.; Li, J.F. Self-Calibration 3D Hybrid SERS Substrate and Its Application in Quantitative Analysis. Anal. Chem. 2022, 94, 9578–9585. [Google Scholar] [CrossRef]
  18. Goos, F.; Hänchen, H. Ein neuer und fundamentaler Versuch zur Totalreflexion. Ann. Phys. 1947, 436, 333–346. [Google Scholar] [CrossRef]
  19. Ullah, Z.; Ahmad, S.; Khan, T.; Jan, M.N.; Abdul Jabar, M.S. Complex conductivity dependent Goos–Hanchen shifts through metallic surface. J. Phys. B At. Mol. Opt. Phys. 2020, 53, 155401. [Google Scholar] [CrossRef]
  20. Jin, M.; Liu, J.; Xu, W.; Deng, D.; Han, L. Enhanced Goos-Hänchen Shift of SPR Sensor with TMDCs and Doped PANI/Chitosan Composites for Heavy Metal Ions Detection in Aquatic Environment. Plasmonics 2023, 18, 1129–1141. [Google Scholar] [CrossRef]
  21. Lang, Y.; Liu, Q.; Wang, Q.; Zhou, X.; Jia, G. Wavelength-dependent Goos-Hänchen shifts observed in one-dimensional photonic crystal films with different structures. Phys. Lett. A 2022, 449, 128348. [Google Scholar] [CrossRef]
  22. Olaya, C.M.; Hayazawa, N.; Hermosa, N.; Tanaka, T. Angular Goos-Hänchen Shift Sensor Using a Gold Film Enhanced by Surface Plasmon Resonance. J. Phys. Chem. A 2021, 125, 451–458. [Google Scholar] [CrossRef] [PubMed]
  23. Sun, D. A proposal for digital electro-optic switches with free-carrier dispersion effect and Goos-Hanchen shift in silicon-on-insulator waveguide corner mirror. J. Appl. Phys. 2013, 114, 4502. [Google Scholar] [CrossRef]
  24. Farmani, A.; Mir, A.; Sharifpour, Z. Broadly tunable and bidirectional terahertz graphene plasmonic switch based on enhanced Goos-Hänchen effect. Appl. Surf. Sci. 2018, 453, 358–364. [Google Scholar] [CrossRef]
  25. Tsakmakidis, K.L.; Boardman, A.D.; Hess, O. ‘Trapped rainbow’ storage of light in metamaterials. Nature 2007, 450, 397–401. [Google Scholar] [CrossRef]
  26. Liu, J.-Y.; Huang, T.-J.; Yin, L.-Z.; Han, F.-Y.; Liu, P.-K. High Sensitivity Terahertz Biosensor Based on Goos-Hnchen Effect in Graphene. IEEE Photonics J. 2020, 12, 1–6. [Google Scholar]
  27. Palermo, G.; Sreekanth, K.V.; Maccaferri, N.; Lio, G.E.; Nicoletta, G.; De Angelis, F.; Hinczewski, M.; Strangi, G. Hyperbolic dispersion metasurfaces for molecularbiosensing. Nanophotonics 2021, 10, 295–314. [Google Scholar] [CrossRef]
  28. Yuan, Y.; Peng, X.; Weng, X.; He, J.; Liao, C.; Wang, Y.; Liu, L.; Zeng, S.; Song, J.; Qu, J. Two-dimensional nanomaterials as enhanced surface plasmon resonance sensing platforms: Design perspectives and illustrative applications. Biosens. Bioelectron. 2023, 241, 115672. [Google Scholar] [CrossRef]
  29. Sang, W.; Huang, S.; Chen, J.; Dai, X.; Liu, H.; Zeng, Y.; Zhang, T.; Wang, X.; Qu, J.; Ho, H.P.; et al. Wavelength sequential selection technique for high-throughput multi-channel phase interrogation surface plasmon resonance imaging sensing. Talanta 2023, 258, 124405. [Google Scholar] [CrossRef]
  30. Zhang, C.; Hong, Y.; Li, Z.; Da, H. Giant and controllable Goos-Hnchen shift of monolayer graphene strips enabled by a multilayer dielectric grating structure. Appl. Opt. 2022, 61, 844–850. [Google Scholar] [CrossRef]
  31. Benam, E.R.; Sahrai, M.; Bonab, J.P. High sensitive label-free optical sensor based on Goos-Hänchen effect by the single chirped laser pulse. Sci. Rep. 2020, 10, 17176. [Google Scholar] [CrossRef] [PubMed]
  32. Ebert, M.; Weinbruch, S.; Hoffmann, P.; Ortner, H.M. The chemical composition and complex refractive index of rural and urban influenced aerosols determined by individual particle analysis. Atmos. Environ. 2004, 38, 6531–6545. [Google Scholar] [CrossRef]
  33. Chew, W.C.; Weedon, W.H. A 3D perfectly matched medium from modified maxwell’s equations with stretched coordinates. Microw. Opt. Technol. Lett. 1994, 7, 599–604. [Google Scholar] [CrossRef]
  34. Chuang, S.L. Lateral shift of an optical beam due to leaky surface-plasmon excitations. J. Opt. Soc. Am. A Opt. Image Sci. 1986, 3, 593–599. [Google Scholar] [CrossRef]
  35. Aminabhavi, T.M. Use of mixing rules in the analysis of data for binary liquid mixtures. J. Chem. Eng. Data 1984, 29, 54–55. [Google Scholar] [CrossRef]
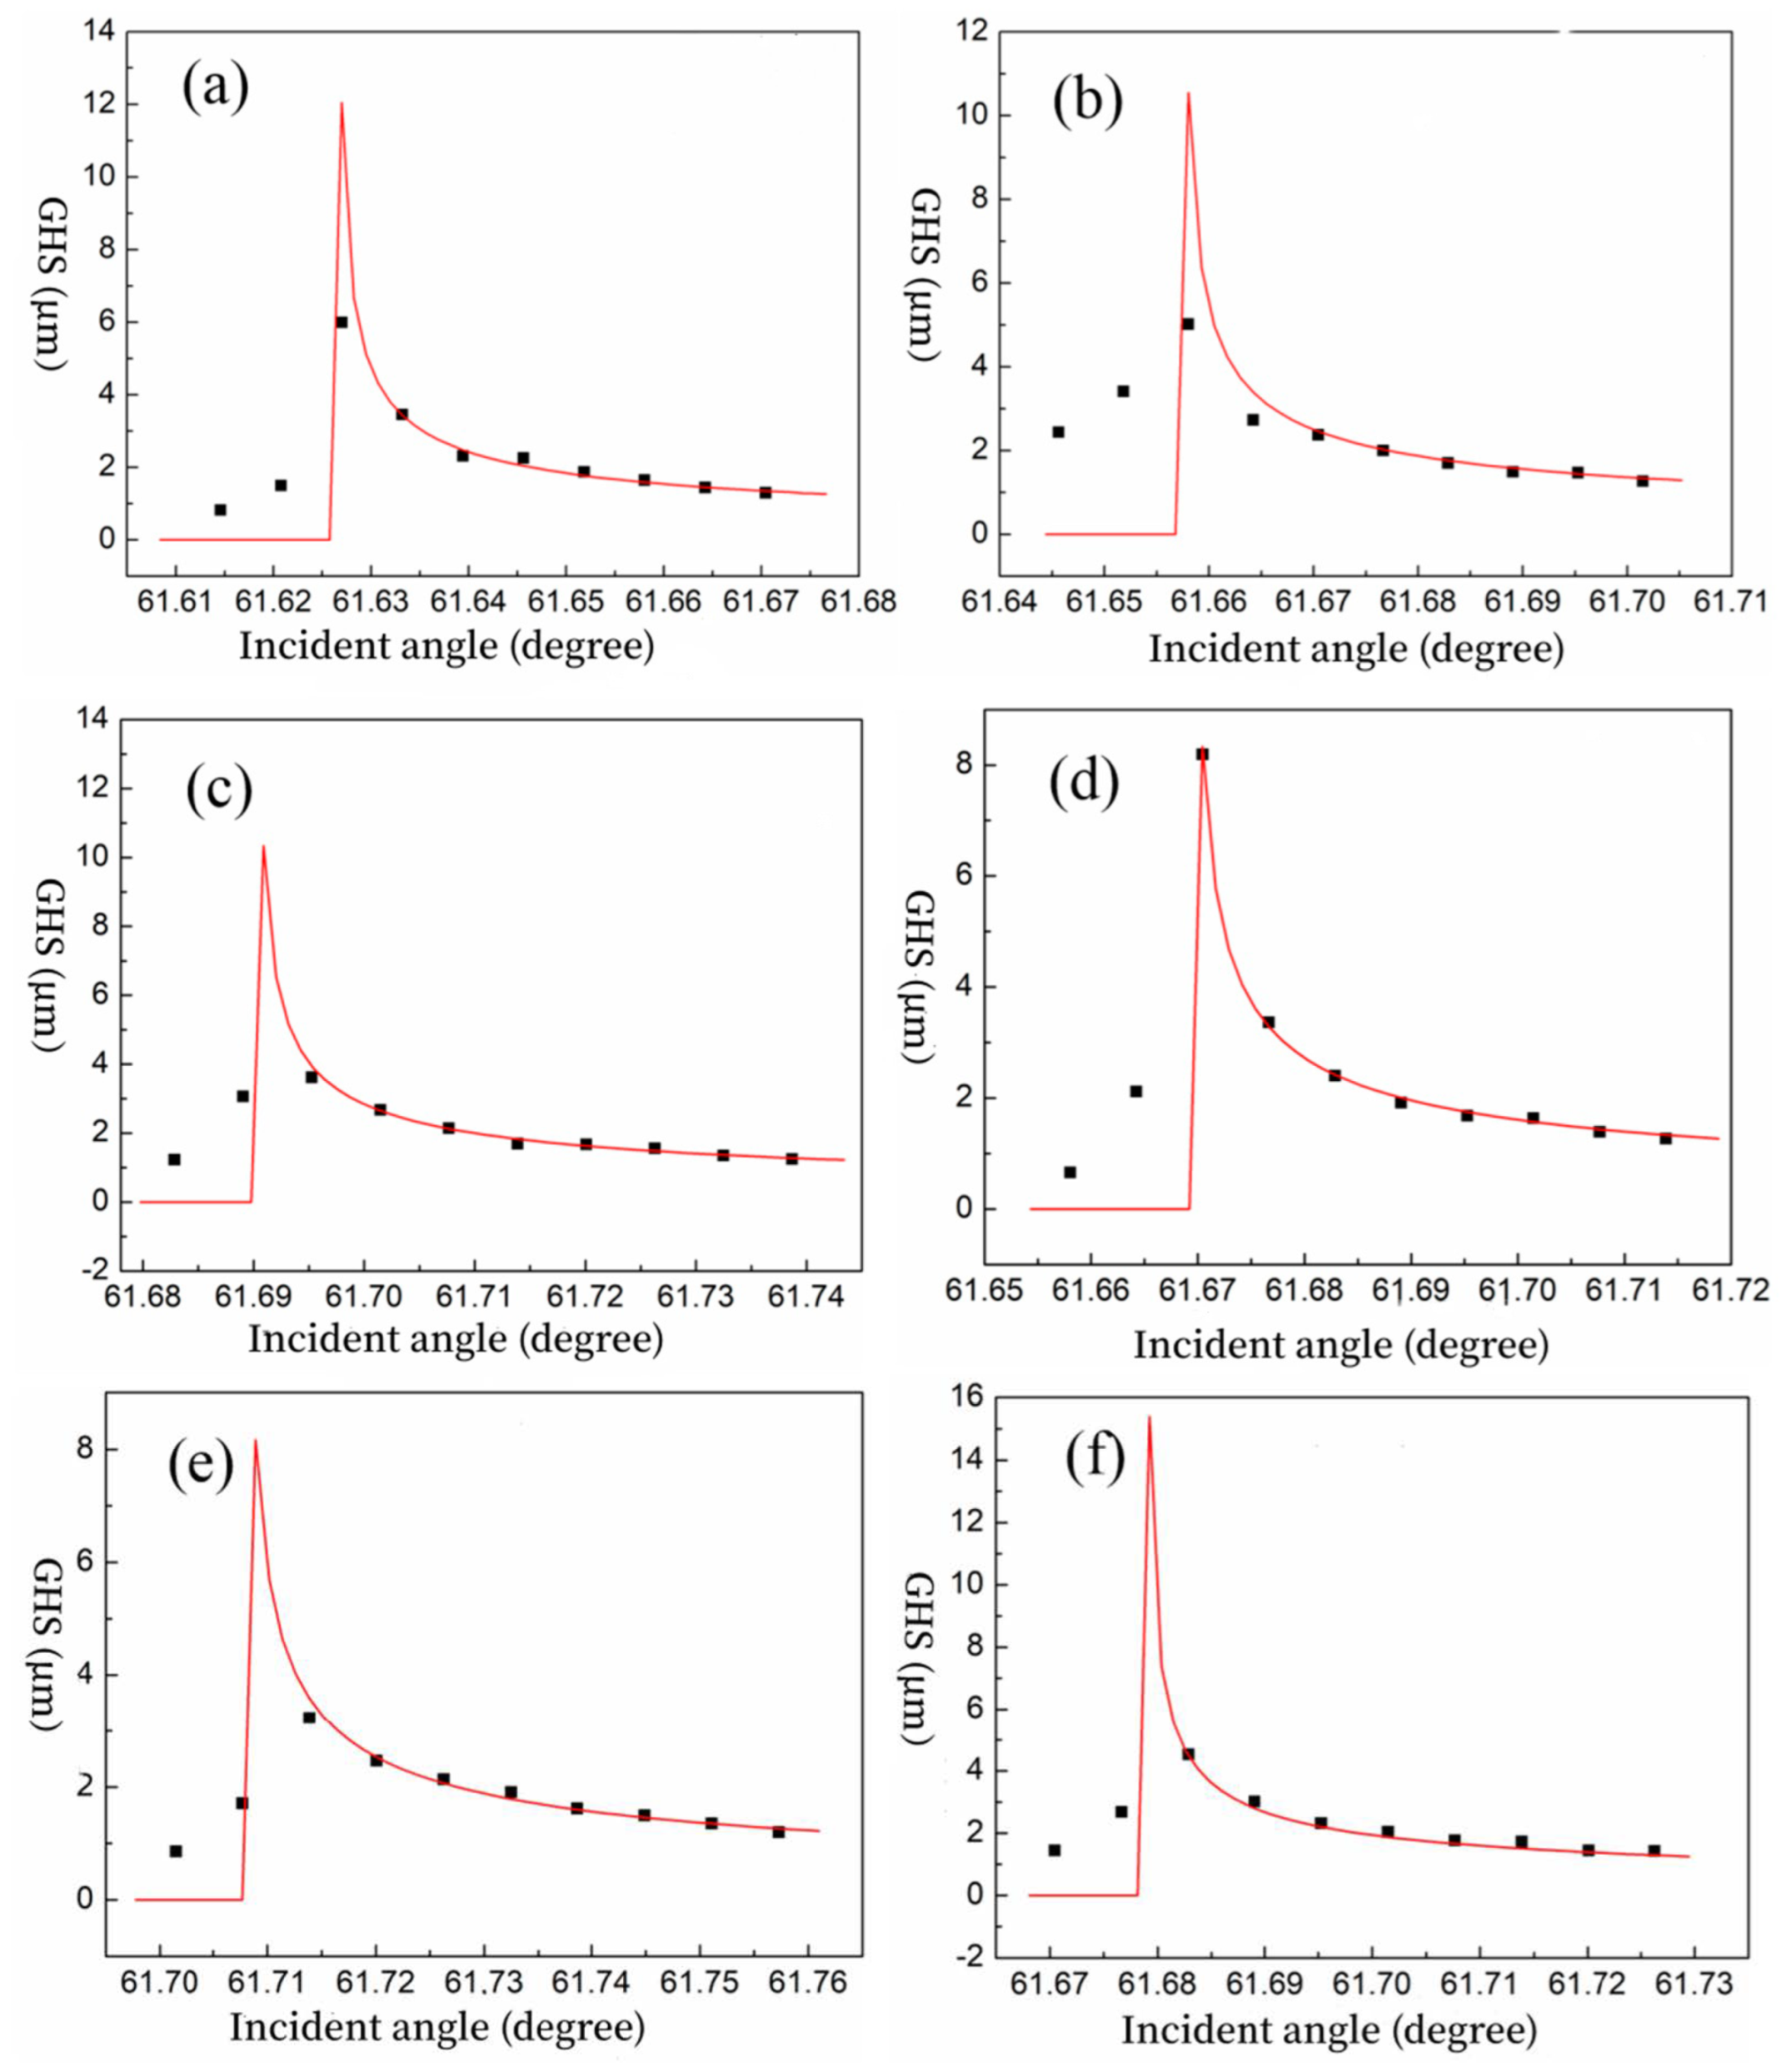
Figure 1. Schematic representation of the Goos–Hänchen Shift under total internal reflection conditions. The solid line represents the actual reflected light beam, while the dashed line represents the geometrically expected reflected light beam.
Photonics 10 01270 g001
Figure 2. Schematic diagram of GHS measurement system.
Photonics 10 01270 g002
Figure 3. Polarizer adjustment leading to beam displacement. (a) No total reflection occurred; (b) total reflection occurs.
Photonics 10 01270 g003
Figure 4. Reflected spot intensity distribution. (a) TE incident light, (b) TM incident light. The red, green, and blue colors in the figure represent the results of three experiments.
Photonics 10 01270 g004
Figure 5. (a) Distribution of TM-polarized reflected light positions at the prism–air interface, (b) distribution of TE-polarized reflected light positions at the prism–air interface, and (c) comparison of experimental and theoretical GHS values at the prism–air interface.
Photonics 10 01270 g005
Figure 6. Theoretical fitting and experimental GHS data of samples. (a) Ultrapure water, (b) serum solution, (c) methamphetamine solution, (d) serum containing methamphetamine, (e) heroin solution, and (f) serum containing heroin.
Photonics 10 01270 g006
Table 1. GHS values for samples.
SampleWaterSerumMethamphetamineSerum–MethamphetamineHeroinSerum–Heroin
Incident angle (degree)61.62761.65861.69561.67061.71461.683
GH displacement (μm)6.005.023.628.193.204.53
Table 2. Summary table of experimental results.
SampleSerumSerum–MethamphetamineSerum–Heroin
GHS/μm1.702.404.53
Incident light power/μW 95.395.395.3
Reflected light power/μW71.370.164.8
Transmitted light power/μW0.430.430.16
Absorption coefficient/cm−15.905.977.70
Extinction coefficient2.97 × 10−53.01 × 10−53.88 × 10−5
Refractive index1.333331.333511.33362
Disclaimer/Publisher’s Note: The statements, opinions and data contained in all publications are solely those of the individual author(s) and contributor(s) and not of MDPI and/or the editor(s). MDPI and/or the editor(s) disclaim responsibility for any injury to people or property resulting from any ideas, methods, instructions or products referred to in the content.

