Abstract
Optical clocks can be used as the absolute frequency reference due to their high accuracy and stability. In a precise optical clock transmission system, the instability loss of the link is usually evaluated by beating the remote optical signal with the reference clock, which is not suitable for real frequency distribution applications. Therefore, it is necessary to assess the performance directly at the remote site for the optical frequency transfer, because the two sites of the link are usually not co-located. In this paper, we proposed a comb-based remote residual instability evaluation scheme. Two coherent optical combs with different wavelengths were extracted from a frequency stable comb and transmitted after multiplexing. The residual instability was evaluated directly at the remote site by measuring the phase fluctuation difference between the two combs. We achieved 8.61 × 10⁻¹⁹ at 40,000 s over a 10 km fiber link, reaching the instability of optical clocks. These results revealed that our scheme can evaluate optical clock frequency transmission directly at the remote site, which made the method truly practical.
1. Introduction
Optical clocks are currently considered the most precise frequency standard [1], with 10−18 magnitude accuracy and long-term instability [2,3]. Due to their bulky size and complex structure, optical clocks can only be developed and operated in a few laboratories. Therefore, it is necessary to establish a high-precision transmission system to realize the frequency distribution and comparison of optical clocks [4,5]. With the characteristics of low attenuation, high reliability, and immunity to electromagnetic interference [6], fibers have become a common medium for high-precision distribution of frequency standards. Since Ma proposed the phase compensation method [7], the technology of frequency transmission over a fiber link has developed rapidly and been widely used in many fields, such as the synchronization of very long baseline interferometry (VLBI) systems [8] and earthquake detection [9]. However, the fiber link usually introduces phase noise to the signal because of temperature fluctuation and vibration [6], causing damage to the stability of the frequency signal recovered at the remote site. As a result, it is vital to evaluate the residual instability of the fiber link.
Conventional proposals to assess instability loss often use the local oscillator as the reference to compare with the recovered frequency signal directly at the remote site. This scheme, shown in Figure 1a, is only applicable to transmission demonstrations where the local end and remote end are located at the same place in the laboratory [10,11,12,13,14]. It is not feasible for an actual transfer system, because the local site and the remote site are usually in different locations, even hundreds of kilometers apart. For this reason, an assessment scheme with a loop-back link configuration was proposed in 2005 for real transmission [15]. It uses a compensated fiber link to distribute the radio frequency (RF). Meanwhile, an extra fiber link is added to send the recovered frequency signal at the remote site back to the local site. The instability loss is assessed at the local site. Nevertheless, this method is only useful for point-to-point transmission rather than multiple-access transmission, as the additional fiber link adds more complexity to the system. In addition, this method requires consistent phase fluctuations in the two fiber links. As for real transfer over long-distance fiber cables, the phase fluctuations of the two links are usually irrelevant, and it is not practical to measure the actual instability.
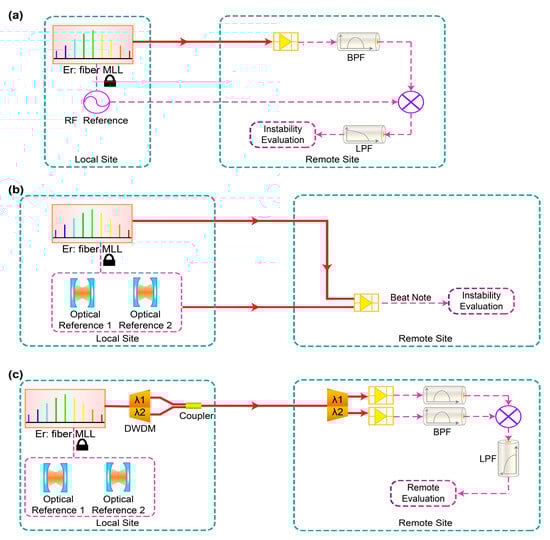
Figure 1.
Schematic diagrams of three methods to evaluate the instability loss of comb-based frequency transfer systems. (a) Common evaluation method for radio frequency (RF) transmission. (b) Common evaluation method for optical frequency transmission. It beats the remote optical signal with optical frequency reference directly. (c) Remote performance evaluation scheme of comb-based precise frequency dissemination proposed in this paper for an optical clock.
To overcome the preceding problems, Ref. [16] presents a new assessment method in which the instability loss is evaluated directly at the remote site. The theoretical basis is that the fiber link introduces different phase noises to signals at different wavelengths due to the dispersion. In this scheme, two coherent signals with different wavelengths are transmitted together at the same time and compared with each other directly at the remote site to evaluate the link’s instability loss. This research verified the effectiveness of this evaluation method for long-haul microwave frequency dissemination, and the instability loss was only 1.5 × 10⁻¹⁶ at 10,000 s.
Another application scenario for this technology is to assess the performance of high-precision transmission, such as the frequency distribution of optical clocks. Compared with microwave frequency standards like masers, optical clocks can be regarded as absolute frequency standards due to their high stability. As is shown in Figure 1b, researchers usually beat the remote optical signal with the optical reference to evaluate the instability loss of the optical frequency transmission system [14]. This scheme has similar defects to those of microwave transmission shown in Figure 1a because a local oscillator is still required. Consequently, frequency distribution for optical clocks also requires remote assessment. The method outlined in [16] will have practical value if it can be proven to be able to evaluate the instability loss of the optical clock frequency distribution system (where long-term instability falls below the order of 10−18) at the remote end.
In this paper, we demonstrate a remote direct evaluation method for comb-based optical clock frequency transmission. Optical combs can be utilized as novel mediums to distribute the optical clock. We construct a high-precision frequency transmission experiment to examine the proposed evaluation scheme. The residual instability measured in this way was 5.74 × 10⁻¹⁵ at 1 s averaging time and 8.61 × 10⁻¹⁹ at 40,000 s averaging time over the 10 km fiber link, reaching the level of optical clocks, and the overlapping Allan deviation curve was nearly consistent with that measured with the traditional method. The results reveal that the method can evaluate the instability loss of the link directly at the remote site, in the applications of optical clock distribution and comparison over a long-haul commercial fiber link.
2. Remote Instability Evaluation Method
For an optical frequency comb, each tone can be represented as , where is the repetition rate and is the carrier-envelope offset frequency. To meet the requirements for optical frequency standard distribution, all tones of the optical comb should be stabilized, meaning that the and would be locked simultaneously. In the field of comb-based optical frequency distribution, two approaches have been proposed to stabilize these two dimensions. As is shown in Figure 1c, one scheme similar to the method proposed in [17] is to lock two tones of the comb to two independent optical frequency references separately, such as an optical clock and a saturated absorption resonance. Another approach is to extract and stabilize the to the atomic clock with the f-2f structure, and lock one tone to the optical frequency to stabilize the at the same time.
The remote direct instability assessment scheme for comb-based transmission for an optical clock is illustrated in Figure 1c. After frequency stabilization, the optical comb is then filtered out into two sub-combs with different center wavelengths by two channels of a dense wavelength division multiplexer (DWDM) with 0.6 nm channel bandwidth, and these two combs are transmitted to the remote site via wavelength division multiplexing. Due to the inherent coherence between the teeth, the two sub-combs separated from the same comb are coherent, meaning that the repetition rate signals extracted from these two combs are also relevant. Therefore, the instability loss can be assessed at the remote site through the error signal generated by mixing the nth harmonics of these repetition rates. At the receiving end, we separated the two sub-combs via demultiplexing and extracted their respective repetition rates through photoelectric conversion. Then, the error signal was obtained, after mixing the repetition rates of these two arms, to evaluate the instability loss of the optical fiber link.
Our scheme is derived from the remote assessment method outlined in [16]. The remote structures of the two solutions are the same, but the local structures are different. At the local site, in [16], the microwave signal is modulated into two continuous-wave (CW) optical carriers of different wavelengths for transmission, while we separate a single optical comb into two sub-combs of different wavelengths for transmission.
This slight difference in structure allows these two similar schemes to have different applications. The approach in [16] can only be used to evaluate the instability loss of the microwave frequency transmission process, but it does not limit the distance of the link and the number of the relay amplifiers. On the contrary, since the transmission medium is optical combs, the solution in this paper can realize the evaluation of the optical clock frequency transmission performance directly at the remote site. The transmission link to be assessed here is usually a short-distance high-precision link, without relay erbium-doped fiber amplifiers (EDFAs), because an EDFA with the inherent noise coefficient exceeding 3 dB will destroy the instability of the optical clock. Therefore, this scheme is not suitable for evaluating long-haul links.
2.1. Theoretical Analysis of the Remote Evaluation Method
Considering that the bandwidth of the two sub-combs is much lower than the difference of center wavelengths between each other, the phase difference caused by the link dispersion in different modes of the sub-comb is negligible. Assuming that the phase fluctuation of the transmitted signal is only induced by the temperature effect, according to [16,18,19], we express the phase time delay fluctuation of the sub-comb at the wavelength after transmission as:
where is the ambient temperature, is the fiber’s length, is the linear expansion coefficient of the fiber, and is the refractive index. The refractive index of the SMF can be calculated in terms of the Sellmeier formula:
where the values of the coefficients in the Sellmeier formula can be found in [20]. The reference also gives the thermo-optic coefficient of the SMF at different temperatures and at different wavelengths.
In the same way, we can express the phase time fluctuation of another sub-comb. Accordingly, the phase fluctuation difference between the two signals is:
Then, the relation between and can be derived:
where the proportional coefficient can be calculated in terms of (1), while can be obtained using (3). As a consequence, the link’s stability loss can be evaluated by measuring the phase fluctuation difference between two coherent signals at different wavelengths. With the dispersion compensating fiber (DCF) inserted in the link, the derivation of the two proportional coefficient is given in the next section.
2.2. Variant of the Evaluation Method over the Dispersion Compensated Link
Though the effect of dispersion on the interior of a sub-comb is “slight” compared to that between the two sub-combs, in fact, the influence of dispersion by the fiber on the interior of the sub-comb still exists. The main reason is that dispersion is sensitive to temperature (thermal sensitivity of chromatic dispersion). For this reason, a short-distance DCF is inserted here to neutralize a small amount of anomalous dispersion caused by the single-mode fiber to suppress the phase changes of different modes within the sub-comb as much as possible, but it does not eliminate the phase changes between sub-combs fully.
When the dispersion compensating fiber is introduced into the single-mode fiber (SMF) link, the phase time delay fluctuation of the sub-comb here can be expressed by:
According to (1), we can also deduce the phase time delay fluctuation .
Similarly, the phase fluctuation difference can be expressed by:
Therefore, the relation between and can be derived as follows:
In the fiber link without dispersion compensation, the proportional coefficient and can be calculated using (1) and (3). The velocity of the laser in the vacuum is 3 × 10⁸ m/s, the temperature of the laboratory is 25 °C, and the linear expansion coefficient is 5.5 × 10⁻⁷/°C. In this way, we calculated that the value of is 1.4 × 10⁻⁴, and the value of is 9.3 × 10⁻⁷.
As for DCFs, the dispersion characteristics of different products vary greatly. It is hard to acquire the refractive index and thermo-optic coefficient of a specific DCF product at a specific temperature or wavelength condition. For the dispersion-compensated system, we measured the phase time series with two evaluation methods at the same time and determined the scale factor through multiple sets of experimental data.
3. Experimental Setup
According to the above analysis, we designed a proof-of-concept experiment in which an optical comb was transferred over a 10 km fiber link, and the instability loss was evaluated at the remote site using the proposed method. The experimental setup is illustrated in Figure 2. A Keysight N5181A signal generator (REF1) and a Rohde & Schwarz SMB100A signal generator (REF2) were utilized as RF reference sources at the local site in the system. These two sources were synchronized together to the 10 MHz inner frequency in REF2. REF1 produced a 100 MHz radio signal regarded as the local oscillator (LO) for phase compensation. The optical comb to be transferred was generated by an Er-doped mode-locked laser of a 100 MHz repetition rate. The output optical pulses were divided into two parts by a 1 × 2 coupler. One was for repetition frequency locking to the REF2 by an optical-microwave phase detector (OM-PD). The other laser was split into two beams again: 10% as the local signal to compensate for the phase delay variation of the link, and the remaining 90% for frequency distribution and instability loss assessment at the remote site.
As shown in Figure 1c and Figure 2, the comb was filtered by a DWDM and divided into two sub-combs with center wavelengths of 1551 nm and 1558 nm, respectively. The bandwidth of each sub-comb was 0.6 nm. The two optical combs were combined via an optical coupler. After the optical circulator, the two combs entered the single-mode fiber link to be disseminated to the remote site. To suppress the damage of the stability caused by dispersion [21], we used a spool of 1.2 km DCF to offset it. At the remote site, after another circulator, the optical power was divided into two parts by a 75:25 coupler, in which 75% of the light was sent back to the local site for phase compensation, and the remaining 25% was left for signal detection. The received two sub-combs were demultiplexed by a DWDM, which was the same as that at the local site. During the demultiplexing process, the out-of-band noise, introduced by EDFA due to spontaneous emission, was also filtered out. Then, the two sub-combs were converted into electronic signals by two photodiodes (PDs), and their repetition rates were extracted by two band-pass filters. After the down-mixing and low-pass filtering process, the error signal was obtained for the remote evaluation. The phase information of the signals in the two arms of the mixer was converted into the digital current (DC) voltage of the error signal. We used a digital multimeter (Keysight 34465A) to measure and record the DC voltage to acquire the residual instability of the transmission system.
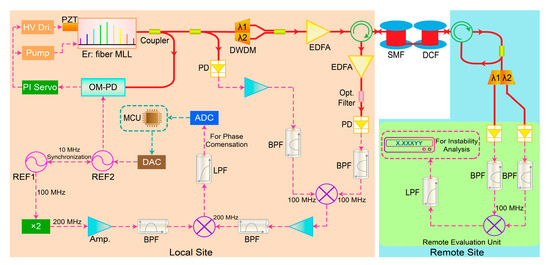
Figure 2.
Schematic diagram of the remote residual instability assessment experiment of comb-based frequency transmission over the fiber link. An OM-PD is utilized to synchronize the 10th harmonic of the optical comb’s repetition rate to an RF reference. The repetition rates of the two sub-combs are mixed with each other and then the error signal is obtained for instability evaluation. REF: RF reference source. MLL: mode-locked laser. PZT: piezoelectric. HV Dri: high-voltage driver of the PZT. PI: proportional and integral. DWDM: dense wavelength division multiplexer. EDFA: erbium-doped fiber amplifier. SMF: single-mode fiber. DCF: dispersion compensating fiber. PD: photodiode. BPF: band-pass filter. LPF: low-pass filter. ADC: analog-to-digital converter. DAC: digital-to-analog converter. MCU: microcontroller unit. OM-PD: optical–microwave phase detector. The principle and structure of the fiber loop OM-PD is proposed by [22].
The two groups of backward optical pulses were injected into the optical fiber link through the circulator at the remote site, and after reaching the local site, they entered an EDFA through the circulator for amplification. A filter with a center wavelength of 1551nm was added to filter out one sub-comb and filter its out-of-band noise induced by the EDFA. Then, this light beam was converted to the electronic signal for phase compensation. Considering that the phase compensation scheme is not the real concern of this experiment, it has been introduced in detail in [23] and will be not repeated here.
At the local site, the phase error signal from the remote site was digitalized by an analog-to-digital converter (ADC), and then it was processed through a digital proportion–integration PI calculation in the controller. Through a digital-to-analog converter (DAC), the error signal was converted back to an analog signal. After being adjusted by the PI, the error signal was input as a modulation signal into the generator REF2. As a result, we were able to change the phase of the output microwave by phase-modulating this signal. Since the repetition rate of the mode-locking laser was phase-locked with the RF signal from REF2, when the phase of RF signal changed, the phase of the repetition rate signal changed synchronously, which led to feedback compensation.
Considering that our remote evaluation scheme based on optical combs is mainly concerned with the release of optical clocks, as is mentioned in Section 2, the length of the SMF link needed to be proper in this experiment. If the transmission distance was too short, such as 1 m or 1 km, it made no sense from a practical point of view. If the distance exceeds 100 km, considering the attenuation of the optical fiber link, EDFAs would be needed for relay amplification. However, an EDFA has an intrinsic noise figure of no less than 3 dB. Using multi-stage EDFA would inevitably destroy the instability of the optical clock with the noise accumulation, making it impossible to transmit the optical clock. Therefore, the proper fiber length in this application scenario usually ranged from 10 km to 100 km. Here, we chose a spool of 10 km fiber and a spool of 50 km fiber to verify the validity of the proposed remote assessment method.
4. Results and Discussions
In the experiment, the long-term phase fluctuations were measured for verification at different dissemination distances, with both the proposed remote evaluation method and the common method in which the remote signal is mixed with the local reference. At first, we recorded the phase information for nearly 4 h over the free-running link with 10 km SMF and 1.2 km DCF. Figure 3 and Figure 4a present the results of this measurement. The timing drifts in Figure 3a (common method) and in Figure 3d (remote evaluation) were measured at the same time. The values of the two phase time series were of the same order of magnitude. We extracted the two results for short durations, which are shown in Figure 3b versus Figure 3e, and Figure 3c versus Figure 3f, finding that the two curves varied almost synchronously. This phenomenon demonstrates the proportional relationship of the measurement results of the two approaches. Next, the overlapping Allan deviations (ADEV) [24] of the two sets of data in Figure 3a,b were calculated and are illustrated in Figure 4a. These two instability curves are highly coincident with each other. In order to further confirm the consistency of the two evaluation methods, we also computed the relative error of timing drifts in Figure 3a,b and then deduced its overlapping ADEV. As is shown in Figure 4a, the ADEV of the relative error is one order of magnitude lower than those of the timing drifts. These above results validate the effectiveness of our remote evaluation method.
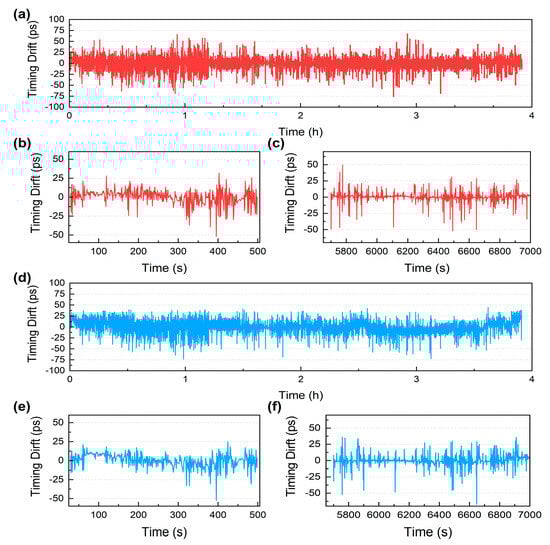
Figure 3.
Phase time series results of a measurement over a 10 km free-running link with dispersion compensation. (a) The timing drifts obtained by mixing local reference with recovered signal at the remote site for almost 4 hours. (b,c) Different scalings of (a) by time axis. (d) The result measured with the proposed remote assessment method simultaneously. (e,f) Scalings of (d) by time axis.
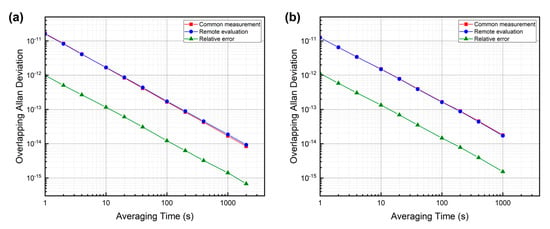
Figure 4.
In order to show the consistency between the remote evaluation method and the common method that mixes remote signal with local reference, we measured the instabilities of the timing drifts with two methods and the instability of the relative error. (a) The results measured over the 10 km link calculated by the data in Figure 3. (b) The results measured over the 50 km link calculated by the data in Figure 5.
To examine whether the proposed scheme was still applicable over different lengths of links, we performed another set of measurements over a 50 km free-running fiber link with dispersion compensation. The results are shown in Figure 4b and Figure 5. The two timing drift curves still varied almost synchronously, their ADEV curves continued to be highly coincident, and the ADEV of the relative error was one order of magnitude lower than those of the timing drifts as before. It is obvious that our method is still effective at different distances.
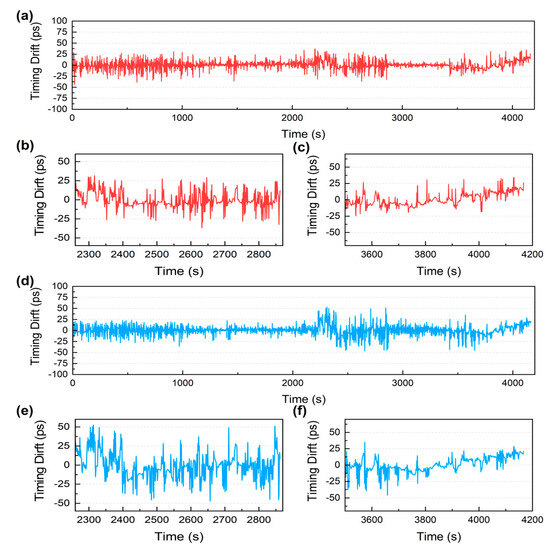
Figure 5.
Phase time series results of a measurement over a 50 km free-running link with dispersion compensation. (a) The timing drifts obtained by mixing local reference with recovered signal at the remote site for over 1 h. (b,c) Different scalings of (a) by time axis. (d) The result measured with the proposed remote assessment method simultaneously. (e,f) Scalings of (d) by time axis.
On the other hand, to test the long-term reliability of the remote assessment scheme, we measured the timing drifts over the 10 km free-running and phase-compensated links for over 10 h. The overlapping Allan deviations illustrated in Figure 6 were calculated to characterize the residual frequency instabilities. The result measured on the free-running mode, by mixing the remote signal with the LO reached 6.21 × 10⁻¹² at 1 s averaging time and 1.09 × 10⁻¹⁵ at 10,000 s averaging time. The remote evaluation result of the free-running link was 6.29 × 10⁻¹² at 1 s averaging time and 2.16 × 10⁻¹⁵ at 10,000 s averaging time. When the link was compensated, the residual instability was 5.74 × 10⁻¹⁵ at 1 s and 8.61 × 10⁻¹⁹ at 40,000 s with the remote assessment method, reaching the level of an optical clock [2,3]. The outcome measured by mixing the remote signal with the LO was 1.32 × 10⁻¹⁴ at 1 s averaging time and 7.09 × 10⁻¹⁹ at 40,000 s. These two curves nearly coincided when the averaging time was over 100 s, showing similar overlapping Allan deviation. These results not only reveal the effectiveness of this remote evaluation method from another perspective, but also demonstrate its practical value in assessing the high-precision frequency distribution of optical clocks at the remote site.
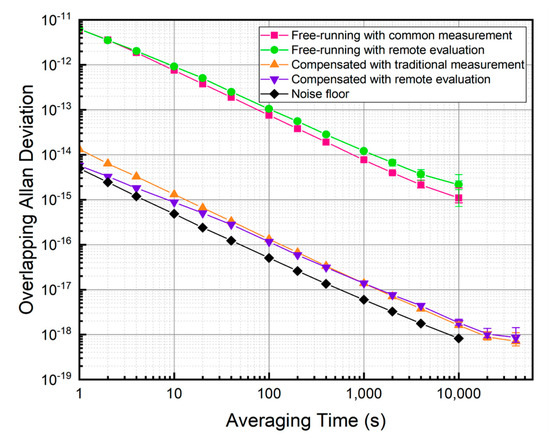
Figure 6.
The measured residual frequency instability of the comb-based transfer link. The pink curve is the free-running result measured with the common method in which the remote signal is mixed with the LO. The green curve shows the overlapping Allan deviations of the free-running system with the remote evaluation method. The orange curve represents the residual instability obtained under phase compensation with the common method. The purple curve is the result of the compensated system acquired through remote evaluation. The black curve represents the overlapping ADEV of the electric noise floor.
5. Conclusions
In conclusion, we propose an effective method for assessing the instability loss of the comb-based frequency dissemination system at the remote site. This solution aims to realize the remote evaluation of optical clock frequency transmission performance. By measuring the phase shift difference of two coherent optical combs with different wavelengths at the remote site, we obtained the instability loss of the link directly. The residual instability measured with the proposed method is 5.74 × 10⁻¹⁵ at 1 s averaging time and 8.61 × 10⁻¹⁹ at 40,000 s averaging time, reaching the instability order of an optical clock. The result reveals that this solution has the ability to evaluate the high-precision frequency transmission of an optical clock directly at the remote site, which makes the method truly practical. Compared with conventional methods, our scheme overcomes the restrictions of the local reference needing to be co-located with the remote site, or the remote signal needing to be sent back via a round-trip configuration. It shows great potential in simplifying the structure of precise frequency transfer and comparison systems for optical clocks.
Author Contributions
Conceptualization, J.Z. and Z.L.; methodology, Z.L.; validation, Z.L., S.G. and H.W.; resources, Z.L.; writing—original draft preparation, Z.L.; writing—review and editing, J.Z. and Z.G.; supervision, J.Z.; funding acquisition, J.Z. All authors have read and agreed to the published version of the manuscript.
Funding
This research was supported by the National Natural Science Foundation of China (91836301).
Institutional Review Board Statement
Not applicable.
Informed Consent Statement
Not applicable.
Data Availability Statement
The data in this paper can be obtained by contacting the first author or corresponding author.
Acknowledgments
We thank Zhigang Zhang for his suggestion regarding the mode-locked laser and Shanglin Li for the constructive discussion on the remote instability assessment scheme.
Conflicts of Interest
The authors declare no conflict of interest.
References
- Ludlow, A.D.; Boyd, M.M.; Ye, J.; Peik, E.; Schmidt, P.O. Optical atomic clocks. Rev. Mod. Phys. 2015, 87, 637–701. [Google Scholar] [CrossRef]
- Bloom, B.J.; Nicholson, T.L.; Williams, J.R.; Campbell, S.L.; Bishof, M.; Zhang, X.; Zhang, W.; Bromley, S.L.; Ye, J. An optical lattice clock with accuracy and stability at the 10−18 level. Nature 2014, 506, 71–75. [Google Scholar] [CrossRef] [PubMed]
- Campbell, S.L.; Hutson, R.B.; Marti, G.E.; Goban, A.; Darkwah Oppong, N.; McNally, R.L.; Sonderhouse, L.; Robinson, J.M.; Zhang, W.; Bloom, B.J.; et al. A Fermi-degenerate three-dimensional optical lattice clock. Science 2017, 358, 90–94. [Google Scholar] [CrossRef] [PubMed]
- Predehl, K.; Grosche, G.; Raupach, S.M.F.; Droste, S.; Terra, O.; Alnis, J.; Legero, T.; Hänsch, T.W.; Udem, T.; Holzwarth, R.; et al. A 920-Kilometer Optical Fiber Link for Frequency Metrology at the 19th Decimal Place. Science 2012, 336, 441–444. [Google Scholar] [CrossRef]
- Schnatz, H.; Terra, L.J.; Predehl, K.; Feldmann, T.; Legero, T.; Lipphardt, B.; Sterr, U.; Grosche, G.; Holzwarth, R.; Hansch, T.W.; et al. Phase-coherent frequency comparison of optical clocks using a telecommunication fiber link. IEEE Trans. Ultrason. Ferroelectr. Freq. Control 2010, 57, 175–181. [Google Scholar] [CrossRef]
- Foreman, S.M.; Holman, K.W.; Hudson, D.D.; Jones, D.J.; Ye, J. Remote transfer of ultrastable frequency references via fiber networks. Rev. Sci. Instrum. 2007, 78, 021101. [Google Scholar] [CrossRef]
- Ma, L.-S.; Jungner, P.; Ye, J.; Hall, J.L. Delivering the same optical frequency at two places: Accurate cancellation of phase noise introduced by an optical fiber or other time-varying path. Opt. Lett. 1994, 19, 1777–1779. [Google Scholar] [CrossRef]
- He, Y.; Baldwin, K.G.H.; Orr, B.J.; Bruce Warrington, R.; Wouters, M.J.; Luiten, A.N.; Mirtschin, P.; Tzioumis, T.; Phillips, C.; Stevens, J.; et al. Long-distance telecom-fiber transfer of a radio-frequency reference for radio astronomy. Optica 2018, 5, 138–146. [Google Scholar] [CrossRef]
- Marra, G.; Clivati, C.; Luckett, R.; Tampellini, A.; Kronjäger, J.; Wright, L.; Mura, A.; Levi, F.; Robinson, S.; Xuereb, A.; et al. Ultrastable laser interferometry for earthquake detection with terrestrial and submarine cables. Science 2018, 361, 486–490. [Google Scholar] [CrossRef]
- Marra, G.; Slavík, R.; Margolis, H.S.; Lea, S.N.; Petropoulos, P.; Richardson, D.J.; Gill, P. High-resolution microwave frequency transfer over an 86-km-long optical fiber network using a mode-locked laser. Opt. Lett. 2011, 36, 511–513. [Google Scholar] [CrossRef]
- Wang, B.; Gao, C.; Chen, W.L.; Miao, J.; Zhu, X.; Bai, Y.; Zhang, J.W.; Feng, Y.Y.; Li, T.C.; Wang, L.J. Precise and Continuous Time and Frequency Synchronisation at the 5 × 10⁻¹⁹ Accuracy Level. Sci. Rep. 2012, 2, 556. [Google Scholar] [CrossRef] [PubMed]
- Ning, B.; Zhang, S.Y.; Hou, D.; Wu, J.T.; Li, Z.B.; Zhao, J.Y. High-Precision Distribution of Highly Stable Optical Pulse Trains with 8.8 × 10⁻¹⁹ instability. Sci. Rep. 2014, 4, 5109. [Google Scholar] [CrossRef] [PubMed]
- Chen, Y.; Dai, H.; Si, H.; Wang, F.; Wang, B.; Wang, L. Long-Haul High Precision Frequency Dissemination Based on Dispersion Correction. IEEE Trans. Instrum. Meas. 2022, 71, 5503207. [Google Scholar] [CrossRef]
- Feng, Z.; Marra, G.; Zhang, X.; Fokoua, E.R.N.; Sakr, H.; Hayes, J.R.; Poletti, F.; Richardson, D.J.; Slavík, R. Stable Optical Frequency Comb Distribution Enabled by Hollow-Core Fibers. Laser Photonics Rev. 2022, 16, 2200167. [Google Scholar] [CrossRef]
- Daussy, C.; Lopez, O.; Amy-Klein, A.; Goncharov, A.; Guinet, M.; Chardonnet, C.; Narbonneau, F.; Lours, M.; Chambon, D.; Bize, S.; et al. Long-Distance Frequency Dissemination with a Resolution of 10–17. Phys. Rev. Lett. 2005, 94, 203904. [Google Scholar] [CrossRef] [PubMed]
- Li, S.; Wang, C.; Lu, H.; Zhao, J. Performance Evaluation at the Remote Site for RF Frequency Dissemination Over Fiber. IEEE Photonics J. 2017, 9, 7202608. [Google Scholar] [CrossRef]
- Hou, D.; Wu, J.; Zhang, S.; Ren, Q.; Zhang, Z.; Zhao, J. A stable frequency comb directly referenced to rubidium electromagnetically induced transparency and two-photon transitions. Appl. Phys. Lett. 2014, 104, 111104. [Google Scholar] [CrossRef]
- Hartog, A.H.; Conduit, A.J.; Payne, D.N. Variation of pulse delay with stress and temperature in jacketed and unjacketed optical fibres. Opt. Quantum Electron. 1979, 11, 265–273. [Google Scholar] [CrossRef]
- Agrawal, G.P. Chapter 1—Introduction. In Nonlinear Fiber Optics, 4th ed.; Academic Press: San Diego, CA, USA, 2006; pp. 1–24. [Google Scholar]
- Leviton, D.B.; Frey, B.J. Temperature-dependent absolute refractive index measurements of synthetic fused silica. In Optomechanical Technologies for Astronomy; SPIE: Bellingham, WA, USA, 2006; Volume 6273, p. 62732K. [Google Scholar]
- Śliwczyński, Ł.; Krehlik, P.; Lipiński, M. Optical fibers in time and frequency transfer. Meas. Sci. Technol. 2010, 21, 075302. [Google Scholar] [CrossRef]
- Jung, K.; Kim, J. Subfemtosecond synchronization of microwave oscillators with mode-locked Er-fiber lasers. Opt. Lett. 2012, 37, 2958–2960. [Google Scholar] [CrossRef]
- Shen, J.; Wu, G.; Hu, L.; Zou, W.; Chen, J. Active phase drift cancellation for optic-fiber frequency transfer using a photonic radio-frequency phase shifter. Opt. Lett. 2014, 39, 2346–2349. [Google Scholar] [CrossRef] [PubMed]
- Walls, F.L.; Allan, D.W. Measurements of frequency stability. Proc. IEEE 1986, 74, 162–168. [Google Scholar] [CrossRef]
Disclaimer/Publisher’s Note: The statements, opinions and data contained in all publications are solely those of the individual author(s) and contributor(s) and not of MDPI and/or the editor(s). MDPI and/or the editor(s) disclaim responsibility for any injury to people or property resulting from any ideas, methods, instructions or products referred to in the content. |
© 2023 by the authors. Licensee MDPI, Basel, Switzerland. This article is an open access article distributed under the terms and conditions of the Creative Commons Attribution (CC BY) license (https://creativecommons.org/licenses/by/4.0/).