Article

Microresonator Effective Thermal Parameters Definition via Thermal Modes Decomposition

by
Vladislav I. Pavlov
1,2,3,*,
Nikita M. Kondratiev
4,
Artem E. Shitikov
3 and
Valery E. Lobanov
3,*
1
Russian Metrological Institute of Technical Physics and Radio Engineering, 141570 Moscow, Russia
2
Faculty of Physics, Lomonosov Moscow State University, 119991 Moscow, Russia
3
Russian Quantum Center, 30 Bolshoy Boulevard, Building 1, Skolkovo Innovation Center Territory, 121205 Moscow, Russia
4
Technology Innovation Institute, Abu Dhabi 9639, United Arab Emirates
*
Authors to whom correspondence should be addressed.
Photonics 2023, 10(10), 1131; https://doi.org/10.3390/photonics10101131
Submission received: 8 September 2023 / Revised: 3 October 2023 / Accepted: 7 October 2023 / Published: 9 October 2023
(This article belongs to the Special Issue Advances in Optical Microresonators)

Abstract

:
High-Q optical microresonators are particularly efficient practical tools of modern applied optics and photonics. Using them, one inevitably faces the problem of thermal effects. Accurate determination of effective thermal parameters of high-Q microresonators (effective thermal relaxation rate and optical absorption rate) is of particular importance for developing microresonator-based devices. Our investigation looks into diverse methodologies to estimate these effective parameters for such systems, ultimately revealing a divergence between the commonly employed simplified model, the direct numerical approach, and classical analytical formulas. We introduce a novel approach to calculate effective parameters based on the decomposition of the thermal field into microresonator thermal modes, which inherently considers the intricate geometry and material anisotropy inherent in microresonators, as well as the influence of external conditions. The method for the accurate determination of the effective thermal parameters of the microresonator for corresponding thermal modes is developed. As a result of applying this method, we modified the classical approach for the simulation of thermal effects in optical microresonators for better agreement with the numerical simulations. By accounting for the complexities of microresonator shapes, material properties, and external factors, our proposed method contributes to a more accurate understanding of thermal dynamics and enhances the predictive capabilities of simulations for these systems. We demonstrated the application of this method on the example of integrated microring resonators, but it can be used to analyze thermal effects in other microresonator platforms.

1. Introduction

Nowadays, high-Q microresonators [1,2] are widely and successfully used in various areas of science and technology, including metrology, spectroscopy, laser physics, quantum optics, and photonics [3,4,5,6,7,8,9,10]. However, their use is often complicated by the inevitable manifestation of thermal effects [11,12,13]. The absorption of optical power in a microresonator causes additional heating and, consequently, a shift in its eigenfrequencies due to the thermorefractive and thermal expansion effects. Thermally induced noise, drifts, fluctuations, and instabilities [12,14,15,16,17,18,19,20,21] affect the dynamics of linear and nonlinear processes in the microresonator-based setups, e.g., the generation of optical frequency combs and dissipative solitons [20,22,23,24,25,26,27] and laser stabilization [28,29,30]. On the other hand, these effects were also sometimes beneficial, providing possibilities of tuning resonant frequencies that are important for various applications, including high-sensitivity temperature sensors and bolometers [31,32,33,34,35,36,37], tunable filters [38,39,40], control of resonant properties of photonic molecules [41,42,43], and nonlinear optical interactions [27,44,45,46,47,48,49].
Thus, for accurate simulation of linear and nonlinear processes in optical microresonators and the development of effective microresonator-based devices, it is essential to estimate the effective microresonator thermal parameters, such as effective thermal relaxation rate and effective optical absorption rate (and, consequently, effective thermal nonlinearity value), defining the dynamics of thermal processes in such structures. Especially, this issue is of paramount importance for the compact on-chip structures widely studied and developed nowadays.
Integrated photonic platforms find their foundation in a variety of materials, including LiNbO 3 [50,51,52,53], Si [54,55,56], AlGaAs [57,58,59,60], GaP [61], TiO 2 [62], and others. However, the noticeable progress in recent decades in the technology of manufacturing integrated silicon nitride (Si 3 N 4 )-based photonic structures has led to increasing utilization of this platform in addressing actual problems in optics and photonics. Such a variety of devices based on Si 3 N 4 integrated technology is beneficial for silicon nitride low losses in the telecommunications wavelength range, the absence of two-photon absorption, manufacturing reproducibility, and high nonlinearity [63,64,65]. It is also shown in [66] that irradiation with high-energy protons does not have a long-term effect on the linear optical losses of silicon nitride structures, which opens up prospects for space applications.
One of the most promising types of integrated structures are high-Q optical microresonators, which are widely used to create compact, highly stable lasers [67,68,69] and compact generators of optical frequency combs [70,71,72,73]. However, light absorption leads to inevitable heating and, consequently, to thermal effects [11,12,13,50], such as the thermo-optical and thermal expansion effects. Previously, it was shown that these effects strongly influence the dynamics of various processes, including nonlinear processes [24,74] and thermomechanical fluctuations in optical microresonators [14,18]. Therefore, in order to accurately model these processes, it is necessary to describe the dynamics of thermal processes accurately.
In numerous studies, the rate equation is employed to represent microresonator thermal dynamics, consequently determining the thermal shifts of microresonator eigenfrequencies [21,22,24,50]. Nevertheless, our prior investigation [75] highlighted that such an approach might need more accuracy under specific conditions. For a more precise description of the thermal dynamics, we propose a universal approach based on the decomposition of the thermal field into microresonator thermal modes [76,77]. We demonstrated the application of this method on the example of integrated microring resonators, but it can be used to analyze thermal effects in other microresonator platforms as well.

2. Modeling of Thermal Effects in Optical Microresonators

Let us consider the description of thermal effects in optical microresonators using the example of an on-chip microring resonator (see Figure 1). The electromagnetic field in microresonators is confined to a small volume compared to the entire microchip. The heat conduction equation for the integrated microresonator can be written as [13]
T ( r , t ) t D T · Δ T ( r , t ) = Q ( r ) C p ρ , T ( r , 0 ) = T 0 , r T ( 0 , t ) = 0 , k T | S t = h a i r ( T T 0 ) , k T | S b = h a i r ( T T 0 ) , T | S s = T 0 ,
where D T = k C p ρ is the thermal diffusion coefficient, k is the thermal conductivity, C p is the heat capacity, ρ is the density of the microresonator material. Q ( r ) is the power of the heat sources per unit volume for the m-th microresonator mode, which is equal to the optical mode power density absorbed in the waveguide Q ( r ) = P · | e m ( r ) | 2 | e m ( r ) | 2 d V , P is the part of the optical power coupled into the m-th mode that is absorbed in the microresonator material, leading to its heating (see color map in Figure 1), T 0 is the ambient temperature, and h a i r is the heat transfer coefficient ≈ 10 W/(m 2 · K) for convective air cooling. S t and S b are the top and bottom surfaces of the microchip, S s is the side surface, and e m ( r ) is the microresonator m-th mode profile. The complexity of this system, represented by Equation (1), makes it challenging to effectively simulate the dynamics of an electromagnetic field while considering the influence of the thermal effects in microresonators. Thus, usually, simplified semi-empirical rate equations are used. In the following, we briefly consider their introduction and thermal parameters for determination.
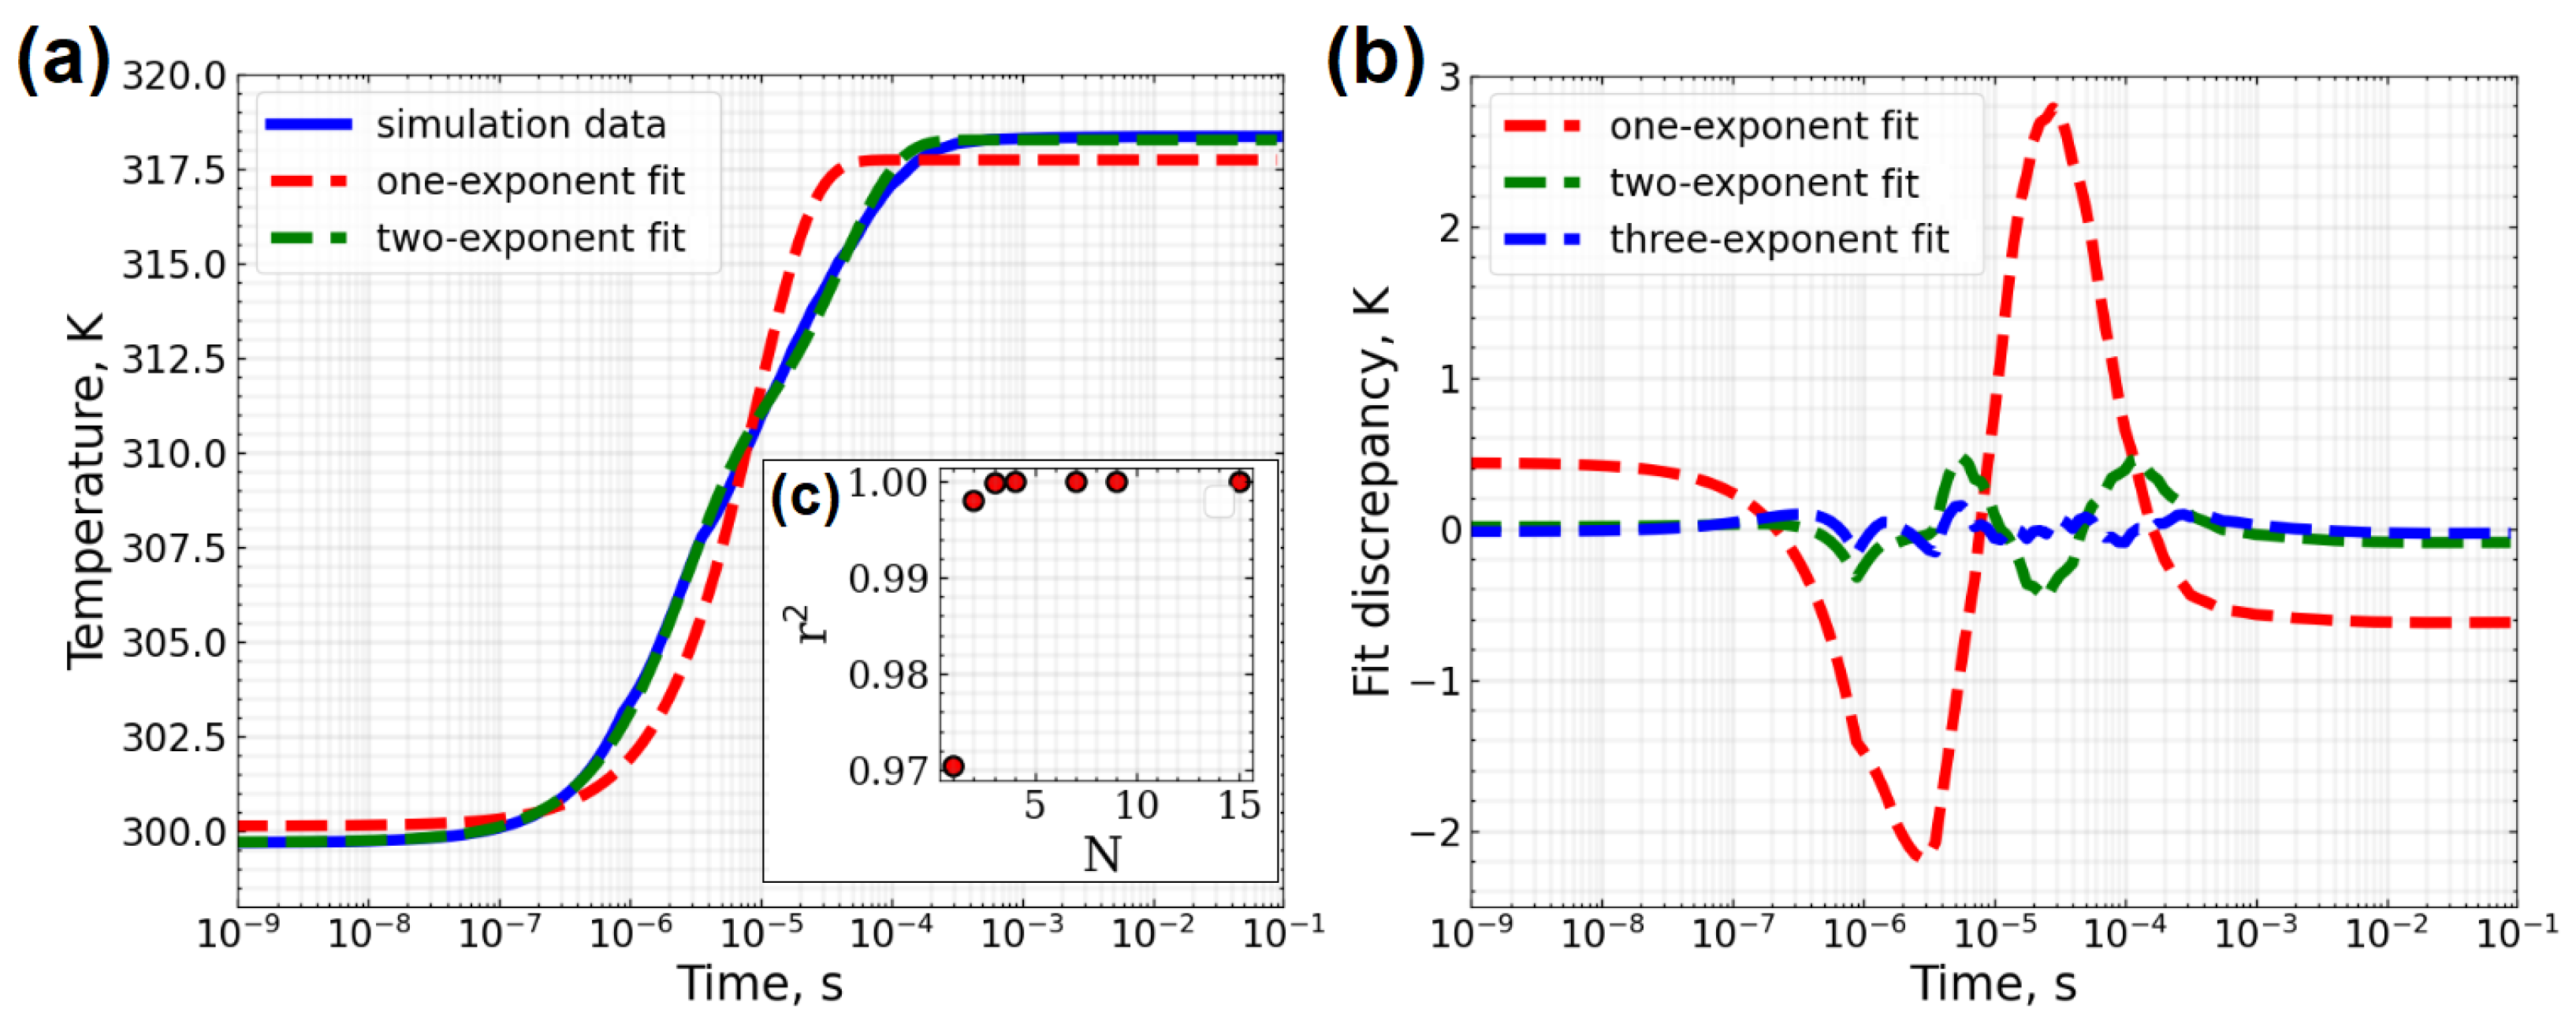
As an example, we performed finite element modeling (FEM) using COMSOL Multiphysics of temperature dynamics during constant heating for the configuration presented in Figure 1 with default material and geometrical parameters specified in Table 1 and Table 2. Obtained results for P = 10 mW heating of 24 μ m ring resonator with waveguide width d r = 1 μ m and height d z = 0.8 μ m are shown in Figure 2a.

3. Effective Parameters Determination Methods

3.1. Analytical Formulas

The temperature change δ T = ( T ( t ) T 0 ) from the room temperature T 0 caused by the intracavity heating power P is usually calculated with the rate equation [24,27,50]. If we average (1) by multiplying by the square modulus of the field of the electromagnetic mode of the microresonator | e m ( r ) | 2 and integrating by the volume of the microresonator, using Green’s formula for the second term of the equation, we can obtain the following expression (also known as the rate equation) [13]:
d δ T d t = δ θ δ T + γ P ,
where γ = 1 ρ C p | e m ( r ) | 4 d V | e m ( r ) | 2 d V 2 and δ θ = D T 2 | e m ( r ) | 2 d V | e m ( r ) | 2 d V . Effective thermal relaxation rate δ θ and effective optical absorption rate γ depend on the microresonator configuration. Effective thermal relaxation rate determines the time of establishment of thermal equilibrium. The combination of δ θ and γ determines the magnitude of the temperature change and, consequently, thermal mode shift value and hence the magnitude of the effective thermal nonlinearity.
When heating occurs due to the absorption of the electromagnetic field of the m-th mode excited in the microresonator by external laser, P can be written as
P = n 0 2 ϵ 0 | A m | 2 ω m | e m ( r ) | 2 d V 2 Q a b s ,
where A m is slowly varying amplitude of mth mode, Q a b s is a part of Q-factor, determined by the heat-related absorption, ω m is microresonator circular eigenfrequency of the pumped mode, and n 0 is refractive index of the microresonator material and ϵ 0 is vacuum dielectric constant. In order to convert the temperature change δ T into a pumped mode resonance frequency shift δ ω , it is possible to use the relation:
δ ω = 1 n 0 d n 0 d T ω m δ T .
Then, passing from the temperature change in (2) to the thermal frequency shift, we can write the following equation:
d δ ω d t = δ θ δ ω + γ d n 0 d T n 0 ϵ 0 | A m | 2 ω m 2 | e m ( r ) | 2 d V 2 Q a b s .
This equation is similar to the one usually used for the analysis of nonlinear processes in Kerr medium. Thus, it allows to compose an effective thermal nonlinearity coefficient n 2 T depending on δ θ and γ :
n 2 T = α γ δ θ n T | e m ( r ) | 2 d V ,
where α is absorption coefficient in 1/m ( Q a b s = n 0 ω m α c , c is speed of light). It is convenient to compare this parameter with the value of the Kerr nonlinearity n 2 in order to understand which nonlinear mechanism will prevail [21,22,27,46,74]. Note that additional spectral components may appear in Kerr microresonators due to the process of four-wave mixing [6,7,22] that should be taken into account in (3).
Using Gaussian approximation of optical fields in δ θ and γ from Equation (2), one can obtain the estimations for thermal parameters for the considered microresonator:
δ θ theor = 2 D T 1 r r 2 + 1 r z 2 ,
γ theor = 1 ρ C p V ,
where r r and r z are mode transverse profile half-width and half-height, respectively, V 2 π 2 r r r z R 0 is mode volume, R 0 is the microresonator radius. In the case of a ring waveguide, the mode dimensions can be well-approximated with the guide cross-section half-widths r r d r / 2 and r z d z / 2 .

3.2. Thermal Dynamics Approximation by the Sum of Exponents

We considered the model of microresonator thermal relaxation due to thermal conductivity. However, suppose the power changes or the pump frequency is tuned very slowly. In that case, besides thermal conductivity in Si 3 N 4 , microring other processes may also appear, in particular thermal relaxation of the entire microchip as a whole due to air convection and thermal conductivity of the silicon substrate [11]. Thus, there may be several thermal relaxation times associated with processes in different thermal subsystems of microchip. This leads to the appearance of the additional thermal effective parameters, and, as a consequence, for a more accurate description of the thermal dynamics (see Figure 2), it is necessary to use several rate equations [24,27,50]:
d δ T ( k ) d t = ( δ θ ( k ) δ T ( k ) + γ ( k ) P ) ,
so that δ T = δ T ( k ) is the sum of partial modal contributions δ T ( k ) . Then, δ θ ( k ) and γ ( k ) are, respectively, the effective thermal relaxation rate and the effective optical absorption rate of the kth thermal mode.
Further, we compare two theoretical methods for the determination of the effective microresonator thermal parameters from the data obtained by the numerical solution of (1) for the setup shown in Figure 1. Within the first method, we obtain the effective parameters by approximating the temperature dependence obtained numerically (solid line in Figure 2a) by the sum of the formal solution of (9) with a step-like excitation:
δ T ( k ) ( t ) = γ ( k ) P δ θ ( k ) + δ T 0 γ ( k ) P δ θ ( k ) e δ θ ( k ) t .
where initial temperature deviation δ T 0 = 0 . As result, we obtain the effective γ ( k ) and δ θ ( k ) .
The coefficient of determination r 2 is used to estimate the accuracy of the approximation method:
r 2 = 1 i ( T i ( t i ) T ( t i ) ) 2 i ( T i ( t i ) T ¯ ) 2 ,
T i (t i ) is the dataset of the temperature from numerical simulation, where each T i is associated with the time moment t i , and T ¯ is the mean value of dataset T i (t i ) used for the normalization. The fitted value of the temperature T(t i ) was obtained using a sum of the expressions with effective parameters (10). For the range of parameters where the approximation method is in good agreement with the numerical simulation data, r 2 tends to 1 (see Figure 2c), and, for the range with poor agreement, r 2 decreases. This effect is explained by the fact that the actual dependence of the temperature on time during heating is a more complex function than the solution of (2) that is an exponential dependence.

3.3. Thermal Mode Decomposition Method

Within the second method, we use the fact that the general solution of the system (1) can be represented as decomposition into the microresonator thermal modes [77]:
T ( r , t ) = k = 1 N T 0 ( k ) C ( k ) ( r ) e δ θ ( k ) t ,
where T 0 ( k ) and C ( k ) ( r ) are amplitude and spatial shape of the thermal mode, δ θ ( k ) is eigenvalues corresponding to the times of thermal relaxation of various “thermal subsystems”. We should note that formal mode eigenvalues δ θ ( k ) introduced here and thermal relaxation rates introduced in previous subsection are not the same. However, as we obtain the same form of equations for the same system, it looks like they should tend to each other with increasing the number of exponents in the fit. In the following, we study this assumption.
In order to obtain C ( k ) ( r ) and δ θ ( k ) , using COMSOL Multiphysics, we numerically solved the eigenvalue problem in the thermal domain for the microring resonator shown in Figure 1:
D T Δ C ( k ) ( r ) = δ θ ( k ) C ( k ) ( r ) .
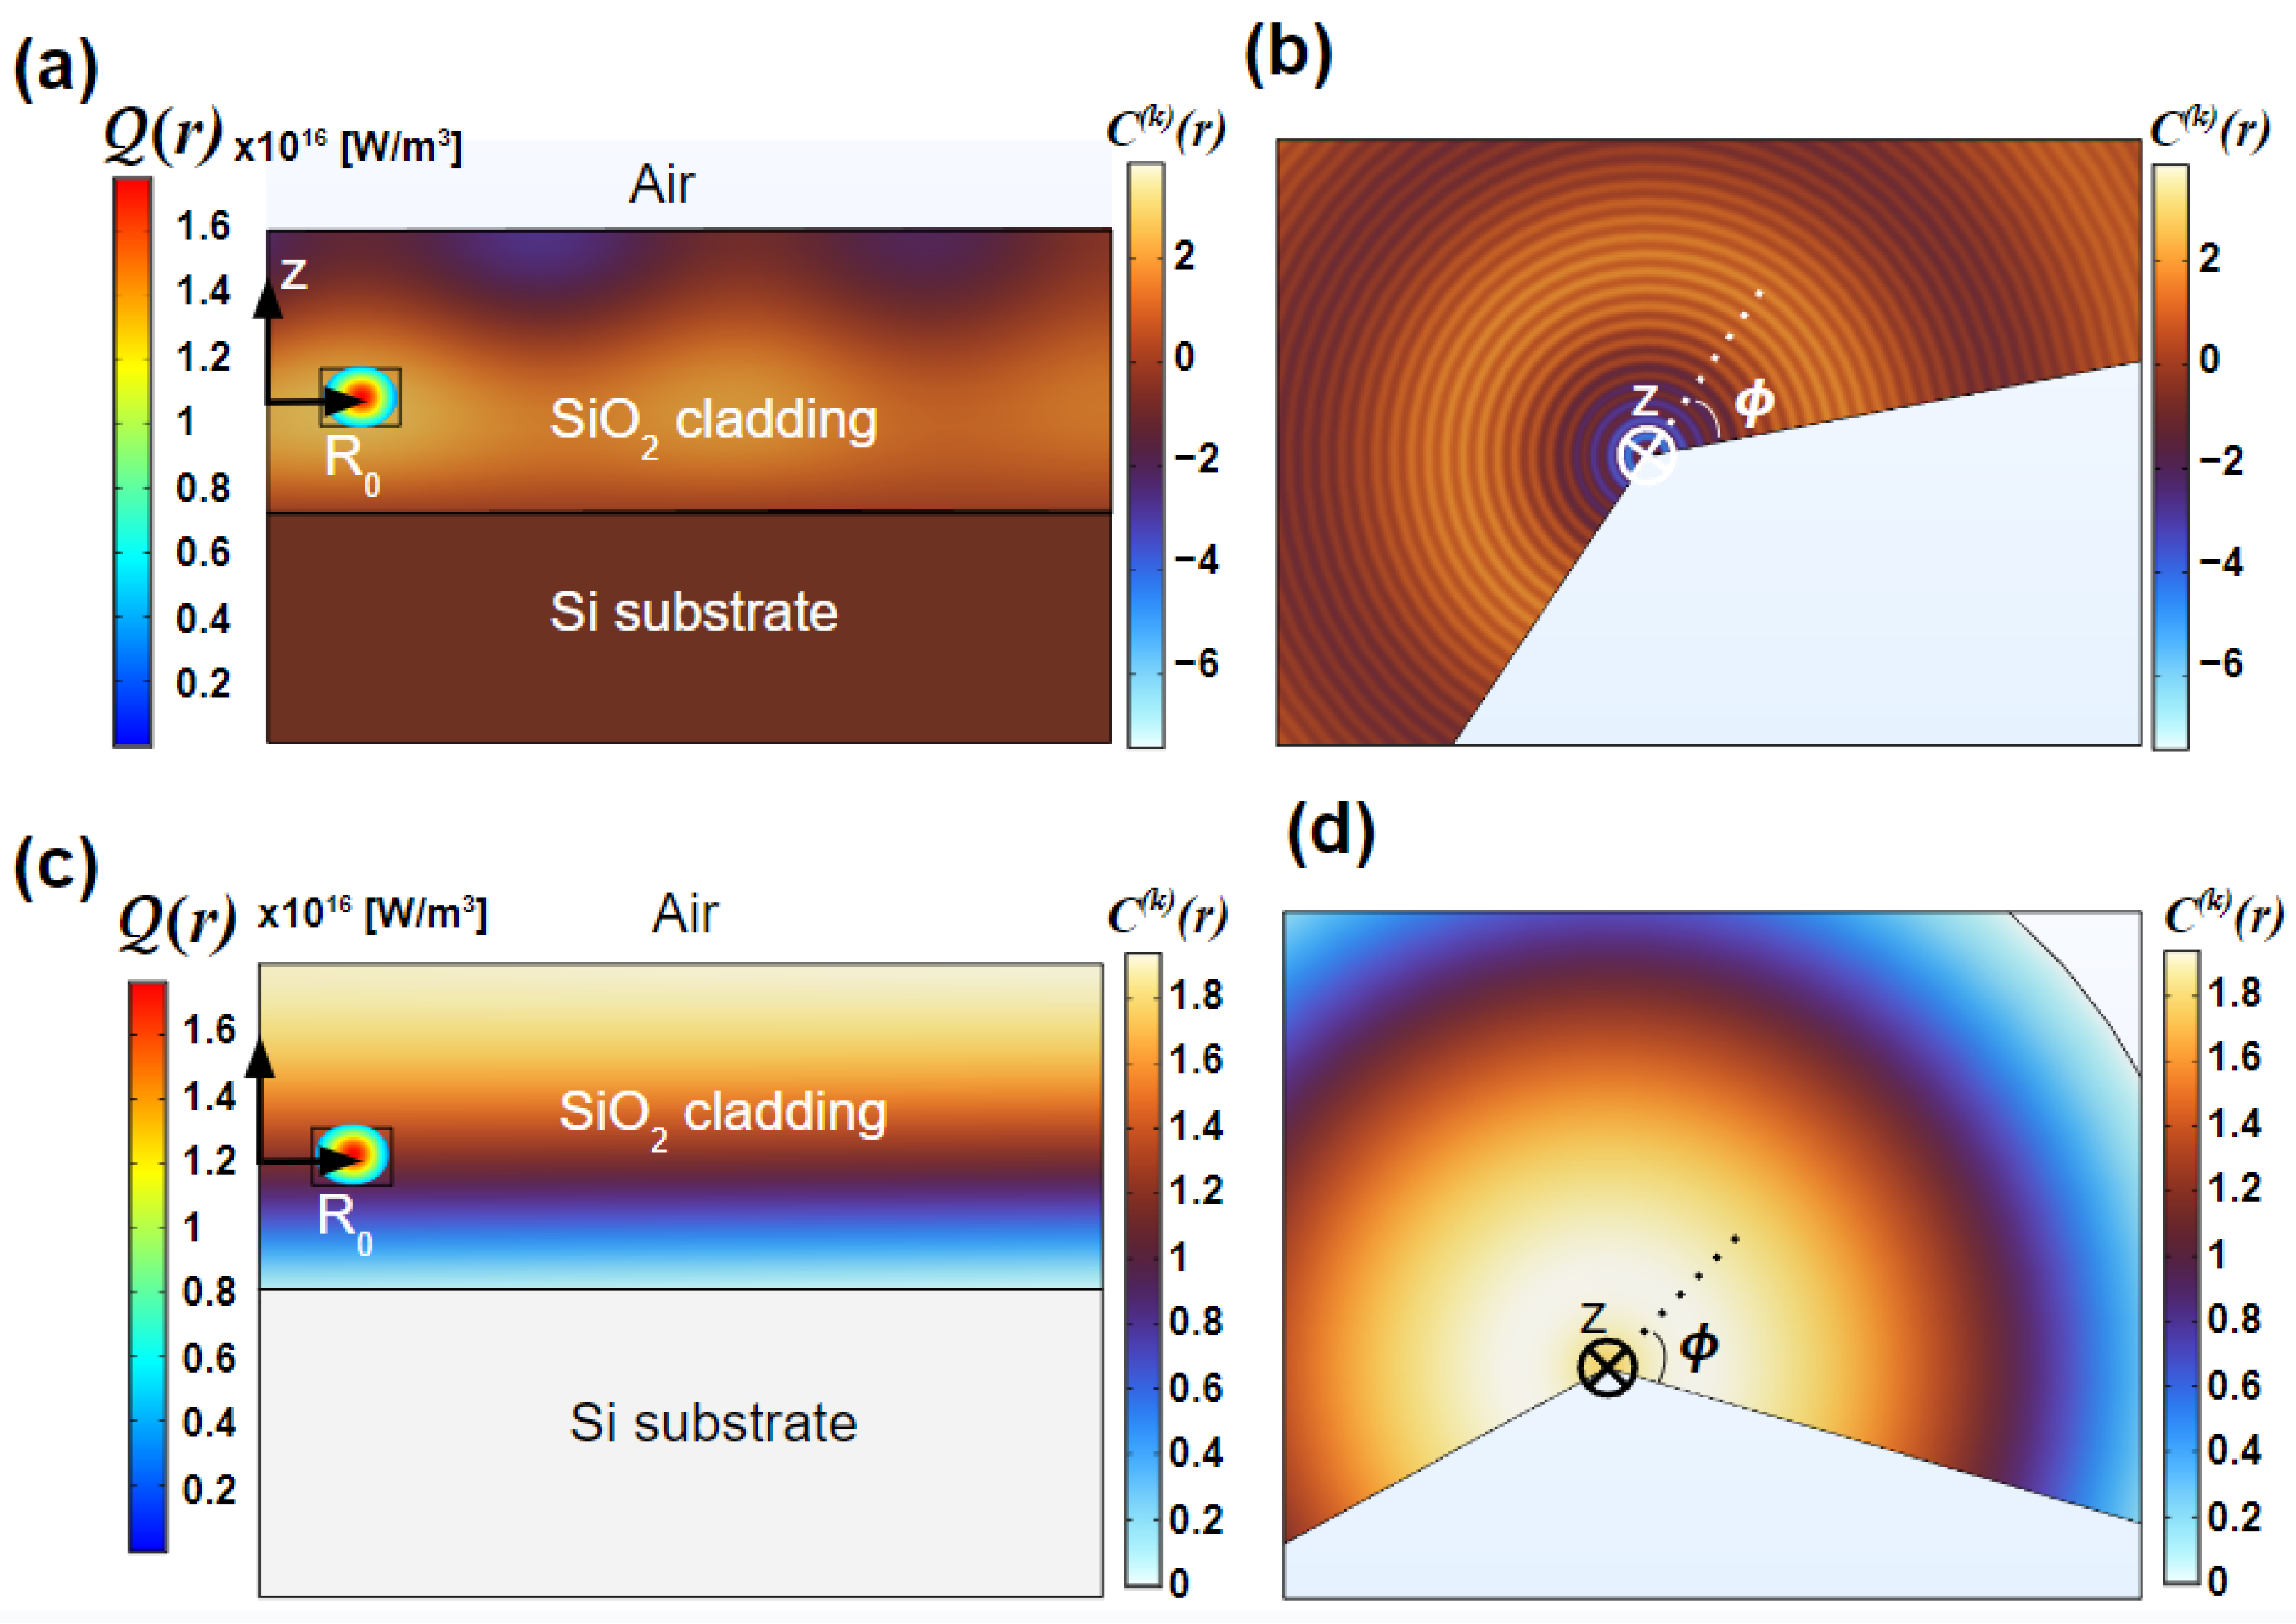
As a result, we obtained mode shapes C ( k ) ( r ) (normalized to 1 Kelvin) and eigenvalues δ θ ( k ) (see Figure 3). We substituted the solution (12) into Equation (1) and multiplied the resulting expression by the normalized mode shape C ( k ) C ( k ) ( r ) · C ( k ) ( r ) d V and integrated over volume. We numerically checked that thermal modes form an orthogonal basis such that C ( k ) ( r ) · C ( m ) ( r ) d V C ( k ) ( r ) · C ( k ) ( r ) d V = δ k m , where δ k m is the Kronecker symbol. Using the orthogonality of thermal modes, we obtained the rate equations for the thermal modes similar to (9):
d δ T ( k ) d t = δ θ ( k ) δ T ( k ) + 1 P C ( k ) ( r ) · Q ( r ) d V C ( k ) ( r ) · C ( k ) ( r ) d V P ρ C p ,
where δ T ( k ) = T 0 ( k ) e δ θ ( k ) t . It can be seen that the expression on the right side (14) coincides in dimension with γ ( k ) in Equation (9):
γ ( k ) = 1 P C ( k ) ( r ) · Q ( r ) d V C ( k ) ( r ) · C ( k ) ( r ) d V 1 ρ C p .
We calculated the expression (15) for each thermal mode shape C ( k ) ( r ) . Examples of shapes C ( k ) ( r ) in Figure 3a,b correspond to the thermal mode with the maximum overlap integral C ( k ) ( r ) · Q ( r ) d V C ( k ) ( r ) · C ( k ) ( r ) d V , and (c), (d) correspond to the slowest thermal mode of the cladding subsystem. To obtain the exponent amplitude, we normalized the expression (15) to δ θ ( k ) . The resulting spectrum of exponent amplitude γ k / δ k obtained from (15) is shown by the stem line in Figure 4. We studied the dependence of the effective parameters on the number N of exponents. In Figure 4, the number of exponents and the corresponding effective parameters are indicated by different symbols (on the horizontal axis—effective thermal relaxation rate δ θ , on the vertical axis—the amplitude γ / δ θ of the exponent from Equation (10), δ T 0 = 0, P = 1 W).
It can be seen in Figure 4 that the effective thermal relaxation rate corresponding to the maximum of the exponent amplitude spectrum γ ( k ) / δ θ ( k ) obtained by the thermal mode decomposition method (stem lines) is very close to the effective thermal relaxation rate for the case of one-exponent approximation (N = 1, lime square). However, in such a spectrum, several other peaks are observed that are comparable in amplitude with the maximum one (for example, at δ θ 10 6 ). Nonetheless, the sum of all amplitudes γ ( k ) / δ θ ( k ) for all thermal modes is equal to the amplitude for the one-exponent approximation. This fact demonstrates the fulfillment of the energy conservation law. Note that, when we decompose into thermal modes, the coefficient of thermal nonlinearity n 2 T is also split into the set of n 2 T ( k ) (see Equation (6)), and the sum n 2 T ( k ) is equal to the initial one ( n 2 T ( k ) = n 2 T ). Each coefficient corresponds to the effective thermal relaxation rate δ θ ( k ) .
Increase in the number of exponents (from 1 to 15) leads to a gradual decomposition of the temperature dynamics into thermal modes, where the eigenvalues correspond to effective thermal relaxation rates in exponents, and the amplitudes of the spectral components (Figure 4, stem lines) correlate with the amplitude of the exponent. However, after N = 9 exponents (Figure 4, green stars), the values of the effective thermal relaxation rates δ θ ( k ) and exponent amplitudes stop changing. Thus, convergence in the number of exponents can be a mathematically rigorous criterion for the optimal number of exponents.
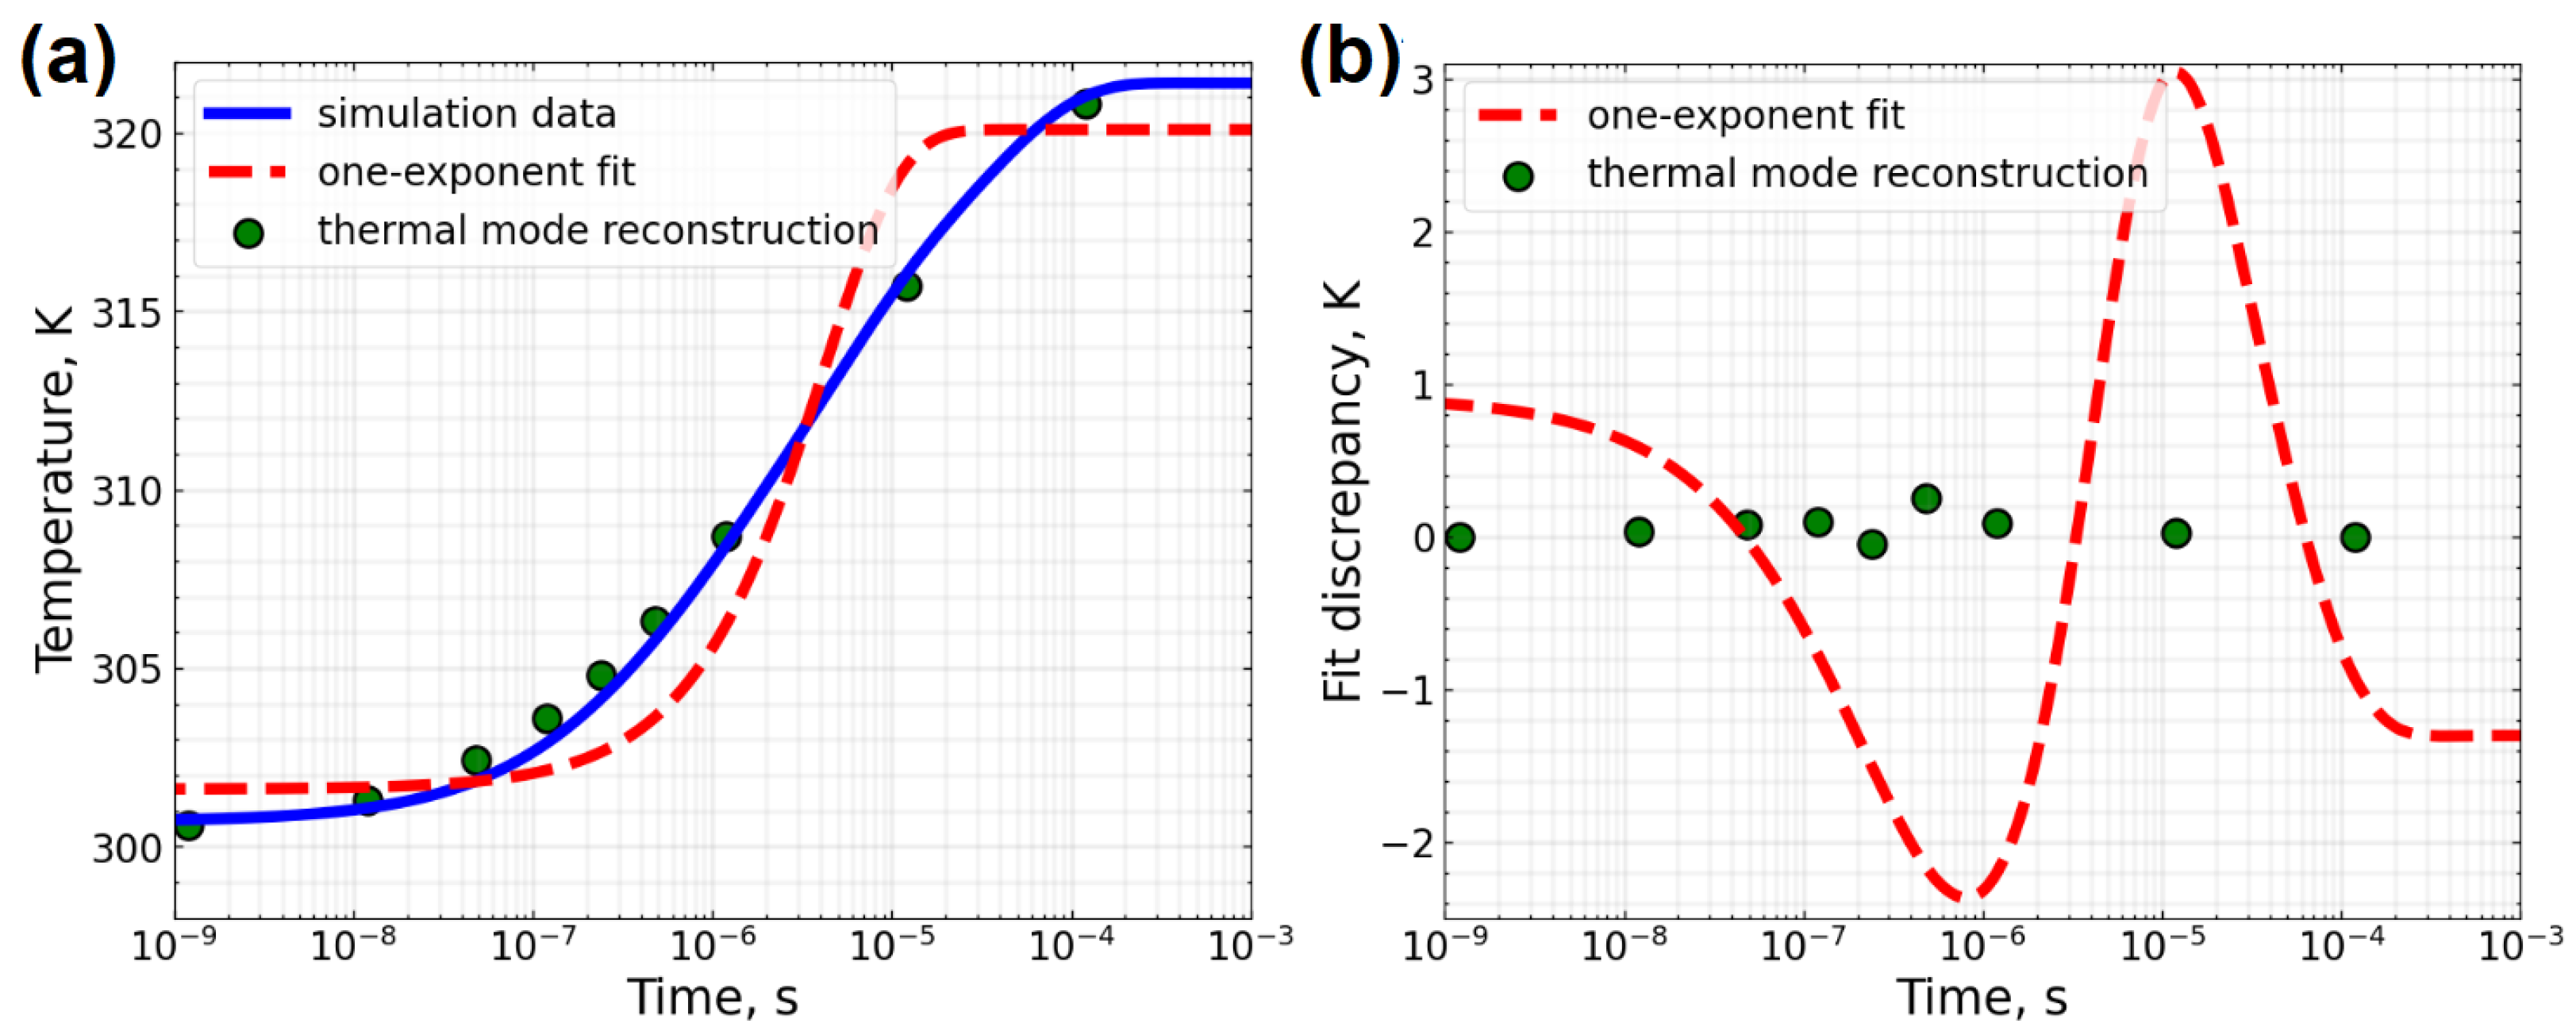
In order to test our thermal mode decomposition, we reconstructed the temperature dynamics from the exponent amplitude spectrum (see stem lines in Figure 4), substituting into Equation (10) thermal mode eigenvalues δ θ ( k ) and γ ( k ) (see Equation (15)) for these thermal modes. As a result, we obtained a good agreement between the reconstructed dynamics and the simulation data (see Figure 5). Thus, two independent approaches to thermal mode decomposition converge to the same result.

3.3.1. Thermal Modes Existence Range

We studied analytically and numerically thermal modes existence range. It was revealed that one can limit the range of the effective thermal relaxation rates δ θ ( k ) using analytical formulas. First, it was found numerically that possible values of δ θ ( k ) for microresonator thermal modes (stem lines in Figure 4) are limited from above by the value δ θ theor (from Equation (7)) describing thermal processes in the waveguide material (solid red line with red circle in Figure 4).
Also, it was noticed that the effective thermal relaxation rates used for multi-exponent approximation do not agree well with the analytical effective thermal relaxation rate (7) and corresponding exponent amplitude. It can be seen in Figure 4 that thermal modes (stem lines in Figure 4) near the theoretical value (7) (solid red line with red circle in Figure 4) have low amplitudes (less than 10 0 K/W and significantly smaller than exponent amplitude defined by Equations (7) and (8) shown by the red circle) and, accordingly, low contributions to the temperature dynamics. This effect is associated with the presence of thermal conductivity of the cladding, which limits the effective thermal relaxation rate. Thus, if the thermal conductivity of the cladding is substituted into the analytical Formula (7) instead of the thermal conductivity of the waveguide, then we obtained a limitation on δ θ ( k ) when the amplitudes of the exponents are still comparable (red dotted line with red rhombus, Figure 4):
δ θ mod = 2 k c l a d C p ρ 1 r r 2 + 1 r z 2 .
Only for the case of four exponents (purple triangles, Figure 4), the fastest effective thermal relaxation rate coincides with the analytical Formula (16).
Another factor influencing the limitation of the effective parameters at high thermal conductivity is the thickness of the cladding and the presence of a silicon substrate, which efficiently removes heat due to the high thermal conductivity. We found that the boundary with silicon is approximately equivalent to the boundary with a fixed temperature. We also found that the slowest effective thermal relaxation rate of the cladding subsystem is related to the cladding thickness. To calculate the slowest thermal mode of the cladding subsystem, we temporarily removed the silicon substrate from the model and replaced silicon substrate with a fixed temperature boundary T 0 . We further generalize Formulas (7) and (16) to find analytical approximation of this cut-off, substituting corresponding subsystem parameters into the formula. In this way, for cladding, substituting the cladding thickness H c l a d instead of r r 2 and r z 2 , we obtain (Figure 4, dashed red line):
δ θ slow = 4 · k c l a d C p c l a d ρ c l a d H c l a d 2 ,
where H c l a d is SiO 2 cladding thickness (see Figure 1). Doing the same for the substrate, we obtain the lowest relaxation rate of the whole system (Figure 4, dash-dotted red line):
δ θ chip = 4 · k S i C p S i ρ S i H c h i p 2 .
This also implies that putting the system on a bigger mount can bring more low-frequency modes. However, they will not make high impact due to low amplitudes, and the lowest significant frequency will be defined by the cladding subsystem.
As a result, we obtained the region of existence of relaxations δ θ ( k ) [ δ θ chip ; δ θ theor ] and the region where the amplitudes of the exponents are comparable (the same order of magnitude) δ θ ( k ) [ δ θ slow ; δ θ mod ] .

3.3.2. Comparison with Experiment

Our results are in good agreement with the experimentally measured values for a similar integrated microresonator [78], which indicates the correctness of the chosen model and method. In [78], effective thermal relaxation rates for different times during the cooling were measured. The data of such a measurement are fitted with the sum of two exponents in order to take two different thermal time scales into account. The faster of the two time scales is 760 ns, and the slower is 14 µs. At the same time, Figure 2c shows that further addition of the number of exponents quickly reaches 1 in approximation accuracy (r 2 ). Hence, for simple applications, where only the shape of the relaxation curve in a particular heating process is of interest, two exponents are sufficient, judging by r 2 . However, we can see that the 2-exponent case does not capture the thermal mode with the highest exponent amplitude, which is there for all other exponent numbers N. So, for more complex processes, where individual thermal eigenfrequencies can respond, this may not be enough, and exponent number convergence should be searched for.

4. Discussion

4.1. Applicability Range and Accuracy Analysis of Microresonator Thermal Parameters Estimation Methods

As mentioned in the previous section, the effective parameters can be estimated using three methods—analytical formulas, approximation of numerical simulation, and thermal mode decomposition. We compared these methods in a wide range of parameters, including the thermal conductivity of the microresonator materials, the geometrical dimensions of the waveguide, and the position of the waveguide relative to the cladding.
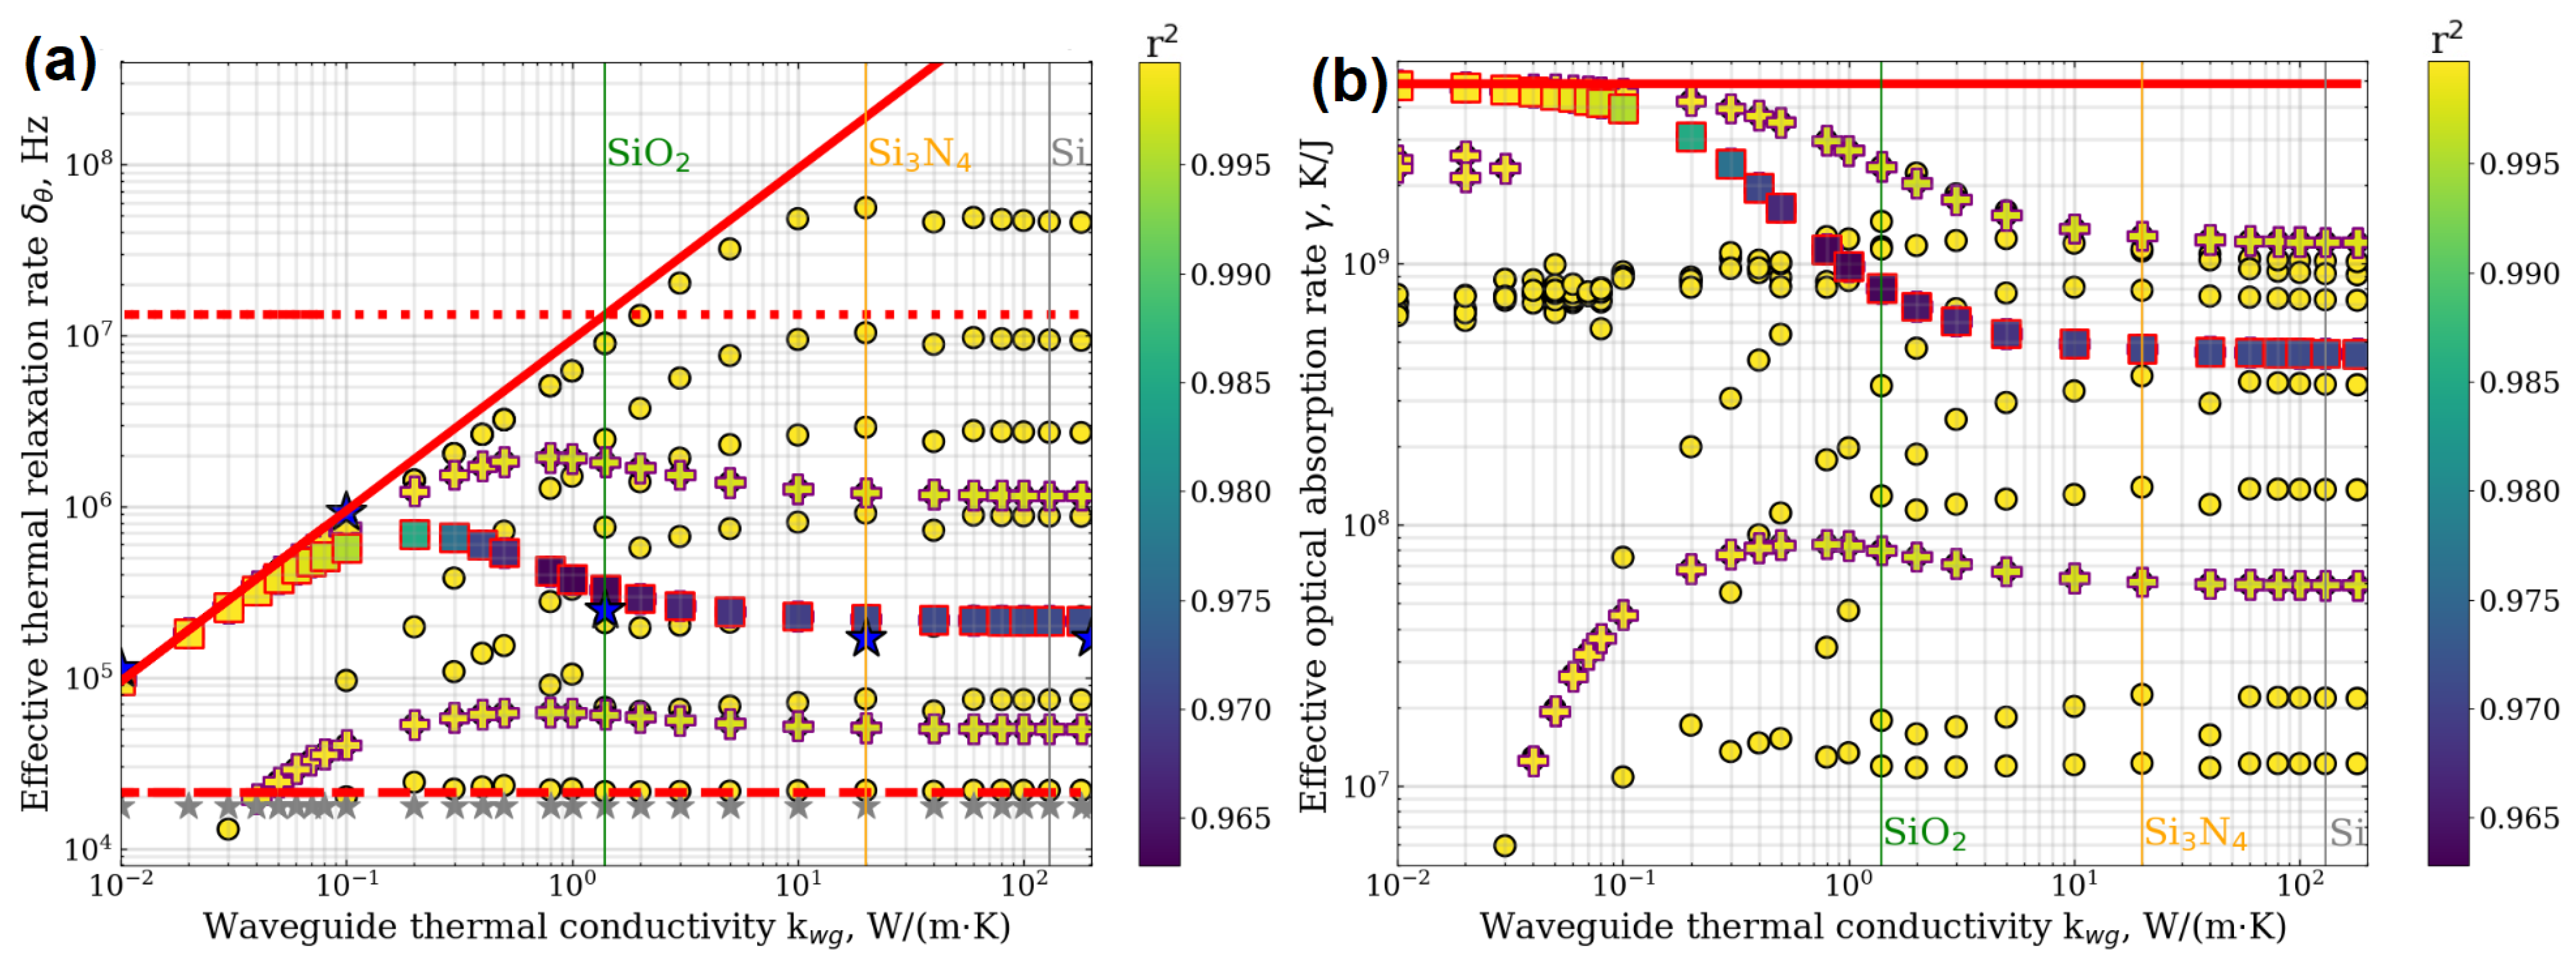
In Figure 6, the dependencies of the effective thermal relaxation rate and effective optical absorption rate on the thermal conductivity of the waveguide calculated using three methods are presented. The red line indicates the analytical dependence using Formulas (7) and (8) in Figure 6a,b, respectively. It can be seen that, with an increase in the thermal conductivity of the waveguide, the value of the effective thermal relaxation rate increases linearly. At low values of the waveguide thermal conductivity (k wg < 10 1 W/(m·K)), all methods provide the same result that is well-described by analytics (7). However, the effective thermal relaxation rates obtained by both numerical methods, approximations by sum of exponents (Equation (10), case N = 1—squares, N = 2—crosses, and N = 7—circles) and maximal-amplitude relaxation from the thermal modes decomposition (blue stars), in contrast to the analytical ones, tend to saturate with increasing thermal conductivity and are close to the values obtained from one-exponent approximation.
The coefficient of determination r 2 indicated by the color code in Figure 6 was used to estimate the accuracy of the fitting method. However, with an increase in k wg , it can be seen that the effective thermal relaxation rate for the case of two (N = 2) exponents fit (crosses, Figure 6) is split at k wg ≈ 10 1 W/(m·K) into two effective parameters, δ θ ( 1 ) and δ θ ( 2 ) . Moreover, the maximum of the exponent amplitude spectrum (blue stars, Figure 6) from stem lines in Figure 4 is between the fast and slow effective thermal relaxation rate branches and coincides with the empirical exponent. Figure 6 shows that adding the second exponent (N = 2, Equation (9)) increases r 2 for a real microresonator from 0.97 to 0.995. Note that numerical eigenvalues for the slowest thermal modes of the cladding subsystem—i.e., calculated without silicon substrate—are well-described by Equation (17) (grey stars and dashed line in Figure 6a) over a large range of the waveguide thermal conductivity k wg . Also, it is clearly seen that almost all effective thermal relaxation rate values are in the range between red dotted (Equation (16)) and red dashed (Equation (17)) lines in Figure 6a.
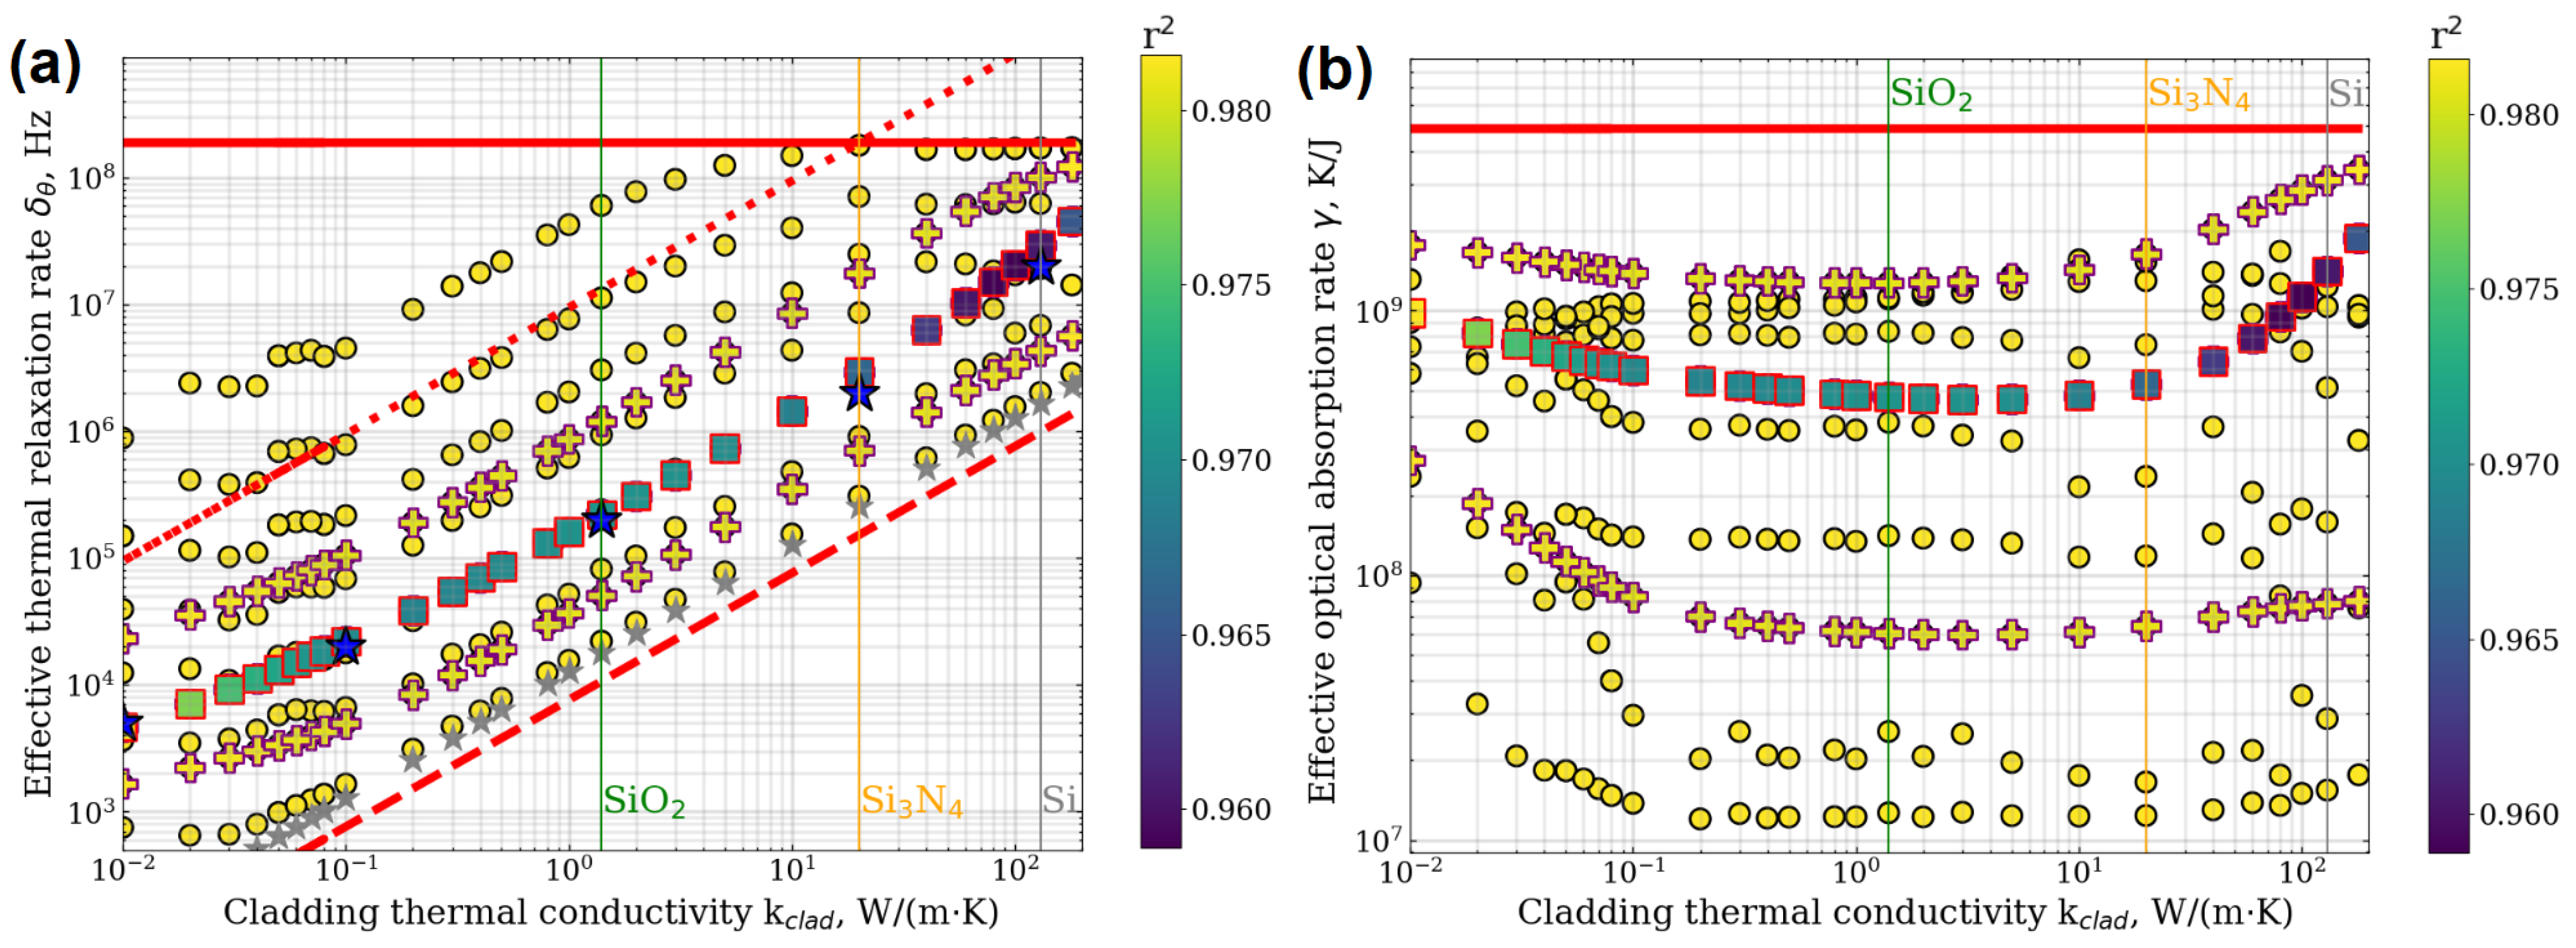
To confirm our proposed method and formulas, we further investigated the dependence of the effective parameters on the cladding thermal conductivity k c l a d . It can be seen from Figure 7 that the effective thermal relaxation rate depends almost linearly (dotted red line, Figure 7a) on the thermal conductivity k c l a d , which is in good agreement with the Formula (16) we proposed earlier. One can see that numerical eigenvalues for the slowest thermal modes of the cladding subsystem over a large range of the cladding thermal conductivity k c l a d are well-described by Equation (17) (see dashed line and grey stars in Figure 7a) and are close to the smallest relaxation rate values for the multi-exponent approximation (compare the positions of grey stars and lowest circles in Figure 7a). Also, it is clearly seen that almost all effective thermal relaxation rate values are in the range between red dotted (Equation (16)) and red dashed (Equation (17)) lines in Figure 7a.
Next, to test our methods and formulas, we studied the temperature dynamics for different microchip geometries. Figure 8 shows the dependence of the effective parameters on the microresonator radius R 0 . It can be seen that the use of more exponents provides the same approximation accuracy over the entire range of radii R 0 , in contrast to the classical approach (N = 1). From Figure 8, we can conclude that the effective thermal relaxation rates do not depend on the radius of the integrated microresonator.
It should be noted that the numerical eigenvalues for the slowest thermal modes of the cladding subsystem (grey stars, Figure 8a) are well-described by Equation (17) over a large range of microresonator radius R 0 . Also, it is clearly seen that almost all effective thermal relaxation rate values are in the range between red dotted (Equation (16)) and red dashed (Equation (17)) lines in Figure 8a.
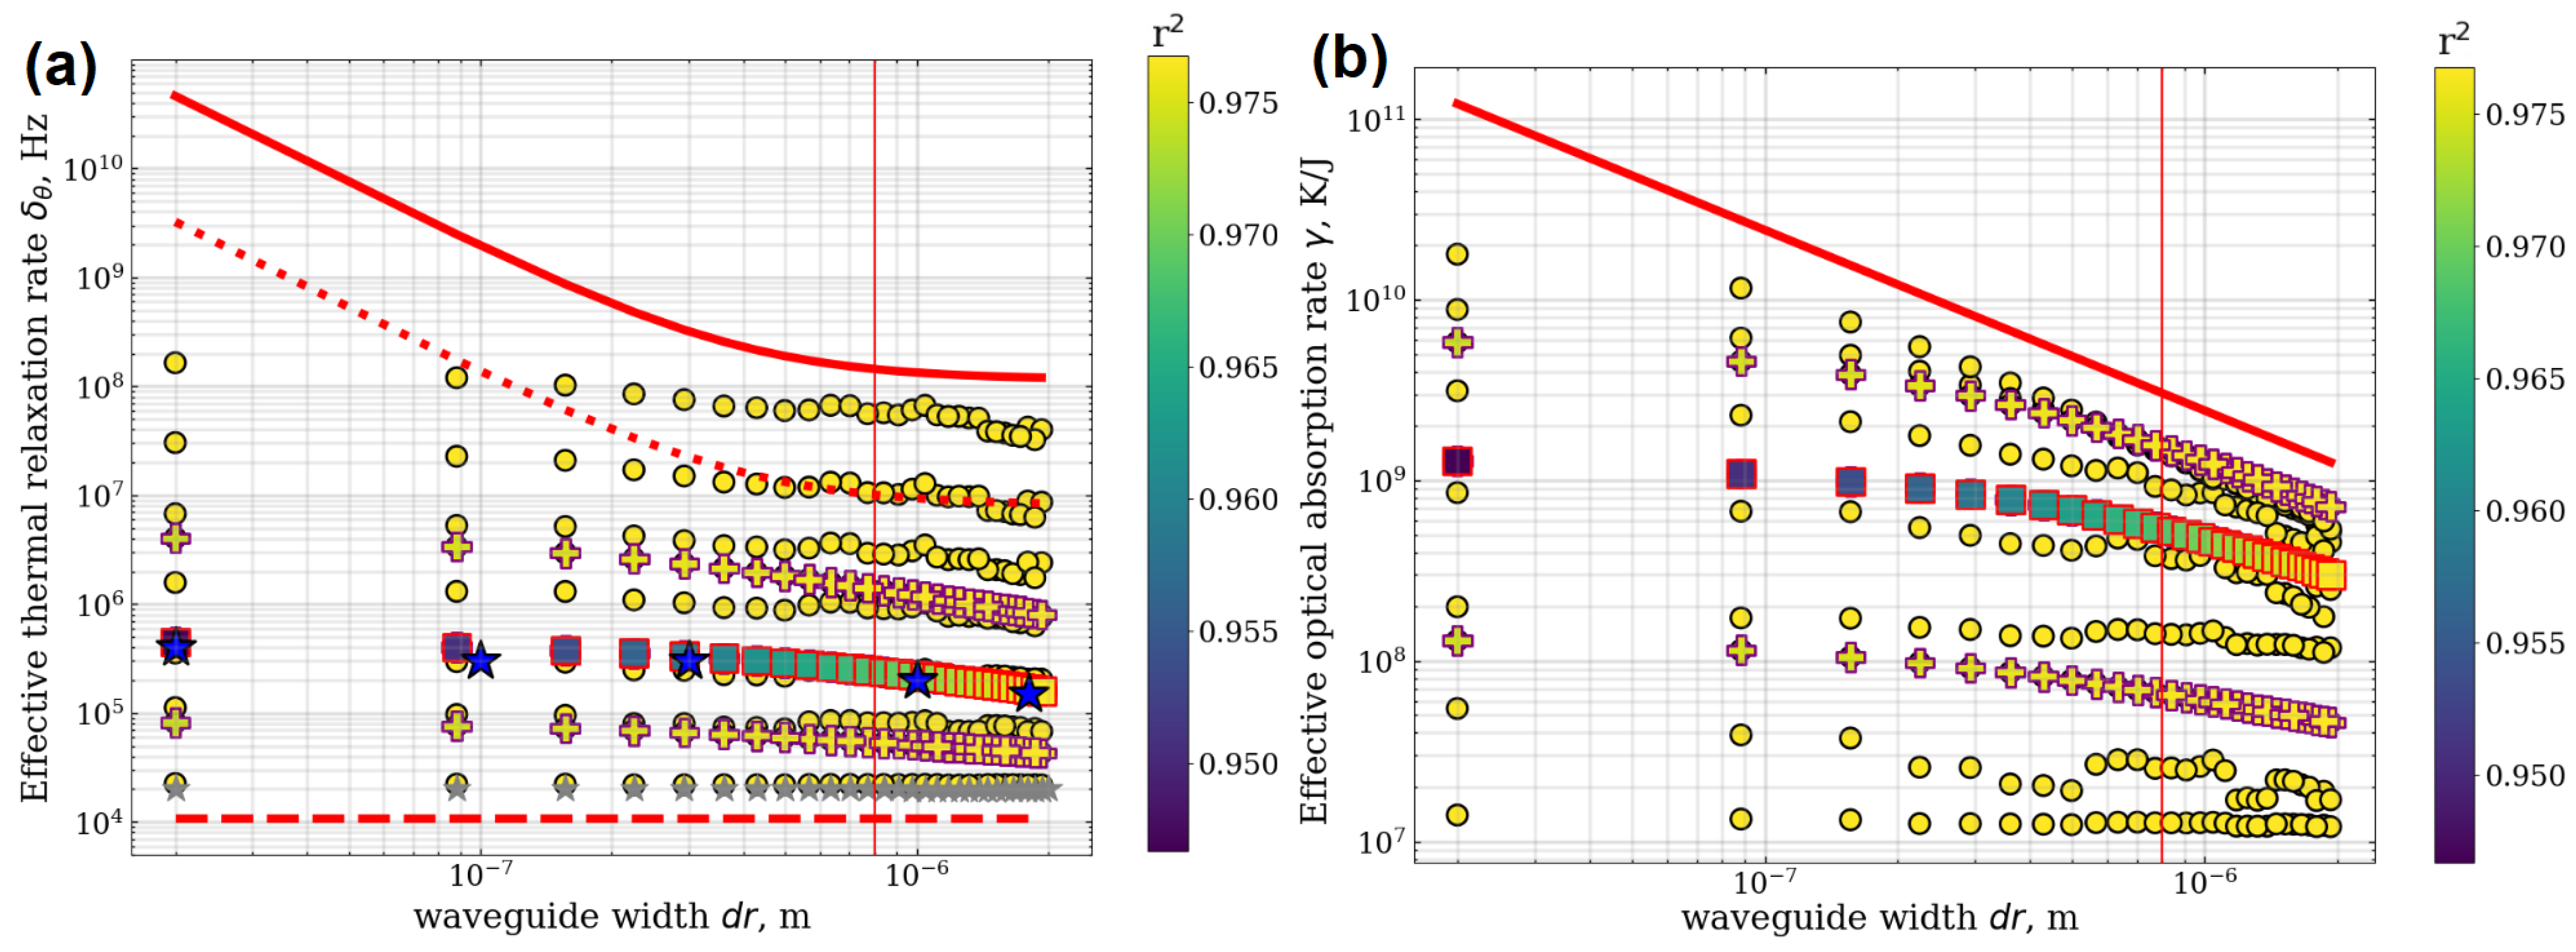
At the same time, for narrow waveguides ( d r < d z ), there is a strong discrepancy with the theoretical curve (red dotted line, Figure 9). However, when adding exponents, the discrepancy with the theoretical curves for narrow waveguides decreases. Moreover, with a decrease in the waveguide width d r , a larger number of exponents is needed for better agreement with the theory (7). The slowest effective thermal relaxation rate of the cladding subsystem is in good agreement with the first thermal mode of the cladding (grey stars, Figure 9a) and the Formula (17) (red dashed line, Figure 9a). Also, it is clearly seen that almost all effective thermal relaxation rate values are in the range between red dotted (Equation (16)) and red dashed (Equation (17)) lines in Figure 9.
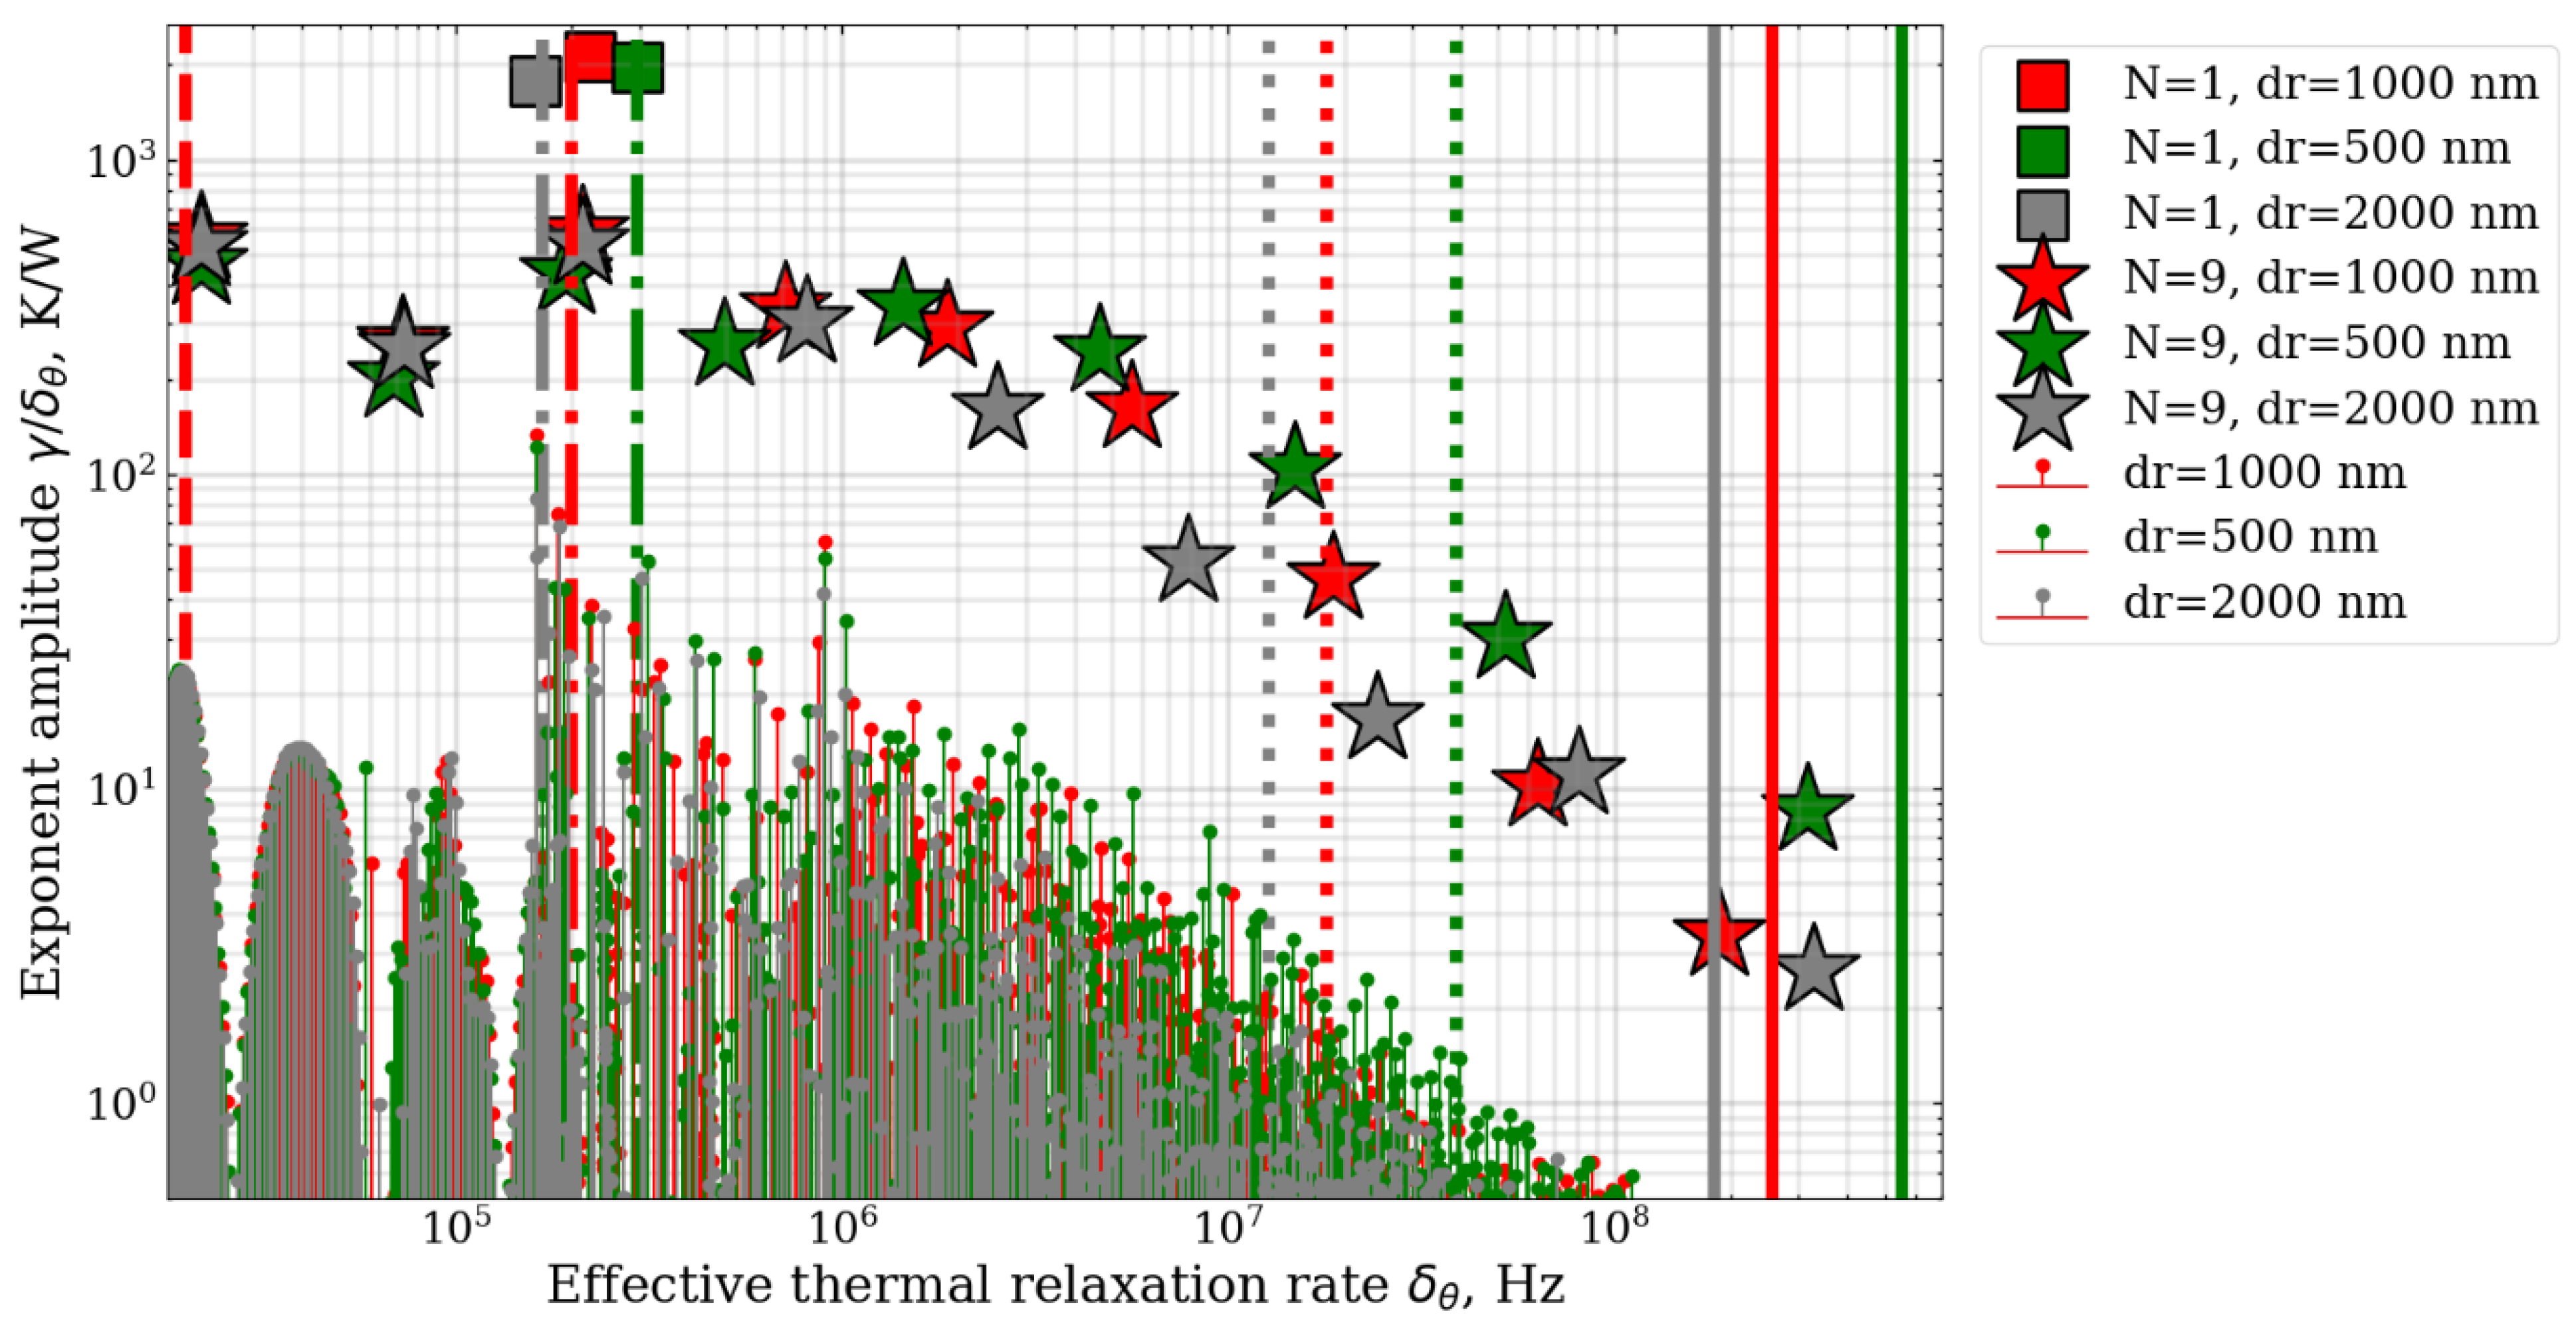
We also studied the exponent amplitude spectrum for different waveguide widths d r . Figure 10 shows that changing the width d r of the waveguide over a wide range does not lead to a significant change in the spectrum. We tried different ways of averaging analytical Formulas (7) (red/green/grey solid line in Figure 10), (16) (red/green/grey dotted line in Figure 10), and (17) (red dashed line in Figure 10) to obtain a rough approximation for one-exponent relaxation rate. The best results were obtained with the geometric mean (red/green/grey dash-dotted line in Figure 10). We combined the two proposed analytical formulas, Equations (16) and (17), and obtained values δ θ a v = δ θ m o d · δ θ s l o w with a similar order to the case of a one-exponent fit (see dash-dotted lines in Figure 10). This proves that the effective thermal relaxation rate from one-exponent fit is essentially a combination of the effective thermal relaxation rates of two thermal subsystems (mode and cladding). However, we note that the difference between the proposed average and the numerical simulation is quite large, so this can only serve as a rough estimate for a particular design.
It is also worth noting that, for a wide waveguide, there are modes (gray stars in Figure 10) with effective thermal relaxation rates greater than that provided by the theoretical Formula (7) (gray solid line in Figure 10). This is due to the fact that, for wide waveguides, estimating the mode transverse profile half-width as the waveguide ross-section half-widths may not be accurate enough.
It is worth paying attention to the fact that Formula (7) does not consider anything other than the resonator by derivation. Furthermore, the resonator itself is considered only in the sense of the mode form, not the resonator form. We found that the distance between the waveguide and the silicon substrate h has a significant effect on the effective parameters. Figure 11 shows the dependence of the effective parameters on the distance h. It can be seen that, in the range from 10 6 m to 4 × 10 5 m, the effective thermal relaxation rate changes by more than an order of magnitude.
One can see that the numerical eigenvalues for the slowest thermal modes of the cladding subsystem (grey stars, Figure 11a) are well-described by Equation (17) (red dashed line) over a large range of distance between the waveguide and the silicon substrate h. Also, it should be noted that almost all the effective thermal relaxation rate values are in the range between red dotted (Equation (16)) and red dashed (Equation (17)) lines in Figure 11a.
We also studied the influence of the microchip boundary with air at various heat transfer coefficients in a wide range and did not find a significant effect on the effective parameters. Thus, it is permissible to consider the boundary with air as thermally insulated.
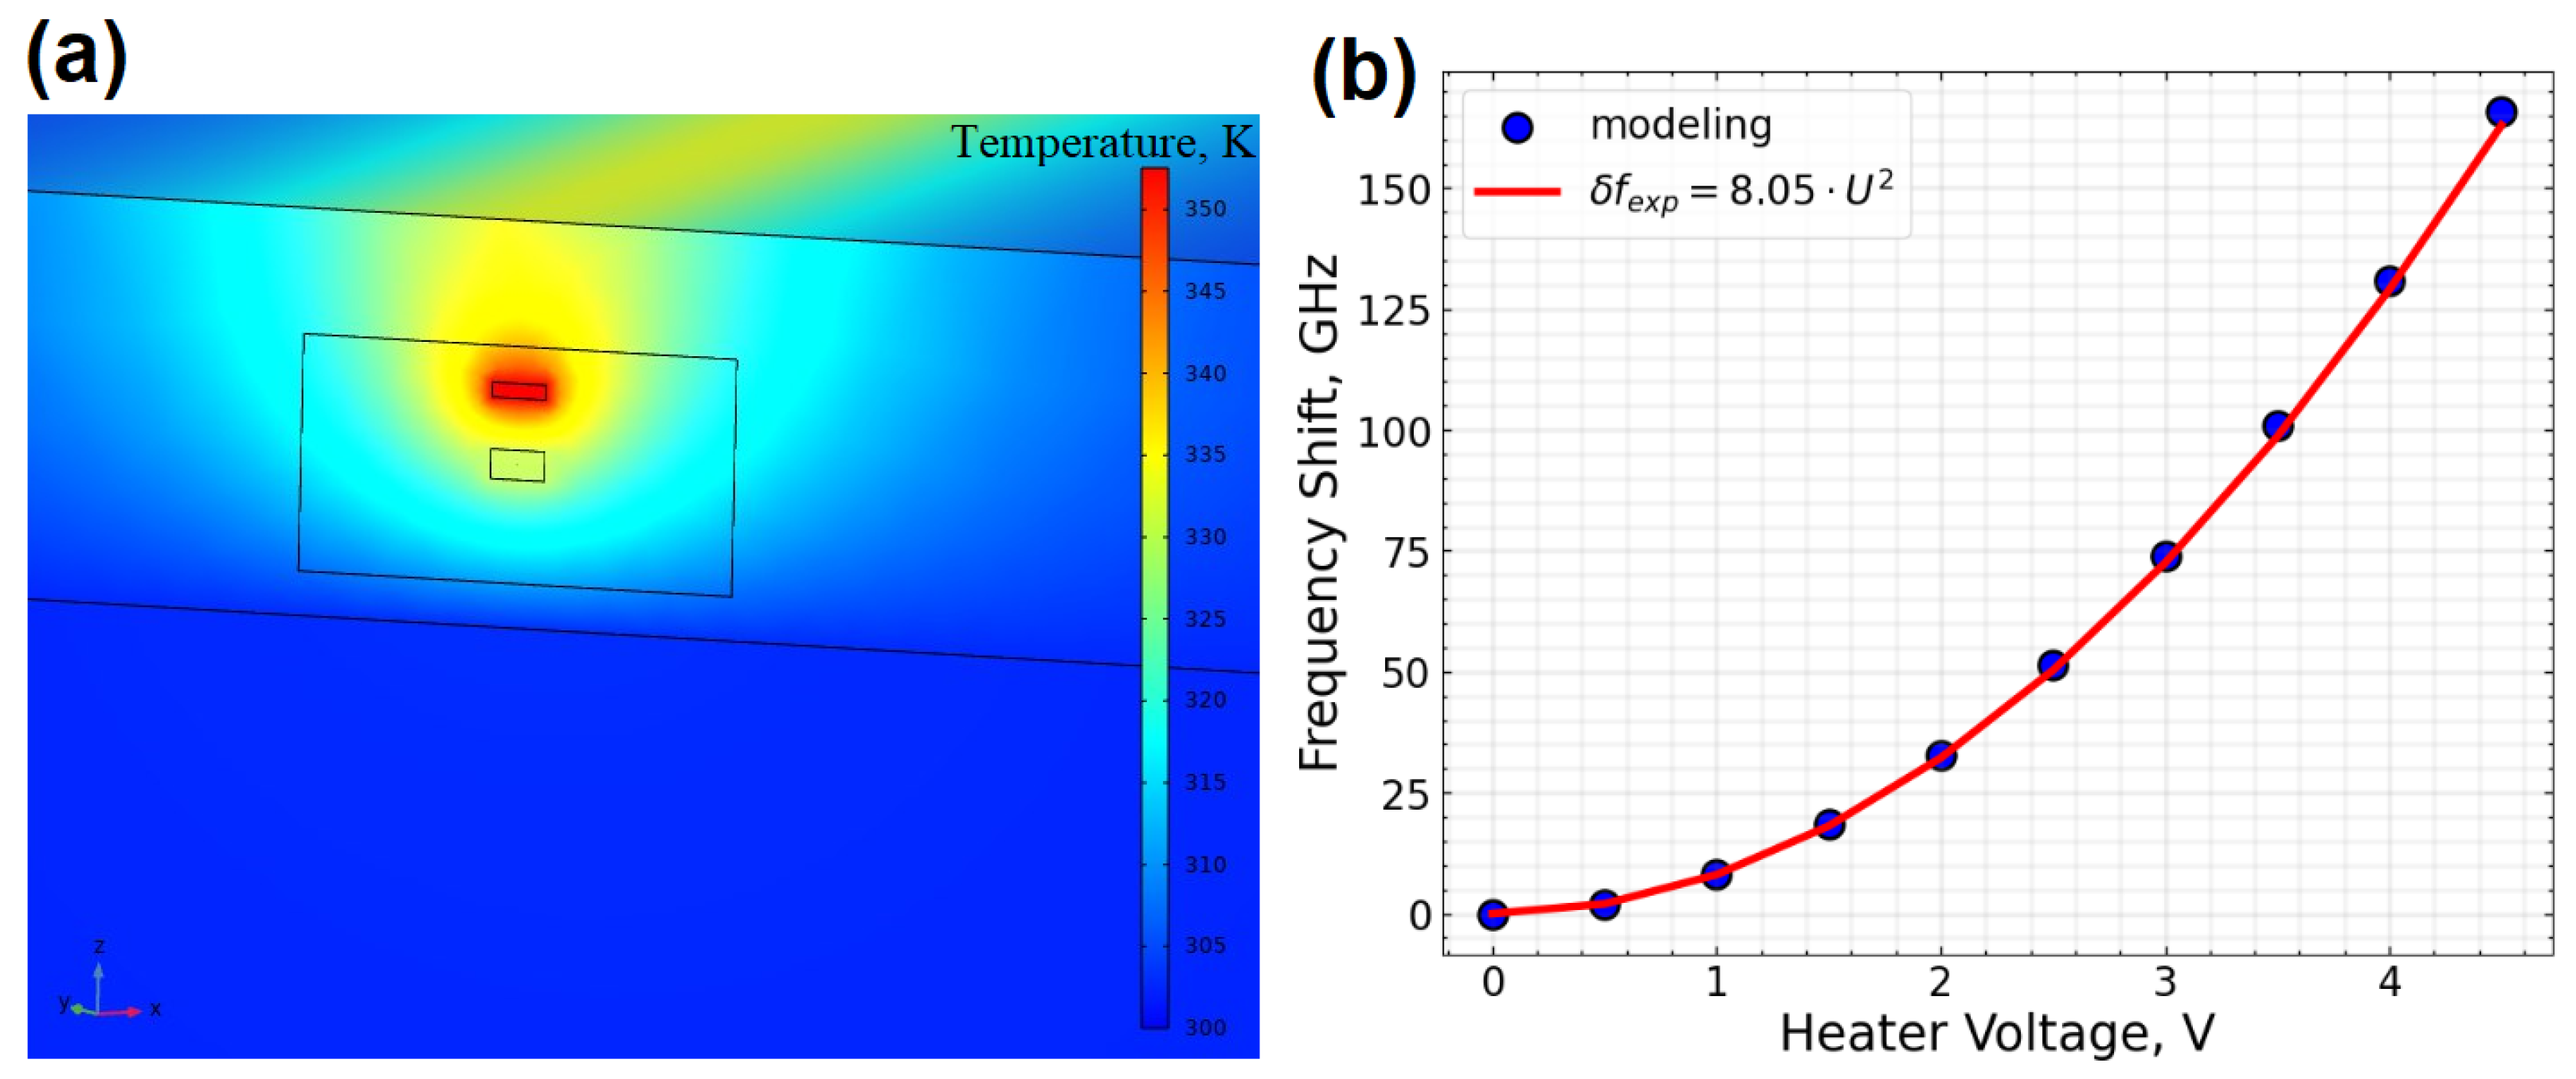
To check the correctness of the boundary conditions and material parameters of the integrated microresonator model, the experimentally measured heater-induced frequency shifts were compared with the results of the numerical simulations [79,80]. In the model, the source of thermal power was specified as P = U 2 / R in the heater region, where U is the voltage that is supplied to the contacts of the heater in the experiment, R is the resistance of the heater material, specified by the manufacturer R = 65 ohm. A typical metal (for example, aluminum) was chosen as the heater material because the real parameters of the heater are unknown and are a trade secret of the microchip manufacturer. A voltage U in the range from 1 to 5 volts was applied to the contacts of the heater integrated into the microchip. In this case, the stationary shift in resonances during laser scanning was measured. The measurement points (frequency shifts at the corresponding voltage on the heater) were approximated by a quadratic function: δ f e x p = 8.05 · U 2 .
Figure 12 shows that the experimental data (red line) and numerical simulation (blue dots) are in good agreement, which verifies the developed integrated microresonator.

4.2. Experimental Limitations

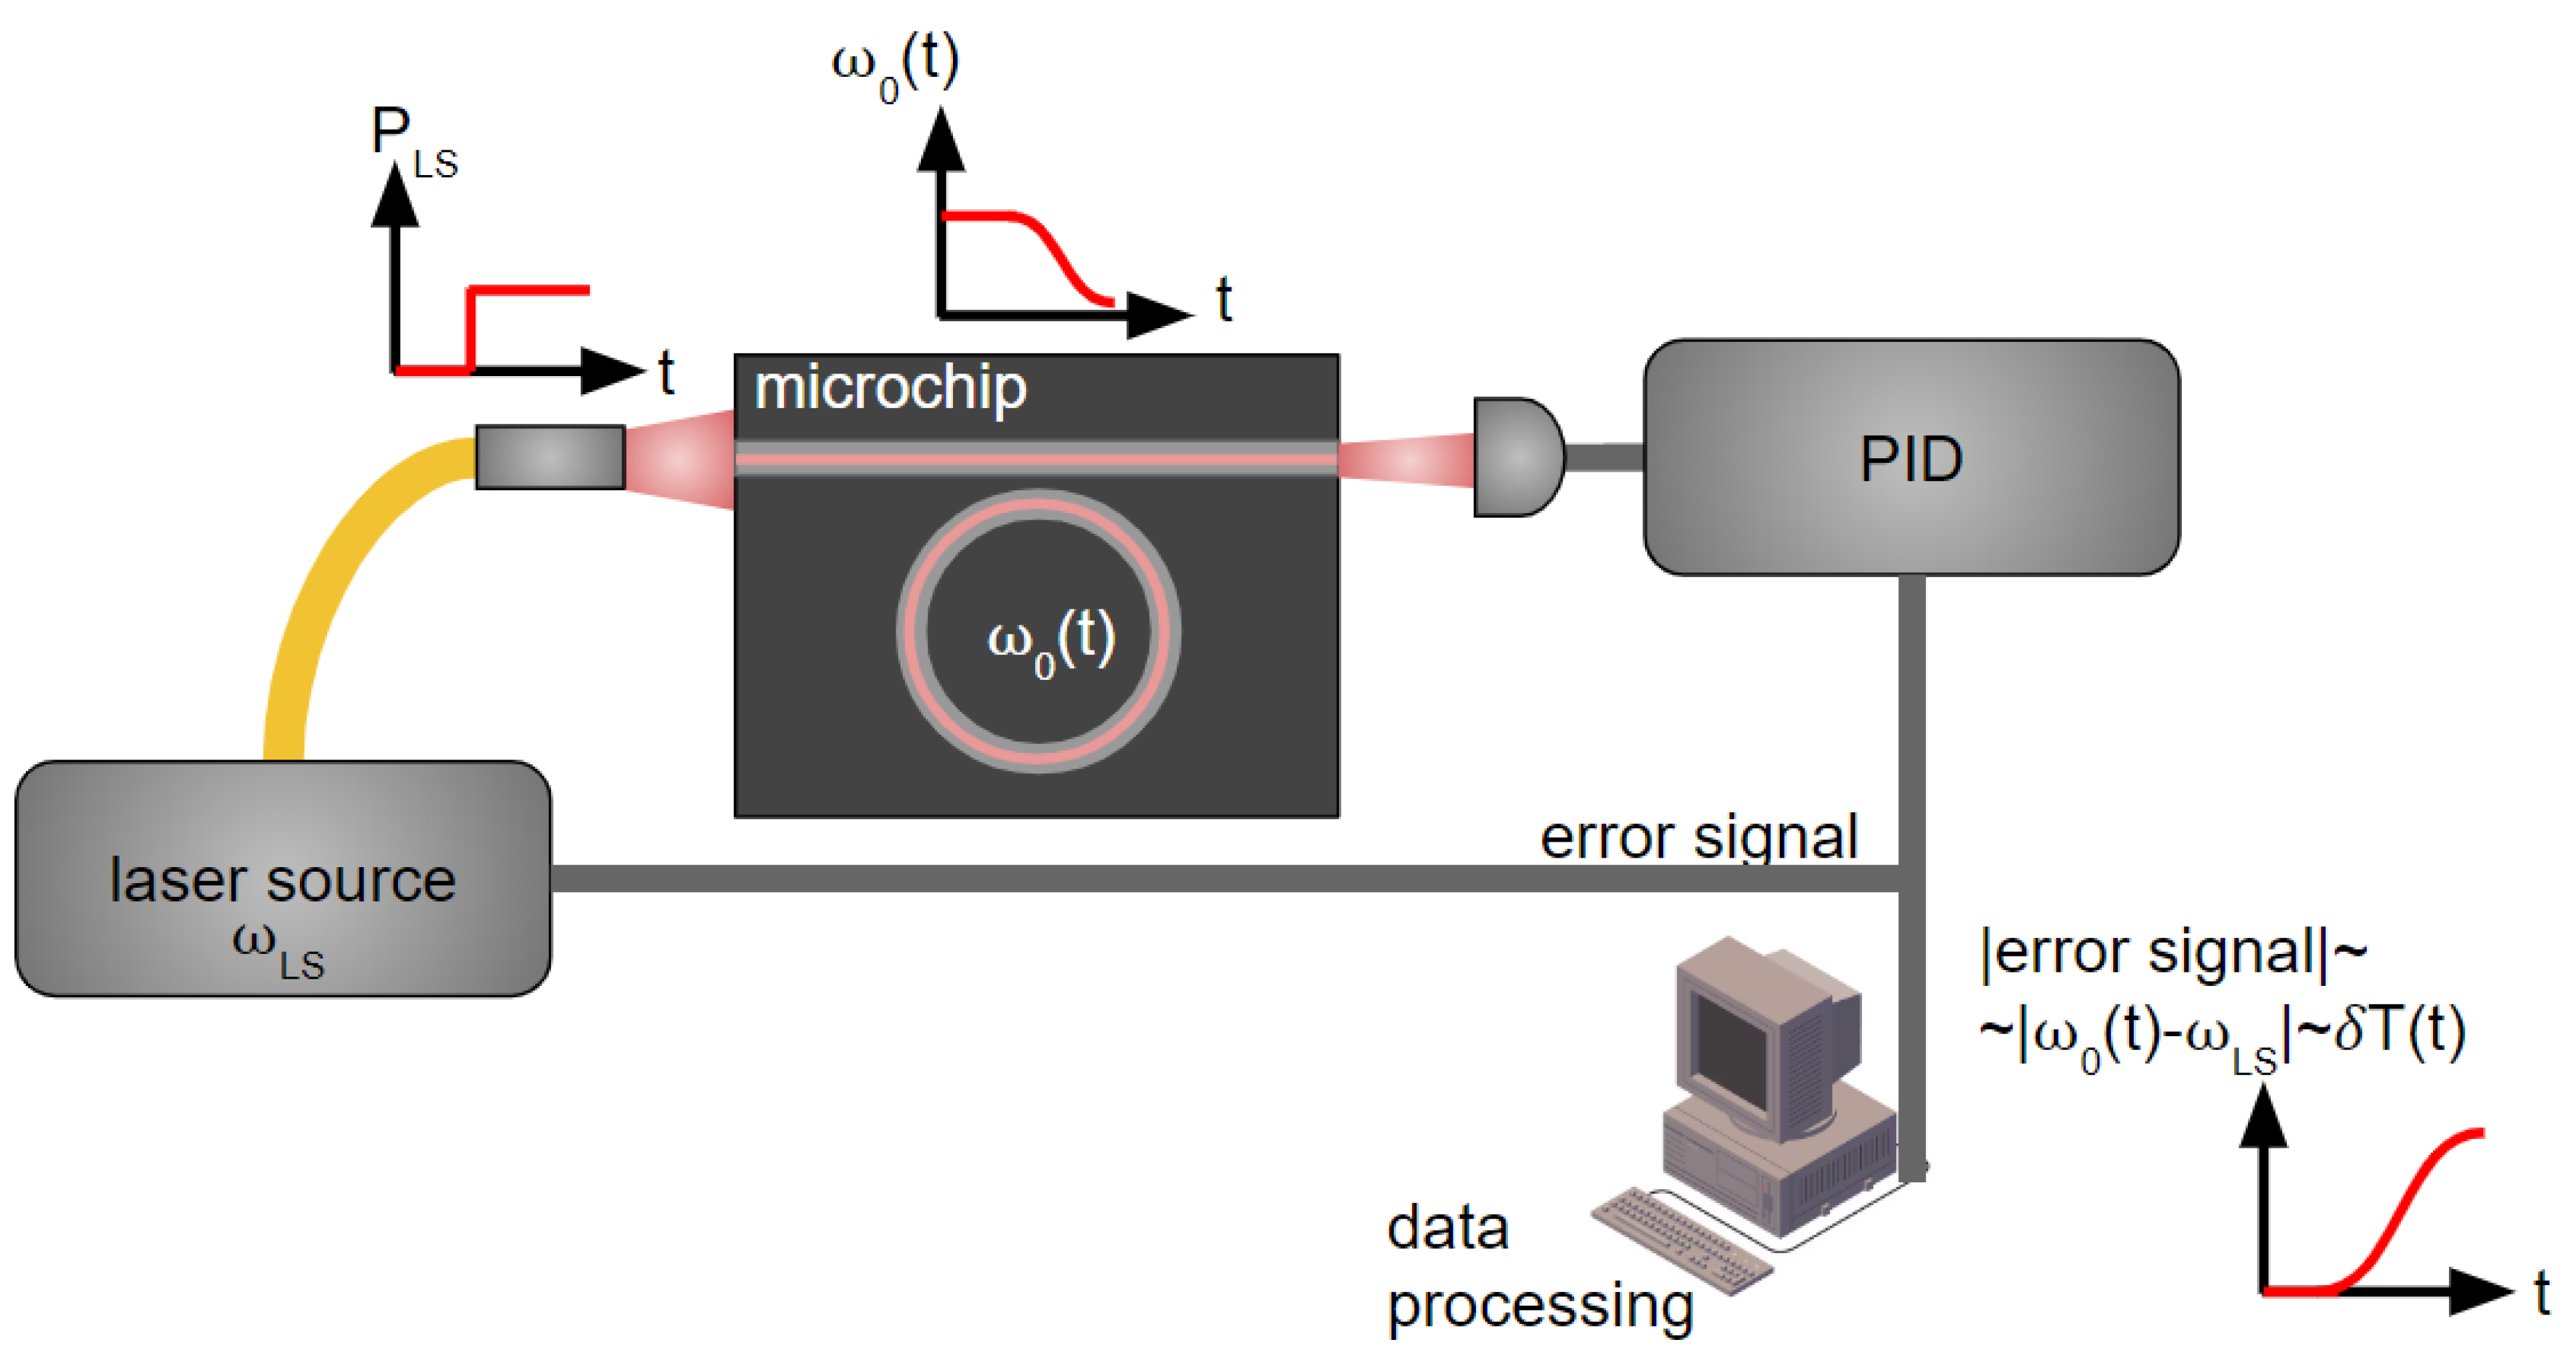
The proposed theory appeals to subtle processes described in detail by thermal mode decomposition. We were interested in how accurately thermal parameters can be measured in experiments with respect to fundamental noise mechanisms and whether it is possible to see the predicted dynamics. The proposed experimental setup that might allow to obtain necessary accuracy is shown in Figure 13. A continuous wave laser heats the microresonator by exciting its mode. The pump laser frequency is bounded to the eigenfrequency of the same microresonator using a self-tuning system based on the Pound–Drever–Hall (PDH) technique [81]. We propose to measure the error signal module proportional to the microresonator frequency shift; further, it can be approximated by the sum of the exponents according to the developed approach discussed in the previous section. Note that pump power should be small enough to avoid unwanted nonlinear effects (threshold power depends on the microresonator quality factor) and to minimize Kerr frequency shift.
There are fundamental limitations that add noise to the experimentally measured dependencies, which can limit the number of experimentally observed exponents. In particular, we consider such fundamental factors as thermal noise in the integrated microresonators, frequency and amplitude noise of the pump laser, photodetector noise, and digital noise. We made estimations of the contributions of such factors. In an optical resonator, there are thermodynamic fluctuations of temperature, δ T n o i s e , whose variance is
< δ T n o i s e 2 > = k B T 2 C ρ V ,
where T is the temperature of the heat bath, k B is the Boltzmann constant, ρ is the density, C is the specific heat of the waveguide material, and V is the optical mode volume. Using the material parameters of Si 3 N 4 (see Table 1 and Table 2) and the optical mode volume of a typical 24 μ m microresonator, we can obtain a value of the standard deviation of the temperature as < δ T n o i s e 2 > ≈ 60 µK [18]. It can be seen in Figure 2 that the fundamental temperature noise is much smaller (maximum temperature deviation from data ( T i ( t i ) T ( t i ) ) ≈ 3 K) than the heating of the microresonator due to the absorption of the pump power for the standard range of the microresonator parameters. Frequency noise for a laser with a linewidth of 10 kHz and a microresonator with a resonance linewidth of 100 MHz provides a relative error only of 5 × 10 5 . Figure 2 also shows that the relative error reaches ( T i ( t i ) T ( t i ) ) T 0 14%.
The noise of the PDH-stabilizing system, including the thermal noise of the detector and digital noise of the system, can be quite small [81]. Thus, considering fundamental limiting mechanisms, it can be argued that such a detailed thermal response distribution can be measured.

5. Conclusions

In our work, we compared various methods for the determination of the effective thermal parameters for a wide range of material and geometric parameters of an on-chip microring resonator. In particular, we showed that, for the range of standard microresonator parameters, the accuracy of the conventional one-exponent approximation obtained from the single rate equation describing microresonator heating can be relatively low. However, as we showed, the addition of several exponents for the description of this process corresponding to different thermal modes of the microresonator can significantly improve the accuracy of the approximation. We investigated the dependence of the approximation accuracy on the number of exponents (corresponding number of the rate equations) for a wide range of realistic parameters of the considered structures and found the optimal number of the thermal modes that should be taken into account. For the considered microresonator, convergence in the number of exponents was achieved at N = 9 thermal modes.
As a result, we propose an original and effective method for the accurate calculation of the effective thermal parameters in high-Q optical microresonators based on the decomposition of the thermal field into microresonator thermal modes.
The proposed method agrees better with direct numerical simulation for the considered microring resonators and well-known theoretical formulas over the entire range of microresonator parameters, in contrast to the classical approach. The developed method is universal and can be used for a wide range of microresonator platforms. The obtained results also provide deep insight into the thermal dynamics of microresonator-based platforms.

Author Contributions

Conceptualization, V.I.P., N.M.K. and V.E.L.; methodology, N.M.K.; software, V.I.P.; validation, V.I.P., A.E.S. and N.M.K.; formal analysis, V.I.P., A.E.S., V.E.L. and N.M.K.; investigation, V.I.P. and V.E.L.; resources, V.I.P.; data curation, V.I.P.; writing—original draft preparation, V.I.P. and N.M.K.; writing—review and editing, A.E.S. and V.E.L.; visualization, V.I.P.; supervision, V.E.L.; project administration, V.E.L.; funding acquisition, V.E.L. All authors have read and agreed to the published version of the manuscript.

Funding

The RQC team thanks the Russian Science Foundation (Project No. 22-22-00872).

Institutional Review Board Statement

Not applicable.

Informed Consent Statement

Not applicable.

Data Availability Statement

The data underlying the results presented in this article may be obtained from the authors upon reasonable request.

Acknowledgments

The authors thank Nikita U. Dmitriev for providing the experimental dependences of the frequency shift on the heater voltage, Airat R. Gatatdinov assisting in the preparation of materials, and Alexandr V. Kozlov for helpful discussions.

Conflicts of Interest

The authors declare no conflict of interest.

References

  1. Braginsky, V.B.; Gorodetsky, M.L.; Ilchenko, V.S. Quality-factor and nonlinear properties of optical whispering-gallery modes. Phys. Lett. A 1989, 137, 393–397. [Google Scholar] [CrossRef]
  2. Vahala, K.J. Optical microcavities. Nature 2003, 424, 839. [Google Scholar] [CrossRef]
  3. Vassiliev, V.V.; Velichansky, V.L.; Ilchenko, V.S.; Gorodetsky, M.L.; Hollberg, L.; Yarovitsky, A.V. Narrowline- width diode laser with a high-Q microsphere resonator. Opt. Commun. 1998, 158, 305. [Google Scholar]
  4. Matsko, A.B.; Ilchenko, V.S. Optical resonators with whispering-gallery modes-part II: Applications. IEEE J. Sel. Top. Quantum Electron. 2006, 12, 15–32. [Google Scholar] [CrossRef]
  5. Ward, J.; Benson, O. WGM microresonators: Sensing, lasing and fundamental optics with microspheres. Laser Photon. Rev. 2011, 5, 553. [Google Scholar] [CrossRef]
  6. Strekalov, D.V.; Marquardt, C.; Matsko, A.B.; Schwefel, H.G.L.; Leuchs, G. Nonlinear and quantum optics with whispering gallery resonators. J. Opt. 2016, 18, 123002. [Google Scholar] [CrossRef]
  7. Lin, G.; Coillet, A.; Chembo, Y.K. Nonlinear photonics with high-Q whispering-gallery-mode resonators. Adv. Opt. Photonics 2017, 9, 828–890. [Google Scholar] [CrossRef]
  8. Kues, M.; Reimer, C.; Lukens, J.M.; Munro, W.J.; Weiner, A.M.; Moss, D.J.; Morandotti, R. Quantum optical microcombs. Nat. Photonics 2019, 13, 170. [Google Scholar] [CrossRef]
  9. Kondratiev, N.M.; Lobanov, V.E.; Shitikov, A.E.; Galiev, R.R.; Chermoshentsev, D.A.; Dmitriev, N.Y.; Danilin, A.N.; Lonshakov, E.A.; Min’kov, K.N.; Sokol, D.M.; et al. Recent advances in laser self-injection locking to high-Q microresonators. Front. Phys. 2023, 18, 21305. [Google Scholar] [CrossRef]
  10. Sun, Y.; Wu, J.; Tan, M.; Xu, X.; Li, Y.; Morandotti, R.; Mitchell, A.; Moss, D.J. Applications of optical microcombs. Adv. Opt. Photonics 2023, 15, 86. [Google Scholar] [CrossRef]
  11. Ilchenko, V.S.; Gorodetskii, M.L. Thermal nonlinear effects in optical whispering gallery microresonators. Laser Phys. 1992, 2, 1004–1009. [Google Scholar]
  12. Carmon, T.; Yang, L.; Vahala, K.J. Dynamical thermal behavior and thermal self-stability of microcavities. Opt. Express 2004, 12, 4742–4750. [Google Scholar] [CrossRef] [PubMed]
  13. Fomin, A.E.; Gorodetsky, M.L.; Grudinin, I.S.; Ilchenko, V.S. Nonstationary nonlinear effects in optical microspheres. J. Opt. Soc. Am. 2005, B 22, 459–465. [Google Scholar] [CrossRef]
  14. Gorodetsky, M.L.; Grudinin, I.S. Fundamental thermal fluctuations in microspheres. J. Opt. Soc. Am. 2004, B 21, 697–705. [Google Scholar] [CrossRef]
  15. Grudinin, I.S.; Vahala, K.J. Thermal instability of a compound resonator. Opt. Express 2009, 17, 14088. [Google Scholar] [CrossRef] [PubMed]
  16. Diallo, S.; Lin, G.; Chembo, Y.K. Giant thermo-optical relaxation oscillations in millimeter-size whispering gallery mode disk resonators. Opt. Lett. 2015, 40, 3834–3837. [Google Scholar] [CrossRef]
  17. Kondratiev, N.; Gorodetsky, M. Thermorefractive noise in whispering gallery mode microresonators: Analytical results and numerical simulation. Phys. Lett. A 2017, 382, 2265–2268. [Google Scholar] [CrossRef]
  18. Huang, G.; Lucas, E.; Liu, J.; Raja, A.S.; Lihachev, G.; Gorodetsky, M.L.; Engelsen, N.J.; Kippenberg, T.J. Thermorefractive noise in silicon–nitride microresonators. Phys. Rev. 2019, 99, 061801. [Google Scholar] [CrossRef]
  19. Panuski, C.; Englund, D.; Hamerly, R. Fundamental thermal noise limits for optical microcavities. Phys. Rev. 2020, 10, 041046. [Google Scholar] [CrossRef]
  20. Leshem, A.; Qi, Z.; Carruthers, T.F.; Menyuk, C.R.; Gat, O. Thermal instabilities, frequency-comb formation, and temporal oscillations in Kerr microresonators. Phys. Rev. 2021, A 103, 013512. [Google Scholar] [CrossRef]
  21. Lobanov, V.E.; Kondratiev, N.M.; Shitikov, A.E.; Borovkova, O.V.; Cordette, S.J.; Bilenko, I.A. Platicon stability in hot cavities. Opt. Lett. 2023, 48, 2353–2356. [Google Scholar] [CrossRef] [PubMed]
  22. Herr, T.; Brasch, V.; Jost, J.D.; Wang, C.Y.; Kondratiev, N.M.; Gorodetsky, M.L.; Kippenberg, T.J. Temporal solitons in optical microresonators. Nat. Photonics 2014, 8, 145–152. [Google Scholar] [CrossRef]
  23. Bao, C.; Xuan, Y.; Jaramillo-Villegas, J.A.; Leaird, D.E.; Qi, M.; Weiner, A.M. Direct soliton generation in microresonators. Opt. Lett. 2017, 42, 2519–2522. [Google Scholar] [CrossRef] [PubMed]
  24. Kobatake, T.; Kato, T.; Itobe, H.; Nakagawa, Y.; Tanabe, T. Thermal Effects on Kerr Comb Generation in a CaF2 Whispering-Gallery Mode Microcavity. IEEE Photonics J. 2016, 8, 1–9. [Google Scholar] [CrossRef]
  25. Drake, T.E.; Stone, J.R.; Briles, T.C.; Papp, S.B. Thermal decoherence and laser cooling of Kerr microresonator solitons. Nat. Photonics 2020, 14, 480. [Google Scholar] [CrossRef]
  26. Lei, F.; Ye, Z.; Torres-Company, V. Thermal noise reduction in soliton microcombs via laser self-cooling. Opt. Lett. 2022, 47, 513. [Google Scholar] [CrossRef]
  27. Lobanov, V.E.; Kondratiev, N.M.; Bilenko, I.A. Thermally induced generation of platicons in optical microresonators. Opt. Lett. 2021, 46, 2380–2383. [Google Scholar] [CrossRef]
  28. Lim, J.; Savchenkov, A.A.; Dale, E.; Liang, W.; Eliyahu, D.; Ilchenko, V.; Matsko, A.B.; Maleki, L.; Wong, C.W. Chasing the thermodynamical noise limit in whispering-gallery-mode resonators for ultrastable laser frequency stabilization. Nat. Commun. 2017, 8, 8. [Google Scholar] [CrossRef]
  29. Shi, W.; Zou, C.; Cao, Y.; Liu, J. Influence of thermal effects in microresonators on the locking range in self-injection locking of laser diodes. J. Opt. Soc. Am. B 2023, 40, 874–880. [Google Scholar] [CrossRef]
  30. Chermoshentsev, D.A.; Shitikov, A.E.; Lonshakov, E.A.; Grechko, G.V.; Sazhina, E.A.; Kondratiev, N.M.; Masalov, A.V.; Bilenko, I.A.; Lvovsky, A.I.; Ulanov, A.E. Dual-laser self-injection locking to an integrated microresonator. Opt. Express 2022, 30, 17094–17105. [Google Scholar] [CrossRef]
  31. Rahman, A. Temperature sensor based on dielectric optical microresonator. Opt. Fiber Technol. 2011, 17, 536–540. [Google Scholar] [CrossRef]
  32. Ioppolo, T.; Rubino, E. Room-temperature micro-photonic bolometer based on dielectric optical resonators. In Proceedings of the SPIE 8704, Infrared Technology and Applications XXXIX, Baltimore, MA, USA, 29 April–3 May 2013. [Google Scholar]
  33. Zhu, J.; Ozdemir, S.K.; Yang, L. Infrared light detection using a whispering-gallery-mode optical microcavity. Appl. Phys. Lett. 2014, 104, 171114. [Google Scholar] [CrossRef]
  34. Foreman, M.R.; Swaim, J.D.; Vollmer, F. Whispering gallery mode sensors. Adv. Opt. Photon. 2015, 7, 168–240. [Google Scholar] [CrossRef] [PubMed]
  35. Chen, Y.; Li, J.; Guo, X.; Wan, L.; Liu, J.; Chen, Z.; Pan, J.; Zhang, B.; Li, Z.; Qin, Y. On-chip high-sensitivity photonic temperature sensor based on a GaAs microresonator. Opt. Lett. 2020, 45, 5105–5108. [Google Scholar] [CrossRef]
  36. Andrianov, A.V.; Marisova, M.P.; Anashkina, E.A. Thermo-Optical Sensitivity of Whispering Gallery Modes in As2S3 Chalcogenide Glass Microresonators. Sensors 2022, 22, 4636. [Google Scholar] [CrossRef] [PubMed]
  37. Komrakova, S.; An, P.; Kovalyuk, V.; Golikov, A.; Gladush, Y.; Mkrtchyan, A.; Chermoshentsev, D.; Krasnikov, D.; Nasibulin, A.; Goltsman, G. Hybrid Silicon Nitride Photonic Integrated Circuits Covered by Single-Walled Carbon Nanotube Films. Nanomaterials 2023, 13, 2307. [Google Scholar] [CrossRef]
  38. Little, B.E.; Chu, S.; Absil, P.P.; Hryniewicz, J.V.; Johnson, F.; Seiferth, F.; Gill, D.; Van, V.; King, O.; Trakalo, M. Very high-order microring resonator filters for WDM applications. IEEE Photon. Technol. Lett. 2004, 16, 2263–2265. [Google Scholar] [CrossRef]
  39. Hu, T.; Wang, W.; Qiu, C.; Yu, P.; Qiu, H.; Zhao, Y.; Jiang, X.; Yang, J. Thermally Tunable Filters Based on Third-Order Microring Resonators for WDM Applications. IEEE Photonics Technol. Lett. 2012, 24, 524–526. [Google Scholar] [CrossRef]
  40. Ren, Y.; Perron, D.; Aurangozeb, F.; Jiang, Z.; Hossain, M.; Van, V. A Continuously Tunable Silicon Double-Microring Filter With Precise Temperature Tracking. IEEE Photonics J. 2018, 10, 6602310. [Google Scholar] [CrossRef]
  41. Li, Y.; Abolmaali, F.; Allen, K.W.; Limberopoulos, N.I.; Urbas, A.; Rakovich, Y.; Maslov, A.V.; Astratov, V.N. Whispering gallery mode hybridization in photonic molecules. Laser Photonics Rev. 2017, 11, 1600278. [Google Scholar] [CrossRef]
  42. Liao, K.; Hu, X.; Gan, T.; Liu, Q.; Wu, Z.; Fan, C.; Feng, X.; Lu, C.; Liu, Y.; Gong, Q. Photonic molecule quantum optics. Adv. Opt. Photon. 2020, 12, 60–134. [Google Scholar] [CrossRef]
  43. Helgason, Ó.B.; Arteaga-Sierra, F.R.; Ye, Z.; Twayana, K.; Andrekson, P.A.; Karlsson, M.; Schröder, J.; Torres-Company, V. Dissipative solitons in photonic molecules. Nat. Photonics 2021, 15, 305–310. [Google Scholar] [CrossRef]
  44. Xue, X.; Xuan, Y.; Wang, C.; Wang, P.-H.; Liu, Y.; Niu, B.; Leaird, D.E.; Qi, M.; Weiner, A.M. Thermal tuning of Kerr frequency combs in silicon nitride microring resonators. Opt. Express 2016, 24, 687. [Google Scholar] [CrossRef] [PubMed]
  45. Joshi, C.; Jang, J.K.; Luke, K.; Ji, X.; Miller, S.A.; Klenner, A.; Okawachi, Y.; Lipson, M.; Gaeta, A.L. Thermally controlled comb generation and soliton modelocking in microresonators. Opt. Lett. 2016, 41, 2565. [Google Scholar] [CrossRef] [PubMed]
  46. Guo, H.; Karpov, M.; Lucas, E.; Kordts, A.; Pfeiffer, M.H.P.; Brasch, V.; Lihachev, G.; Lobanov, V.E.; Gorodetsky, M.L.; Kippenberg, T.J. Universal dynamics and deterministic switching of dissipative Kerr solitons in optical microresonators. Nat. Phys. 2017, 13, 94. [Google Scholar] [CrossRef]
  47. Anashkina, E.A.; Marisova, M.P.; Andrianov, A.V. Thermo-Optical Control of Raman Solitons in a Functionalized Silica Microsphere. Micromachines 2022, 13, 1616. [Google Scholar] [CrossRef]
  48. Li, J.; Wan, S.; Peng, J.-L.; Wang, Z.-Y.; Niu, R.; Zou, C.-L.; Guo, G.-C.; Dong, C.-H. Thermal tuning of mode crossing and the perfect soliton crystal in a Si3N4 microresonator. Opt. Express 2022, 30, 13690–13698. [Google Scholar] [CrossRef]
  49. Anashkina, E.A.; Marisova, M.P.; Dorofeev, V.V.; Andrianov, A.V. Raman Lasing in a Tellurite Microsphere with Thermo-Optical on/off Switching by an Auxiliary Laser Diode. Micromachines 2023, 14, 1796. [Google Scholar] [CrossRef]
  50. Wang, J.; Zhu, B.; Hao, Z.; Bo, F.; Wang, X.; Li, Y.; Zhang, G.; Xu, J. Thermo-optic effects in on-chip lithium niobate microdisk resonators. Opt. Express. 2016, 24, 21869–21879. [Google Scholar] [CrossRef]
  51. Boes, A.; Corcoran, B.; Chang, L.; Bowers, J.; Mitchell, A. Status and Potential of Lithium Niobate on Insulator (LNOI) for Photonic Integrated Circuits. Laser Photonics Rev. 2018, 12, 1700256. [Google Scholar] [CrossRef]
  52. Lu, C.; Li, H.; Qiu, J.; Zhang, Y.; Liu, S.; Zheng, Y.; Chen, X. Second and cascaded harmonic generation of pulsed laser in a lithium niobate on insulator ridge waveguide. Opt. Express 2022, 30, 1381. [Google Scholar] [CrossRef] [PubMed]
  53. Ye, F.; Yu, Y.; Xi, X.; Sun, X. Second-Harmonic Generation in Etchless Lithium Niobate Nanophotonic Waveguides with Bound States in the Continuum. Laser Photonics Rev. 2022, 16, 3. [Google Scholar] [CrossRef]
  54. Griffith, A.; Lau, R.; Cardenas, J.; Okawachi, Y.; Mohanty, A.; Fain, R.; Lee, Y.; Yu, M.; Phare, C.; Poitras, C.; et al. Silicon-chip mid-infrared frequency comb generation. Nat. Commun. 2014, 6, 6299. [Google Scholar] [CrossRef]
  55. Lin, Q.; Painter, O.J.; Agrawal, G.P. Nonlinear optical phenomena in silicon waveguides: Modeling and applications. Opt. Express. 2007, 15, 16604–16644. [Google Scholar] [CrossRef] [PubMed]
  56. Desiatov, B.; Goykhman, I.; Levy, U. Demonstration of submicron square-like silicon waveguide using optimized LOCOS process. Opt. Express. 2010, 18, 18592–18597. [Google Scholar] [CrossRef] [PubMed]
  57. Chang, L.; Xie, W.; Shu, H.; Yang, Q.-F.; Shen, B.; Boes, A.; Peters, J.; Jin, W.; Xiang, C.; Liu, S.; et al. Ultra-efficient frequency comb generation in AlGaAs-on-insulator microresonators. Nat. Commun. 2020, 11, 1331. [Google Scholar] [CrossRef]
  58. Chang, L.; Boes, A.; Pintus, P.; Xie, W.; Peters, J.D.; Kennedy, M.J.; Jin, W.; Guo, X.-W.; Yu, S.-P.; Papp, S.B.; et al. Low loss (Al)GaAs on an insulator waveguide platform. Opt. Lett. 2019, 44, 4075–4078. [Google Scholar] [CrossRef]
  59. Scaccabarozzi, L.; Fejer, M.M.; Huo, Y.; Fan, S.; Yu, X.; Harris, J.S. Enhanced second-harmonic generation in AlGaAs/AlxOy tightly confining waveguides and resonant cavities. Opt. Lett. 2006, 31, 3626–3628. [Google Scholar] [CrossRef]
  60. Pu, M.; Ottaviano, L.; Semenova, E.; Yvind, K. Efficient frequency comb generation in AlGaAs-on-insulator. Optica 2016, 3, 823–826. [Google Scholar] [CrossRef]
  61. Schneider, K.; Welter, P.; Baumgartner, Y.; Hahn, H.; Czornomaz, L.; Seidler, P. Gallium Phosphide-on-Silicon Dioxide Photonic Devices. J. Light. Technol. 2018, 36, 2994–3002. [Google Scholar] [CrossRef]
  62. Hegeman, I.; Dijkstra, M.; Segerink, F.B.; Lee, W.; Garcia-Blanco, S.M. Development of low-loss TiO2 waveguides. Opt. Express. 2020, 28, 5982–5990. [Google Scholar] [CrossRef] [PubMed]
  63. Pfeiffer, M.H.P.; Kordts, A.; Brasch, V.; Zervas, M.; Geiselmann, M.; Jost, J.D.; Kippenberg, T.J. Photonic Damascene process for integrated high-Q microresonator based nonlinear photonics. Optica 2016, 3, 20–25. [Google Scholar] [CrossRef]
  64. Pfeiffer, M.H.P.; Herkommer, C.; Liu, J.; Morais, T.; Zervas, M.; Geiselmann, M.; Kippenberg, T.J. Photonic Damascene Process for Low-Loss, High-Confinement Silicon Nitride Waveguides. IEEE J. Sel. Top. Quantum Electron. 2018, 24, 1–11. [Google Scholar] [CrossRef]
  65. Liu, J.; Huang, G.; Wang, R.N.; He, J.; Raja, A.S.; Liu, T.; Engelsen, N.J.; Kippenberg, T.J. High-yield, wafer-scale fabrication of ultralow-loss, dispersion-engineered silicon nitride photonic circuits. Nat. Commun. 2021, 12, 2236–2244. [Google Scholar] [CrossRef] [PubMed]
  66. Brasch, V.; Chen, Q.-F.; Schiller, S.; Kippenberg, T. Radiation hardness of high-Q silicon nitride microresonators for space compatible integrated optics. Opt. Express 2014, 22, 30786–30794. [Google Scholar] [CrossRef]
  67. Jin, W.; Yang, Q.-F.; Chang, L.; Shen, B.; Wang, H.; Leal, M.; Wu, L.; Gao, M.; Feshali, A.; Paniccia, M.; et al. Hertz-linewidth semiconductor lasers using CMOS-ready ultra-high-Q microresonators. Nat. Photonics 2021, 15, 346–353. [Google Scholar] [CrossRef]
  68. Huang, D.; Tran, M.A.; Guo, J.; Peters, J.; Komljenovic, T.; Malik, A.; Morton, P.A.; Bowers, J.E. High-power sub-khz linewidth lasers fully integrated on silicon. Optica 2019, 6, 745–752. [Google Scholar] [CrossRef]
  69. Pavlov, V.I.; Balakireva, I.V.; Brazhnikov, M.K.; Khatyrev, N.P. Frequency stabilization of diode lasers using lithium tantalate microresonators for laser cooling systems of a rubidium fountain. Alm. Mod. Metrol. 2022, 4, 18–26. [Google Scholar]
  70. Pfeiffer, M.H.P.; Herkommer, C.; Liu, J.; Guo, H.; Karpov, M.; Lucas, E.; Zervas, M.; Kippenberg, T.J. Octave-spanning dissipative Kerr soliton frequency combs in Si3N4 microresonators. Optica 2017, 4, 684–691. [Google Scholar] [CrossRef]
  71. Xuan, Y.; Liu, Y.; Varghese, L.T.; Metcalf, A.J.; Xue, X.; Wang, P.-H.; Han, K.; Jaramillo-Villegas, J.A.; Noman, A.A.; Wang, C.; et al. High-Q silicon nitride microresonators exhibiting low-power frequency comb initiation. Optica 2016, 3, 1171–1180. [Google Scholar] [CrossRef]
  72. Bao, C.; Xuan, Y.; Wang, C.; Jaramillo-Villegas, J.A.; Leaird, D.E.; Qi, M.; Weiner, A.M. Soliton repetition rate in a silicon-nitride microresonator. Opt. Lett. 2017, 42, 759–762. [Google Scholar] [CrossRef]
  73. Gaeta, A.; Lipson, M.; Kippenberg, T. Photonic-chip-based frequency combs. Nat. Photonics 2019, 13, 158–169. [Google Scholar] [CrossRef]
  74. Gao, M.; Yang, Q.-F.; Ji, Q.-X.; Wang, H.; Wu, L.; Shen, B.; Liu, J.; Huang, G.; Chang, L.; Xie, W.; et al. Probing material absorption and optical nonlinearity of integrated photonic materials. Nat. Commun. 2022, 13, 3323. [Google Scholar] [CrossRef] [PubMed]
  75. Pavlov, V.; Kondratiev, N.; Cordette, S.; Lobanov, V. Numerical simulation of pump power-induced heating processes in silicon nitride photonic chips. Proc. SPIE 2023, 12322, 73. [Google Scholar]
  76. Matsko, A.B.; Savchenkov, A.A.; Yu, N.; Maleki, L. Whispering-gallery-mode resonators as frequency references. I. Fundamental limitations. J. Opt. Soc. Am. 2007, B 24, 1324–1335. [Google Scholar] [CrossRef]
  77. Ariaga, N.; Longstaff, A.; Fletcher, S.; Pan, W.; Mian, N. Thermal modelling using dynamic mode decomposition for thermal error compensation in the temperature domain. In Proceedings of the Special Interest Group Meeting: Thermal Issues, Aachen, Germany, 26–27 February 2020. [Google Scholar]
  78. Brasch, V.; Geiselmann, M.; Pfeiffer, M.H.P.; Kippenberg, T.J. Bringing short-lived dissipative Kerr soliton states in microresonators into a steady state. Opt. Express. 2016, 24, 29312–29320. [Google Scholar] [CrossRef]
  79. Lydiate, J. Modelling and simulation of a thermally induced optical transparency in a dual micro-ring resonator. R. Soc. Open Sci. 2017, 4, 170381. [Google Scholar] [CrossRef]
  80. Pavlov, V.I.; Khatyrev, N.P.; Kondratiev, N.M.; Bilenko, I.A. Comparison of Methods for Calculating Thermal Frequency Shifts in Integrated Si3N4 Microresonators. In Proceedings of the 2022 International Conference Laser Optics (ICLO), Saint Petersburg, Russia, 20–24 June 2022. [Google Scholar]
  81. Black, E.D. An introduction to Pound–Drever–Hall laser frequency stabilization. Am. J. Phys. 2001, 69, 79–87. [Google Scholar] [CrossRef]
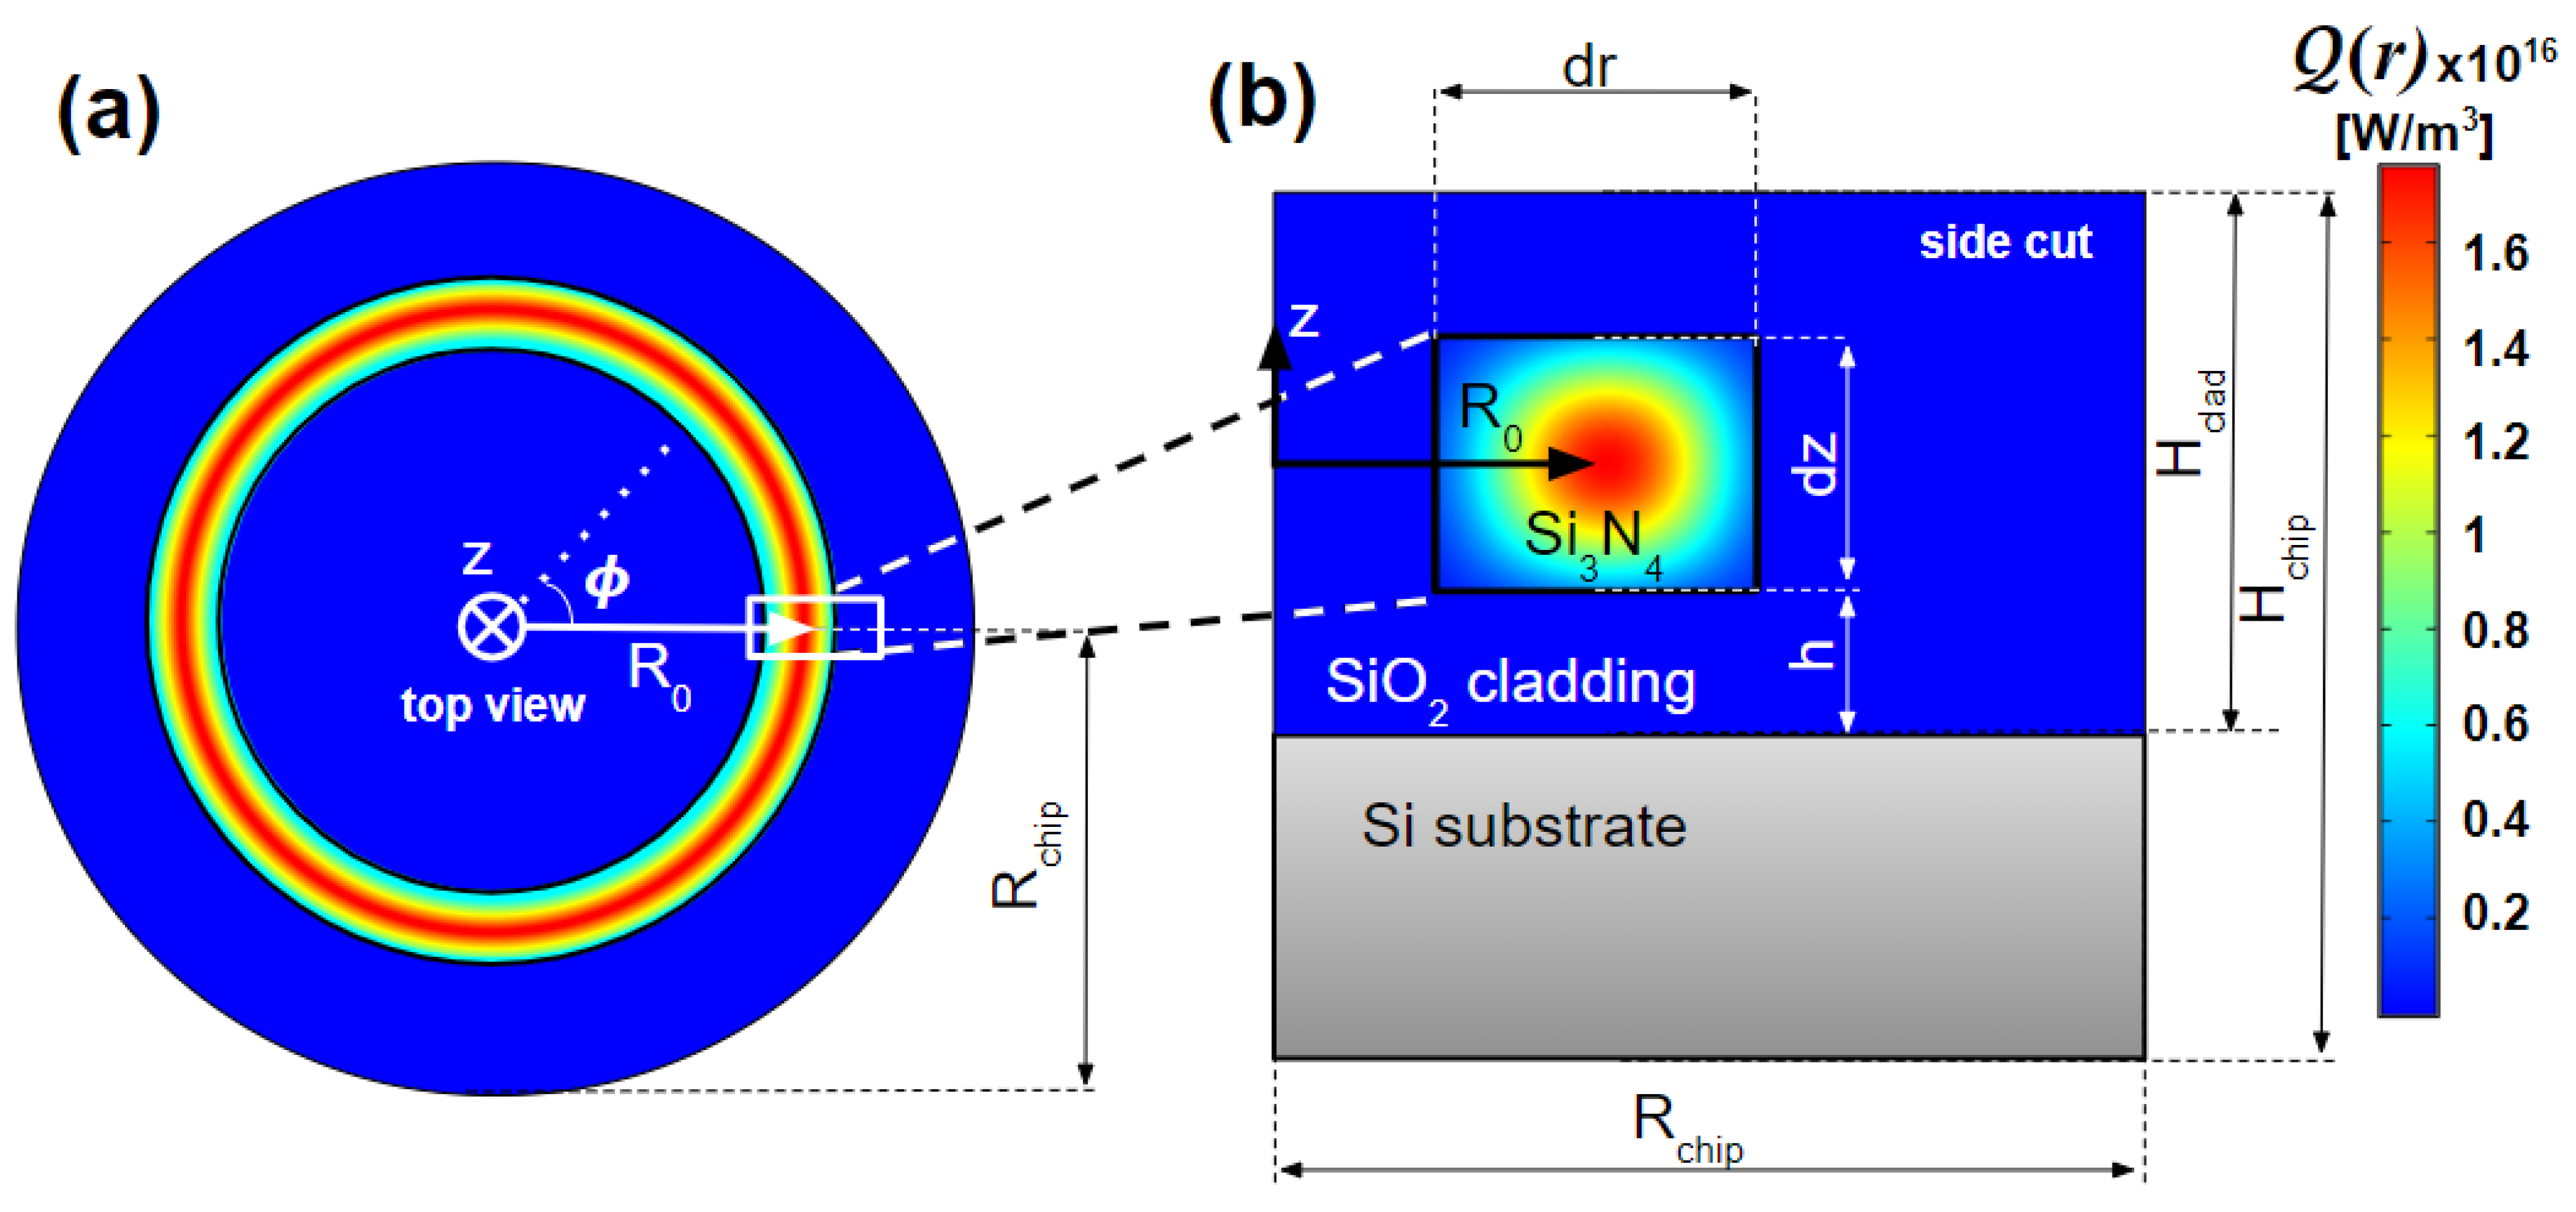
Figure 1. The integrated microresonator model used in FEM simulation: (a) top view, (b) side cut. Color map shows heat source distribution Q ( r ) inside the waveguide. R 0 is the radius of the microresonator. We simulated microresonators with a radius from 24 µm to 840 µm. The transverse dimensions d r and d z of the waveguide were varied in the range from 20 nm to 2000 nm.
Photonics 10 01131 g001
Figure 2. (a): Blue line is data obtained by the numerical solution of (1) for P = 10 mW heating of 24 μ m ring resonator with waveguide width d r = 1 μ m and height d z = 0.8 μ m; red dashed line shows approximation (fitting) by one exponent; green dashed line depicts approximation (fitting) by two exponents; (b): discrepancy ( T i ( t i ) T ( t i ) ) of one-, two-, and three-exponent fit (red, green, and blue dashed lines, respectively) from numerical simulation data. (c): Coefficient of determination r 2 for different number of exponents N from 1 to 15.
Photonics 10 01131 g002
Figure 3. (a): Examples of the spatial shapes C ( k ) ( r ) normalized to 1 Kelvin (colorbars on the right side of each panel) of the thermal modes of the microring resonator with default material and geometrical parameters specified in Table 1 and Table 2, shown in Figure 1: (a) side cut and (b) top view for the thermal mode with the maximum overlap integral C ( k ) ( r ) · Q ( r ) d V C ( k ) ( r ) · C ( k ) ( r ) d V normalized to δ θ ( k ) with δ θ ( k ) = 162,388 Hz; (c) side cut and (d) top view for the slowest thermal mode of the cladding subsystem with δ θ ( k ) = 17,782 Hz. Colorbars and insets on the left side of panels (a) and (c) show heat source distribution Q ( r ) inside the waveguide.
Photonics 10 01131 g003
Figure 4. Stem lines—exponent amplitude spectrum γ ( k ) / δ θ ( k ) obtained by the thermal mode decomposition method for microring resonator with default material and geometrical parameters specified in Table 1 and Table 2; different symbols represent the amplitudes for exponential approximation (10) with the certain amount of exponents from 1 to 15, red line with red circle—theoretical effective thermal relaxation rate and exponent amplitude obtained from Equations (7) and (8), red dotted line with red rhombus—theoretical effective thermal relaxation rate and exponent amplitude obtained from Equations (16) and (8), red dashed and dash-dotted lines—theoretical lowest effective thermal relaxation rate of the cladding (Equation (17)) and silicon substrate (Equation (18)).
Photonics 10 01131 g004
Figure 5. (a): Blue line—numerical simulation data, red dashed line—approximation by one exponent, green dots—reconstructed dynamics from the exponent amplitude spectrum (stem lines in Figure 4) and (b): discrepancy ( T i ( t i ) T ( t i ) ) of one (red dashed line) from numerical simulation data for P = 10 mW heating of 24 μ m ring resonator with waveguide width d r = 1 μ m and height d z = 0.8 μ m.
Photonics 10 01131 g005
Figure 6. Comparison of the effective (a): thermal relaxation rate and (b): optical absorption rate calculated using different methods for a wide range of the waveguide thermal conductivity k wg : red solid line corresponds to Equation (7) in panel (a) and to Equation (8) in panel (b), red dashed line—Equation (17), squares—one-exponent approximation ((10), k = 0 ), crosses—two-exponent approximation ((10), k = 0 , 1 ), circles—seven-exponent approximation ((10), N = 7 ). The coefficient of determination r 2 for the approximations is shown by color. Blue stars correspond to the maximum of exponent amplitude spectrum (stem lines in Figure 4); grey stars stand for the slowest thermal mode of the cladding subsystem. Vertical lines correspond to the thermal conductivity coefficients of Si 3 N 4 , SiO 2 , and Si (see Table 1).
Photonics 10 01131 g006
Figure 7. Comparison of the effective (a): thermal relaxation rate and (b): optical absorption rate calculated using different methods for a wide range of the cladding thermal conductivity k c l a d : red solid line corresponds to Equation (7) in panel (a) and to Equation (8) in panel (b), red dashed line—Equation (17), squares—one-exponent approximation ((10), k = 0 ), crosses – two-exponent approximation ((10), k = 0 , 1 ), circles—seven-exponent approximation ((10), N = 7 ). The coefficient of determination r 2 for the approximations is shown by color. Blue stars correspond to the maximum of exponent amplitude spectrum (stem lines in Figure 4); grey stars stand for the slowest thermal mode of the cladding subsystem. Vertical lines correspond to the thermal conductivity coefficients of Si 3 N 4 , SiO 2 , and Si (see Table 1).
Photonics 10 01131 g007
Figure 8. Comparison of the effective (a): thermal relaxation rate and (b): optical absorption rate calculated using different methods for a wide range of the microresonator radius R 0 : red solid line corresponds to Equation (7) in panel (a) and to Equation (8) in panel (b), red dashed line—Equation (17), squares—one-exponent approximation ((10), k = 0 ), crosses—two-exponent approximation ((10), k = 0 , 1 ), circles—seven-exponent approximation ((10), N = 7 ). The coefficient of determination r 2 for the approximations is shown by color. Blue stars correspond to the maximum of exponent amplitude spectrum (stem lines in Figure 4); grey stars stand for the slowest thermal mode of the cladding subsystem. Red vertical line in (a) and (b) corresponds to the default microresonator radius (see Table 1) R 0 = 24 μ m.
Photonics 10 01131 g008
Figure 9. Comparison of the effective (a): thermal relaxation rate and (b): optical absorption rate calculated using different methods for a wide range of the waveguide width d r : red solid line corresponds to Equation (7) in panel (a) and to Equation (8) in panel (b), red dashed line—Equation (17), squares—one-exponent approximation ((10), k = 0 ), crosses—two-exponent approximation ((10), k = 0 , 1 ), circles—seven-exponent approximation ((10), N = 7 ). The coefficient of determination r 2 for the approximations is shown by color. Blue stars correspond to the maximum of exponent amplitude spectrum (stem lines in Figure 4); grey stars stand for the slowest thermal mode of the cladding subsystem. Red vertical line in (a) and (b) corresponds to square waveguide d r = 0.8 μ m (see Table 1).
Photonics 10 01131 g009
Figure 10. Squares and stars represent the amplitudes for exponential approximation (10) with N = 1 and 9 exponents, respectively, for waveguides with a width of 1000 nm, 500 nm, and 2000 nm (red, green, and gray symbols, respectively); stem line—exponent amplitude spectrum γ ( k ) / δ θ ( k ) obtained by the thermal mode decomposition method for microring resonator with default material and geometrical parameters specified in Table 1 and Table 2 for different waveguide widths d r : red lines—1000 nm, green lines—500 nm, grey—2000 nm, red/green/grey solid line—theoretical effective thermal relaxation rates from Equation (7) with d r = 1000 nm, 500nm, and 2000 nm, respectively, red/green/grey dotted line—theoretical effective thermal relaxation rate from Equation (16) with d r = 1000 nm, 500 nm, and 2000 nm, respectively, red dashed line—theoretical effective thermal relaxation rate from Equation (17), red/green/grey dash-dotted line—rough estimation via averaging of effective thermal relaxation rates Equation (16) and Equation (17) ( δ θ a v = δ θ m o d · δ θ s l o w ) with d r = 1000 nm, 500 nm, and 2000 nm, respectively, red dashed line—Equation (17).
Photonics 10 01131 g010
Figure 11. Comparison of the effective (a): thermal relaxation rate and (b): optical absorption rate calculated using different methods for a wide range of the distance between the waveguide and the silicon substrate h: red solid line corresponds to Equation (7) in panel (a) and to Equation (8) in panel (b), red dashed line—Equation (17), squares—one-exponent approximation ((10), k = 0 ), crosses—two-exponent approximation ((10), k = 0 , 1 ), circles—seven-exponent approximation ((10), N = 7 ). The coefficient of determination r 2 for the approximations is shown by color. Blue stars correspond to the maximum of exponent amplitude spectrum (stem lines in Figure 4); grey stars stand for the slowest thermal mode of the cladding subsystem. Red vertical line in (a) and (b) corresponds to h = 4 μ m.
Photonics 10 01131 g011
Figure 12. (a) Temperature distribution in the integrated chip for a voltage of U = 4.3 V. (b) The blue dots are the results of the numerical simulation of the frequency shift by the heater as a function of voltage, and the red line is the approximation of the experimentally measured frequency shift: δ f e x p = 8.05 · U 2 .
Photonics 10 01131 g012
Figure 13. Proposed experimental setup for the validation of the method of the effective thermal parameters determination via thermal mode decomposition. P L S and ω L S —laser source optical power and generation frequency, ω 0 —microresonator resonant frequency, δ T = δ T ( k ) from Equation (10).
Photonics 10 01131 g013
Table 1. Default chip parameters used for FEM simulations.
ParameterValue
Intracavity heating power P10 mW
Ambient temperature T 0 300 K
Heat transfer coefficient h a i r 10 W/(m 2 · K)
Microresonator radius R 0 24 µm
Waveguide width d r 1 µm
Waveguide height d z 0.8 µm
Chip height H c h i p 240 µm
SiO 2 cladding height H c l a d 11 µm
Waveguide-substrate distance h in SiO 2 cladding4 µm
Chip radius R c h i p 1 mm
Table 2. Physical properties of waveguide material used for FEM simulations.
Physical PropertiesSi 3 N 4 SiO 2 Si
Density ρ (kg/m 3 )329022002329
Specific heat capacity C p (J/(kg · K)800730700
Thermal conductivity k (W/(m · K)201.4130
Disclaimer/Publisher’s Note: The statements, opinions and data contained in all publications are solely those of the individual author(s) and contributor(s) and not of MDPI and/or the editor(s). MDPI and/or the editor(s) disclaim responsibility for any injury to people or property resulting from any ideas, methods, instructions or products referred to in the content.