Article

Assessment of the Impact of Nanowarming on Microstructure of Cryopreserved Fibroblast-Containing 3D Tissue Models Using Mueller Polarimetry

1
LPICM, CNRS, École Polytechnique, Institut Polytechnique de Paris, Route de Saclay, 91128 Palaiseau, France
2
Department of Tissue Engineering and Regenerative Medicine TERM, University Hospital Wuerzburg, 97070 Wuerzburg, Germany
3
Fraunhofer Institute for Silicate Research ISC, 97082 Wuerzburg, Germany
4
Department of Biomedical Engineering, Florida International University, Miami, FL 33199, USA
*
Authors to whom correspondence should be addressed.
These authors contributed equally to this work.
Photonics 2023, 10(10), 1129; https://doi.org/10.3390/photonics10101129
Submission received: 29 July 2023 / Revised: 30 September 2023 / Accepted: 2 October 2023 / Published: 9 October 2023
(This article belongs to the Special Issue Polarization Optics in Biomedical Applications)

Abstract

:
We studied the impact of two different thawing mechanisms on the microstructure of defrosted cryopreserved 3D tissue models using transmission Mueller microscopy and a statistical analysis of polarimetric images of thin histological sections of defrosted tissue models. The cryopreserved 3D tissue models were thawed by using either a 37 °C water bath or radio-frequency inductive heating with the magnetic nanoparticles embedded into the 3D tissue model during the preparation process. Polarimetric measurements were conducted at 700 nm and the acquired Mueller matrices of the samples were post-processed using the differential decomposition and the statistical analysis of the maps of the azimuth of the optic axis. Our results indicate the sensitivity of polarimetry to the changes in thawed tissue morphology compared to that of reference non-frozen tissue. Thus, Mueller microscopy can be used as a fast complementary technique to the currently accepted gold standard methods for the assessment of the cryopreserved tissue microstructure after thawing.

1. Introduction

Cryopreservation is widely used as a method for the low temperature storing of tissues and organs. Freezing biological specimens at cryogenic temperatures and later thawing them at room temperature is often followed by the growth of large ice crystals [1,2]. Such a process causes damage to the cellular membranes and the extracellular collagen matrix [3,4,5]. To minimize the formation of large ice crystals, so-called cryoprotective agents (CPAs) are added before fast freezing to promote vitrification (the kinetic process of liquid transformation into glass-like non-crystalline solid) [6,7]. In addition to the challenges of the cooling process, the rewarming of the vitrified biological sample is also crucial to minimize potential damage to cells. Rapid or uneven warming may induce cracks in a brittle vitrified tissue. Slow warming can prevent cracking, however, it facilitates the formation of ice nuclei and consequent growth of tissue-damaging ice crystals.
Traditionally, the frozen tissue sample is rewarmed by immersion in a water bath at temperatures of 37 °C, but this approach works for small samples only with a volume below 3 mL [8,9]. Large biological samples (e.g., whole organs) require faster and more uniform rewarming to prevent cracking and damage to the biological tissue. A promising alternative is the process of nanowarming, where magnetic nanoparticles (MNPs) are inductively heated by using a high frequency coil [9,10,11]. The uniform distribution of MNPs throughout the tissues will assure a sufficiently uniform heating rate, thus avoiding the formation of large thermal gradients that result in thermal stress and consequent fractures within the tissue. However, there are only a few studies investigating the use of nanowarming in cryopreservation due to the lack of NPs stability against aggregation in cryopreservation solutions [9,10].
Hence, biological tissues’ cryopreservation, and their long-term storage with following rewarming, is a challenging task to solve that is of paramount importance for the fields of 3D test tissue systems, regenerative medicine, tissue engineering and organ implants. The development of 3D tissue models allows for reducing the use of animals in studies and the experiments involving the introduction of chemicals and/or drugs. Additionally, 3D in vitro tissue models could be employed to better investigate the cryopreservation and defrosting mechanisms, as a basis to improve transplant organs’ storage.
To characterize 3D tissue models, immunofluorescence staining can be performed. It allows the visualization of specific components within a tissue or cell type and provides structural information about the cell [12]. However, fast and non-destructive tissue characterization methods are required to reduce sample loss and increase the applicability of cryopreserved samples. In our studies, we explored the potential of Mueller microscopy combined with the statistical data post-processing to become an alternative to the conventional staining method.
In general, light–tissue interactions have been well studied, and using polarized light as a tool for the analysis of the inner structure of biological tissue has found applications in tissue characterization and the detection of both benign and malignant lesions [13,14,15,16,17,18,19,20,21]. Initially, the membrane integrity brake, caused by cryo-injury, is anticipated to be followed by changes in the tissue structure and its morphology [10,22,23]. As a consequence, the tissue-scattering properties will be altered, resulting in a loss in the light polarization degree.
The goal of this study is to suggest a simple and reliable quantitative approach for the assessment of the micro-structural changes in cryopreserved tissues after thawing with different methods by using Mueller polarimetry and statistical analysis. For this purpose, two different defrosting mechanisms were tested on frozen 3D in vitro fibroblasts-containing connective tissue models. All samples were cultured on MNP-modified electrospun nanofiber nonwoven fleeces and then split into three groups. A reference sample group was analyzed without freezing and thawing. Two other groups of samples were frozen in liquid nitrogen, with one group additionally modified with MNP-modified alginate hydrogel capsules prior to freezing. After that, the group not modified with additional NPs was defrosted in a water bath, while the second one—with radio frequency, inductive heating of the MNPs. Figure 1 shows the flowchart of the design of our studies.
Immunofluorescence staining was performed for the investigation of the cell distribution on the fiber fleeces. For this purpose, the non-thawed tissue models were compared with the models thawed in a water bath or with the help of MNPs-assisted inductive heating. To check whether the samples’ morphology was affected by the different thawing mechanisms, a transmission imaging Mueller microscope was used for the optical assessment of thin histological sections of tissue models. All polarimetric properties of the samples under examination were extracted from the measured Mueller matrices by applying the differential decomposition algorithm. Complementary statistical analysis was used to validate the statistical significance of the experimental data obtained from three tissue models groups. In the next sections, we provide a detailed description of the samples’ preparation methodology, alongside a description of the optical set-up and the decomposition algorithm used for the data analyses and extraction, with additional information on the interpretation of the results from the statistical analyses.

2. Materials and Methods

2.1. Samples’ Preparation and Characterization

2.1.1. Chemicals for Cell Culture

Antibiotic-Antimycotic (Gibco, Thermo Fisher Scientific, Waltham, MA, USA), antibody dilution buffer (DSC Innovative Diagnostik Systeme, Hamburg, Germany), citrate buffer (Sigma-Aldrich, Darmstadt, Germany), dimethyl sulfoxide (C2H6OS, DMSO, Sigma-Aldrich, Darmstadt, Germany), Dulbecco’s Modified Eagle Medium (1X) + GlutaMAXTM-1 (DMEM, Gibco, Thermo Fisher Scientific, Waltham, MA, USA), Dulbecco’s Phosphate Buffered Saline (PBS , Sigma-Aldrich, Darmstadt, Germany), Dulbecco’s Phosphate Buffered Saline (PBS+, Sigma-Aldrich, Darmstadt, Germany), fetal calf serum (FCS, Biochrom, Berlin, Germany), Fluoromount-G® DAPI (4 ,6-diamidine-2-phenylindole = DAPI, Invitrogen, Thermo Fisher Scientific, Waltham, MA, USA), hydroxyethyl starch (HES, BOC Sciences, London, UK), isopropanol (Carl Roth, Karlsruhe, Germany), L-ascorbic acid-2-phosphate sesquimagnesium salt hydrate (C6H6Mg1.5O9P·xH2O, 95%, Sigma-Aldrich, Darmstadt, Germany), paraffin (Sigma-Aldrich, Darmstadt, Germany), trypan blue (Sigma-Aldrich, Darmstadt, Germany), ethylenediaminetetraacetic acid (EDTA, Gibco, Thermo Fisher Scientific, Waltham, MA, USA), TweenTM 20 (Sigma-Aldrich, Darmstadt, Germany), xylene (97%, Carl Roth, Carlsruhe, Germany), rabbit-anti-vimentin (Abcam, Cambridge, UK), and donkey anti-rabbit-555 (Invitrogen, Thermo Fisher Scientific, Waltham, MA, USA).

2.1.2. Preparation of MNP-Doped Fibers and Capsules

The synthesis of the MNPs was based on the method developed by Granath et al. [24]. In addition, to prevent NP aggregation, the prepared MNPs were modified with a silica shell [25]. Subsequently, MNPs were incorporated into alginate capsules and nanofibers according to the previously described procedure [26,27].

2.1.3. Cultivation of Fibroblasts on MNP-Doped Fleeces

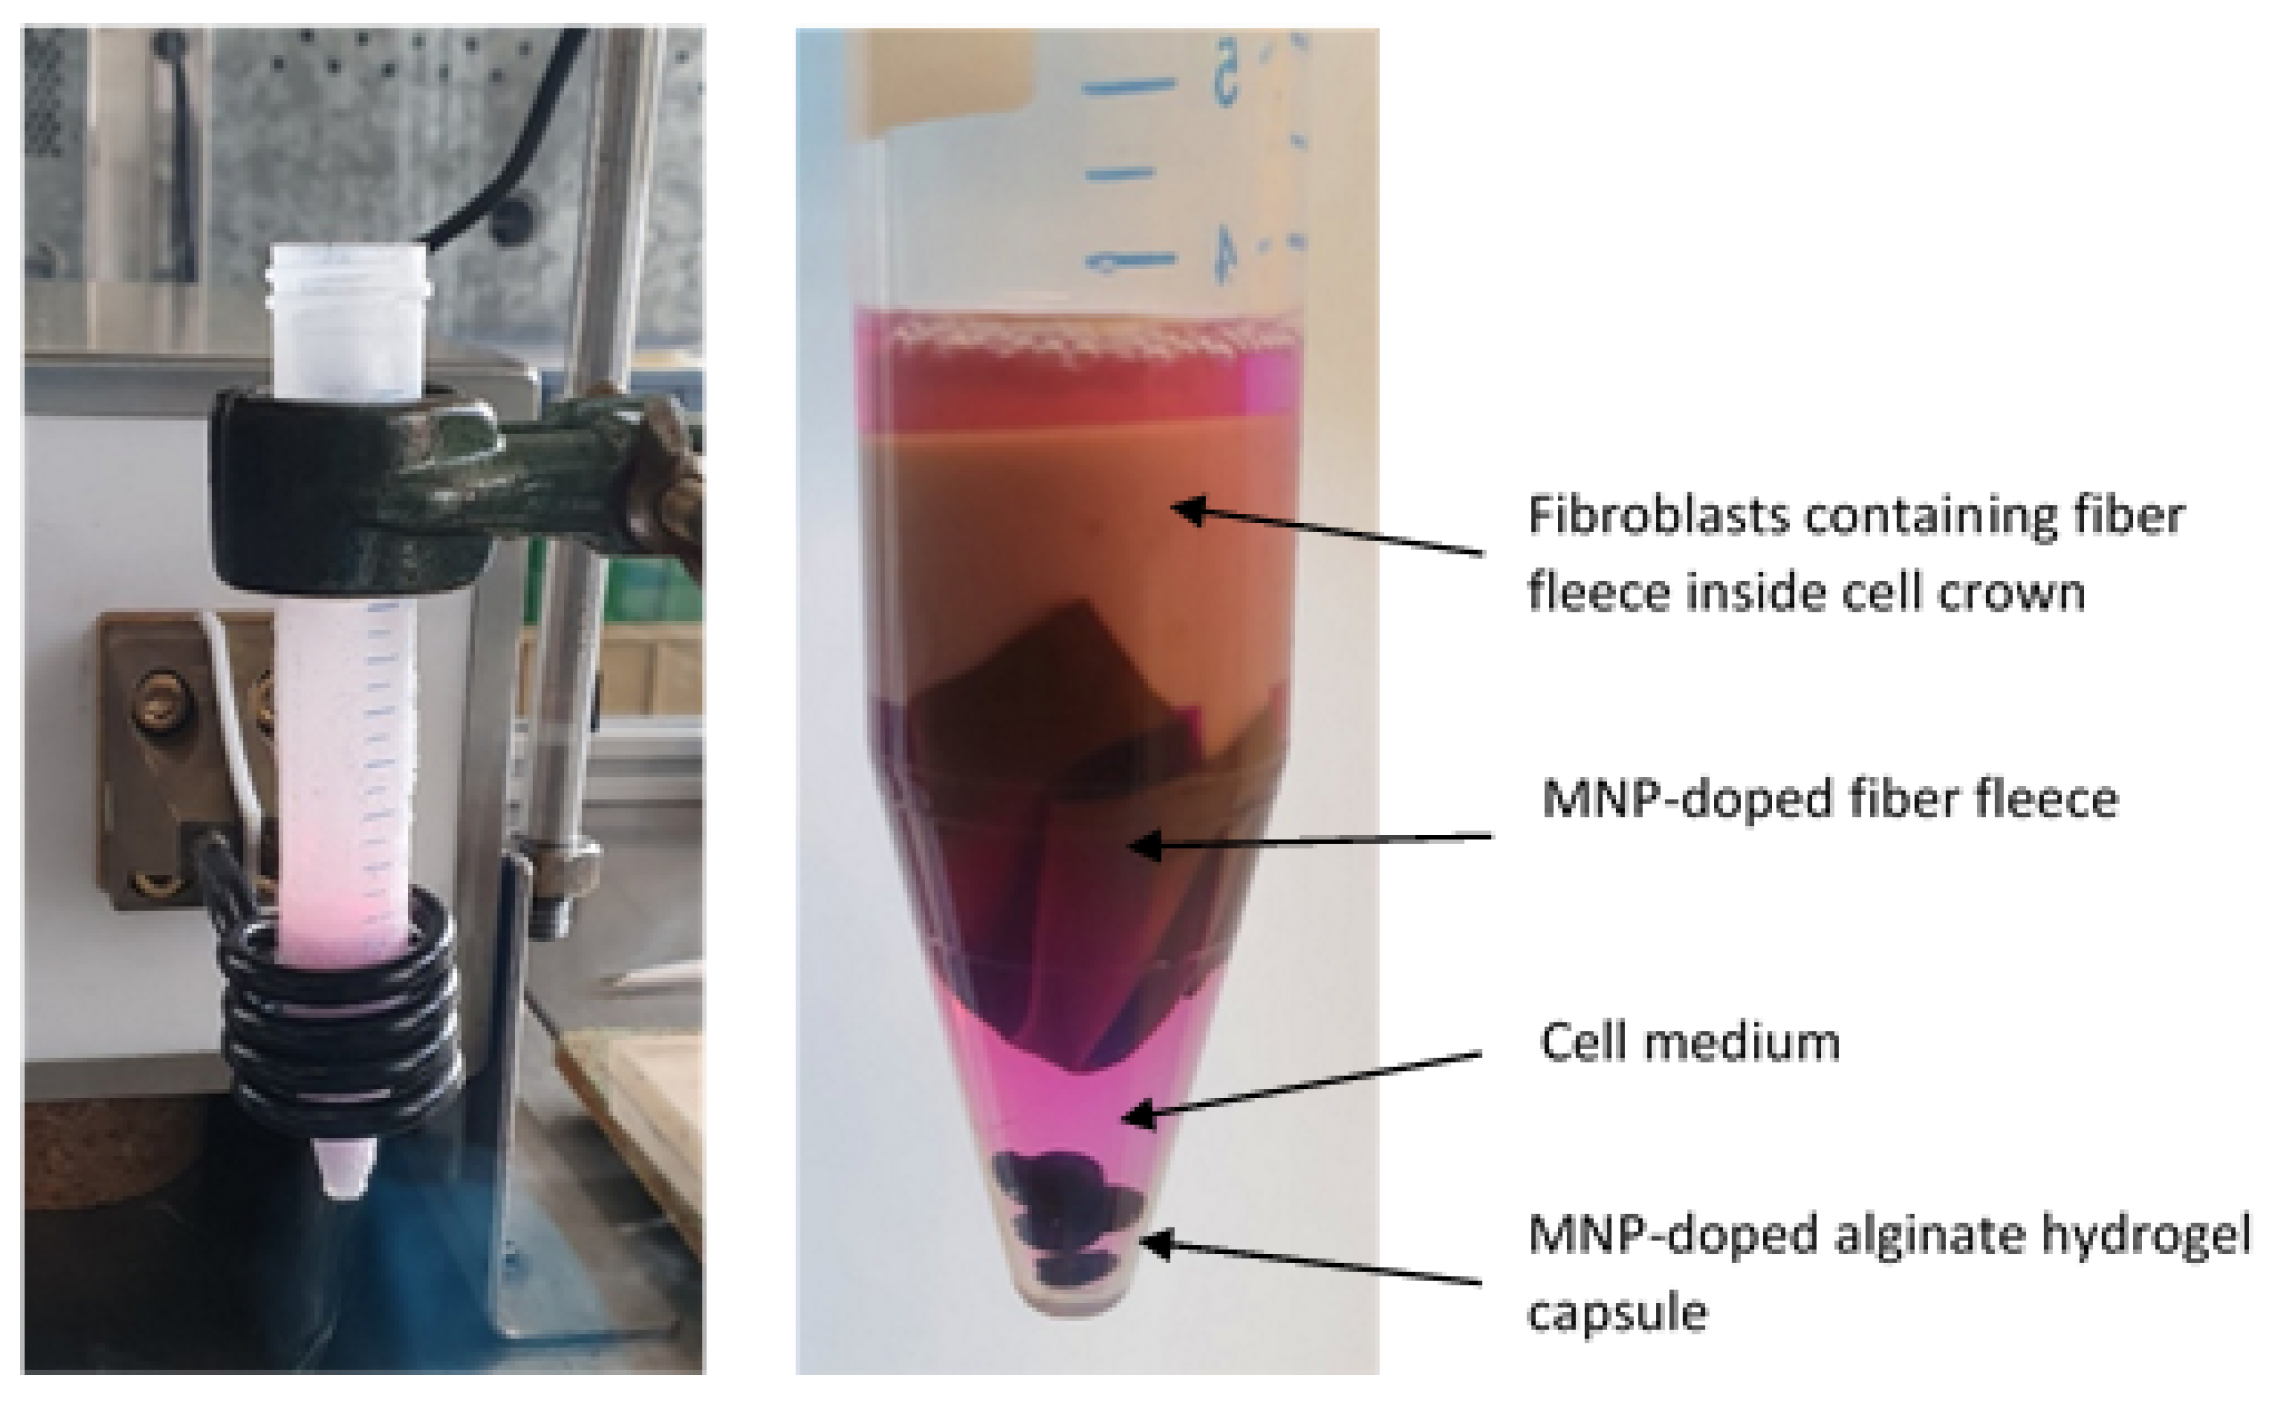
MNP-modified fiber fleeces were cut (1.3 × 1.3 cm) and washed with deionized water, as well as clamped into the cell crown. After autoclaving, the wrapped cell crowns were transferred to 24-well plates and stored in PBS solution. After 24 h, the solution was removed by suction and human dermal fibroblasts (hdF) were seeded. In this process, 30,000 cells were added per cell crown in DMEM containing 10 wt% FCS, 1 wt%. Antibiotic Antimycotic and 500  μ M ascorbic acid-2-phosphate. The medium was changed 3 times per week. After 2 weeks, 2 approaches were combined in each case, to increase the tissues thickness. The freezing experiment started after an additional 2 weeks of culture. For each thawing method, two fibroblast-containing models were selected and frozen, whereas two other unfrozen tissue models were used as the reference for control. Fibroblast medium was used as freezing medium, with additional CPAs: 2 wt% DMSO and 10 wt% HES. The fibroblast-containing models were placed into 15 mL centrifuge tubes containing cryo medium (2 mL). Every sample for nanowarming was additionally modified with 5 MNP-doped alginate hydrogel capsules (inside and below the model). In addition, a MNP-doped fiber fleece was added below the 3D model (see Figure 2). Thus, the total amount of MNPs per sample was 6.53 mg. The samples were then placed in a styrofoam box and stored in a freezer at −80 °C. After 24 h, the samples were transferred to a nitrogen tank. The tissues with MNPs were thawed using an S4W induction coil, whereas the others without MNPs were heated in a water bath at 37 °C. Subsequently, the samples were transferred to a 12-well microtiter plate with fresh medium (2 mL each) and incubated at 37 °C and 5% CO2.

2.1.4. Preparation and Characterization of Tissue Sections

The tissue models were first embedded in paraffin, including an ascending ethanol series from water to xylol. After cutting, the paraffin Sections (10  μ m thickness) were deparaffinized and rehydrated using an ascending ethanol series from xylol to water. For preparing immunofluorescence staining, the samples were first placed in a 100 °C pre-warmed 10% citrate buffer. After 20 min, the sections were transferred to deionized water and then to a PBS/Tween-20 wash buffer. Then, 0.2% Triton X 100 in PBS- was added and the tissue sections were washed with PBS-/Tween-20 wash buffer after 5 min. The samples were blocked with a mixture of 5% donkey serum in antibody dilution solution for 20 min. The primary antibody rabbit-anti-vimentin was applied at a ratio of 1:1000 overnight. The next day, the samples were washed three times for 5 min with PBS/Tween-20 wash buffer and incubated for 1 h with the diluted secondary antibody donkey anti-rabbit-555 (1:100). The tissue sections were finally washed three times with PBS/Tween-20 wash buffer before being embedded in FluoromountGTM containing DAPI. After drying, the results were viewed under a fluorescence microscope. For the evaluation of the DAPI staining, two tissue sections per sample were selected. The number of cells was estimated at three randomly selected zones of each tissue section along the fiber fleece. The calculated values were averaged for each sample and the final cell number was normalized to a cross-sectional area of 10,000  μ m 2 .
A BZ-9000 meter from Keyence was used for light microscopy images. The recorded images of the 3D tissue models were obtained in fluorescence mode under 10× magnification. One filter with an excitation wavelength of 555 nm was used in the measurements to detect the fluorophores bound to the secondary antibody. Another filter with an excitation wavelength of 360 nm was used for the fluorescence of DAPI.

2.1.5. Induction Thawing Method

Induction heating was performed using an induction heater from Himmelwerk, model Sinus 102 for various water-cooled coils (S4W and SSH type). The amplitude of the magnetic field was controlled by the magnitude of the AC voltage applied to the inductive heater. For this purpose, the applied voltage was varied in the range of 90% and 99% of the maximum. Temperature recordings took place using a model LT pyrometer (Optris, SensorTherm, Steinbach, Germany). To ensure the uniform influence of the magnetic field, the samples were clamped centrally in the induction coil. The sampling rate of the measuring device for recording the temperature curve was 2 ms.

2.2. Polarimetric Experimental Set-Up

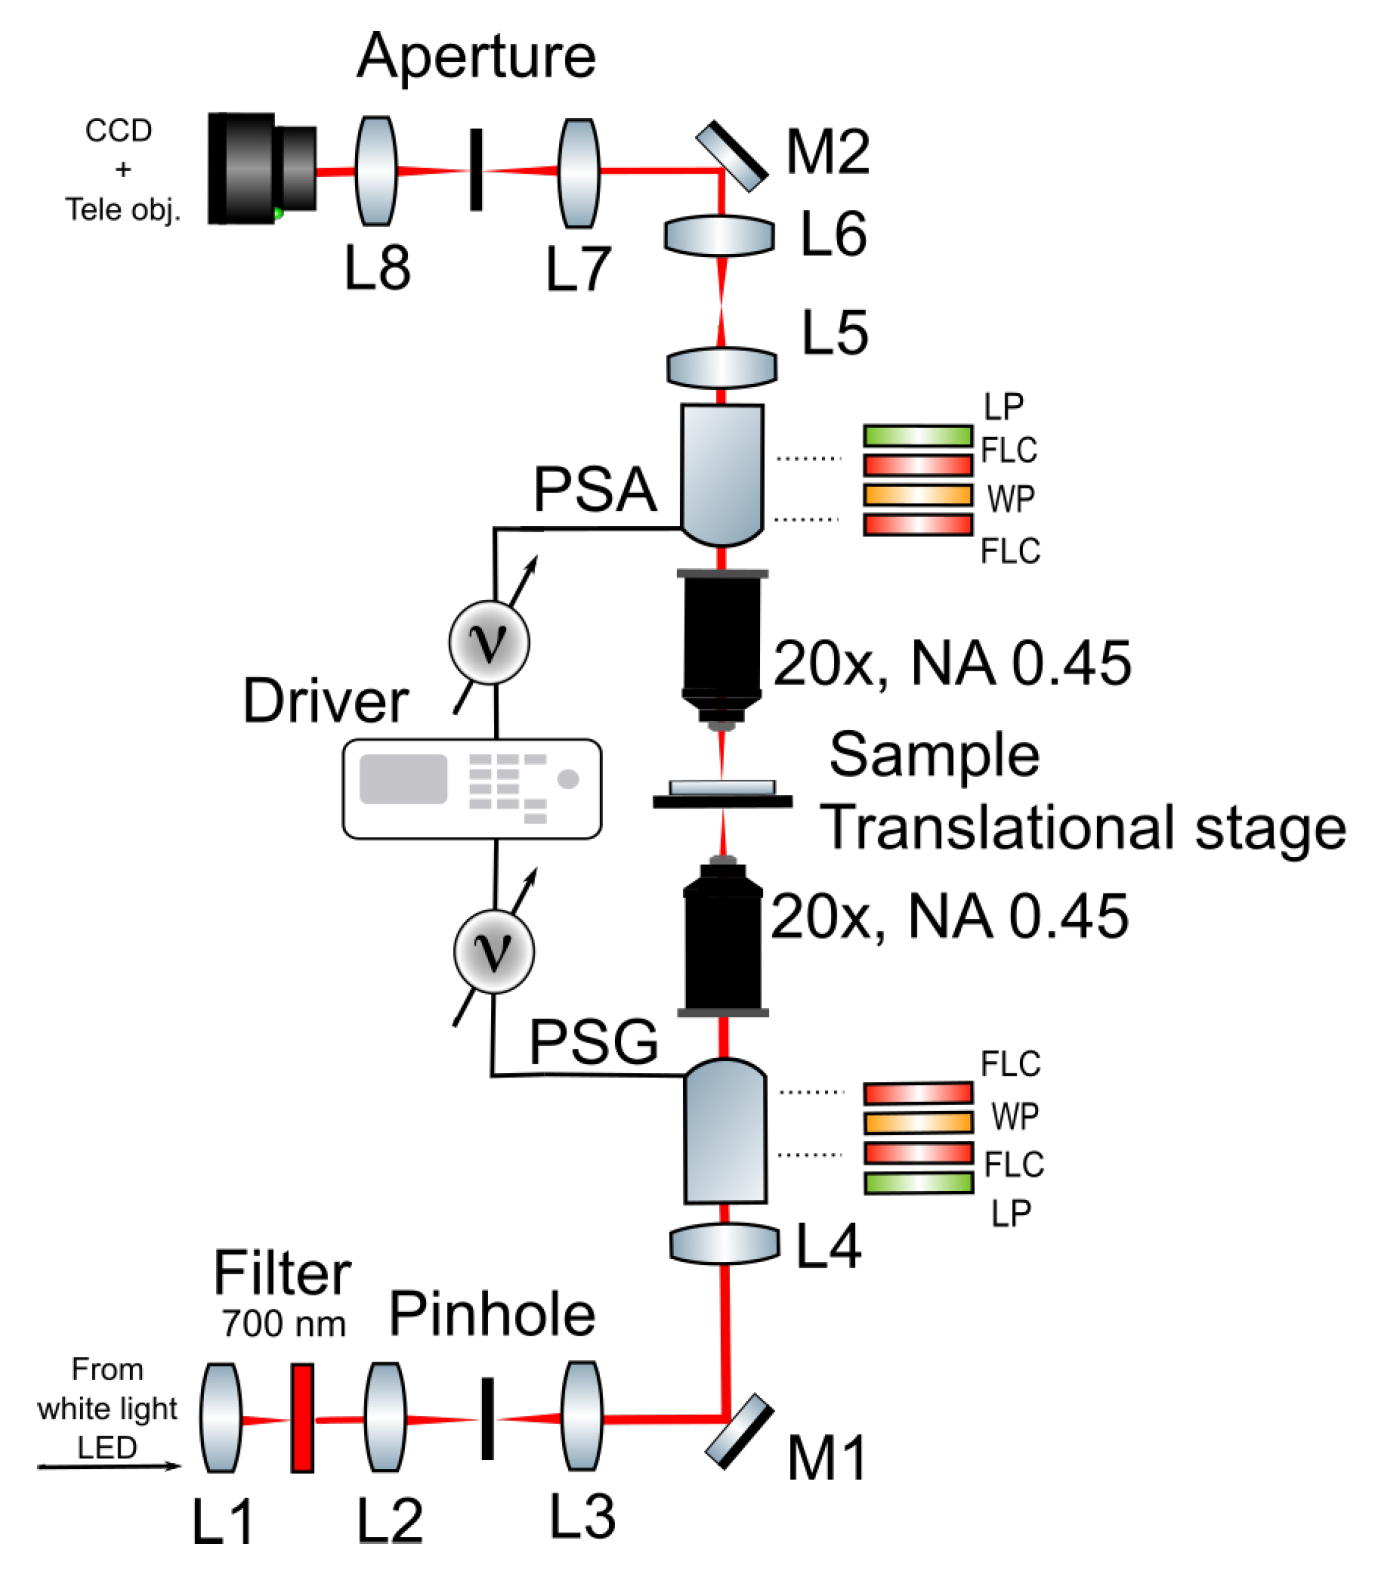
The complete description of the custom-built Mueller microscope and principles of its operation can be found elsewhere [28,29]. For the sake of clarity, we provide a brief description of the experimental set-up below (see Figure 3). White-light LED was chosen as a light source, where a color filter at wavelength 700 nm, FWHM 15 nm was selected to spectrally filter the probing light beam. A spatial filter (pinhole, 500  μ m in diameter) was inserted in the illumination arm to simultaneously control the direction and the angular aperture of the light beam. Both the polarization state generator (PSG) in the illumination arm and the polarization state analyzer (PSA) in the detection arm comprise identical optical elements, but arranged in reverse order. They include a linear polarizer (LP), two ferroelectric liquid crystal (FLC) retarders (Meadowlark FPR-200-1550) and a quarter-wave retarder (WP) placed between the two FLC retarders. The first FLC serves as a quarter-wave plate, while the second FLC as a half-wave plate.
The orientation of the fast optic axis of each FLC retarder within the plane orthogonal to the direction of light propagation can be modified by applying a voltage. The scattered light by a sample is collected using the objective lenses (Nikon, 20×, NA = 0.45, Tokyo, Japan) and the microscopic image is formed in the real plane. On the other hand, the optionally retractable Bertrand lens allows for switching between the real and the Fourier plane imaging. The latter is used during the calibration step for precise optical alignment. To monitor the image preview and to capture the images of interest, a telephoto lens was coupled and set to infinity to matrix photodetector (16-bit, single-channel, CCD camera, 600 × 800 pixels, AV Stingray F-080B, Edmund Optics, Barrington, IL, USA). The field of view was adjusted to 400  μ m, thus having a spatial resolution of 0.5  μ m/pixel. In order to increase the accuracy and the precision of the measurements, the condition numbers of both PSG and PSA were optimized. In this way, the signal-to-noise ratio was increased [30]. To measure the  4 × 4  Mueller matrix of a sample, at least 16 intensity measurements have to be performed. The voltage modulation of the FLCs in both PSG and PSA allows for generating 4 different input and 4 different output polarization states for capturing 16 intensity images. The Mueller microscope was calibrated using the eigenvalue calibration method with the reference samples, as described in reference [31].
During the measurements, the use of samples with non-uniform thickness caused variations in the intensity detected by the sensor of the CCD camera. For this particular reason, a normalization to  ln ( m 11 )  or  ln 2 ( m 11 )  was applied for the images of the polarization and the depolarization parameters, respectively.

2.3. Post-Processing of Polarimetric Data with Differential Decomposition

Let us now consider the propagation of a polarized light beam along the z–axis of a Cartesian coordinate system. The medium is highly anisotropic and introduces both changes in the polarization state and degree. Also, the medium is assumed to be homogeneous transversally (along x,y) and inhomogeneous longitudinally (along z). Based on this concept, the following differential equation would be valid [32]:
d M d z = m M ,
where the initial Mueller matrix M will be modified by a factor of m. In this case this is another  4 × 4  matrix, containing mean and mean squared values of polarization properties [33]:
m = m m + m u = m + Δ m 2 z ,
After rearranging, substituting m and integrating with respect to the boundary conditions, Equation (1) has an exponential solution:
ln M = m z + 1 2 Δ m 2 z 2
From here, the matrix logarithm could be obtained by first solving the eigenvalue–eigenvector problem for M and then forming D = diag[ln( d i )], where  d i  are the eigenvalues of M. Finally, using the matrix V comprising the eigenvectors of M, the matrix logarithm and the two counterparts of m can be calculated as follows [33]:
L ln M = VDV 1 ,
m m = 1 2 ( L GL T G ) ,
m u = 1 2 ( L + GL T G ) ,
where G = diag ( 1 , 1 , 1 , 1 )  is the Minkowski metric tensor. The polarizing and the depolarizing tensors consist of the following elements [33]:
m m = 0 L D L D C D L D 0 C B L B L D C B 0 L B C D L B L B 0 ,
m u = 0 σ L D σ L D σ C D σ L D L A σ C B σ L B σ L D σ C B L A σ L B σ Δ D c σ L B σ L B C A ,
where the notations express elementary polarization properties, such as: linear dichroism along x-y axis (LD), linear dichroism along  ± 45 °  axis (LD ), circular dichroism (CD), linear birefringence along x-y axis (LB), linear birefringence along  ± 45 °  axis (LB ) and circular birefringence (CB). For the depolarizing counterpart (mu), the off-diagonal elements are the uncertainties of the six elementary properties  σ i , while the main diagonal contains the anisotropic absorption coefficients LA, LA , CA and the isotropic component mu(1,1) = 0. Usually, the former triplet is interchangeable with the depolarization coefficients  α 1  (along the x-y axis),  α 2  (along the  ± 45 °  axis) and  α 3  (the circular component), while  α 0  is the isotropic component, as discussed above. One can obtain the net scalar retardance  φ t , the total depolarization  α t  and the orientation of the optic axis  θ  as:
φ t = L B 2 + L B 2 + C B 2 ,
α t = 1 3 | α 1 + α 2 + α 3 | ,
θ = 1 2 tan 1 L B L B .

3. Results and Discussion

3.1. Preparation and Characterization of Fibroblasts-Containing Models

MNPs were prepared using oxidative precipitation and modified with a silica shell [24,25]. To achieve better colloidal stability in cryopreservation solutions and to avoid direct contact with endogenous cells, MNPs were encapsulated in alginate hydrogel capsules [25]. In addition, the silica-modified MNPs were integrated into biodegradable electrospun fiber fleeces, which not only prevent the aggregation of NPs, but are also used as scaffolds for 3D tissue models [34]. Due to their structural similarity to the extracellular matrix, cells can easily attach to the fibers, whereby the cell growth and differentiation can be better controlled [34]. In this context, the fiber network was loosened by the addition of NaCl particles, which enables an open 3D structure of the fiber fleece and facilitates cell migration and growth [26].
In order to achieve a collagen-fiber-rich 3D structure, the MNP-doped fleeces were seeded with fibroblasts and cultured for 4 weeks including ascorbic acid-2-phosphate stimulation. The number of the seeded fibroblast cells was high enough to produce the relatively dense extracellular matrix of collagen at the standard experimental conditions of 3D tissue models growth. The fibroblast-containing models were then frozen in centrifuge tubes, whereby the samples for nanowarming were additionally combined with MNP-doped alginate hydrogel capsules and fiber fleeces to ensure an uniform distribution of the NPs across the entire solution and a uniform warming efficiency in the whole volume. Since the DMSO concentration increases depending on the temperature, the samples were not completely thawed [11]. The final temperature after thawing of the samples was approx. −7 °C. A voltage of 90% and a current of 24% were set on the induction heater for the thawing experiments. In the cases of inductively thawed samples, only a heating rate of 26 °C/min could be achieved with a thawing time of 8 min. In comparison, the conventional thawing method in a water bath was able to heat the fibroblast-containing models almost twice as fast as in the case of the inductive heating procedure (4 min).
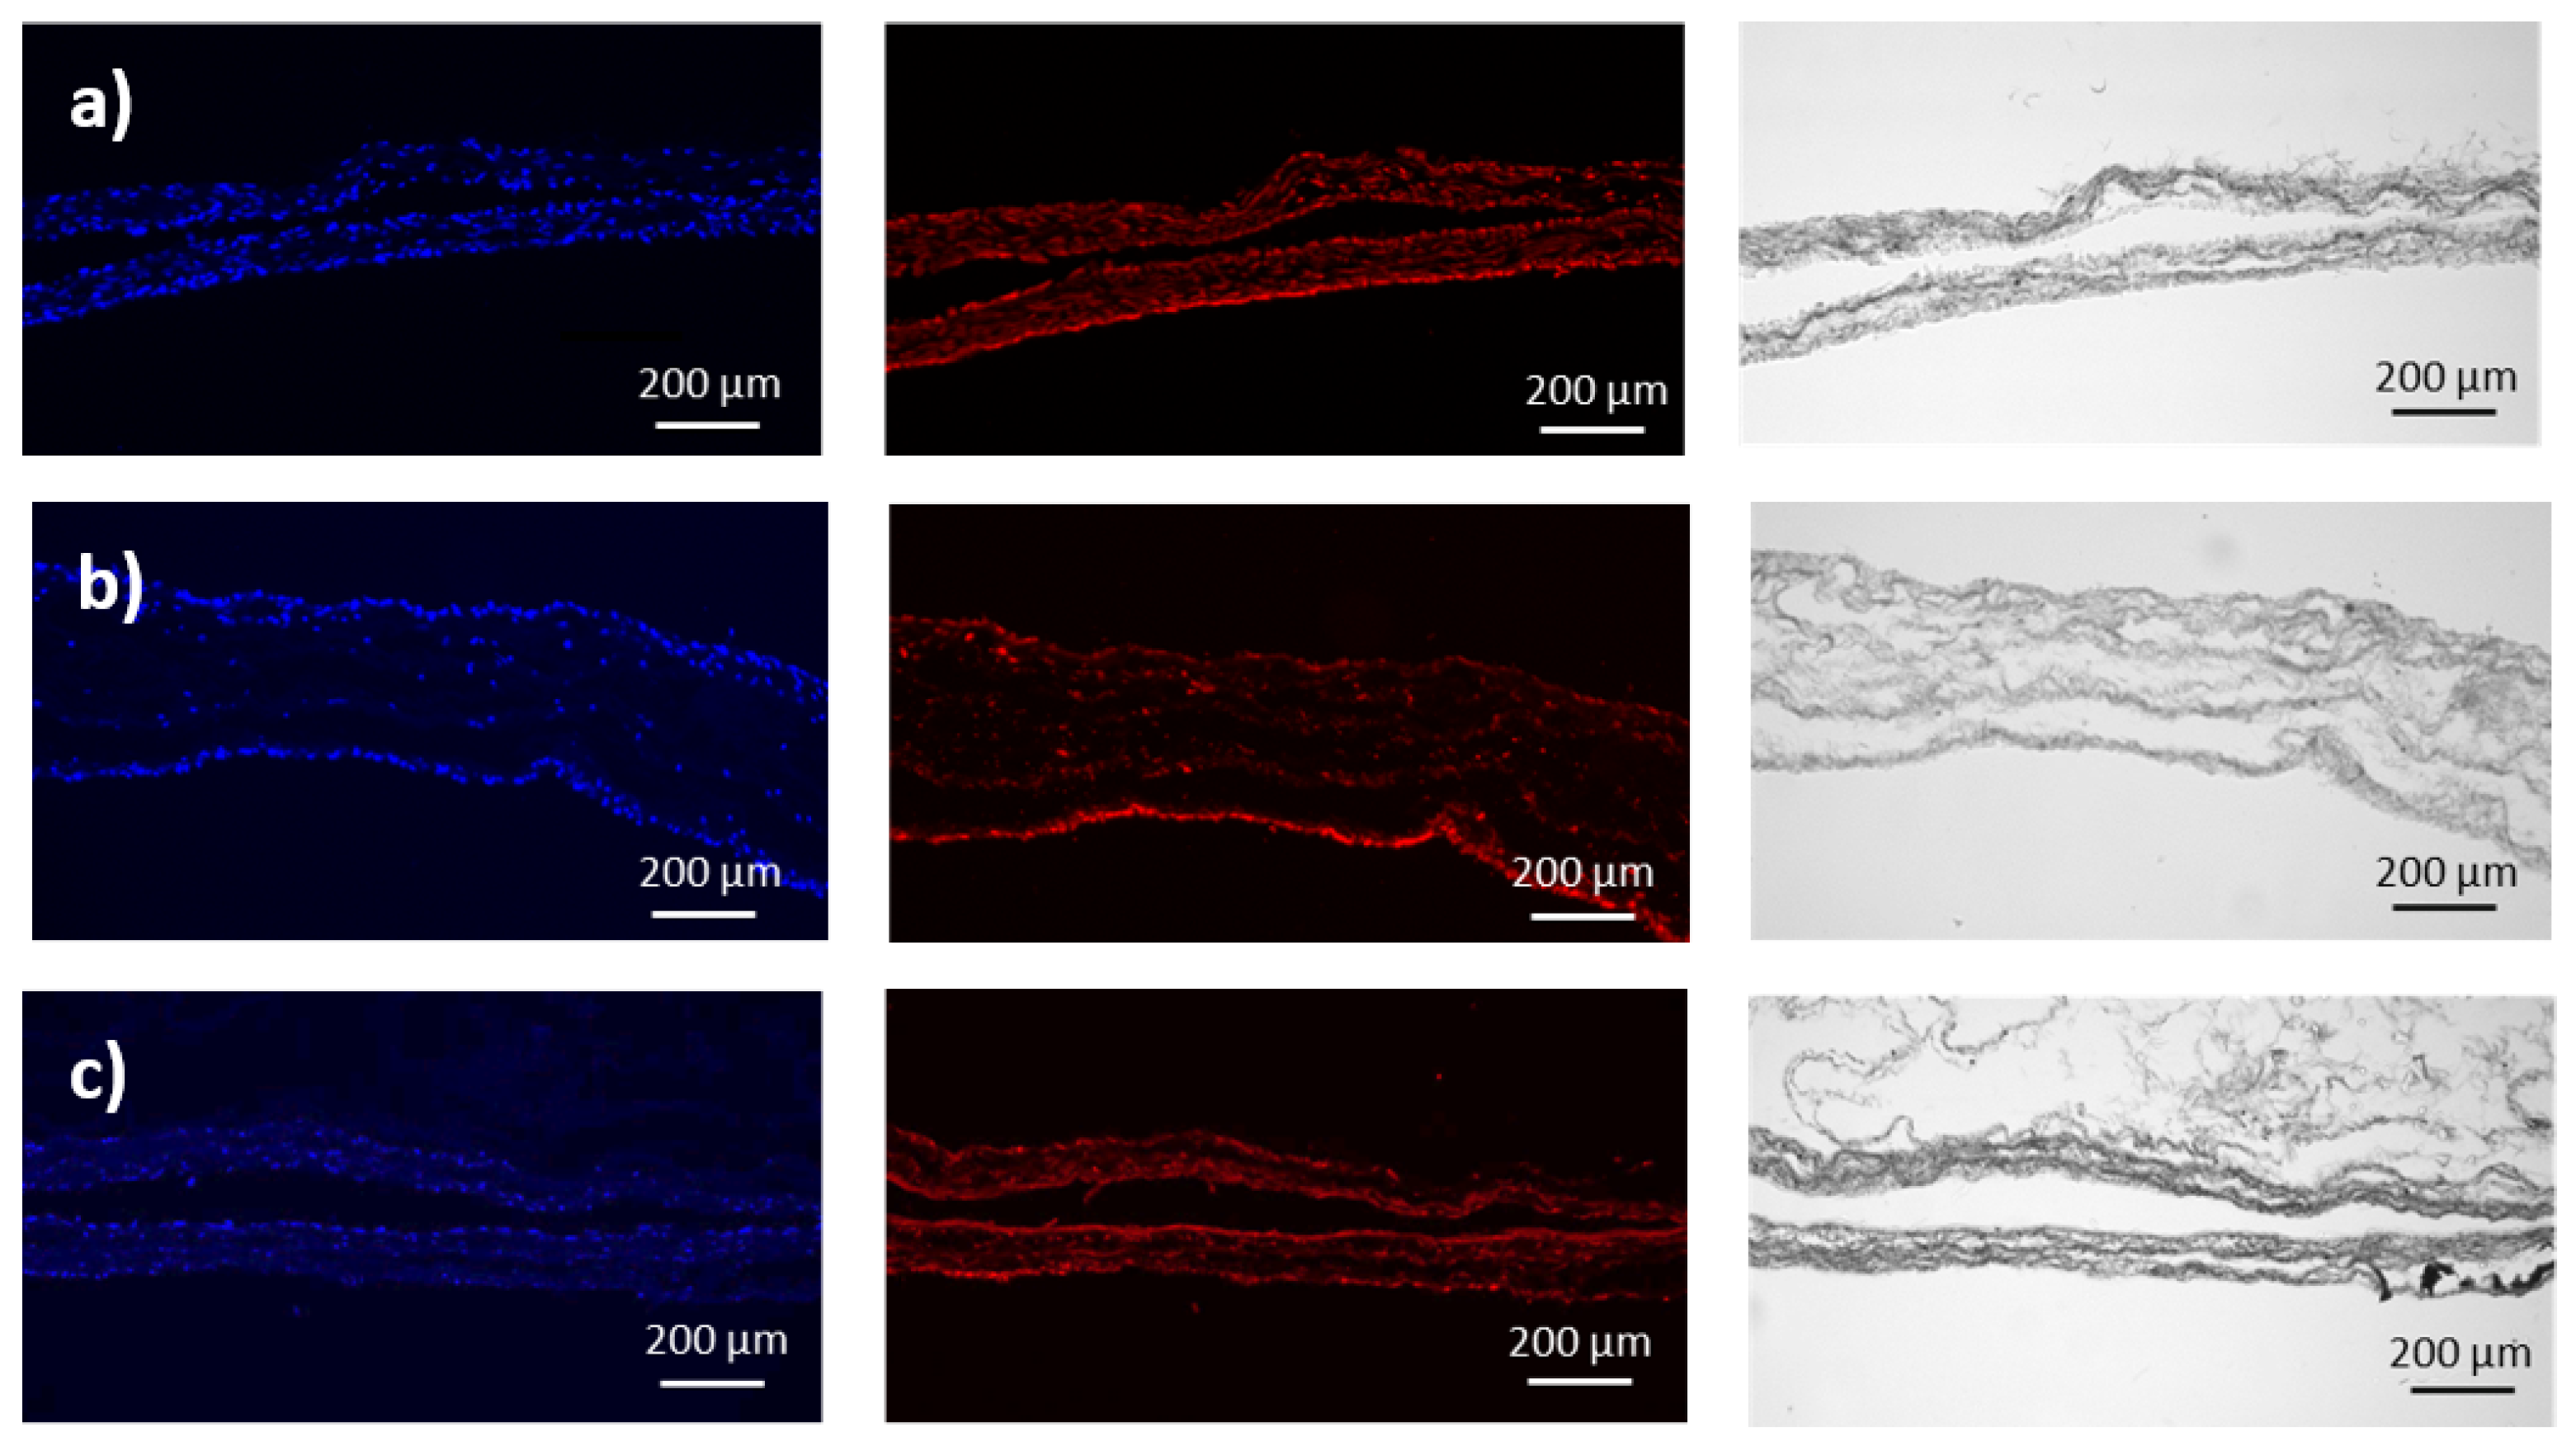
Three days after thawing, immunofluorescence staining was performed. From the obtained results, conclusions can be made about the cell distribution on the individual fiber fleeces. In this case, DAPI staining was performed for labeling cell DNA as well as antibody staining of the intermediate filament protein vimentin, which occurs in cells of mesenchymal origin and can be used for labeling fibroblasts [35]. In addition to the unfrozen samples that served as controls, the inductively and conventionally thawed samples were stained (Figure 4). In each case, the images were supplemented by a view of the fiber fleeces (gray) using transmitted light measurement. The seeded cells follow the laminar orientation of the fleece fibers. The more cells are found on the fiber fleece, the higher their alignment. In the case of the unfrozen models, a strong DAPI as well as antibody staining and a dense cell distribution can be recognized. The inductively thawed samples show comparably strong staining, whereas the DAPI staining of the water bath thawed samples is slightly weaker.
In a second step, the number of cell nuclei was determined for all samples based on the DAPI staining. The thawed samples have fewer cells (>300/10,000  μ m 2 ) compared to the control ((401 ± 21)/10,000  μ m 2 ). The cell number of the inductively thawed models is slightly higher ((381 ± 49)/10,000  μ m 2 ) than that of the water bath thawed ((340 ± 46)/10,000  μ m 2 ). The longer thawing time (8 min instead of 4 min) with only a low heating rate (26 °C/min) in case of the magnetically MNP-assisted thawed models compared to the samples thawed with the water bath actually indicates that the NPs were insufficiently homogeneously distributed in the whole volume as well as not enough NPs being used for thawing. Nevertheless, this had no influence on the cell distribution on the fiber fleeces. Both thawing methods show strong anti-vimentin as well as DAPI staining with high cell numbers compared to the non-thawed samples, indicating that the freezing and thawing process does not cause significant damage to the cells.

3.2. Transmission Mueller Microscopy

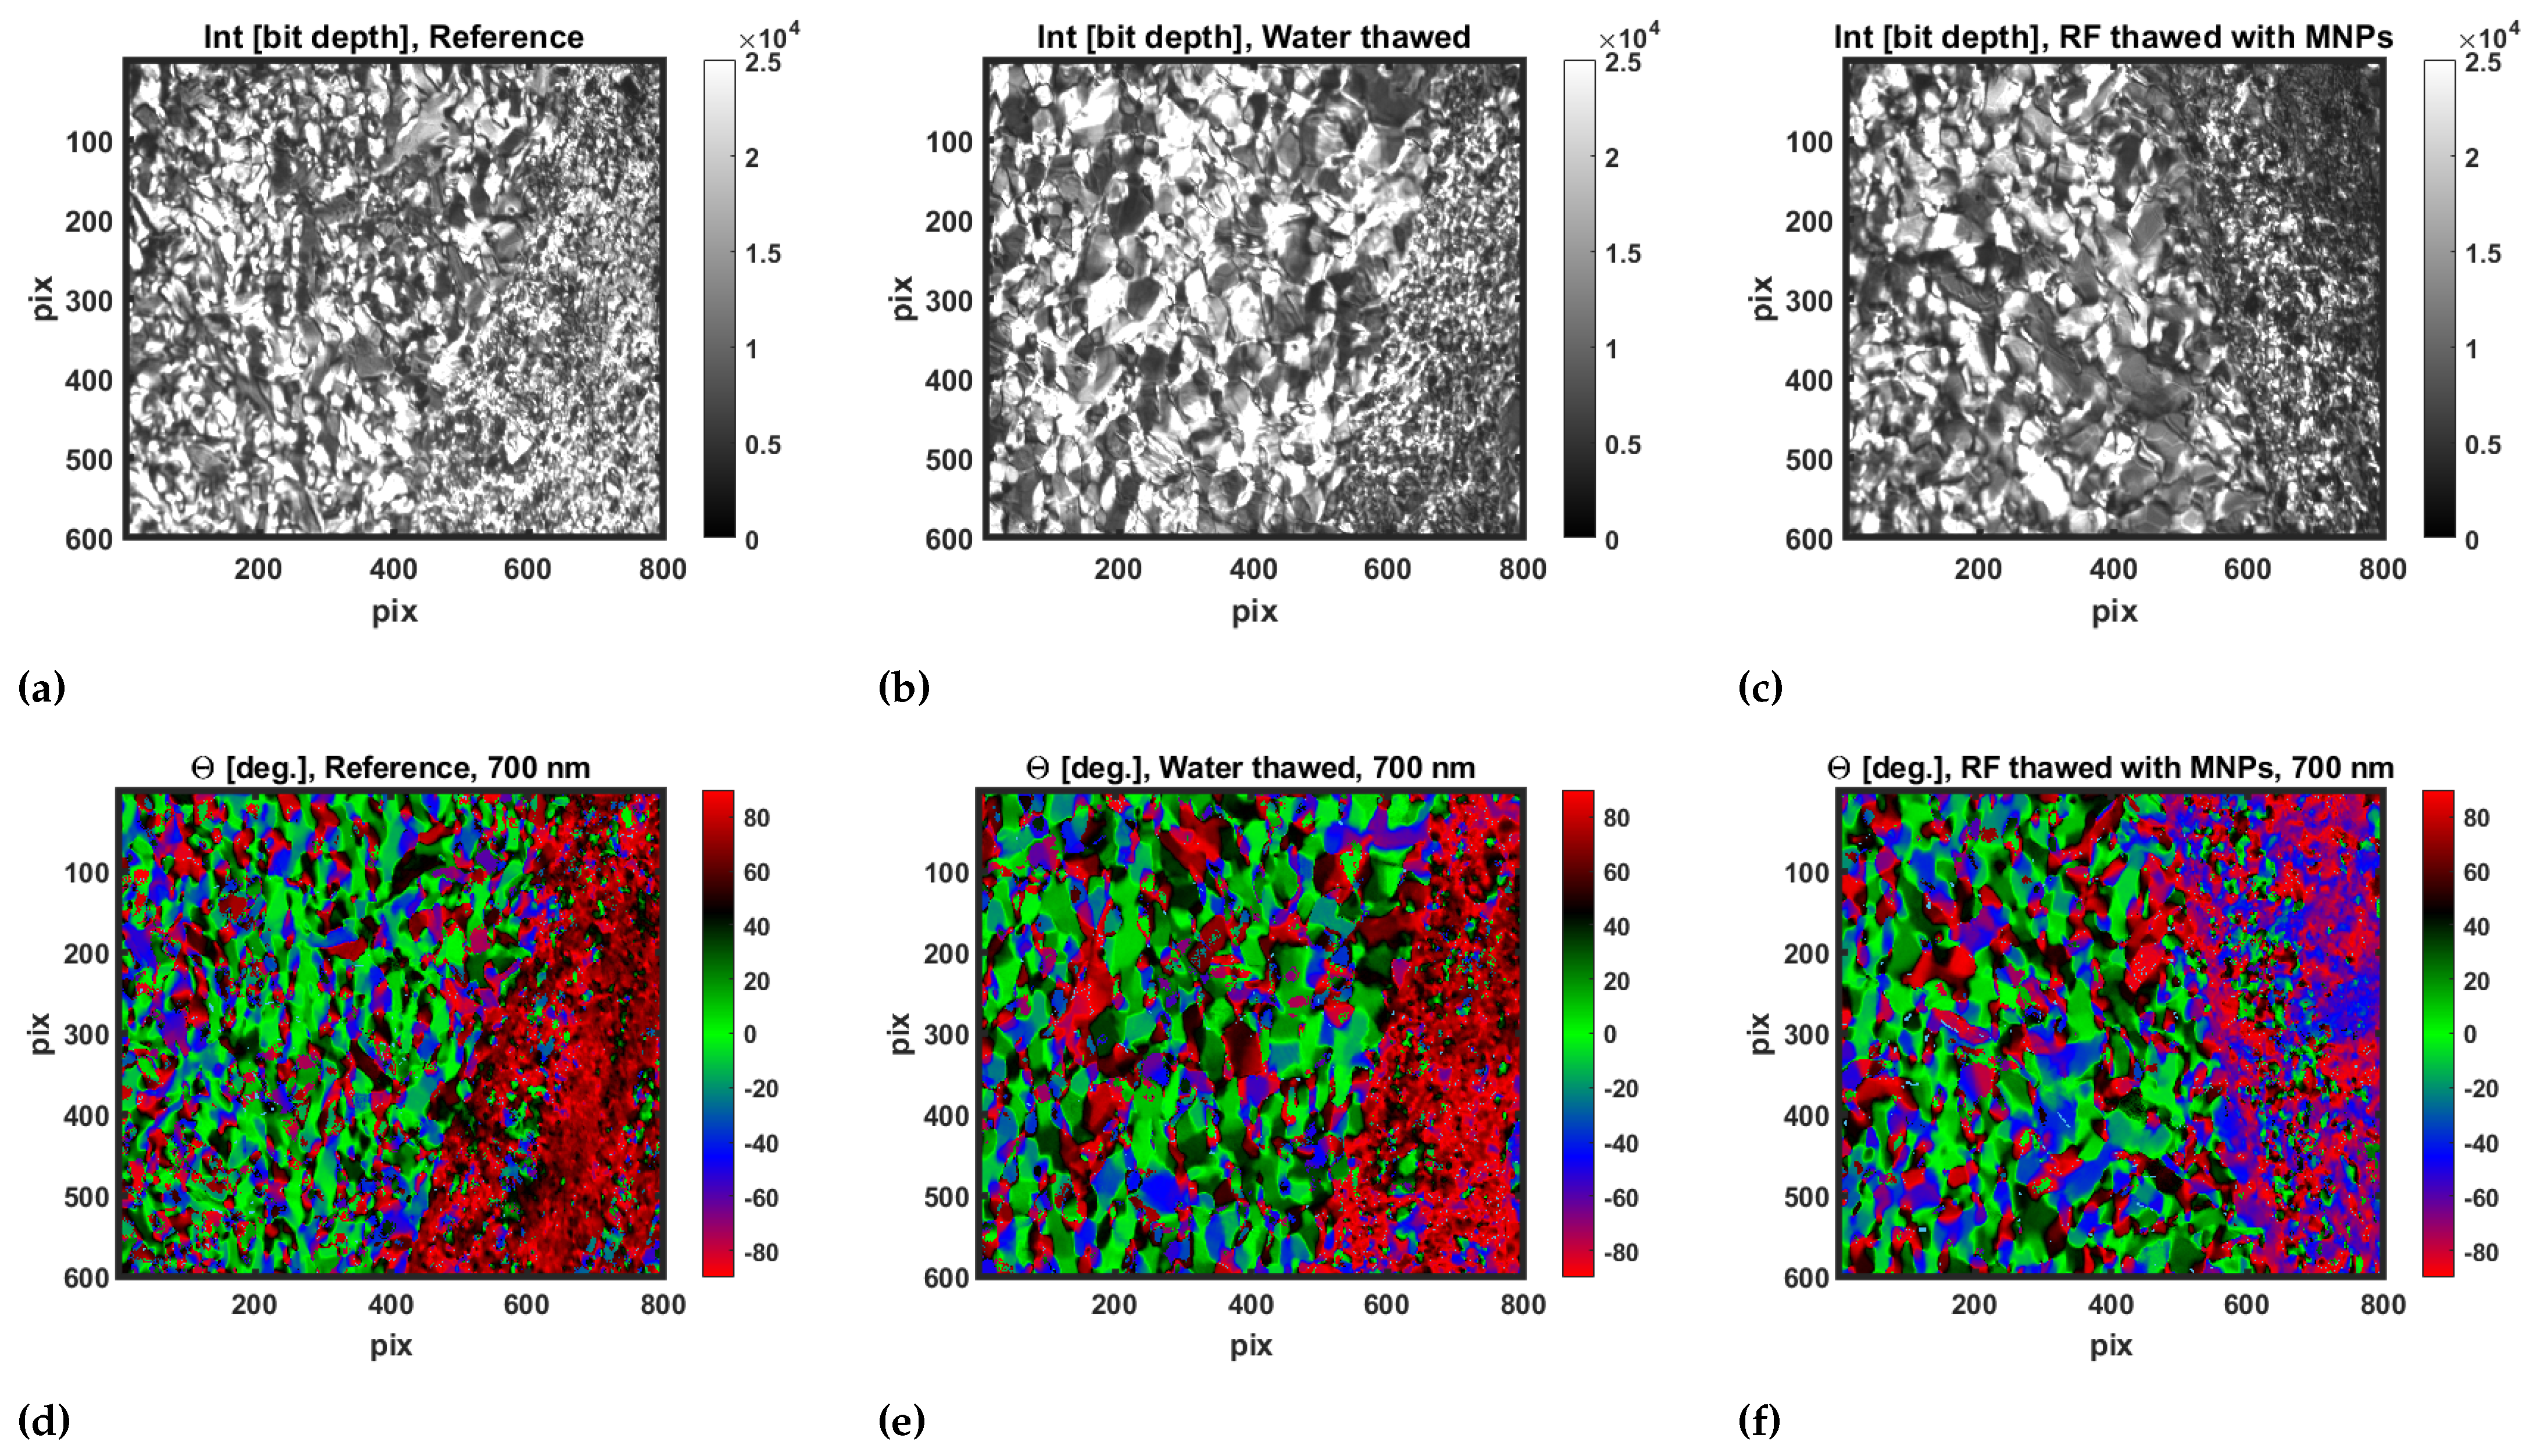
For each group of samples (reference, MNP-assisted thawing, and water-bath-assisted thawing) two histological sections of 3D tissue models were analyzed using a Mueller microscope. In total, 20 microscopy images were taken at different locations along each tissue stripe (≈2 cm long) from each group. All conducted polarimetric experiments produced the images of the thin histological sections of 3D tissue models with different regions of interest (ROIs). For instance, in all images from the three sample groups, both the paraffin ROI and the ROI with the tissue model stripes can be observed (see Figure 5). After the initial Mueller matrix data post-processing, it was found that the orientation angle of the optic axis  θ  provides the best contrast and separation between the two adjacent ROIs (see Figure 5d–f). It is worth mentioning that, contrary to the values of polarization and depolarization parameters, the value of the orientation angle does not depend on the thickness fluctuations of the uniaxial linear birefringent sample [18]. The latter is a reasonable assumption for the thin (10  μ m of nominal thickness) histological slides of 3D tissue models. For a better visualization of the orientation angle  θ , the corresponding circular color bar is shown in Figure 6.
Next, the image segmentation techniques were applied to select the zones of tissue models for the analysis. As can be seen in Figure 5, the left and central zones are occupied by paraffin, while, in the right part of the images, the ROIs with the tissue model stripes are visible. As the images of the orientation angle demonstrated the highest contrast between the zones of paraffin and tissue model stripes, we focused on the analysis of the above-mentioned images. For further analysis, each image was split into 48 patches with a single patch size of 100 × 100 pixels.
In total, for all three groups of tissue models, 60 measurements were conducted (20 measurements per group). Then, each image of the orientation angle obtained from the differential decomposition was segmented as discussed above to create a data set of the patches corresponding to the ROIs of tissue model stripes.
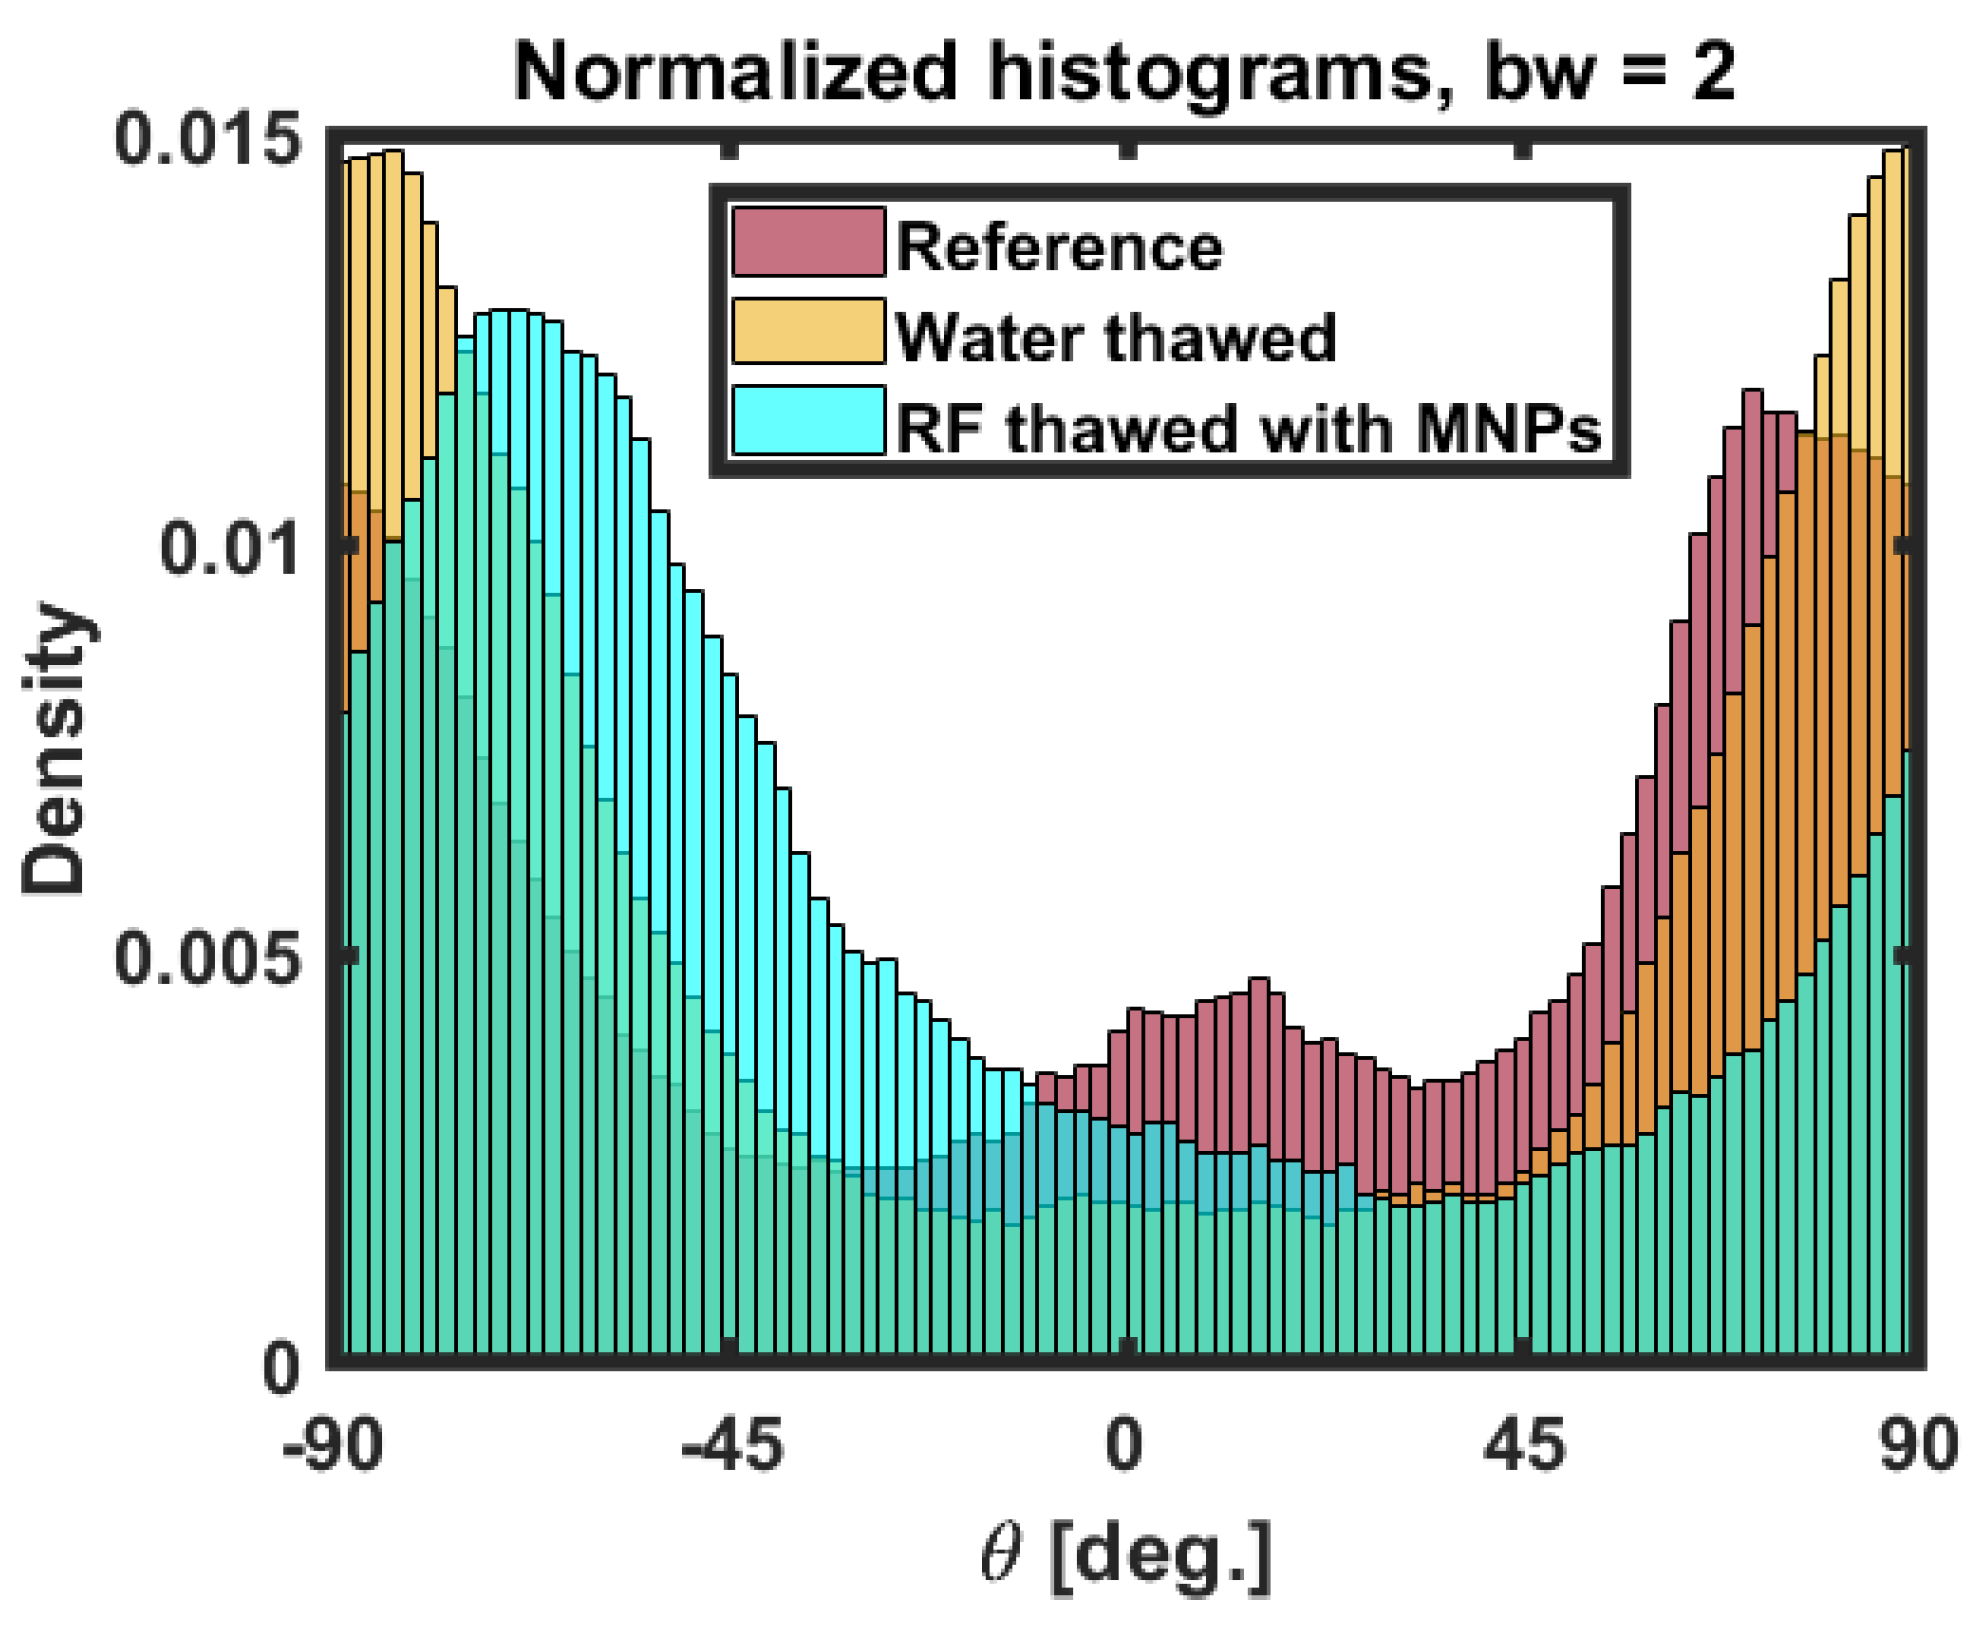
Then, we performed the comparative studies of the normalized distributions of the orientation angles for three groups of tissue models. In Figure 7, the normalized histograms of the orientation angle  θ  for three tissue model groups are shown. The normalization was applied with respect to the probability density function. Hence, the x axis represents the value range of the orientation angle, whereas the y axis shows its density  D y  values (normalized histogram counts):
D y i = C i N p i x · w ,
where  C i  is the number of counts for the i-th bin,  N p i x  is the total number of pixel values, while w is the bin width, which is a priori chosen. Next, the i-th bin and the sum of all probabilities for the distribution are given by:
p i = D y i · w , p t = i = 1 N p i x p i = 1 .
After plotting the normalized histograms, it becomes evident that there is a difference in the orientation angle between the tissue models thawed with different methods as well as between each thawed tissue model and the reference samples. The histogram of the orientation angle for the reference samples has two maxima: a global one at ∼70° and local one at ∼15°. The histogram for the water-thawed tissue models demonstrates the predominant values of the orientation angle about  ± 90 ° . Finally, the predominant orientation angle values for the MNPs-assisted RF inductively thawed tissue models vary about  70 ° . Nevertheless, the three distributions are overlapping for most of the orientation angle values.
To exclude the impact of manual positioning of the microscopy slides with tissue model stripes during the measurements that could affect the absolute values of the azimuth of the optic axis, various metrics for the quantitative evaluation of the different patches were adopted for the azimuth images of the three tissue model groups. Firstly, the standard deviation  σ  per each patch j was calculated and, then, the entropy H per each patch was computed as well:
σ j ( θ ) = x , y ( θ j x , y θ ¯ j x , y ) 2 N p i x 1 ,
H j ( θ ) = x , y D j x , y l o g 2 ( D j x , y ) ,
where D contains the normalized histogram counts. Special attention should be paid to the entropy, as a built-in MATLAB function was used to calculate this parameter. This function takes as an input a gray scale image. Hence, the images of the azimuth  θ  need to be converted to gray scale with a bit depth of 16. In this way, the entropy can be considered a statistical measure of randomness that can be used to characterize the texture of the input image. The minimum value of the entropy would be expected when all pixel values for each patch are equal, thus indicating the homogeneity of the measured medium. On the other hand, the maximum value of the entropy for a given image patch would be achieved when the image pixel values are uniformly distributed within the closed interval [0, 216], indicating the random fluctuations of the medium’s properties.
After the calculation of these metrics for each patch, we assign a corresponding scalar value to each pixel of the patch. We create a superpixel, which value quantifies the spatial heterogeneity of the corresponding tissue zones and, thus, can be used as a metric for the comparison of the impact of different tissue model thawing mechanisms on its micro-structure. As can be seen from Figure 8, the values of both metrics are significantly reduced for the patches comprising the tissue model stripes, demonstrating higher values for the patches corresponding to the paraffin host medium. This observation is valid for the images of all three groups of tissue models. This means that the spatial heterogeneity of the paraffin zones is higher than the spatial heterogeneity of the zones with tissue model stripes. The drop of both standard deviation and entropy values within the 3D tissue model zones indicates the preferential alignment of the optic axis within these zones.
Moreover, the lowest values of both metrics correspond to the zones of tissue model stripes from the reference sample. After the water thawing, the zones of tissue model stripes have increased values of the entropy and the standard deviation, suggesting the destruction or alteration of the initially preferential orientation of collagen fibers within the tissue models by water thawing. With the MNPs-assisted RF inductive thawing, the lower values of the entropy and the standard deviation correspond to the zones of tissue model stripes, thus indicating the better preservation of the orientation angle  θ  with this thawing mechanism.
Contrary to the fluorescence microscopy, we did not use the polarimetric measurements with the Mueller microscope for the detection and counting of the individual fibroblast cells, but rather for the detection of the linear retardance of the 3D tissue models. We attribute the observed optical anisotropy of 3D tissue models to the presence of a well-ordered extracellular matrix of collagen (the so-called form birefringence) that was generated by the fibroblasts cultivated over 4 weeks on the fiber fleeces. With the fibroblast cells aligned along the fibers of the scaffold, we expect to observe the preferential orientation of the collagen fibers defined by the direction of scaffold fibers throughout the whole section of the tissue models.
The improved cell number for the inductively thawed samples was confirmed using IF-staining microscopy. The lower values of entropy and standard deviation of the orientation angle detected using Mueller microscopy for the same samples might be used as the alternative polarimetric observables that do not require IF staining. Therefore, the applicability of this approach on living samples needs to be further evaluated in future investigations.

3.3. Statistical Analysis

It is worth mentioning that the same fiber scaffolds were used for each group of samples (reference, MNP-assisted thawed and water-bath-thawed). All three groups were also treated in the same way during the preparation of the tissue models. Thus, we expect that the cell and collagen distributions should not differ before the cryopreservation. In order to test and validate the statistical significance of the difference between the three tissue model groups after thawing, the data must be further processed by means of a statistical analysis. For the purpose of the current study, two different hypotheses can be formulated:  H 0 —the data from the three groups of samples are drawn from the same distribution or, equivalently, there is no difference between the tissue models thawed with different mechanisms and reference samples;  H 0 * —the data from the three types of samples are drawn from different distributions or there is a difference between the tissue models thawed with different mechanisms and reference samples. A priori, one chooses the significance level  α , in our case  α  = 0.05, which is being compared with the computed p value from the test’s results. In that case,  H 0  will be valid if  p > α  and, analogously,  H 0 *  will be valid if  p < α . Following this concept of the results’ evaluation, we firstly used an ANOVA test for unequal variances for mean comparison and, secondly, the Tukey HSD post hoc test for multi-group, mean comparison [36]. The latter test is essential, as the total error rate ( E r ) scales up with the increase of the number of groups and number of comparisons, respectively. In our case, to calculate the total error rate for multi-group comparisons, one can use the following equation:
E r = 1 ( 1 α ) C ,
where C (currently = 3) is the number of groups in the study, hence scaling ( E r ) up to 0.14 for the current case. As this is unsatisfactory and undesired, with post hoc, a constant error rate of 0.05 was sought and set initially as an input, before conducting the test. First, the ANOVA test resulted in  p < < α  for all polarimetric parameters. Analogously and most importantly, the same results were reached when using the Tukey HSD post hoc test for multi-group, mean comparison, again for all polarimetric quantities. Thus, on a significance level of 0.05, we can reject  H 0  in favour of  H 0 * , hence assuming that the data for all three tissue models are drawn from different distribution and there is a difference between the thawing methods used in comparison to the reference group.
The polarimetric measurements were performed at different locations along 3D tissue model stripes compared to the measurements with the fluorescence microscopy. However, the statistical analysis of the polarimetric data showed the same trend as for the fluorescence microscopy images, namely the better preservation of a 3D tissue model microstructure (in terms of either homogeneity of ECM of collagen or higher fibroblast cell number count, respectively) for the MNP-assisted nanowarming compared to the water-bath-assisted warming method.

4. Conclusions

In this paper, a pilot study for the assessment of the impact of different thawing mechanisms on the micro-structure of defrosted tissue models by means of Mueller polarimetry and statistical analysis was performed. A meticulous protocol for the samples’ preparation and characterization was followed, thus producing the group of reference samples without freezing and defreezing, and two more groups of tissue models that where first frozen in liquid nitrogen, and then each group was thawed either in a water bath or using MNPs-assisted RF inductive heating, respectively.
Immunofluorescence staining resulted in strong anti-vimentin and DAPI staining with high cell numbers for all three groups of tissue models, thus leading us to the conclusion that 3D tissue models with fibroblasts could be successfully constructed, cryopreserved and thawed in a water bath, as well as using MNPs-assisted RF inductive heating, with no significant damage to cells.
The polarimetric images of the thin histological sections of paraffin-embedded 3D tissue models from all three groups were obtained using an in-house transmission Mueller matrix microscope and differential decomposition of the experimental Mueller matrices. The images of the orientation angle of the optic axis showed the highest contrast between the zones of pure paraffin and tissue model stripes and were selected for consequent analysis. The normalized histograms of the orientation angle were different for all three groups of tissue models. Moreover, the standard deviation and enthropy values were the lowest for the reference tissue model group followed by the higher values of the above-mentioned metrics for MNPs-assisted RF inductively heated tissue model group and the highest values for the water-thawed tissue model group.
In a perspective, with more samples and measurement counts, the creation of a polarimetric model for the pixel-wise quantification of the impact of the thawing mechanism is envisaged. In this way, smaller changes in the samples’ structure and morphology could be better outlined, thus helping the optimization of the parameters of the MNP-assisted thawing method for more complex and thick cryopreserved tissue models (e.g., MNP size and concentration, RF frequency, heating time, etc.).
The presented results indicate the sensitivity of polarimetry to the changes in tissue micro-structures after thawing with different mechanisms, which was confirmed using the implemented metrics and also using both statistical tests: ANOVA and Tukey HSD post hoc.
Our studies on the polarimetric characterization of thawed tissue open an avenue for the quantitative assessment of changes in tissue micro-structures after thawing and hold promise for Mueller polarimetry to become a complementary technique to the existing gold standard characterization approaches. We believe that using the polarimetric characterization of the inner structure of anisotropic 3D tissue models will also be beneficial in the field of tissue-engineered and regenerative medicine.

Author Contributions

Polarimetric measurements, data processing, statistical analyses, writing—manuscript preparation, D.I.; Samples preparation and characterization, methodology, validation, writing—manuscript editing, A.H.; Planning and analyzing of in vitro experiments, T.W.; Supervision, theory of polarimetry, software validation, conceptualization and methodology, manuscript editing, R.O.; Supervision, conceptualization and methodology, validation, resources, project administration, funding acquisition, writing—manuscript editing, S.D.; Supervision, conceptualization and methodology, validation, resources, project administration, funding acquisition, writing and editing manuscript, T.N. All authors have read and approved the manuscript.

Funding

Fraunhofer internal program MAVO (grant number 840149).

Data Availability Statement

Data underlying the results presented in this paper are not publicly available at this time but may be obtained from the authors upon reasonable request.

Acknowledgments

All authors would like to acknowledge: the contribution of Enrique Garcia-Caurel during the calibration process of the polarimetric set-up and also for his precious advice; the help of Pavel Bulkin in samples’ storage and handling; Deyan Ivanov acknowledges the PhD funding from the Institut Polytechnique de Paris.

Conflicts of Interest

All Authors declare no potential conflict of interest of any kind. The Funders had no role in the design of the study; in the collection, analyses, or interpretation of data; in the writing of the manuscript; or in the decision to publish the results.

Abbreviations

The following abbreviations are used in this manuscript:
CPACryoprotectants
MNPMagnetic nanoparticle
RFRadio frequency
3DThree dimensional
LEDLight-emitting diode
FWHMFull width at half maximum
PSGPolarization state generator
PSAPolarization state analyzer
LPLinear polarizer
WPWave plate
FLCFeroelectric liquid crystal
NANumerical apperture
CCDCharge-coupled devices
ROIRegion of interest
ECMExtracellular matrix

References

  1. Mazur, P. Freezing of living cells: Mechanisms and implications. Am. J. Physiol. 1984, 247, C125. [Google Scholar] [CrossRef] [PubMed]
  2. Karlsson, J.O.; Toner, M. Long-term storage of tissues by cryopreservation: Critical issues. Biomaterials 1996, 17, 243. [Google Scholar] [CrossRef] [PubMed]
  3. Ladanyi, C.; Mor, A.; Christianson, M.S.; Dhillon, N.; Segars, J.H. Recent advances in the field of ovarian tissue cryopreservation and opportunities for research. J. Assist. Reprod. Genet. 2017, 34, 709–722. [Google Scholar] [CrossRef] [PubMed]
  4. Shi, Q.; Xie, Y.; Wang, Y.; Li, S. Vitrification versus slow freezing for human ovarian tissue cryopreservation: A systematic review and meta-analysis. Sci. Rep. 2018, 7, 8538. [Google Scholar] [CrossRef] [PubMed]
  5. Stanzel, B.V.; Espanac, E.M.; Grueterich, M.; Kawakita, T.; Parel, J.M.; Tseng, S.C.; Binder, S. Amniotic membrane maintains the phenotype of rabbit retinal epithelial cells in culture. Exp. Eye Res. 2005, 80, 103. [Google Scholar] [CrossRef] [PubMed]
  6. Scudellari, M. Core Concept: Cryopreservation aims to engineer novel ways to freeze, store, and thaw organs. Proc. Natl. Acad. Sci. USA 2017, 114, 13060. [Google Scholar] [CrossRef]
  7. Chang, T.; Zhao, G. Ice Inhibition for Cryopreservation: Materials, Strategies and Challenges. Adv. Sci. 2021, 8, 2002425. [Google Scholar] [CrossRef]
  8. Ito, A.; Yoshioka, K.; Masumoto, S.; Sato, K.; Hatae, Y.; Nakai, T.; Yamazaki, T.; Takahashi, M.; Tanoue, S.; Horie, M. Magnetic heating of nanoparticles as a scalable cryopreservation technology for human induced pluripotent stem cells. Sci. Rep. 2020, 10, 13605. [Google Scholar] [CrossRef]
  9. Zhao, G.; Ring, H.L.; Sharma, A.; Namsrai, B.; Tran, N.; Finger, E.; Garwood, M.; Haynes, C.; Bischof, J. Preparation of Scalable Silica-Coated Iron Oxide Nanoparticles for Nanowarming. Adv. Sci. 2020, 7, 1901624. [Google Scholar]
  10. Manuchehrabadi, N.; Gao, Z.; Zhang, J.; Ring, H.; Shao, Q.; Liu, F.; McDermott, M.; Fok, A.; Rabin, Y.; Brockbank, K.; et al. Improved tissue cryopreservation using inductive heating of magnetic nanoparticles. Sci. Transl. Med. 2017, 9, eaah4586. [Google Scholar] [CrossRef]
  11. Chiu-Lam, A.; Staples, E.; Pepine, C.; Rinaldi, C. Perfusion, cryopreservation, and nanowarming of whole hearts using colloidally stable magnetic cryopreservation agent solutions. Sci. Adv. 2021, 7, 1901624. [Google Scholar] [CrossRef] [PubMed]
  12. Donaldson, J. Immunofluorescence Staining. Curr. Protoc. Cell Biol. 2001. [Google Scholar] [CrossRef]
  13. Yousaf, M.; Khurshid, A.; Mahmood, R.; Ikram, M. Polarimetric comparison of fresh and frozen skeletal muscle tissues of goat. Photodiagn. Photodyn. 2020, 32, 102071. [Google Scholar] [CrossRef]
  14. Wu, P.; Walsh, J. Stokes polarimetry imaging of rat tail tissue in a turbid medium: Degree of linear polarization image maps using incident linearly polarized light. J. Biomed. Opt. 2006, 11, 014031. [Google Scholar] [CrossRef]
  15. Pierangelo, A.; Manhas, S.; Benali, A.; Antonelli, M.-R.; Novikova, T.; Validire, P.; Gayet, B.; De Martino, A. Use of Mueller polarimetric imaging for the staging of human colon cancer. Proc. SPIE Opt. Biopsy IX 2011, 7895, 78950E. [Google Scholar]
  16. Robinson, D.; Kleijn, W.B.; Hoong, K.; Doronin, A.; Rehbinder, J.; Vizet, J.; Pierangelo, A.; Novikova, T. Polarimetric imaging for cervical pre-cancer screening aided by machine learning: Ex vivo studies. J. Biomed. Opt. 2023, 28, 102904. [Google Scholar] [CrossRef] [PubMed]
  17. Rodriguez-Nunez, O.; Novikova, T. Polarimetric techniques for the structural studies and diagnosis of brain tissue. Adv. Opt. Technol. 2022, 11, 157. [Google Scholar] [CrossRef]
  18. Lee, H.R.; Li, P.; Yoo, T.; Lotz, C.; Groeber-Becker, K.; Dembski, S.; Garcia-Caurel, E.; Ossikovski, R.; Ma, H.; Novikova, T. Digital histology with Mueller microscopy: How to mitigate an impact of tissue cut thickness fluctuations. J Biomed. Opt. 2019, 24, 076004. [Google Scholar] [CrossRef]
  19. Li, P.; Lee, H.R.; Chandel, S.; Lotz, C.; Groeber-Becker, K.; Dembski, S.; Osikovski, R.; Ma, H.; Novikova, T. Analysis of tissue microsctructure with Mueller microscopy: Logarithmic decomposition and Monte Carlo modeling. J. Biomed. Opt. 2020, 25, 015002. [Google Scholar] [CrossRef]
  20. Lee, H.R.; Lotz, C.; Groeber-Becker, K.; Dembski, S.; Novikova, T. Digital histology with Mueller polarimetry and FastDBSCAN. Appl. Opt. 2022, 61, 9616–9624. [Google Scholar] [CrossRef]
  21. Kim, M.; Lee, H.R.; Ossikovski, R.; Malfait-Jobart, A.; Lamarque, D.; Novikova, T. Optical diagnosis of gastric tissue biopsies with Mueller microscopy and statistical analysis. J. Eur. Opt. Soc. Rapid. Publ. 2022, 18, 1–10. [Google Scholar] [CrossRef]
  22. Kobayashi, A.; Golash, N.H.; Kirschvink, J.L. A first test of the hypothesis of biogenic magnetite-based heterogeneous ice-crystal nucleation in cryopreservation. Cryobiology 2016, 72, 216e224. [Google Scholar] [CrossRef] [PubMed]
  23. Kobayashi, A.; Horikawa, M.; Kirschvink, J.L.; Golash, H.N. Magnetic control of heterogeneous ice nucleation with nanophase magnetite: Biophysical and agricultural implications. Proc. Natl. Acad. Sci. USA 2018, 115, 5383–5388. [Google Scholar] [CrossRef] [PubMed]
  24. Granath, T.; Loebmann, P.; Mandel, K. Oxidative Precipitation as a Versatile Method to Obtain Ferromagnetic Fe3O4 Nano- and Mesocrystals Adjustable in Morphology and Magnetic Properties. Part. Part. Syst. Charact. 2021, 38, 2000307. [Google Scholar] [CrossRef]
  25. Stauch, C.; Spaeth, S.; Ballweg, T.; Luxenhofer, R.; Mandel, K. Nanostructured micro-raspberries from superparamagnetic iron oxide nanoparticles: Studying agglomeration degree and redispersibility of nanoparticulate powders via magnetisation measurements. J. Colloid Interf. Sci. 2017, 505, 605–614. [Google Scholar] [CrossRef]
  26. Weigel, T.; Malkmus, C.; Weigel, V.; Wussmann, M.; Berger, C.; Brennecke, J.; Groeber-Becker, F.; Hansmann, J. Fully Synthetic 3D Fibrous Scaffolds for Stromal Tissues—Replacement of Animal-Derived Scaffold Materials Demonstrated by Multilayered Skin. Adv. Mater. 2022, 34, 2106780. [Google Scholar] [CrossRef]
  27. Zimmermann, H.; Shirley, S.; Zimmermann, U. Alginate-based encapsulation of cells: Past, present, and future. Curr. Diabetes Rep. 2007, 7, 314–320. [Google Scholar] [CrossRef]
  28. Agarwal, N.; Yoon, J.; Garcia-Caurel, E.; Novikova, T.; Vanel, J.-C.; Pierangelo, A.; Bykov, A.; Popov, A.; Meglinski, I.; Ossikovski, R. Spatial evolution of depolarization in homogeneous turbid media within the differential Mueller matrix formalism. Opt. Lett. 2015, 40, 5634. [Google Scholar] [CrossRef]
  29. Lee, H.R.; Saytashev, I.; Du Le, V.N.; Mahendroo, M.; Ramella-Roman, J.C.; Novikova, T. Mueller matrix imaging for collagen scoring in mice model of pregnancy. Sci. Rep. 2021, 11, 15621. [Google Scholar] [CrossRef]
  30. Tyo, J.S. Signal-To-Noise Ratio and Minimization of Systematic Error. Appl. Opt. 2002, 41, 619–630. [Google Scholar] [CrossRef]
  31. Compain, E.; Poirier, S.; Drevillon, B. General and self-consistent method for the calibration of polarization modulators, polarimeters and Mueller-matrix ellipsometers. Appl. Opt. 1999, 38, 3490–3502. [Google Scholar] [CrossRef] [PubMed]
  32. Azzam, R.M.A. Propagation of partially polarized light through anisotropic media with or without depolarization: A differential 4 × 4 matrix calculus. J. Opt. Soc. Am. 1978, 68, 1756–1767. [Google Scholar] [CrossRef]
  33. Ossikovski, R. Differential matrix formalism for depolarizing anisotropic media. Opt. Let. 2011, 36, 2330–2332. [Google Scholar] [CrossRef] [PubMed]
  34. Li, M.; Mondrinos, M.; Gandhi, M.; Ko, F.; Weiss, A.; Lelkes, P. Electrospun protein fibers as matrices for tissue engineering. Biomaterials 2005, 26, 5999–6008. [Google Scholar] [CrossRef] [PubMed]
  35. Hayat, M. Handbook of Immunohistochemistry and In Situ Hybridization of Human Carcinomas, 1st ed.; Elsevier: Amsterdam, The Netherlands, 2006. [Google Scholar]
  36. Mould, R. Introductory Medical Statistics, 3rd ed.; CRC Press: Boca Raton, FL, USA, 1998. [Google Scholar]
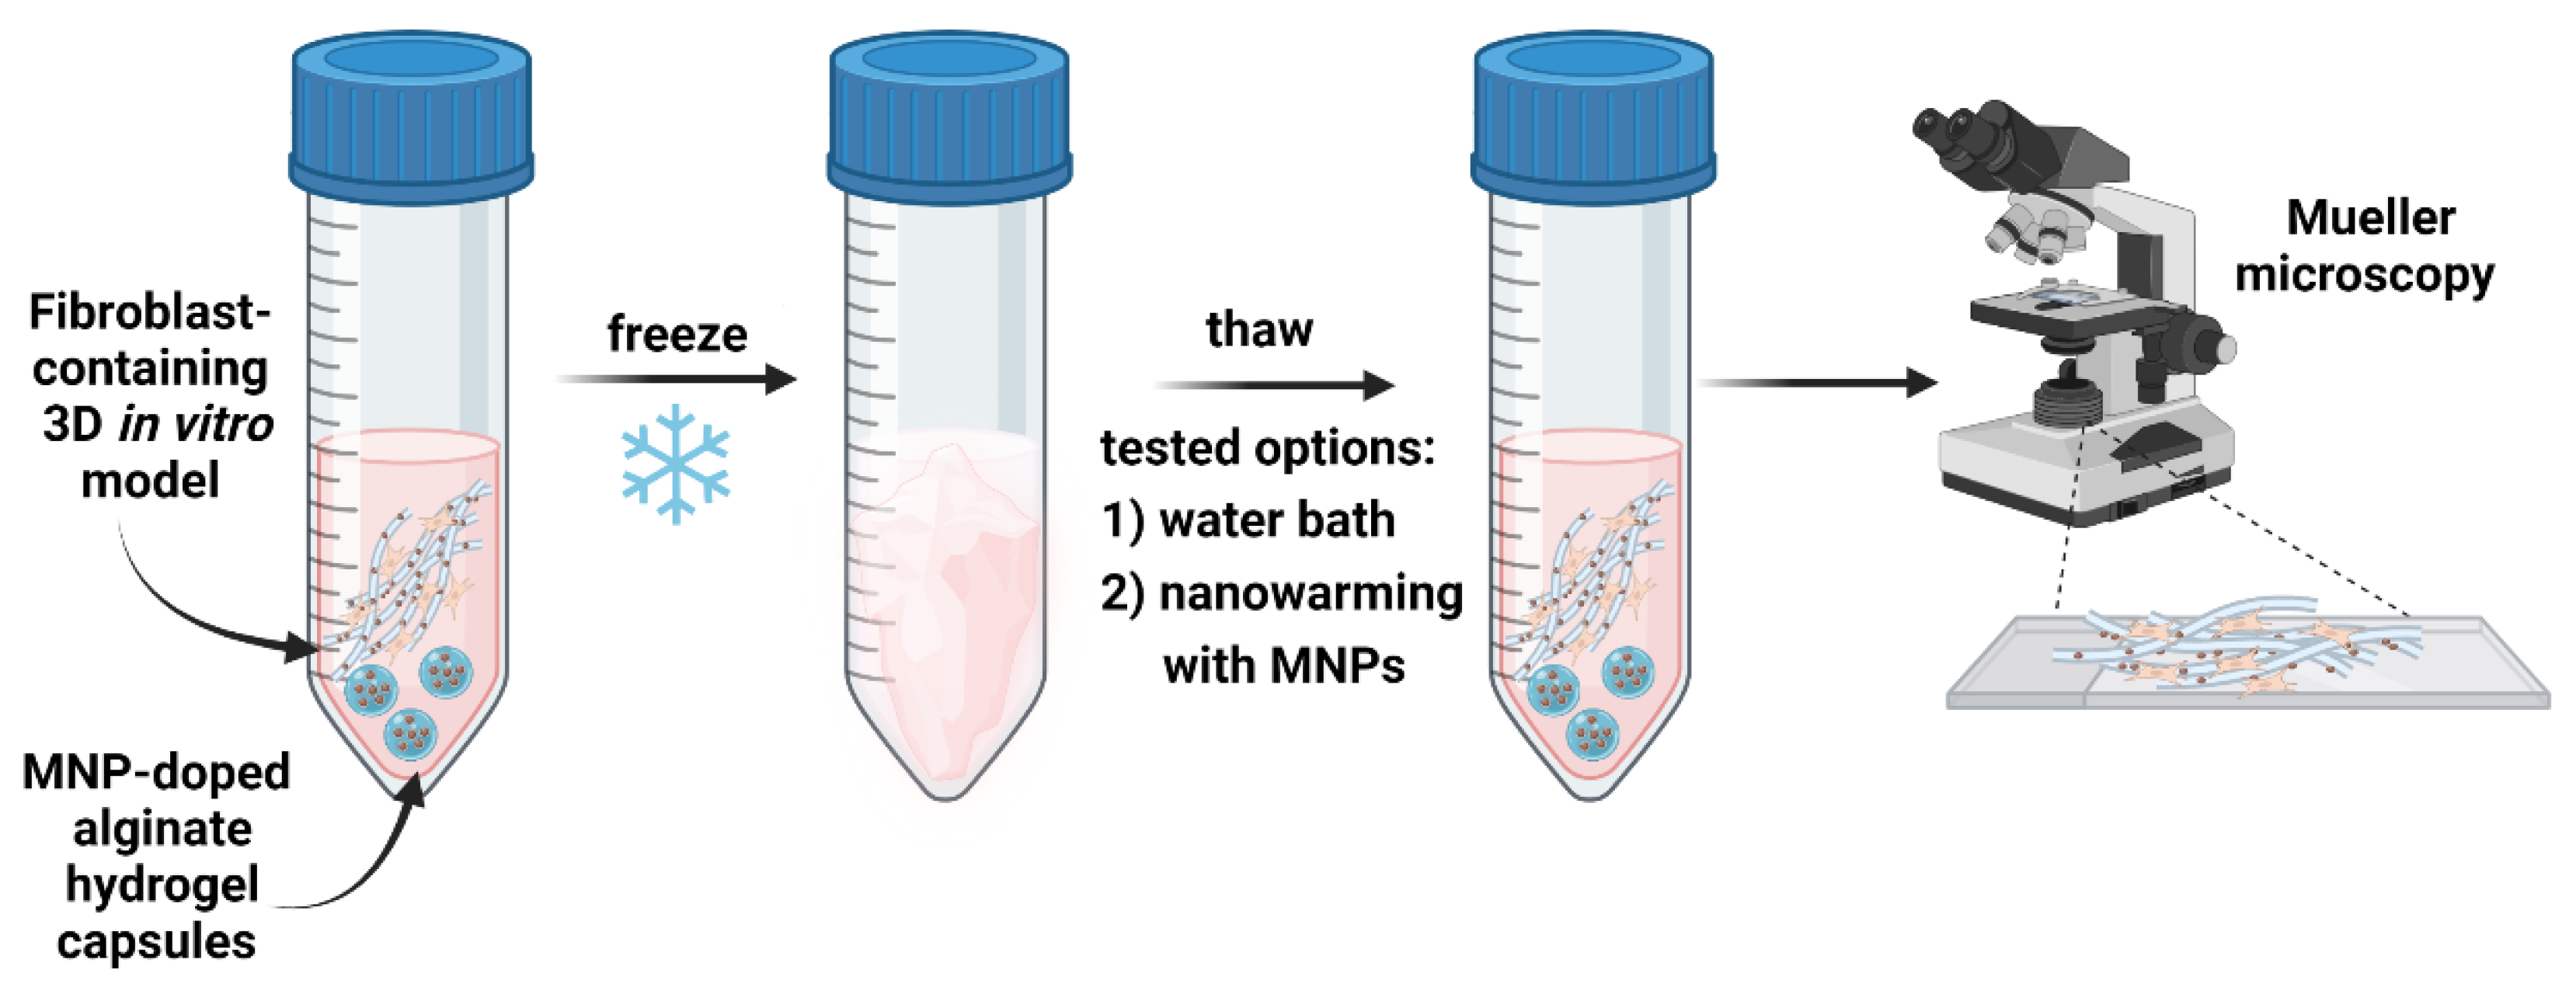
Figure 1. The flowchart of the design of our studies (see text).
Photonics 10 01129 g001
Figure 2. Setup of the inductive thawing experiments of the fibroblast-containing models. 15 mL centrifuge tubes filled with cell medium, fibroblast-containing model inside the cell crown, MNP-doped fiber fleece and MNP-doped alginate hydrogel capsules inside and below the model.
Photonics 10 01129 g002
Figure 3. Schematic representation of the experimental set-up in transmission geometry.
Photonics 10 01129 g003
Figure 4. Light microscopy images of the immunofluorescence staining of the fibroblast-containing 3D models: (a) unfrozen; (b) inductively thawed; and (c) water bath thawed models. The corresponding colors represent the following: (blue) DAPI staining; (red) anti-vimentin staining; and (gray) visualization of the fibrous fleeces based on transmitted light measurement.
Photonics 10 01129 g004
Figure 5. Polarimetric images taken at 700 nm with the two adjacent ROIs (paraffin—left part, tissue model stripes—right part). In the first row, only the intensity images are shown, while in the second row—the images of the orientation angle  θ . Images (a,d) correspond to the reference class, (b,e) to the water-thawed class, and (c,f) to the RF inductive thawing with MNPs, respectively. The size of each image is 400  μ m by 300  μ m.
Photonics 10 01129 g005
Figure 6. Circular color bar (in degrees) for the orientation angle  θ .
Photonics 10 01129 g006
Figure 7. Normalized histograms from the patches of all three classes.
Photonics 10 01129 g007
Figure 8. Numerical values of the standard deviation  σ  (first row) and the entropy H (second row) of all patches from the azimuth  θ  of the three classes: (a,d) Reference, (b,e) Water-thawed, and (c,f) RF thawed with MNPs.
Photonics 10 01129 g008
Disclaimer/Publisher’s Note: The statements, opinions and data contained in all publications are solely those of the individual author(s) and contributor(s) and not of MDPI and/or the editor(s). MDPI and/or the editor(s) disclaim responsibility for any injury to people or property resulting from any ideas, methods, instructions or products referred to in the content.