Article

Improving the False Alarm Capability of the Extended Maximum Average Correlation Height Filter

1
Department of Physics, Indian Institute of Technology Patna, Bihta, Patna 801106, Bihar, India
2
LSL Teams, L@b ISEN, Yncrea Ouest, 20 rue Cuirasse Bretagne, CEDEX 2, 29228 Brest, France
*
Author to whom correspondence should be addressed.
Photonics 2023, 10(10), 1096; https://doi.org/10.3390/photonics10101096
Submission received: 7 August 2023 / Revised: 19 September 2023 / Accepted: 26 September 2023 / Published: 29 September 2023
(This article belongs to the Special Issue Diffractive Optics – Current Trends and Future Advances)

Abstract

:
The extended maximum average correlation height (EMACH) filter is a potent pattern-detection tool used in image processing and computer vision applications. This filter enhances the effectiveness of the maximum average correlation height (MACH) filter by adding more features and flexibility. Incorporating the benefits of wavelet decomposition, we updated the EMACH filter to enhance its performance. The updated filter offered improved accuracy, robustness, and flexibility in recognizing complex patterns and objects in images with varying lighting conditions, noise levels, and occlusions. To verify the results’ consistency and compare their performance with that of the MACH filter and EMACH filter, performance metrics like peak-to-correlation energy, peak-to-sidelobe ratio, signal-to-noise ratio, and discrimination ratio were computed. Through numerical and experimental studies, we found that the proposed filter enhances the identification rate and decreases the number of false alarms.

1. Introduction

In image processing and computer vision, object identification and target detection are crucial due to their usage in surveillance, picture analysis for robots, and autonomous systems. Identifying and localizing particular objects or targets and then converting them into digital images is crucial for these activities. This can be difficult owing to the differences in appearance, illumination, clutter, and noise [1].
Automated target recognition (ATR) is commonly used in the classification of input observations; such targets may be artificial versus natural, non-vehicle versus vehicle, truck versus tank, or one type of tank versus a different type of tank [1,2]. Biometric signatures for human identification, such as the face, fingerprints, the iris, and voice signals, are a significant category of pattern-recognition applications [3,4,5,6,7,8]. Correlation filters have gained popularity over the years for their ability to address some of the challenges of object recognition and target detection. These filters exploit the correlation properties of images to achieve high selectivity and robustness. Another benefit of a correlation filter is that it can be optically and digitally implemented [2,3]. For optical implementation, two well-known architectures were developed: the VanderLugt correlator (VLC) and the joint transform correlator (JTC) [9]. The VLC architecture, which is typically used to accomplish correlation, gained a lot of interest, as it can produce clear correlation peaks for matching input targets even when they are distorted or noisy. However, to establish a correlation through optical implementation, the optical components must be precisely aligned. Thus, a hybrid digital–optical correlation architecture was developed that addresses the limitations of the all-optical VLC geometry. This hybrid architecture is strong and compact with respect to the VLC geometry and also combines the advantages of optical and digital signal processing [10,11].
In optical pattern recognition, the basic filter is the matched filter, and significant progress has been reported in the last few decades [9]. However, the geometrical aberrations of the target, such as the scale and rotation fluctuations drastically reduce the output correlation peak of the matched filter, rendering its application inefficient. Further, several filters were developed [12,13,14,15,16,17,18,19,20,21,22,23,24,25,26], such as the minimum average correlation energy (MACE) filter [12], the maximum average correlation height energy (MACH) filter [13,14,15], the extended MACH (EMACH) filter [16], the Eigen-extended MACH (EEMACH) filter [17], the wavelet-modified MACH filter [18,19], the log-polar-based wavelet-modified MACH filter [20,21], the logarithmically preprocessed EMACH filter [22], and the maximum margin correlation filter [23], to cater to the needs of target identification. These filters are a type of synthetic discrimination function (SDF) filter [24,25,26]. It was shown that the performance of correlation filters for pattern recognition is quite good. To develop correlation filters, a training set of images from the intended class is often employed. The training set contains the expected variance for the target class.
It was reported that the MACE filter employs constraints to ensure that the correlation outputs presume a certain value at the origin. Its main advantage is that it has a high discrimination capability and can accurately distinguish between similar objects. The filter is sensitive to noise and may produce false positives or negatives if the input image is too noisy. It requires a large amount of training data to accurately perform [27]. Despite the low computational complexity of the MACE filter, it still requires considerable computational resources while implementing it, which can be a limitation for some specific applications [6].
The MACH filter is a correlation filter similar to the MACE filter [13,14,15]. This filter can identify objects in noisy circumstances like the MACE filter. Furthermore, the MACH filter is calibrated to minimize the correlation sidelobes and enhance the correlation peak of the object. It is highly capable of discrimination, which means that it can make a clear distinction between two similar objects with enhanced accuracy; along with this, it has the ability to detect correlation peaks and suppress clutter and noise as well [28,29]. The EMACH filter is an extension of the MACH filter, which is designed to improve the performance when an object that has to be recognized is subject to deformation or distortion. This filter also overcomes the clutter rejection limitation [16]. The metrics used for developing the EMACH filter are the modified average similarity measure (ASM) and the all-image correlation height (AICH). The AICH is developed to improve the clutter rejection performance and also to balance the contribution of each training picture with the average. The discrimination and distortion tolerance of the filter is balanced with the added modification in ASM. The β parameter, which improves clutter image rejection while maintaining the distortion-tolerant MACH filter feature, is the key to the enhanced performance of the EMACH filters [30,31,32,33,34,35,36].
The decomposition of the signal into dilated and translated wavelets is accomplished by wavelet transform due to its amazing multiresolution, denoising, and feature extraction capabilities. Therefore, wavelet transform drew considerable attention for optical pattern recognition [37]. Due to its spectacular edge-enhancement characteristic, a sharper correlation peak is produced by the wavelet-matched filter [38,39,40], and the correlation output peak increases when the wavelet is implemented in the MACH filter [18,19,20,21].
This paper shows how the wavelet-modified EMACH filter works for in-plane rotated-target identification. The wavelet transform enhances the correlation output and decreases the number of filters needed to detect a target rotated at any angle under in-plane rotation. The rest of the paper is arranged as follows. Section 2 describes the approach. In Section 3 and Section 4, the simulation results as well as the performance of the calculated filters, such as the peak-to-correlation energy (PCE), peak-to-sidelobe ratio (PSR), signal-to-noise ratio (SNR), and discrimination ratio (DR) are shown. The experimentally obtained results are shown in Section 5. An overview of the results recommendations for future research directions are provided in Section 6 and Section 7, respectively, which also serve as the paper’s conclusion.

2. Principle

2.1. Maximum Average Correlation Height Filter

In this section, we briefly discuss the design of a MACH filter. The design was thoroughly investigated in [13]. Let xi and m be d2 × 1 vector containing the lexicographically ordered version of the two-dimensional (2D) Fourier transform (each with d × d = d2 components) of the ith image and average training image, respectively. The MACH filter in the frequency domain is represented by Mh, a column vector with d2 elements.
M h = ( I + S x ) 1 m
where Sx is the diagonal matrix, called the ASM, and I represents the identity matrix of the same dimension as a diagonal matrix of ASM. The ASM is defined as
S x = 1 N i = 1 N ( X i M ) ( X i M )
where †, Xi, and M represent the complex conjugate transpose, the diagonal matrix of xi, and the diagonal matrix of m, respectively.

2.2. Extended Maximum Average Correlation Filter

In this section, we elucidated the EMACH filter design. The details of the design were thoroughly investigated in [16]. The EMACH filter in the frequency domain is represented by Eh, which is a column vector with d2 elements.
E h = ( I + S x β ) 1 C x β
where S x β is the diagonal matrix, called the modified average similarity measure (MASM); C x β is the new column matrix, called the all image correlation height (AICH); and I represents the identity matrix of the same dimension as a diagonal matrix of the MASM. The MASM and AICH are defined as
S x β = 1 N i = 1 N [ X i ( 1 β ) M ] [ X i ( 1 β ) M ]
and
C x β = 1 N i = 1 N ( x i β m ) ( x i β m )
where †, Xi, and M represent the complex conjugate transpose, the diagonal matrix of xi, and the diagonal matrix of m, respectively. β is a performance parameter whose value varies between 0 and 2. As β increases, the MASM and AICH metrics emphasize the high-frequency components, making the filter more sensitive to clutter.

2.3. Wavelet-Modified EMACH Filter

In most pattern-recognition applications, image registration, motion estimation, and image-fusion algorithms are based on the edges, contours, and local features of images. The wavelet transform is a multiscale local operation. Mathematically, a 2D orthogonal wavelet is expressed as [37]
h a 1 , a 2 , b 1 , b 2 ( x , y ) = 1 a 1 a 2 h ( x b 1 a 1 , y b 2 a 2 )
where a1 and a2 represent the scale parameters (>0), and b1 and b2 refer to the shift parameters. The wavelet transform of the signal is the inner product between a signal, f(x), and a set of wavelets.
In this work, a 2D Mexican hat wavelet, also known as the second derivative of the Gaussian function, is used. It is mathematically expressed as
h ( x , y ) = [ 1 ( x 2 + y 2 ) ] e { ( x 2 + y 2 ) 2 }
The Mexican hat wavelet’s Fourier transform is given as
H ( u , v ) = 4 π 2 ( u 2 + v 2 ) e [ 2 π ( u 2 + v 2 ) ]
We multiplied the square of the Mexican hat wavelet’s Fourier transform |H(u,v)|2 with the EMACH filter to develop the wavelet-modified EMACH (WEMACH) filter because the EMACH filter is in the frequency domain, which is denoted by [13,16]
W E M A C H = E h × | H ( u , v ) 2 |

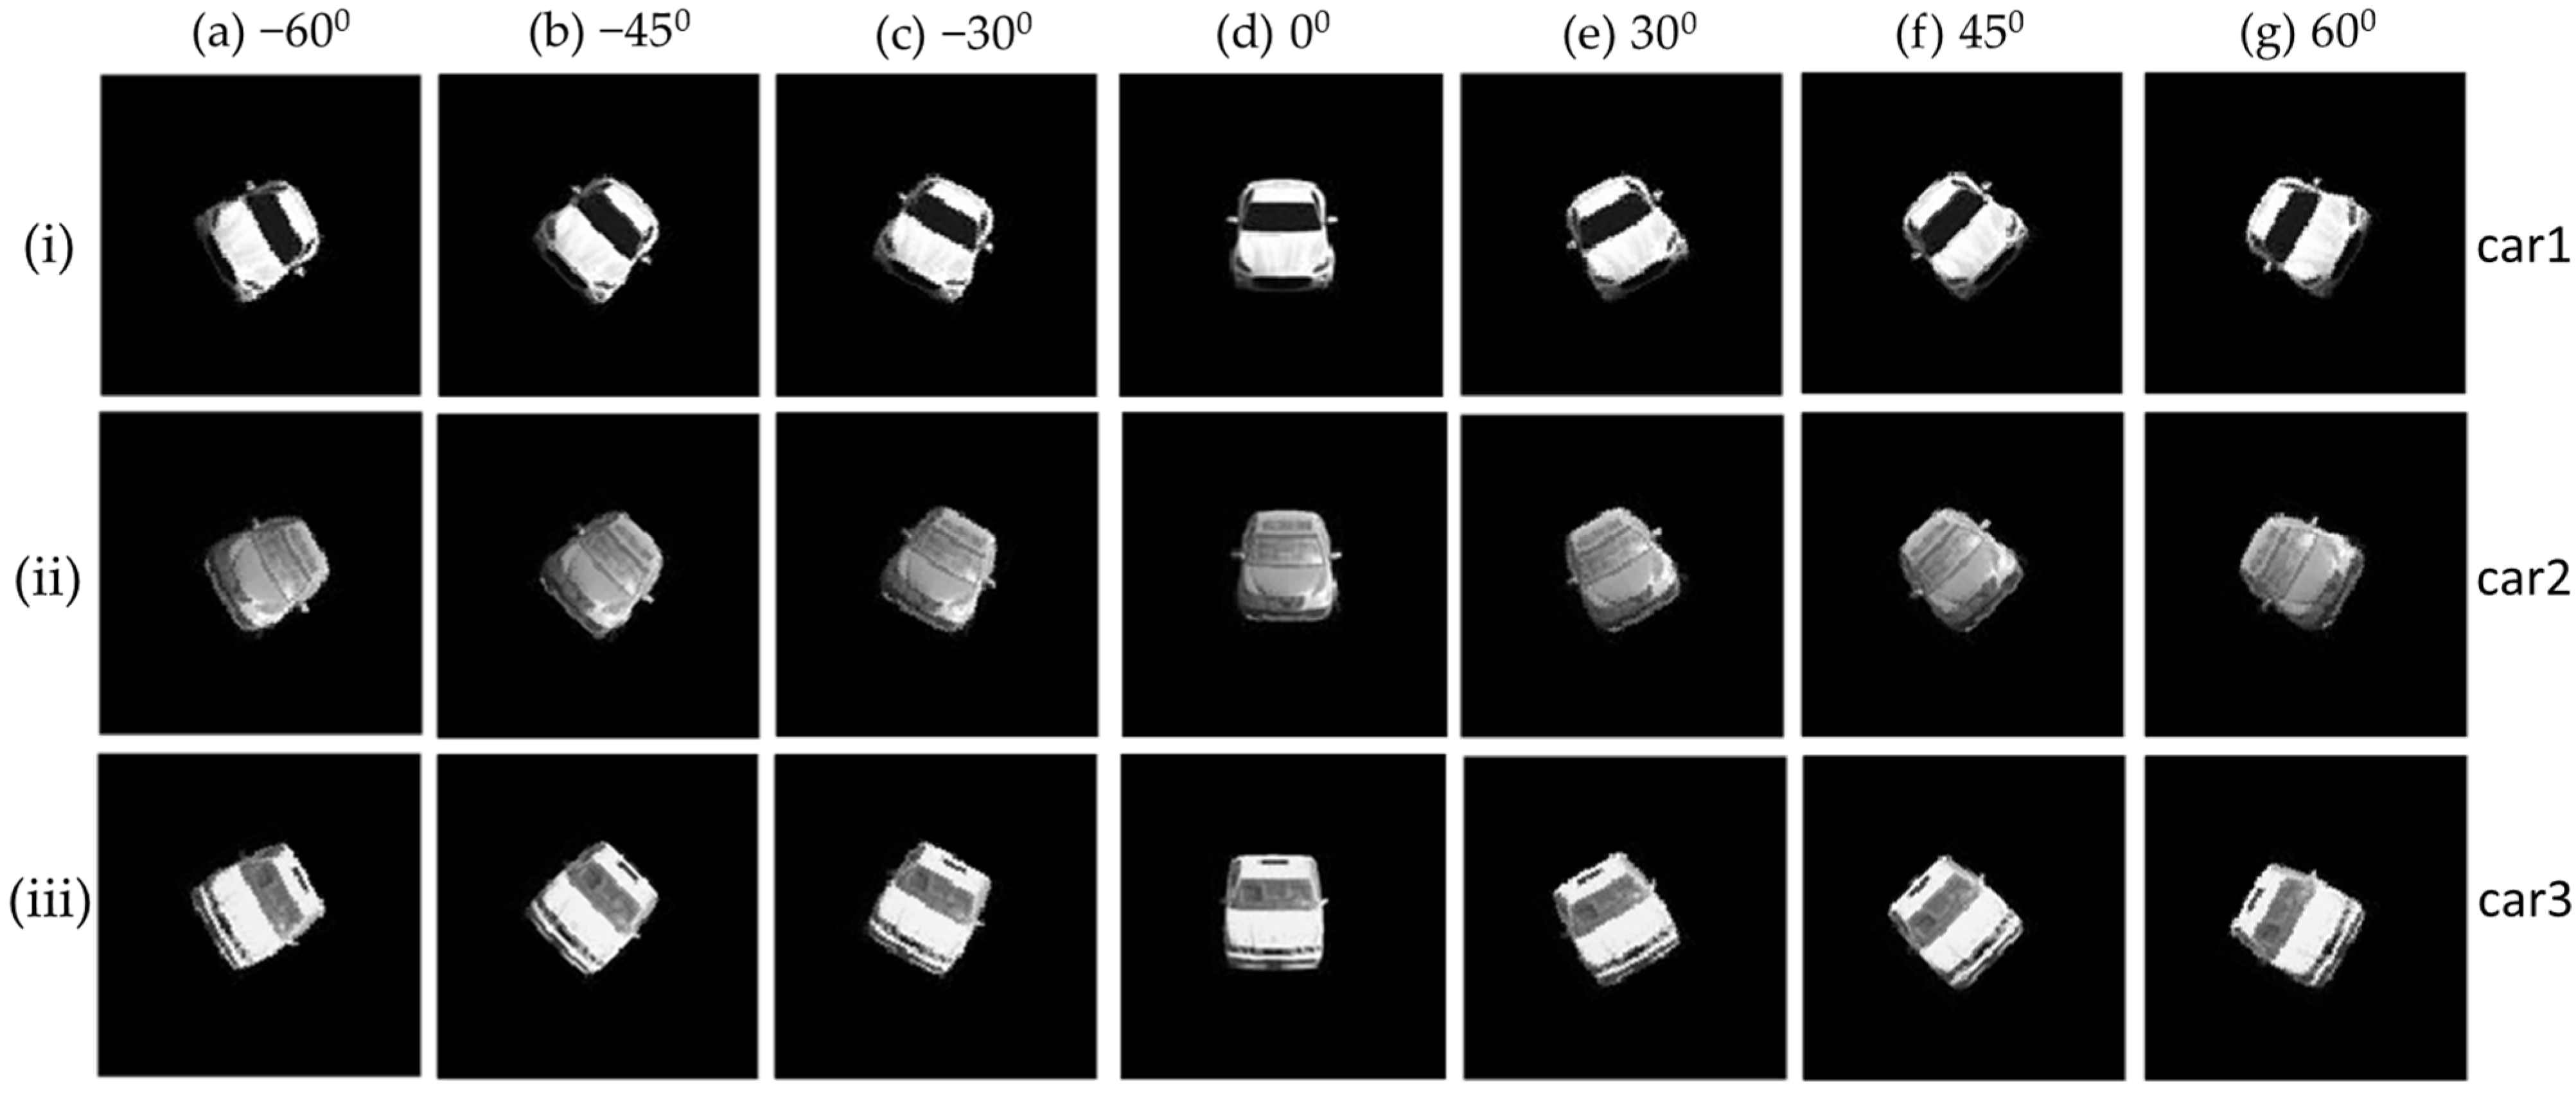
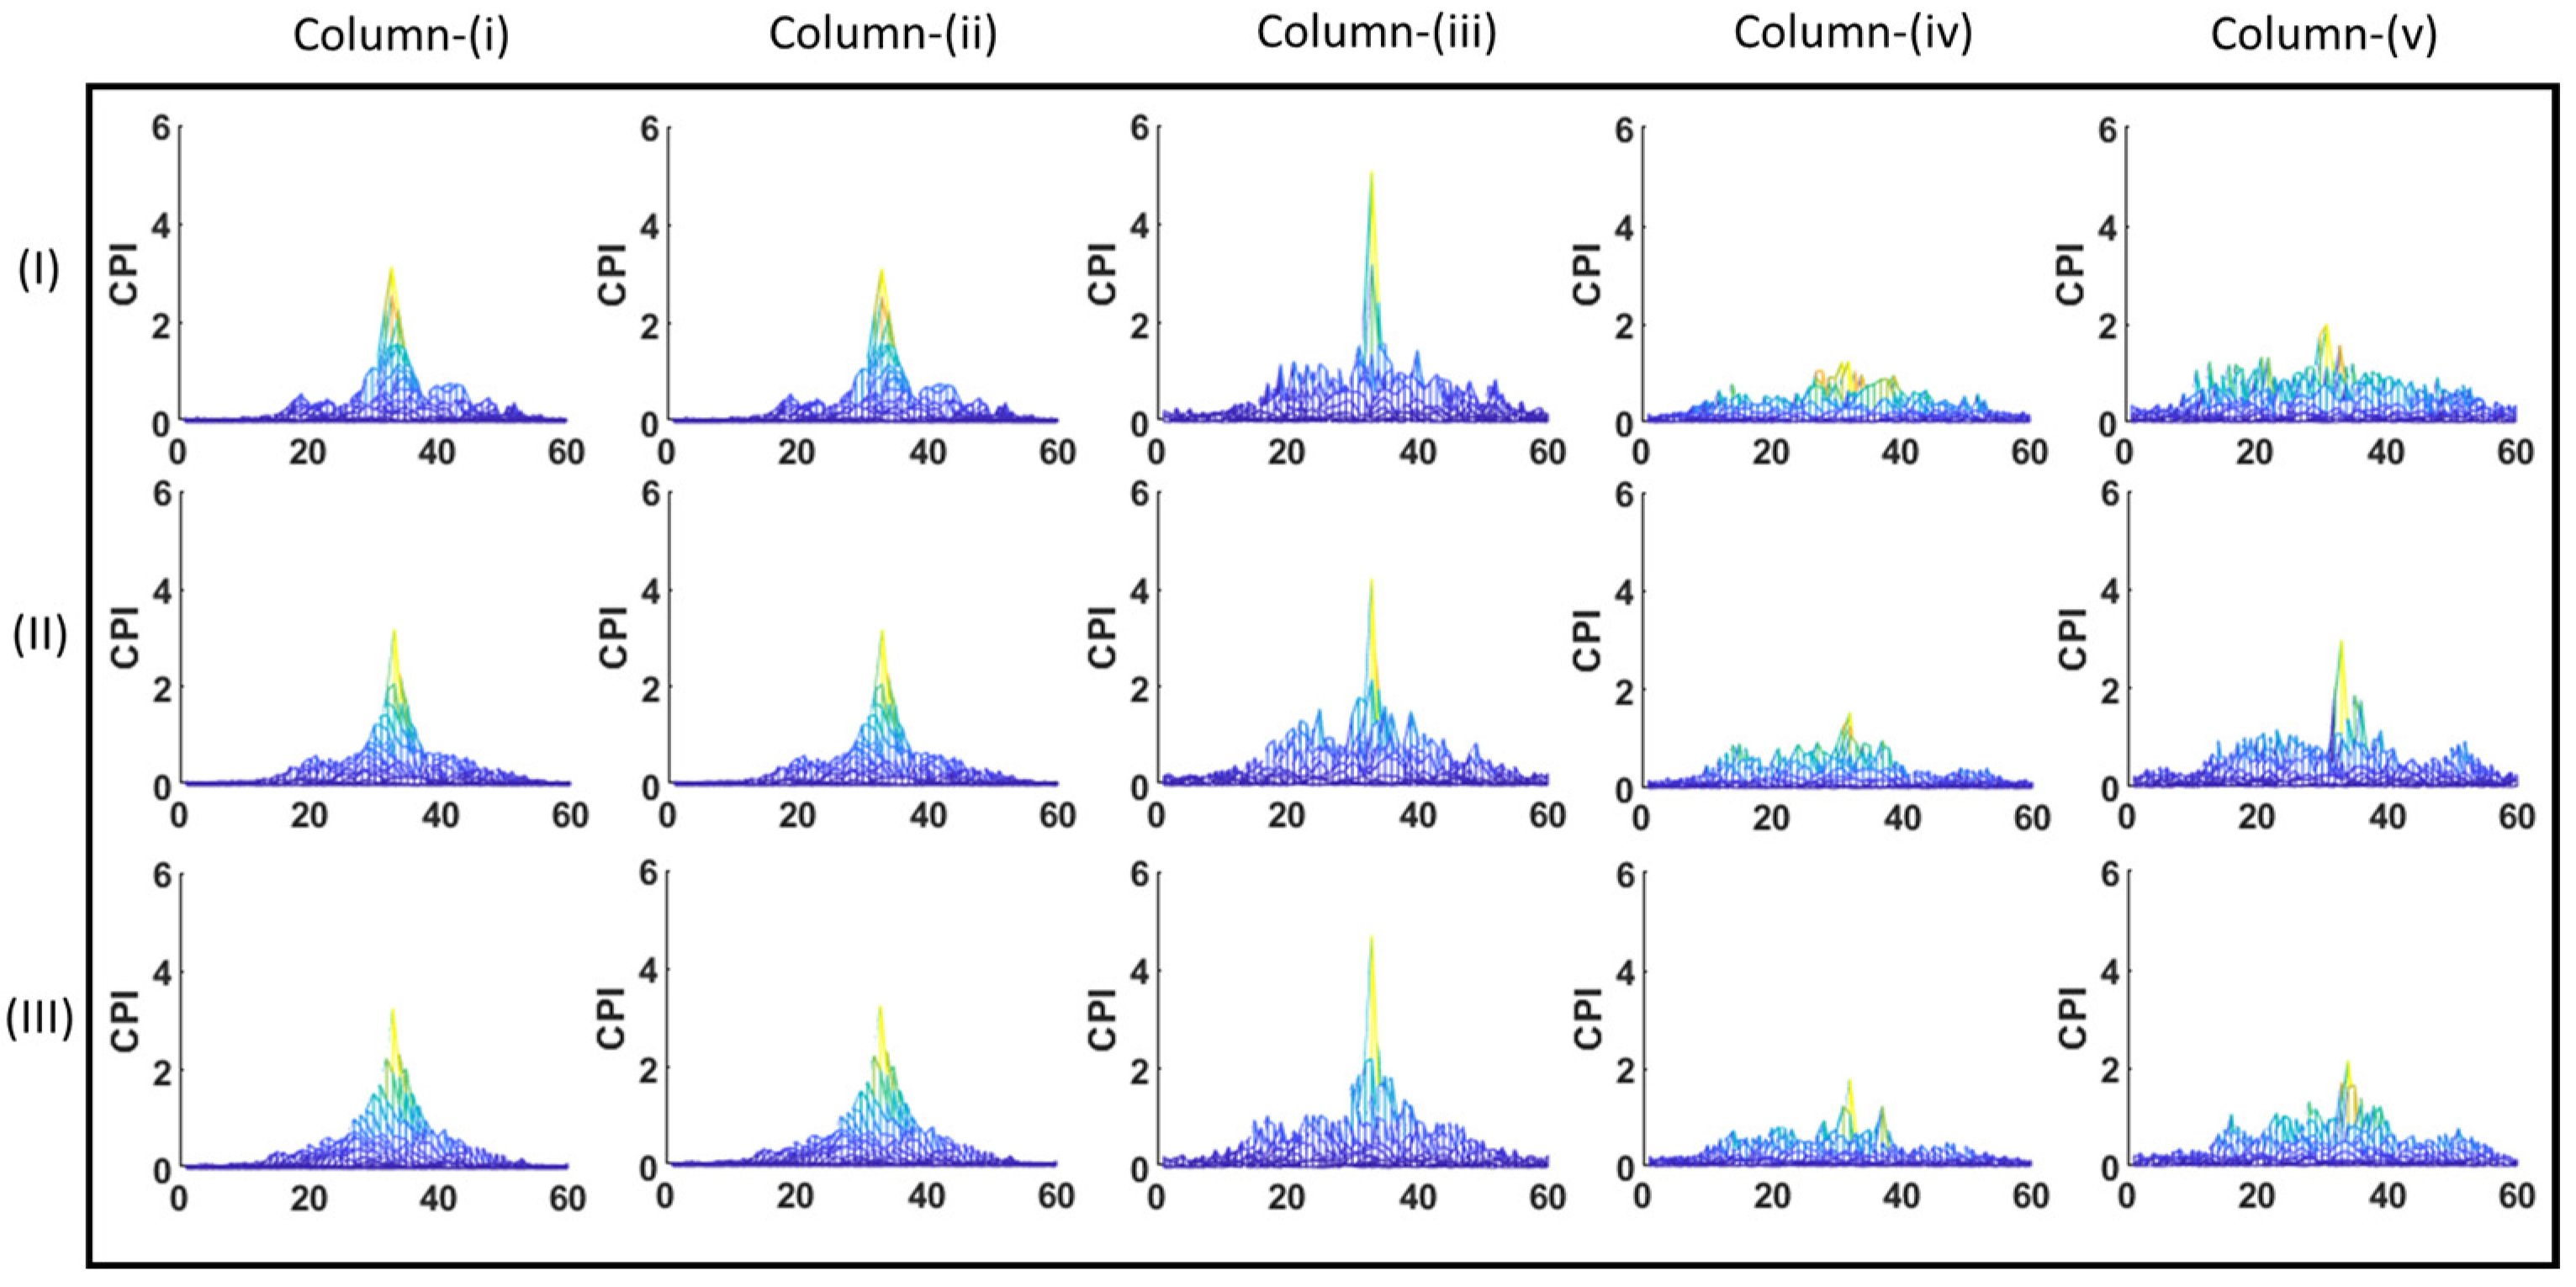
3. Simulation Results

The simulation study was carried out on the MATLAB platform. A sample set of the training images used in the study is displayed in Figure 1i. We created the dataset in the laboratory by using toy cars. The generated dataset contained 121 training images at 1° angular shifts from −60° to +60°. All the images were 64 × 64 pixels. The dataset was divided into two classes: true class (car1) and false class (car2 and car3) images, as shown in Figure 1i–iii.
We implemented the synthesized WEMACH in a hybrid optical-correlator scheme [10,11,18,19,20,21]. In this geometry, the target image is Fourier-transformed and multiplied with the pre-synthesized filter, which is referred to as a product function. The Fourier transform of the product function results in the correlation output. The block diagram of the proposed system is shown in Figure 2. In this approach, the training images are used to synthesize the EMACH filter and then combined with the Mexican hat wavelet filter to obtain the WEMACH filter. The correlation output is obtained by taking the inverse Fourier transform of the product of the synthesized WEMACH filter and the Fourier transform of a test image.
Figure 3 shows the simulation results obtained with the proposed correlation filters. The correlation peak intensity (CPI) obtained after employing the MACH and EMACH filters at β = 0.45 is shown in Figure 3 columns (i) and (ii), respectively. The EMACH filter is combined with a Mexican hat wavelet filter, and the CPI obtained as a result of employing the WEMACH filter is shown in Figure 3 column (iii). The in-plane rotation angles of −15°, 30°, and −45° correspond to Figure 3 rows (I), (II), and(III), and the true class images (car1) and false class images (car2 and car3) correspond to Figure 3 columns (i–iii) and (iv,v), respectively. We can observe that the CPI is significantly improved after the Mexican hat wavelet filter is used to modify the EMACH filter. After applying the MACH filter, the estimated CPI values are 3.141, 3.190, and 3.079 for three illustrative instances of −15°, 30°, and −45° rotated images of car1, respectively.
After using the EMACH filter, the values are 3.122, 3.174, and 3.136; finally, after using the proposed WEMACH filter, we find the values of CPI to be 5.086, 4.218, and 4.706. Thus, a significant positive change is observed. Since the wavelet filter behaves like a band pass filter, it helps to improve the correlation output with minimal computational cost. The CPI values for car2 are 1.246, 1.543, and 1.787, and for ca3 they are 1.998, 2.980, and 2.154 after applying the WEMACH filter at angles of −15°, 30°, and 45°, respectively, as shown in Figure 3 column (iv,v).
We checked the performance of the proposed filter in the range of angles from −60° to +60°. Within this range, the proposed filter performs well, and there is a significant improved in CPI compared to the MACH and EMACH filters, as shown in Figure 4. From the data used in Figure 4, we calculate the average values of CPI after applying the MACH, EMACH, and WEMACH filters on car1, car2, and car3. The obtained values are listed in Table 1. From Table 1, we observe that the average CPI of WEMACH for the true class images (car1) is higher, and for the false class images (car2 and car3) it is lower than the MACH and EMACH filters.
For better clarity of the results obtained from the proposed WEMACH filter, we explicitly show the true and false class images in Figure 5. A threshold line is also drawn on the same plot, which clearly separates the aforementioned two classes.

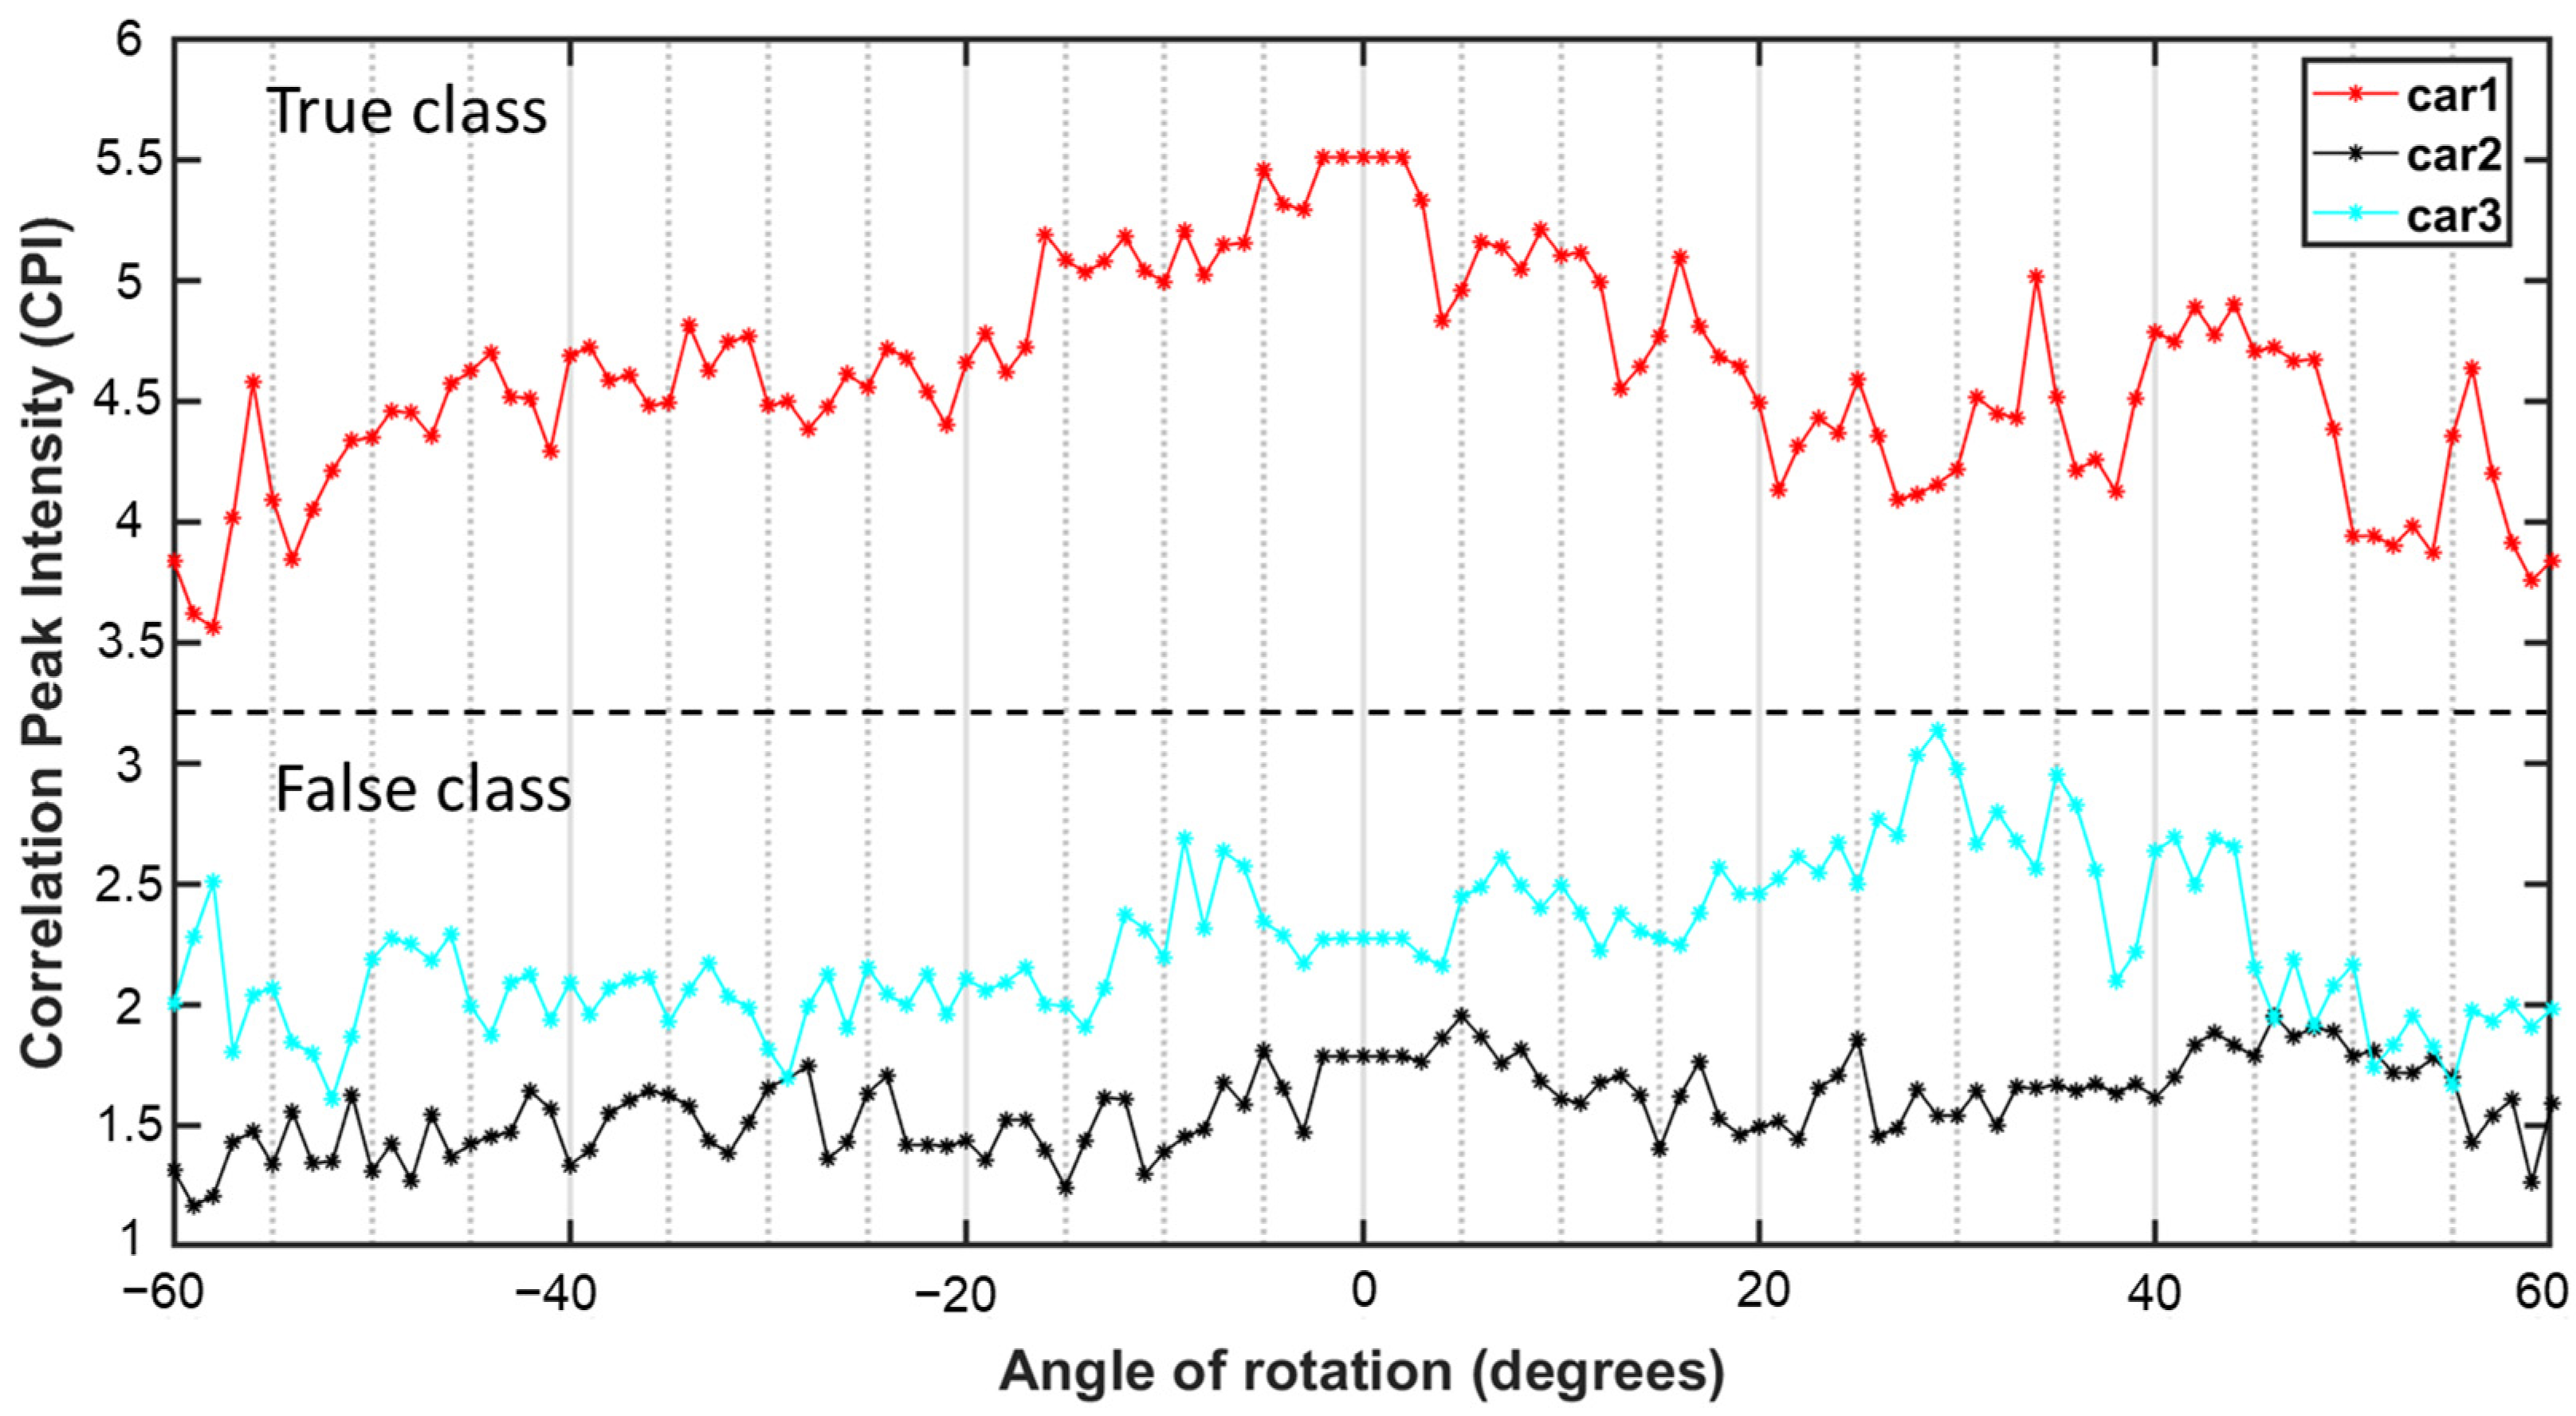
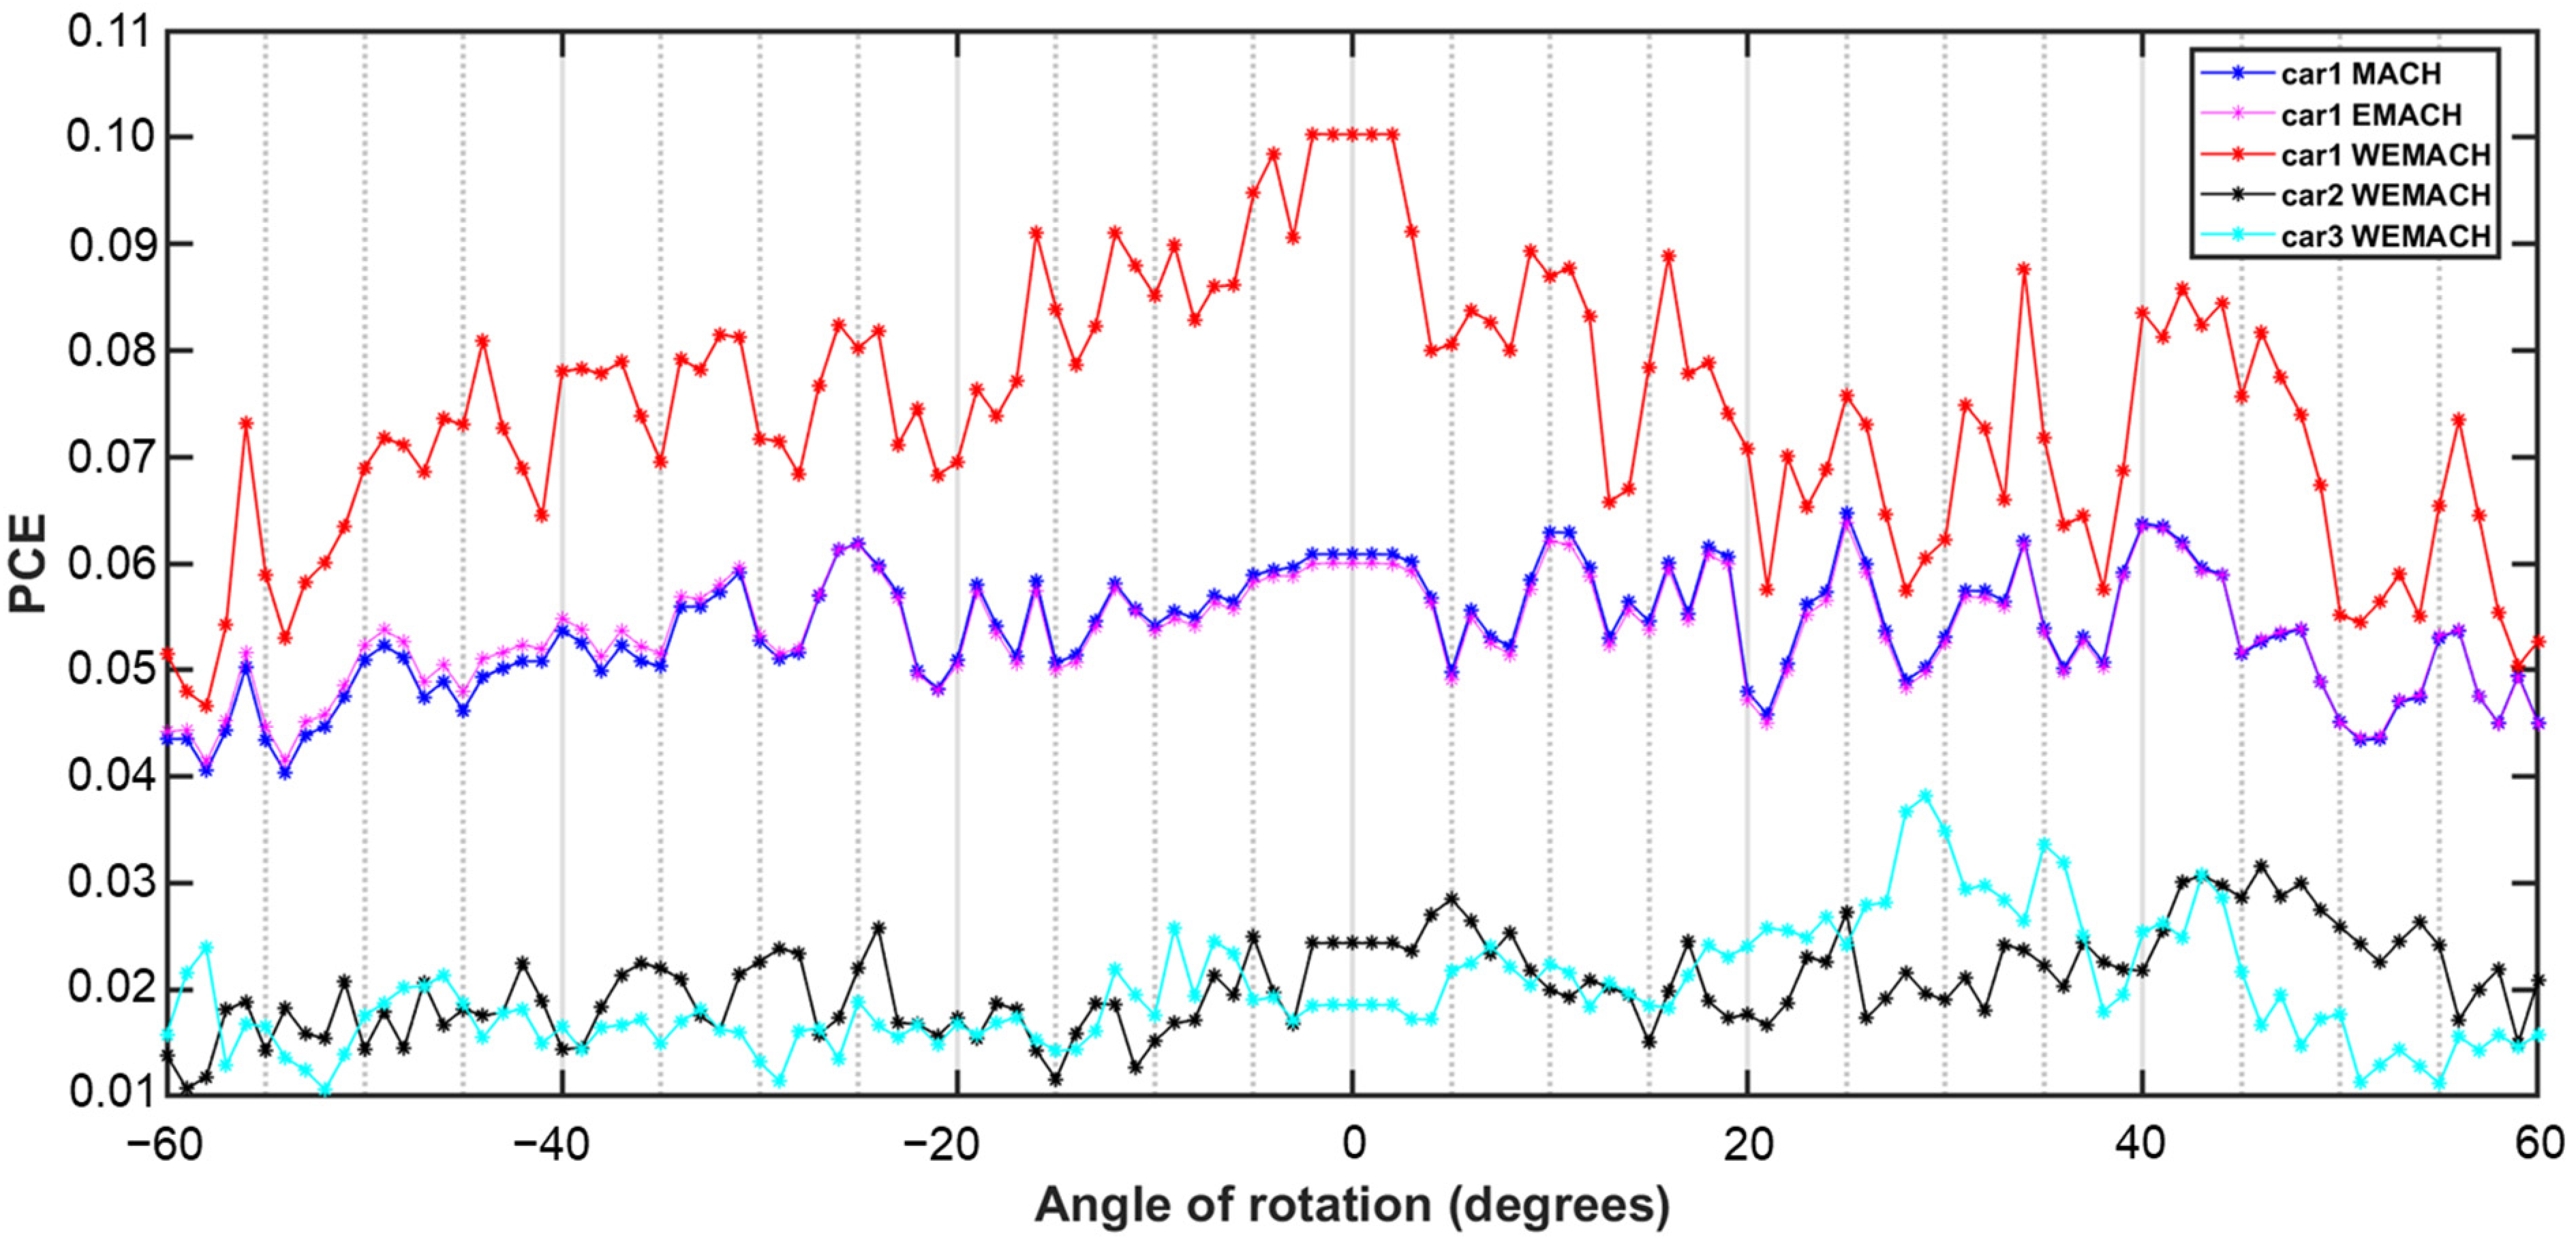
4. Performance Study

In this section, we discuss four performance measure parameters to study the effectiveness of the proposed filter. We calculate the values for PCE and PSR for all the filters. The SNR is calculated for (true class image car1 and false class images car2 and car3). Also, the DR is compared for all three filters: the MACH, EMACH, and WEMACH filters. These parameters help in the detection of a peak, discrimination capability, and threshold setting [41].

4.1. Peak-to-Correlation Energy

The ratio of the correlation peak intensity value to the total energy of the correlation plane is known as PCE [3].
P C E = C o r r e l a t i o n   p e a k   i n t e n s i t y T o t a l   e n e r g y   o f   t h e   c o r r e l a t i o n   p l a n e
The calculated PCE values are shown in Figure 6 for the range of in-plane rotation angles from −60° to +60° after using the MACH, EMACH, and WEMACH filters. The PCE ratio indicates how well the system can distinguish the desired target image from other images. A higher ratio suggests a better discrimination capability. We observe that WEMACH shows a higher PCE value for the true class image than other filters as well as false class images.

4.2. Peak-to-Sidelobe Ratio

The PSR parameter is expressed as [3]
P S R = p e a k m e a n s t a n d a r d   d e v i a t i o n = p µ σ
where p, µ, and σ are the correlation output peak, mean, and standard deviation of the correlation values in some neighborhoods of the peak, respectively. By having a higher PSR, the risk of false detections is reduced, as the sidelobes are weaker relative to the main peak of the desired target. We apply the MACH, EMACH, and WEMACH filters to determine the value of PSR for the true class images as well as the false class images, as shown in Figure 7. The PSR value is higher after applying the WEMACH filter than other filters.

4.3. Signal-to-Noise Ratio

Mathematically, the SNR is expressed as [3]
S N R = E η H v a r η
where E η H   stands for the expected value,   v a r η for variation, and η for the filter output peak. A high SNR is easy to detect or interpret, while a low SNR may be difficult to distinguish. The estimated values of SNR for the true class images are higher than the false class images, as shown in Figure 8, after applying the WEMACH filters. Therefore, we can easily distinguish the true class images from the false class images.

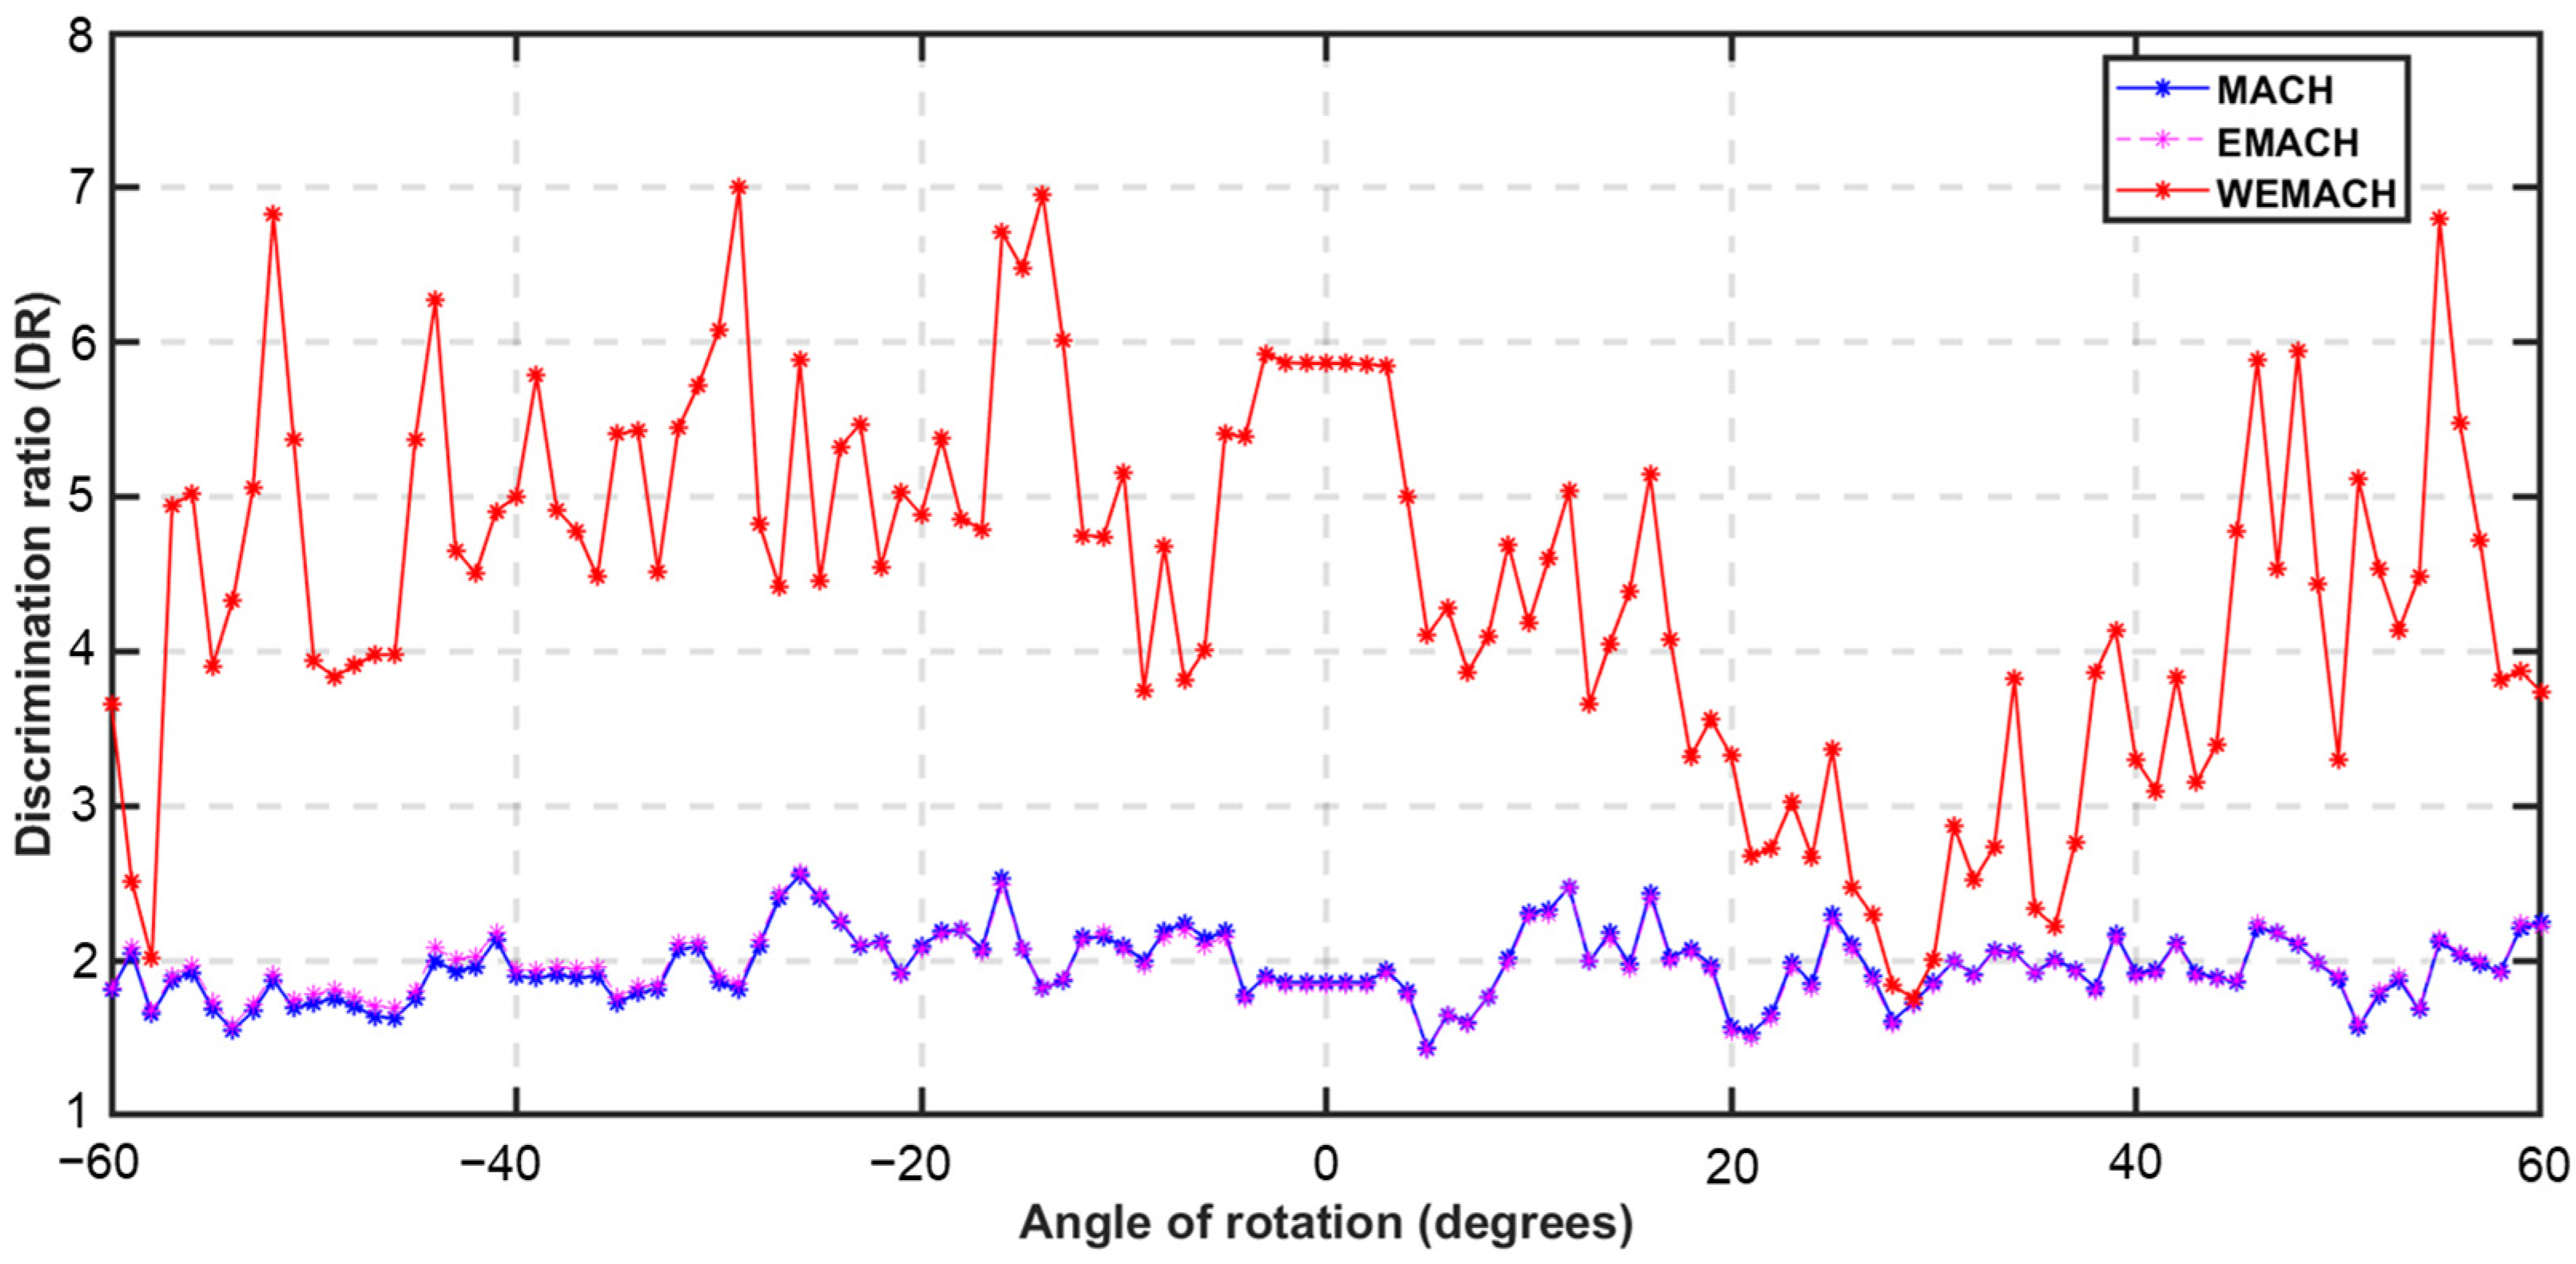
4.4. Discrimination Ratio

The parameter DR is expressed as [2]
D R = C P I t a r g e t C P I a n t i t a r g e t
where (CPI)target refers to the correlation peak intensity of the target, which means the true class images (car1), and (CPI)antitarget refers to the correlation peak intensity of the anti-target, which means the false class images (car2 and car3). The DR between the target car1 and the anti-target car2 for the MACH, EMACH, and WEMACH filters is shown in Figure 9. The average DR value is measured at about ~3.9 units for the MACH and EMACH filters case, but, in the case of the WEMACH filter, the average value of DR is noted to be ~8.7 units.
The DR between the target car1 and the anti-target car3 for the MACH, EMACH, and WEMACH filters is shown in Figure 10. The average DR value is measured at about ~1.9 units for the MACH and EMACH filters’ case, but in the case of the WEMACH filter, the average value of DR is noted to be ~4.4 units. We find that DR values between car1 and car3 for the EMACH filter are much less in the case of the MACH and EMACH filters, which indicates that these filters are not capable of identifying or distinguishing car1 and car3 because car1 and car3 look very similar compared to car2. Thus, the WEMACH filter performs better for similar objects. It is important to note that more than one DR value is considered as robust in pattern recognition [2].

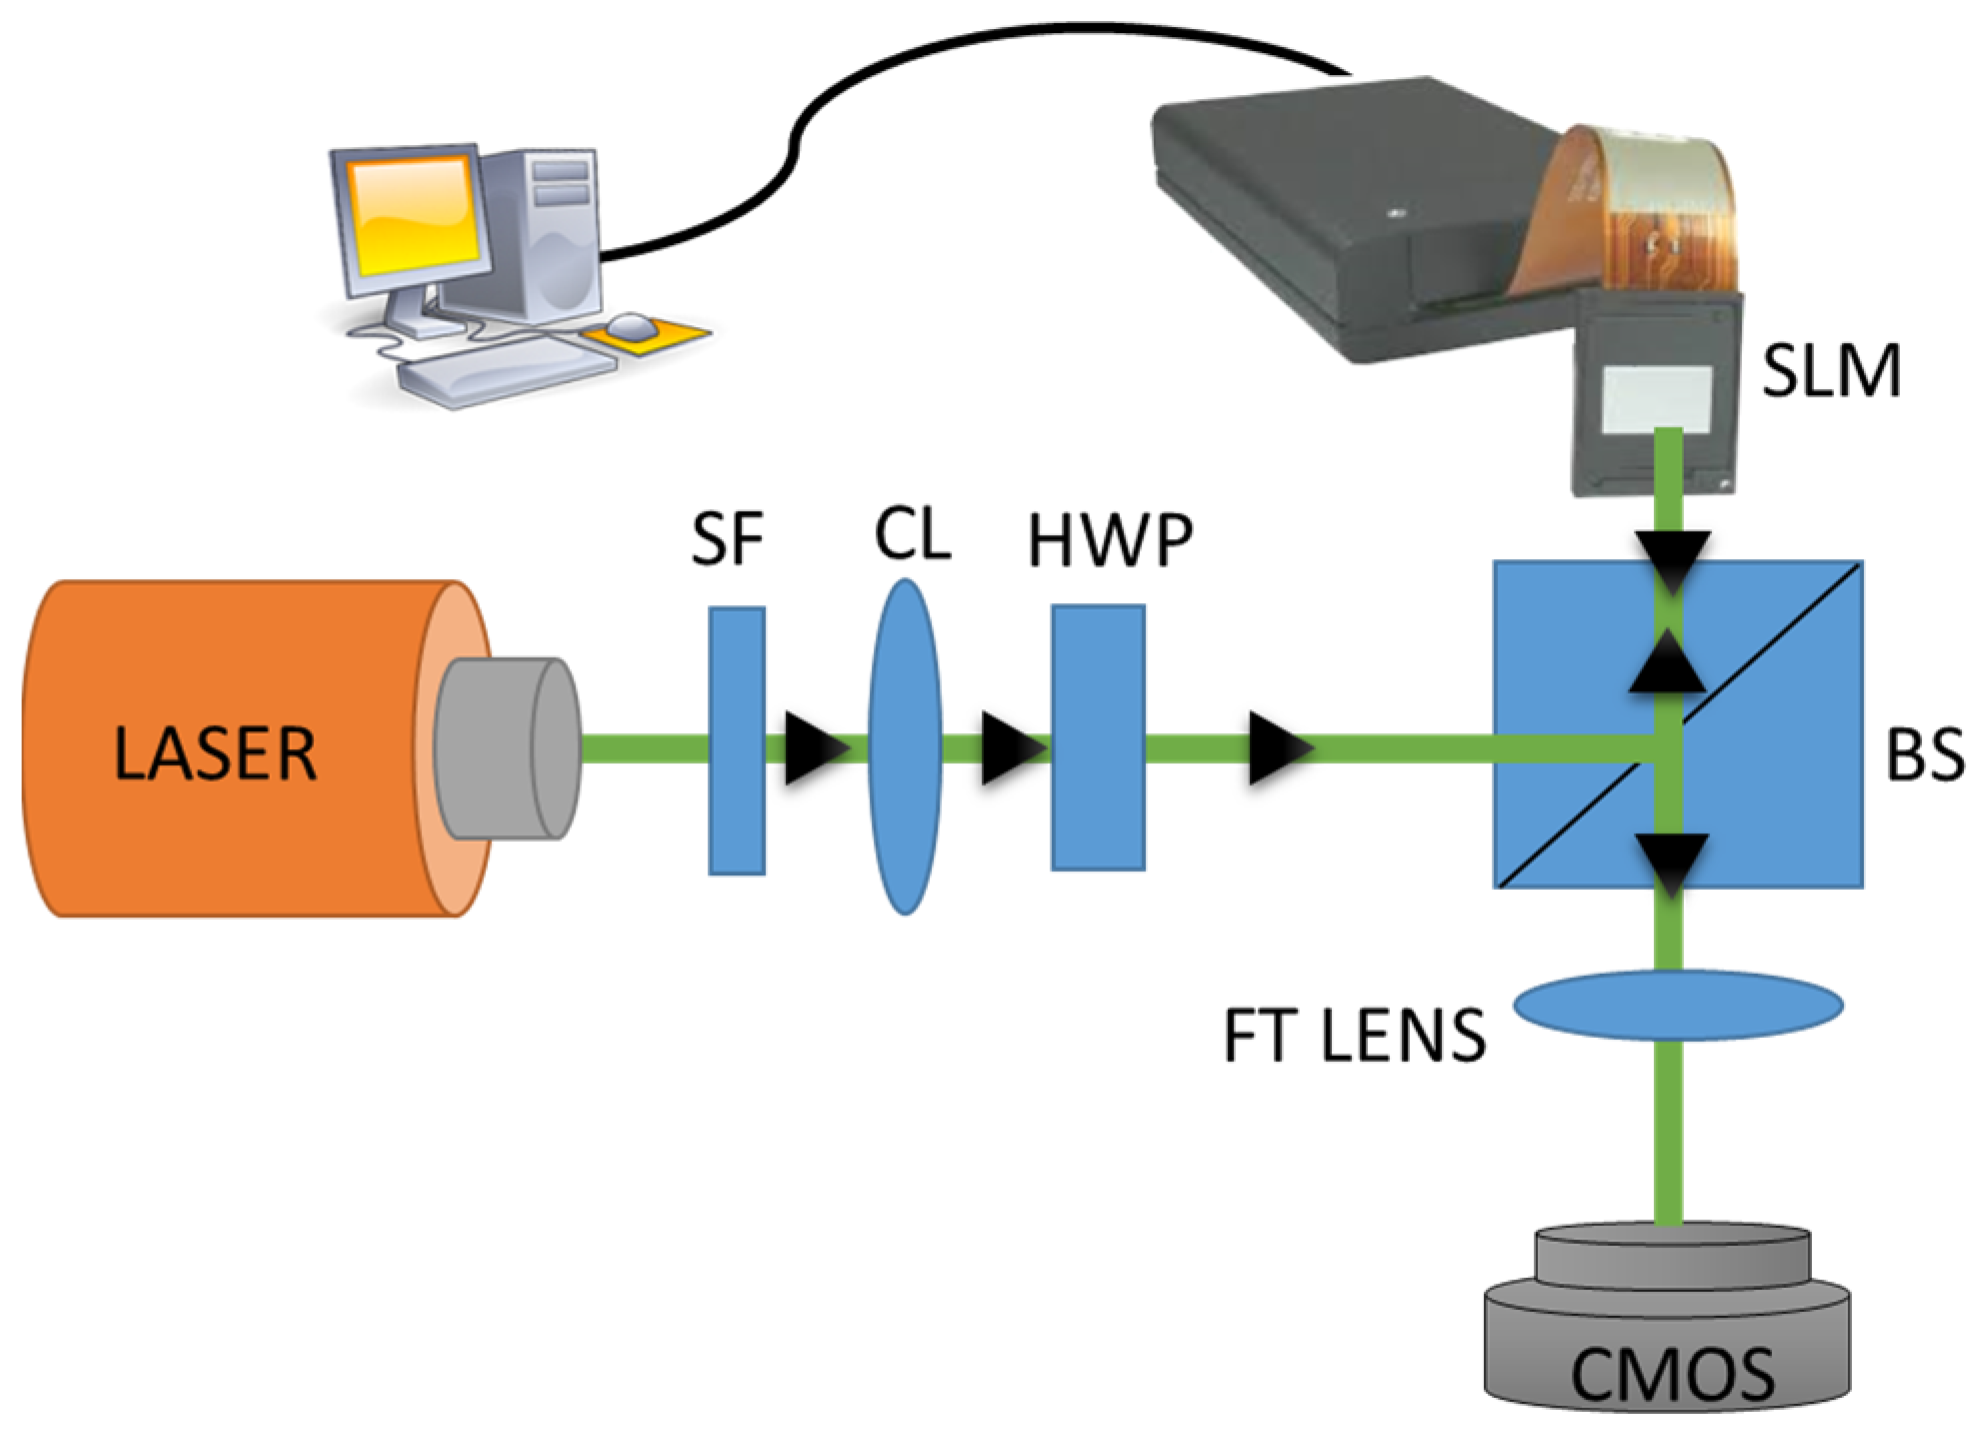
5. Experimental Results

Figure 11 presents the schematic experiment setup used for carrying out the experiment. It is based on a hybrid approach, where numerically synthesized filters are stored and used for identifying a target.
A laser beam coming from a DPSS laser (100 mW, Cobolt) is collimated and allowed to pass through a phase-only spatial light modulator (SLM) (Pluto Holoeye). The SLM has a resolution of 1920 × 1080 pixels with a pixel pitch of 8.0 µm. A half-wave plate is used before the SLM. A non-polarizing beam splitter allows the collimated beam to pass through the SLM, and it helps combine the pre-synthesized filters. The numerically computed Fourier transform of the target image is multiplied with the pre-synthesized filter, referred to as the product function, and is displayed onto the SLM. The product function, being a complex function, is encoded into phase-only data [42]. Finally, the encoded data displayed onto the SLM is Fourier-transformed with a lens (f = 135 mm), which results in the correlation output. The correlation peak intensity is recorded with a complementary metal oxide semiconductor (CMOS) camera (Infinity-I) with a resolution of 1080 × 1024 pixels and a pixel pitch of 5.2 µm. The recorded correlation peaks are shown in Figure 12.
Figure 12 rows (I–II) show the correlation outputs for rotated images at angles of 10°, −15°, and 35°. Column (i) shows the correlation output after using the MACH filter on the true class images (car1) at angles of 10°, −15°, and 35°, respectively. Column (ii) shows the correlation output after using the EMACH filter on the true class images (car1) at angles of 10°, −15°, and 35°. Column (iii) shows the correlation output after using the WEMACH filter on the true class images (car1) at angles of 10°, −15°, and 35°. Columns (iv) and (v) correspond to the correlation output after using the WEMACH filter on the false class images (car2 and car3) at angles of 10°, −15°, and 35°. With these results, we infer that the proposed WEMACH filter shows a better correlation output compared to the MACH and EMACH filters.

6. Discussion

After applying the WEMACH, MACH, and EMACH filters on the true class image (car1) and the false class images (car2 and car3) at every angle from −60° to +60° at an interval of 1°, the CPI is calculated. We observe that the proposed WEMACH filter shows a higher CPI value at every angle compared to the other filters (see Figure 4). From Table 1, we also observe that after using the WEMACH filter, the separation between the true class image and the false class image is ~two times more than after using the MACH/EMACH filters.
Further, we calculate the performance of parameters like PCE, PSR, SNR, and the pattern discrimination capability for all three filters. These parameters play a crucial role in assessing and improving the performance of correlation-based pattern-recognition systems. A higher ratio of PCE shows a more pronounced and significant peak, which makes the identification of the target more reliable. This is one of the metrics used for setting an appropriate threshold for decision making. By comparing the peak value to the overall correlation energy, a suitable threshold level can be chosen to decide whether the target is present or absent in the input data. In Figure 6, it is presented that the proposed filter shows a higher PCE value compared to the other filters.
A higher PSR indicates that the optical correlator performs better at discriminating the desired target from the unwanted sidelobes. This parameter also helps in setting an appropriate threshold for peak detection in the correlation output. As presented in Figure 7, the proposed filter shows a higher PSR value compared to the other filters.
A higher value of SNR helps in selecting robust features that are more likely to effectively represent the desired targets/patterns. In some cases, pattern identification involves setting a decision threshold to determine the presence or absence of the target patterns. A higher SNR allows for a more appropriate and accurate threshold setting. As presented in Figure 8, the proposed filter shows a higher SNR value compared to the other filters.
The value of DR shows a pattern-discrimination capability. A higher value of DR means a better capability of the filters. In the case of car1 and car2, the DR value of the WEMACH filter is ~two times the DR value of the MACH and EMACH filters. Also, in the case of car1 and car3, the DR value of the WEMACH filter is ~two times better than that of the MACH and EMACH filters, as shown in Figure 9 and Figure 10, respectively. Thus, the WEMACH filter shows better results compared to the MACH and EMACH filters.
For the verification of the numerically obtained results, we carry out an optical experiment. The experiment is carried out by using a hybrid digital correlator setup [10,11]. In this setup, first, we combine the synthesized filter with the Fourier transform of the target image, known as the product function, which is displayed on the SLM, and, after using the inverse Fourier transformation, we obtain the correlation output. During implementation, there is a problem in that the used SLM is a phase-only SLM, and the obtained product function is a complex function. If we display only the phase part, then some information is lost. Therefore, to overcome this problem, we map the complex data into a phase-only function that is displayed on the SLM [11,18,42]. The experimentally obtained results are discussed in Section 5.

7. Conclusions

The hybrid digital–optical correlation approach is implemented to demonstrate the enhanced capability of the WEMACH filter for an in-plane rotation from −60° to +60°. The performance of the EMACH filter is enhanced by incorporating the features of wavelet transformation. To quantify the efficacy of the results, four performance measure parameters, PCE, PSR, SNR, and DR, are calculated by employing all three filters. It is observed that the WEMACH filter outperforms all the other filters. Hence, use of the proposed WEMACH filter increases identification rates while lowering false alarm rates. In this study, an indigenous dataset is created using toy cars.

Author Contributions

Conceptualization, N.K.N.; Methodology, R.K.; Investigation, R.K.; Resources, N.K.N.; Writing—original draft, R.K.; Writing—review & editing, N.K.N.; Supervision, N.K.N. and A.A.; Funding acquisition, A.A.. All authors have read and agreed to the published version of the manuscript.

Funding

The authors acknowledge the funding from the Scientific and Engineering Research Board, Govt. of India, under grant no. CRG/2021/001763. The authors wish to extend their sincere thanks to Akash Pal and Jyoti Bikash Mohapatra for the valuable discussions.

Conflicts of Interest

The authors declare no conflict of interest.

References

  1. Javidi, B.; Horner, J.L. Real-Time Optical Information Processing; Elsevier Science: Amsterdam, The Netherlands, 2012. [Google Scholar]
  2. Yu, F.T.S.; Jutamulia, S. Optical Pattern Recognition; Cambridge University Press: Cambridge, UK, 1998. [Google Scholar]
  3. Kumar, B.V.K.V.; Mahalanobis, A.; Juday, R.D. Correlation Pattern Recognition; Cambridge University Press: Cambridge, UK, 2005. [Google Scholar]
  4. Kumar, B.V.K.V.; Savvides, M.; Xie, C.; Venkataramani, K.; Thornton, J.; Mahalanobis, A. Biometric verification with correlation filters. Appl. Opt. 2004, 43, 391–402. [Google Scholar] [CrossRef] [PubMed]
  5. Kumar, B.V.K.V.; Savvides, M.; Xie, C. Correlation pattern recognition for face recognition. Proc. IEEE 2006, 94, 1963–1976. [Google Scholar] [CrossRef]
  6. Wang, Q.; AlFalou, A.; Brosseau, C. New perspectives in face correlation research: A tutorial. Adv. Opt. Photon. 2017, 9, 1–78. [Google Scholar] [CrossRef]
  7. Thornton, J.; Savvides, M.; Kumar, B.V.K.V. A bayesian approach to deformed pattern matching of iris images. IEEE Trans. Pattern Anal. Mach. Intell. 2007, 29, 596–606. [Google Scholar] [CrossRef]
  8. Fernandez, J.A.; Kumar, B.V.K.V. Space-time correlation filters for human action detection. Proc. IS&T/SPIE Electron. Imag. Video Surveill. Transport. Imag. Appl. 2013, 8663, 27–41. [Google Scholar] [CrossRef]
  9. Goodman, J.W. Introduction to Fourier Optics; Roberts and Company Publishers: Greenwood Village, CO, USA, 2005. [Google Scholar]
  10. Munshi, S.; Beri, V.K.; Gupta, A.K. Hybrid digital-optical correlation employing a chirp-encoded simulated-annealing-based rotation-invariant and distortion-tolerant filter. Appl. Opt. 2007, 46, 4304–4319. [Google Scholar] [CrossRef]
  11. Gupta, A.K.; Nishchal, N.K.; Beri, V.K. A hybrid digital-optical correlator for automatic target recognition. Proc. SPIE 2007, 6574, 657406. [Google Scholar] [CrossRef]
  12. Mahalanobis, A.; Kumar, B.V.K.V.; Casasent, D. Minimum average correlation energy filters. Appl. Opt. 1987, 26, 3633–3640. [Google Scholar] [CrossRef]
  13. Mahalanobis, A.; Kumar, B.V.K.V.; Song, S.; Sims, S.R.F.; Epperson, J.F. Unconstrained correlation filters. Appl. Opt. 1994, 33, 3751–3759. [Google Scholar] [CrossRef]
  14. Mahalanobis, A.; Kumar, B.V.K.V. Optimality of the maximum average correlation height filter for detection of targets in noise. Opt. Eng. 1997, 36, 2642–2648. [Google Scholar] [CrossRef]
  15. Nevel, A.V.; Mahalanobis, A. Comparative study of maximum average correlation height filter variants using ladar imagery. Opt. Eng. 2003, 42, 541–550. [Google Scholar] [CrossRef]
  16. Alkanhal, M.; Kumar, B.V.K.V.; Mahalanobis, A. Improving the false alarm capabilities of the maximum average correlation height correlation filter. Opt. Eng. 2000, 39, 1133–1141. [Google Scholar] [CrossRef]
  17. Kumar, B.V.K.V.; Alkanhal, M. Eigen-extended maximum average correlation height (EEMACH) filters for automatic target recognition. Proc. SPIE 2001, 4379, 424–431. [Google Scholar] [CrossRef]
  18. Goyal, S.; Nishchal, N.K.; Beri, V.K.; Gupta, A.K. Wavelet-modified maximum average correlation height filter for rotation invariance that uses chirp encoding in a hybrid digital-optical correlator. Appl. Opt. 2006, 45, 4850–4857. [Google Scholar] [CrossRef] [PubMed]
  19. Goyal, S.; Nishchal, N.K.; Beri, V.K.; Gupta, A.K. Wavelet-modified maximum average correlation height filter for out-of-plane rotation invariance. Optik 2009, 120, 62–67. [Google Scholar] [CrossRef]
  20. Aran, A.; Nishchal, N.K.; Beri, V.K.; Gupta, A.K. Log-polar transform-based wavelet-modified maximum average correlation height filter for distortion invariance in a hybrid digital-optical correlator. Appl. Opt. 2007, 46, 7970–7977. [Google Scholar] [CrossRef]
  21. Aran, A.; Nishchal, N.K.; Beri, V.K.; Gupta, A.K. Log-polar transform-based wavelet-modified maximum average correlation height filter for distortion-invariant target recognition. Opt. Lasers Eng. 2008, 46, 34–41. [Google Scholar] [CrossRef]
  22. Rehman, S.; Bilal, A.; Javed, Y.; Amin, S.; Young, R. Logarithmically pre-processed EMACH filter for enhanced performance in target recognition. Arab. J. Sci. Eng. 2013, 38, 3005–3017. [Google Scholar] [CrossRef]
  23. Rodriguez, A.; Boddeti, V.N.; Kumar, B.V.K.V.; Mahalanobis, A. Maximum margin correlation filter: A new approach for localization and classification. IEEE Trans. Image Process. 2012, 22, 631–643. [Google Scholar] [CrossRef]
  24. Hester, C.F.; Casasent, D. Multivariant technique for multiclass pattern recognition. Appl. Opt. 1980, 19, 1758–1761. [Google Scholar] [CrossRef]
  25. Kumar, B.V.K.V. Tutorial survey of composite filter designs for optical correlators. Appl. Opt. 1992, 31, 4773–4801. [Google Scholar] [CrossRef] [PubMed]
  26. Kerekes, R.A.; Kumar, B.V.K.V. Selecting a composite correlation filter design: A survey and comparative study. Opt. Eng. 2008, 47, 067202. [Google Scholar] [CrossRef]
  27. Fisher, J.W., III; Principe, J.C. Recent advances to nonlinear minimum average correlation energy filters. Opt. Eng. 1997, 36, 2697–2709. [Google Scholar] [CrossRef]
  28. Gardezi, A.; Birch, P.; Kypraios, I.; Young, R.; Chatwin, C. Implementation of the maximum average correlation height (MACH) filter in the spatial domain for object recognition from clutter backgrounds. Proc. SPIE 2010, 7696, 568–576. [Google Scholar] [CrossRef]
  29. Sadjadi, F.A.; Mahalanobis, A. Target-adaptive polarimetric synthetic aperture radar target discrimination using maximum average correlation height filters. Appl. Opt. 2006, 45, 3063–3070. [Google Scholar] [CrossRef] [PubMed]
  30. Alkanhal, M.; Kumar, B.V.K.V.; Mahalanobis, A. Improved clutter rejection in automatic target recognition (ATR) synthetic aperture radar (SAR) imagery using the extended maximum average correlation height (EMACH) filter. Proc. SPIE 2000, 4053, 332–339. [Google Scholar] [CrossRef]
  31. Bhuiyan, S.M.A.; Alam, M.S.; Alkanhal, M. New two-stage correlation-based approach for target detection and tracking in forward-looking infrared imagery using filters based on extended maximum average correlation height and polynomial distance classifier correlation. Opt. Eng. 2007, 46, 086401. [Google Scholar] [CrossRef]
  32. Bhuiyan, S.M.A.; Alam, M.S.; Alkanhal, M. Automatic target recognition and tracking in FLIR imagery using extended maximum average correlation height filter and polynomial distance classifier correlation filter. Proc. SPIE 2005, 5807, 1–15. [Google Scholar] [CrossRef]
  33. Bhuiyan, S.M.A.; Khan, J.F.; Alam, M.S. Power enhanced extended maximum average correlation height filter for target detection. In Proceedings of the IEEE Southeastcon, Lexington, KY, USA, 13–16 March 2014. [Google Scholar] [CrossRef]
  34. Singh, R.; Kumar, B.V.K.V. Performance of the extended maximum average correlation height (EMACH) filter and the polynomial distance classifier correlation filter (PDCCF) for multiclass SAR detection and classification. Proc. SPIE 2002, 4727, 265–276. [Google Scholar] [CrossRef]
  35. Tehsin, S.; Rehman, S.; Awan, A.B.; Chaudry, Q.; Abbas, M.; Young, R.; Asif, A. Improved maximum average correlation height filter with adaptive log base selection for object recognition. Proc. SPIE 2016, 9845, 984506. [Google Scholar] [CrossRef]
  36. Sabir, M.D.; Butt, M.F.U.; Hassan, A.; Rehman, S.; Mehmood, M.; Aljohani, A.J. CoRAE: Energy compaction-based correlation pattern recognition training using autoencoder. IEEE Access 2023, 11, 28014–28033. [Google Scholar] [CrossRef]
  37. Rao, R.M. Wavelet Transforms: Introduction to Theory and Applications; Pearson Education India: Noida, India, 1998. [Google Scholar]
  38. Szu, H.; Sheng, Y.; Chen, J. Wavelet transform as a bank of the matched filters. Appl. Opt. 1992, 31, 3267–3277. [Google Scholar] [CrossRef] [PubMed]
  39. Roberge, D.; Sheng, Y. Optical wavelet matched filter. Appl. Opt. 1994, 33, 5287–5293. [Google Scholar] [CrossRef] [PubMed]
  40. Pohit, M.; Singh, K. Performance of a wavelet matched filter with optimized dilation designed using simulated annealing algorithm. Opt. Commun. 2001, 187, 337–346. [Google Scholar] [CrossRef]
  41. Kumar, B.V.K.V.; Hassebrook, L. Performance measures for correlation filters. Appl. Opt. 1990, 29, 2997–3006. [Google Scholar] [CrossRef]
  42. Davis, J.A.; Valadez, K.O.; Cottrell, D.M. Encoding amplitude and phase information onto a binary phase-only spatial light modulator. Appl. Opt. 2003, 42, 2003–2008. [Google Scholar] [CrossRef]
Figure 1. Row (i) shows the set of true class training images (car1), and rows (ii) and (iii) show the set of some false class target images (car2 and car3) at corresponding angles of −60°, −40°, −30°, 0°, 30°, 45°, and 60°, respectively.
Photonics 10 01096 g001
Figure 2. Block diagram for implemented wavelet-modified EMACH, FT: Fourier transform, IFT: inverse Fourier transform, PF: product function.
Photonics 10 01096 g002
Figure 3. Simulation results. Rows (IIII): CPI at angles of −15°, 30°, and 45°. Columns (iiii): CPI values after using MACH, EMACH, and WEMACH filters for true class images. Columns (iv,v): CPI values after using a WEMACH filter for false class images.
Photonics 10 01096 g003
Figure 4. Simulation results: plot of correlation peak intensity (CPI) versus angle of in-plane rotation for MACH, EMACH, and WEMACH filters.
Photonics 10 01096 g004
Figure 5. Simulation results: plot of correlation peak intensity (CPI) versus angle of rotation after using WEMACH filter for true class images (car1) and false class images (car2 and car3).
Photonics 10 01096 g005
Figure 6. Simulation results: plot of PCE values versus angle of in-plane rotation after using MACH, EMACH, and WEMACH filters for true class images (car1) and false class images (car2 and car3).
Photonics 10 01096 g006
Figure 7. Simulation results: plot of PSR values versus angle of rotation after using MACH, EMACH, and WEMACH filters for true class images (car1) and false class images (car2 and car3).
Photonics 10 01096 g007
Figure 8. Simulation results: plot of SNR values versus angle of rotation after using WEMACH filter for true class images (car1) and false class images (car2 and car3).
Photonics 10 01096 g008
Figure 9. Simulation results: plot of DR versus angle of rotation after using MACH, EMACH, and WEMACH filters (DR between target car1 and anti-target car2).
Photonics 10 01096 g009
Figure 10. Simulation results: plot of DR versus angle of rotation after using MACH, EMACH, and WEMACH filters (DR between target car1 and anti-target car3).
Photonics 10 01096 g010
Figure 11. Experimental setup. SF: spatial filter; CL: collimating lens; HWP: half-wave plate; BS: non-polarizing beam splitter; SLM: spatial light modulator; FT lens: Fourier transform lens; CMOS: complementary metal oxide semiconductor camera.
Photonics 10 01096 g011
Figure 12. Experimental results. Columns (iiii) show the correlation peak after using the MACH, EMACH, and WEMACH filters on true class images (car1), and columns (iv,v) show the correlation peak after using the WEMACH filter on false class images (car1 and car2), respectively. Rows (IIII) correspond to the in-plane rotation angles of 10°, −15°, and 35°, respectively.
Photonics 10 01096 g012
Table 1. The average values of CPI after applying the MACH, EMACH, and WEMACH filters on car 1, car2, and car3.
FilterCar1 Car2 Car3
MACH 3.2251.6382.313
EMACH 3.2251.6362.310
WEMACH 4.6141.5872.244
Disclaimer/Publisher’s Note: The statements, opinions and data contained in all publications are solely those of the individual author(s) and contributor(s) and not of MDPI and/or the editor(s). MDPI and/or the editor(s) disclaim responsibility for any injury to people or property resulting from any ideas, methods, instructions or products referred to in the content.

