Article

Tunnel Lining Crack Detection Method Based on Polarization 3D Imaging

1
Beijing Institute of Space Mechanics & Electricity, Beijing 100094, China
2
School of Optoelectronic Engineering, Xidian University, Xi’an 710071, China
3
Tieke Chengdu Testing Technology Co., Ltd., Chengdu 610021, China
4
School of Optoelectronic Engineering, Changchun University of Science and Technology, Changchun 130012, China
*
Author to whom correspondence should be addressed.
Photonics 2023, 10(10), 1085; https://doi.org/10.3390/photonics10101085
Submission received: 17 May 2023 / Revised: 13 June 2023 / Accepted: 21 July 2023 / Published: 27 September 2023
(This article belongs to the Special Issue Advanced Polarimetry and Polarimetric Imaging)

Abstract

:
Non-contact and non-destructive polarization 3D imaging uses a passive, single-frame array image to calculate 3D information, making it possible to obtain high-precision 3D information about tunnel cracks, and offering outstanding technical advantages. Based on the introduction of the principle of crack detection with polarization 3D imaging, a tunnel lining crack detection plan was developed and a detection equipment was designed. The method and process of polarization 3D imaging for lining crack detection are described in detail. A model of the impact of the tunnel environment on 3D detection and a method for obtaining absolute information have been established to obtain high-precision 3D information about cracks. In a real tunnel environment, tests were conducted to detect wide cracks, narrow cracks, and artificial cracks. The crack detection accuracy with respect to the crack width was 0.2–0.3 mm, and with respect to crack length was 0.2–0.3 mm. At the same time, crack depth information could be obtained. The present research results can provide technical support for the application of polarization 3D imaging in tunnel crack detection.

1. Introduction

With the prosperity and development of China’s economy and society, the number and length of tunnel constructions in China have rapidly increased in recent years, with railway tunnels becoming an important part of the transportation infrastructure. By the end of 2020, the operating mileage of railways in China reached 145,000 km, with a total of 16,798 railway tunnels in operation, spanning approximately 19,630 km, including 209 special-length railway tunnels with a total length of 2811 km. Tunnel safety has become particularly important, as the condition of tunnels directly affects railway safety and transport efficiency. Due to the different construction eras, materials, and structures, Itunnels have various problems. Tunnel lining cracks are among the most common tunnel problems; when such cracks extend to a certain degree, they inevitably change the stress state, increasing the probability of structural damage and potentially causing further problems, such as water leakages. Tunnel lining cracks and tunnel water leakages make up about 30% and 18%, respectively, of tunnel problems. Preventing and treating tunnel lining cracks, which requires the timely, accurate, and rapid detection of relevant crack data, is key to ensuring tunnel safety. However, tunnel cracks often have a similar color to the background structure, making them difficult to identify. Crack shapes are also varied and irregular, making recording and describing three-dimensional information about them complex.
Currently, non-contact and non-destructive detection techniques for tunnel lining cracks mainly include artificial detection, laser scanning-based detection, and camera-based detection [1,2,3,4]. The artificial detection method [1,2,3,4] has long detection times, a low efficiency, and high cost, while also yielding unreliable results. It also suffers from the inability to store the obtained data in digital archives and the inability to accurately express and record the morphology and nature of the observed cracks. The laser scanning-based detection method [1,2,3,4] scans the surface of the tunnel lining with a laser, calculates the three-dimensional coordinates of each point on the object surface based on the received signal, and obtains a tunnel surface image based on the positions of numerous points. This method requires a laser emission device and a receiving device, and the whole system is complex. Laser scanning requires the measurement of a large number of three-dimensional point coordinates and the reconstruction of the model based on point cloud data, resulting in the creation of large quantities of data and establishing a non-continuous three-dimensional surface. The camera-based detection method [1,2,3,4] mainly measures cracks using multiple linear sensors or array sensors. The image accuracy of linear sensors is influenced by the precision of the linear scanning motion; in comparison, array cameras offer better stability and intuitive imaging. This method has been applied in crack image acquisition systems for various inspection vehicles. To detect cracks in tunnel lining, this method mainly relies on two-dimensional image processing, using crack width, length, and area as the crack features, and obtaining feature values through image recognition. Due to the large amount of image data obtained with regard to tunnel lining surface and the complexity of tunnel environments, at present, the accuracy and efficiency of image recognition and crack identification fail to meet the practical requirements for high precision and rapid detection.
Currently, non-contact and non-destructive testing systems for tunnel lining cracks mainly include laser scanning detection systems, camera photography detection systems, and systems that contain laser scanning detection and camera photography detection [5]. The tunnel disease detection vehicle developed by the Korean Institute of Nondestructive Testing [6] uses CCD imaging technology for tunnel disease detection. It uses real-time photos and videos to generate static images, requires auxiliary lighting, and needs to identify cracks from a large number of images. The tunnel fast measurement system developed by China’s Wuhan University Zhuoyue Technology Co., Ltd., Wuhan, China [6,7] consists of four subsystems: a crack subsystem, a main control subsystem, an infrared subsystem, and a deformation subsystem. The crack subsystem includes 34 LED lighting systems and 32 high-speed area array cameras, achieving a full-coverage detection of tunnel cross-sections. The deformation subsystem includes two laser scanning radar systems with a crack width detection accuracy of 0.2 mm. The method, combining laser scanning detection and camera photography detection, uses laser scanning detection to obtain the three-dimensional contours of the lining and camera photography to detect lining cracks. In March 2014, Mitsubishi Electric Corporation of Japan launched the MIMM-R highway tunnel inspection vehicle [7], which consists of twenty array cameras, three GPS systems, one IMU system, one odometer, three laser scanning radars, and three cameras. The inspection vehicle uses array cameras and LED lighting devices to capture tunnel lining problems and uses laser scanning radars to depict the 3D contour of the lining.
Although non-contact tunnel-inspection methods such as laser scanning technology and digital camera measurement and detection technology can basically meet the requirements of daily tunnel inspection and serve good auxiliary roles in tunnel maintenance work, they have the following drawbacks. (1) A complex data processing—the image quality is greatly affected by the tunnel environment, making this approach unsuitable for use in tunnels during the construction period. Additionally, the massive quantity of generated data cannot be quickly and efficiently processed, resulting in a low crack-recognition accuracy and efficiency. (2) The detection system is complex, and crack recognition and tunnel 3D profile acquisition require the separate implementation of different pieces of equipment.
A tunnel lining crack detection method based on polarization 3D imaging was proposed in [8]. This approach uses a passive array polarization camera to obtain tunnel lining images and uses the polarization information of a single-frame image to reconstruct 3D information about the tunnel wall. Polarization 3D imaging is a passive, polarized imaging method. It utilizes the Fresnel equation to establish the function between the polarization characteristics of reflected light and the normal direction of the target surface to achieve 3D reconstructions. With this approach, 3D inversion can be achieved with a single image. As it does not require active illumination and is not limited by baseline length, it can better meet the application requirements of high-precision 3D information acquisition for crack detection in tunnel safety inspections.
Through elevation information calculation, cracks in tunnels that have different depths from the background structure can be quickly extracted, and crack width, length, and other information can be output simultaneously. Polarization 3D imaging is particularly suitable for identifying cracks with similar colors to the background structure; however, it is also affected by complex environmental factors, such as humidity and dust in the tunnel during the construction period. Therefore, it is necessary to consider tunnel environmental factors when using existing polarization 3D imaging technology to improve detection accuracy. Compared with existing detection methods, polarization 3D imaging technology has the advantages of a low power consumption, simple and small equipment, simple data processing, a high crack-detection accuracy, and the potential to build 3D tunnel profiles and generate 3D data for the identification of problems.
Polarization 3D imaging can also detect tunnel lining leakages caused by cracks, lining peeling, and lining corrosion. Among tunnel diseases, tunnel lining cracks and tunnel leakages account for approximately 50%. Monitoring lining cracks is more difficult than monitoring other tunnel diseases, so as long as tunnel cracks can be detected, other tunnel diseases can also be detected.

2. Detection Principle of Tunnel Lining Cracks Based on Polarization 3D Imaging

Polarization 3D imaging utilizes the relationship between the normal of the surface of the object to be detected and the degree of polarization of the reflected light on the surface. According to the reflection and refraction laws of light waves, the propagation direction of light wave on the surface of an object is determined by the direction of incidence of light wave and the shape of the object’s surface. The Fresnel formula and definition of the degree of polarization show the relationship between the polarization of the reflected light on the surface of the object and the direction of incidence of light wave. Therefore, the information about the direction of incident light can be obtained from the polarization of the reflected light on the surface of the object. As shown in Figure 1 [9], the light beam is incident on the surface of the object to be detected and is reflected after incidence. According to the law of light reflection, the incident angle of the incident light is equal to the reflection angle, which is equal to the angle θ in Figure 1. The propagation direction of the reflected light is the z-axis, and the plane where the detector is located is the xoy plane. The projection of the normal of the surface of the object n at the point of the incident light on the xoy plane is n , and the angle between it and the x-axis is φ . θ p o l is the linear polarization direction of the polarizer, and φ is the azimuth angle of the normal of the exit surface with respect to the x-axis.
To better present the relationship between the surface normal n , incident angle θ , and incident azimuth angle of the object φ , the normal n in Figure 1 is represented in polar coordinates as shown in Figure 2. The incident angle θ is the zenith angle of the normal n , and the incident azimuth angle φ is the azimuth angle of the normal n .
From Figure 2, it can be seen that the zenith angle θ and azimuth angle φ determine the surface normal n of the object, which is expressed as:
n = x z ( x , y ) x ^ y z ( x , y ) y ^ + z ^
n x = x z ( x , y ) = tan θ cos φ n y = y z ( x , y ) = tan θ sin φ
where θ [ 0 ° , 90 ° ] and φ [ 0 ° , 360 ° ] . Therefore, the target surface normal can be determined by the zenith angle and azimuth angle of the normal. z ( x , y ) is the relationship between the surface height of the object and the Cartesian coordinates ( x , y ) . z ( x , y ) is obtained by calculating the normal of the microfacets based on the polarization characteristics of the diffused reflection of the object surface in natural scenes [10].
In practical applications, the Stokes vector, composed of Stokes parameters, is often used to represent the polarization state of the light wave. When the incident angle θ p o l is 0°, 45°, 90°, and 135°, respectively, the cameras can obtain the intensity I 0 , I 45 , I 90 , and I 135 of the object to be detected in four polarization directions. I 0 represents the intensity of the horizontal polarization component. I 90 represents the intensity of the vertical polarization component. I 45 represents the intensity of the polarization component in the 45° direction. I 135 represents the intensity of the polarization component in the 135° direction. I R and I L are the intensities of the right-handed and left-handed circular polarization components, respectively. The Stokes parameters S0, S1, S2, and S3 are defined as:
S 0 = I 0 + I 90 S 1 = I 0 I 90 S 2 = I 45 I 135 = 2 I 45 ( I 0 + I 90 ) S 3 = I R I L
According to the definition of the degree of polarization, the degree of polarization P is given by:
P = S 1 2 + S 2 2 + S 3 2 S 0
where S 3 is related to circular polarization and can be ignored when considering mainly linear polarized light as complete polarized light. Therefore, the degree of polarization can be represented by Stokes parameters.
P = S 1 2 + S 2 2 S 0 = ( I 0 I 90 ) 2 + ( 2 I 45 ( I 0 + I 90 ) ) 2 I 0 + I 90
The zenith angle of polarized light from the object is:
θ = arccos n 4 ( 1 P 2 ) + 2 n 2 ( 2 P 2 + P 1 ) + P 2 + 2 P 4 n 3 P 1 P 2 + 1 ( P + 1 ) 2 ( n 4 + 1 ) + 2 n 2 ( 3 P 2 + 2 P 1 )
and the azimuth angle is:
φ = 1 2 { arctan ( S 2 / S 1 ) + 90 °   ,         S 1 0 arctan ( S 2 / S 1 ) + 180 ° ,       S 1 > 0     S 2 < S 1 arctan ( S 2 / S 1 ) + 0 ° ,               S 1 > 0     S 2 S 1
By substituting the zenith θ and azimuth angles φ of the polarized light into Equations (1) and (2), respectively, the normal n can be obtained, and the surface function of the object z ( x , y ) can be reconstructed.

3. Tunnel Lining Crack Detection Scheme

3.1. Detection Scheme

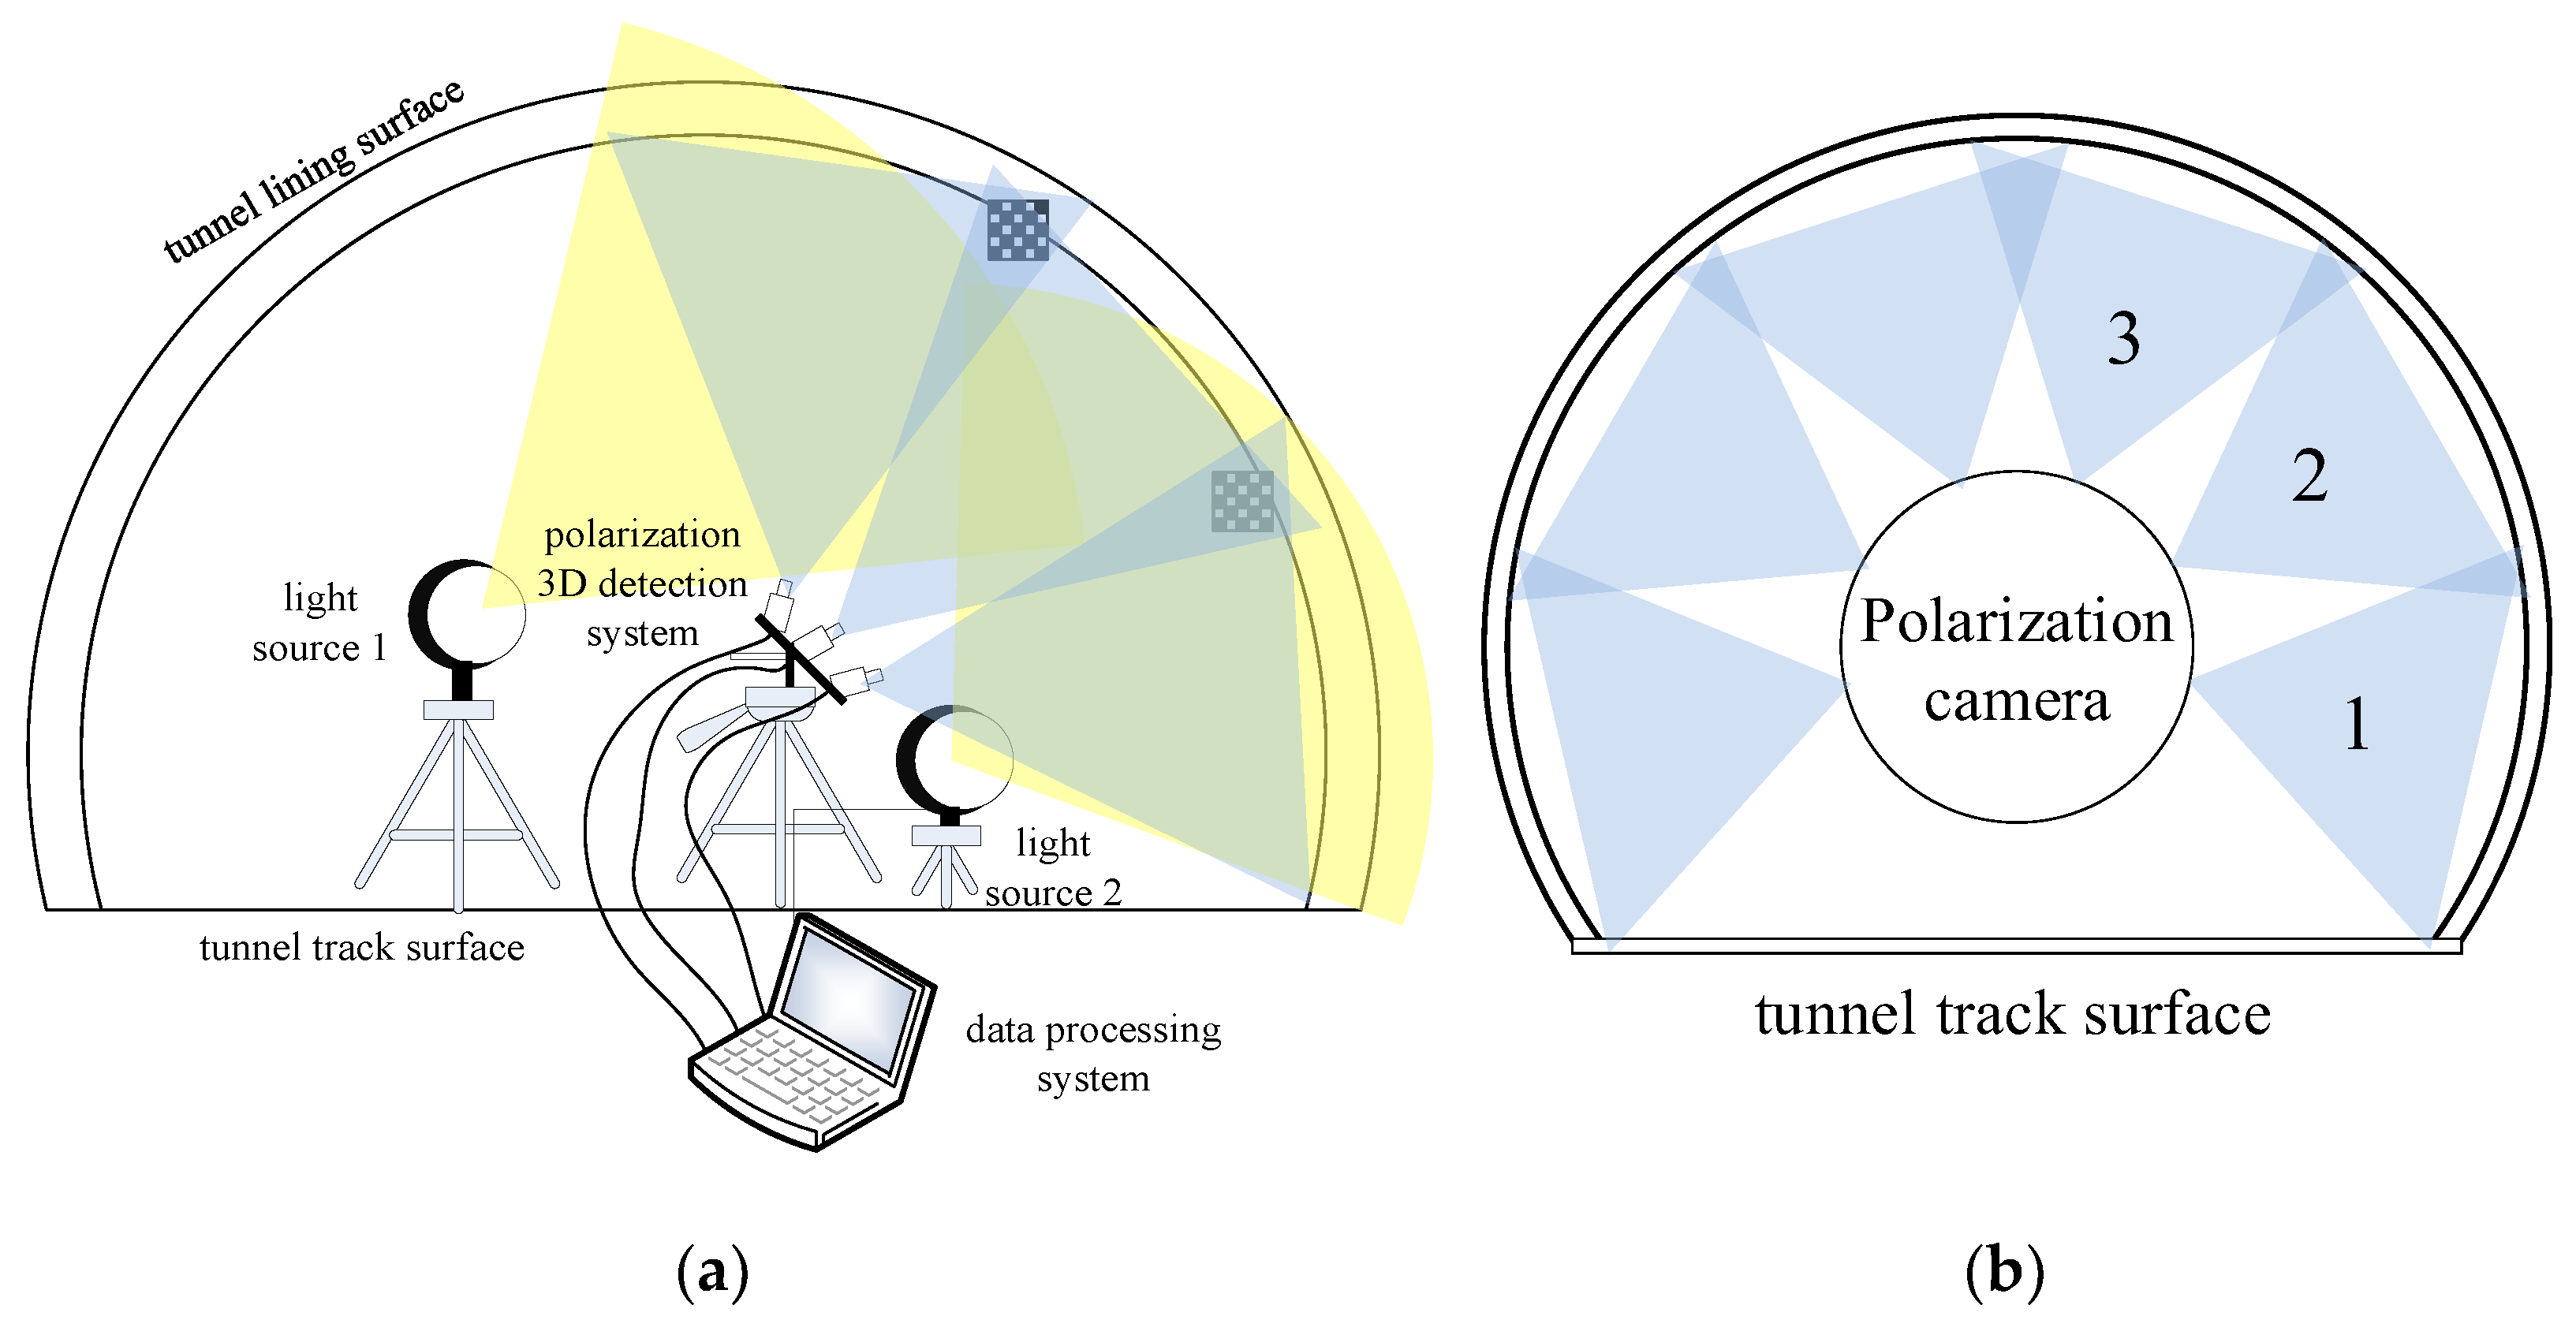
Based on polarization 3D imaging, the tunnel lining crack detection scheme is shown in Figure 3a. The detection system consists of three area-array polarization cameras, two lighting sources and one data processing system. Three area-array polarization cameras are used to simultaneously obtain images of approximately 50% of the entire tunnel section. As shown in Figure 3b, six area-array polarization cameras are required to obtain images of the entire tunnel section simultaneously [11,12]. During the experimental stage, the detection system used three area-array polarization cameras to verify the technical ability. Based on the result of crack detection for approximately 50% of the entire tunnel section, the six area-array polarization cameras can be used in the future to expand the detection to the entire tunnel section at the same time.
Two white light sources were used during the tunnel crack detection test, which was carried out during the construction period, as lighting conditions were poor in the tunnel. Light sources will not be necessary in the tunnel during an operation period with good internal lighting conditions. The lights from two white light sources were non-polarized, which had a negligible impact on the accuracy of polarization 3D inversion. A data processing system was used to process the polarized images obtained by the three area-array polarization cameras in real-time. The system calculated the 3D information of the tunnel lining cracks and output information such as the width, length, and depth of the cracks.
A test chart was arranged at the overlap of the fields of view from three area-array polarization cameras, which was used to calibrate the stitching parameters of the three cameras’ fields of view and improve the stitching precision. When the crack test in the tunnel during the operation period, the ground track, detection system, and tunnel wall are all at a constant relative distance, only one stitching calibration is needed. Using the stitching calibration results, the images obtained by three area-array polarization cameras can be polarization 3D inverted, and the 3D images can be stitched together to obtain the 3D contour information and 3D crack information of the entire tunnel section.

3.2. Instrumentation and Equipment

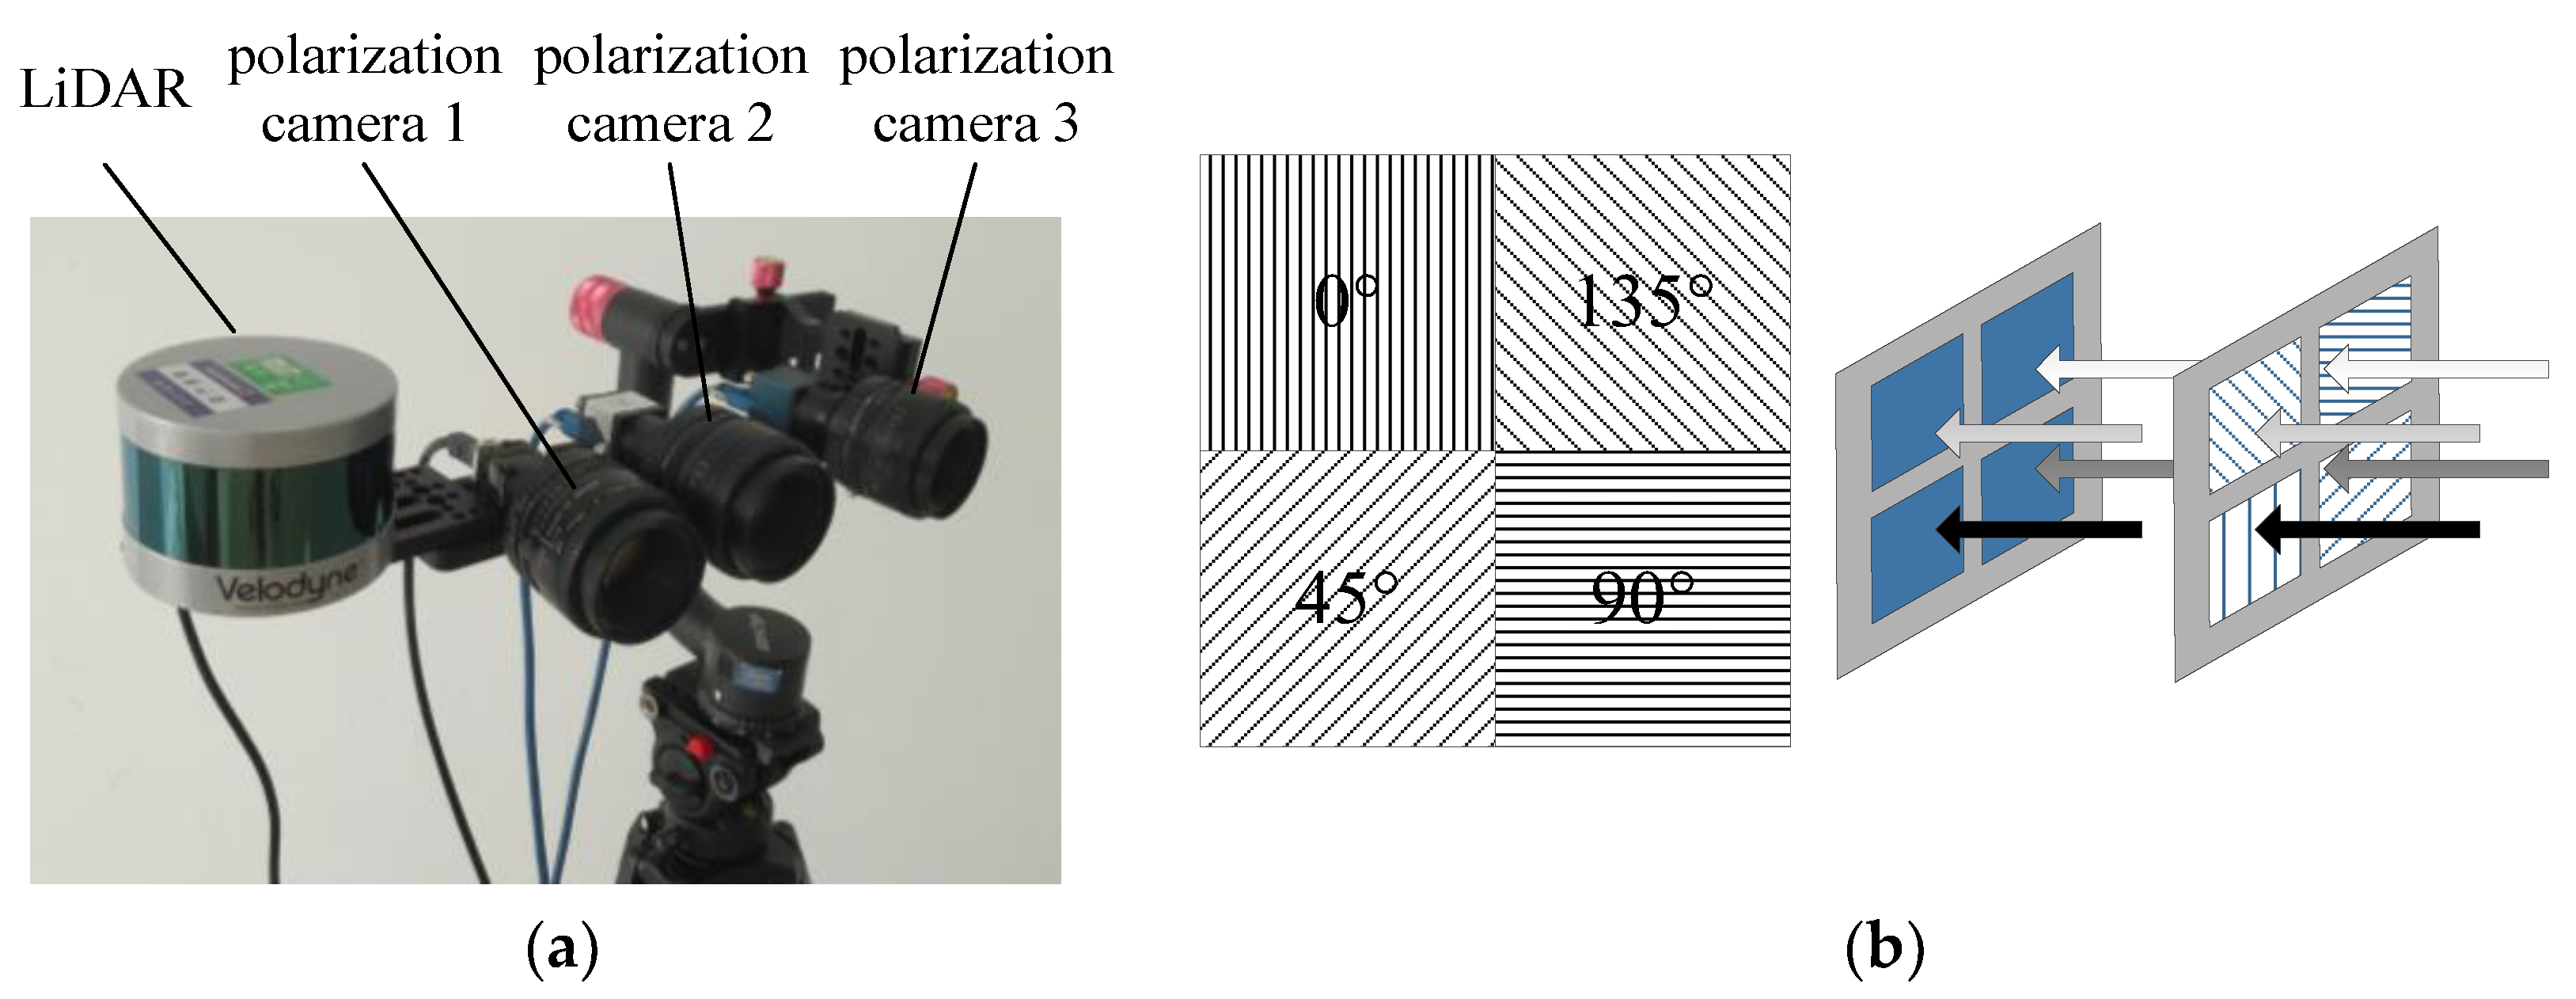
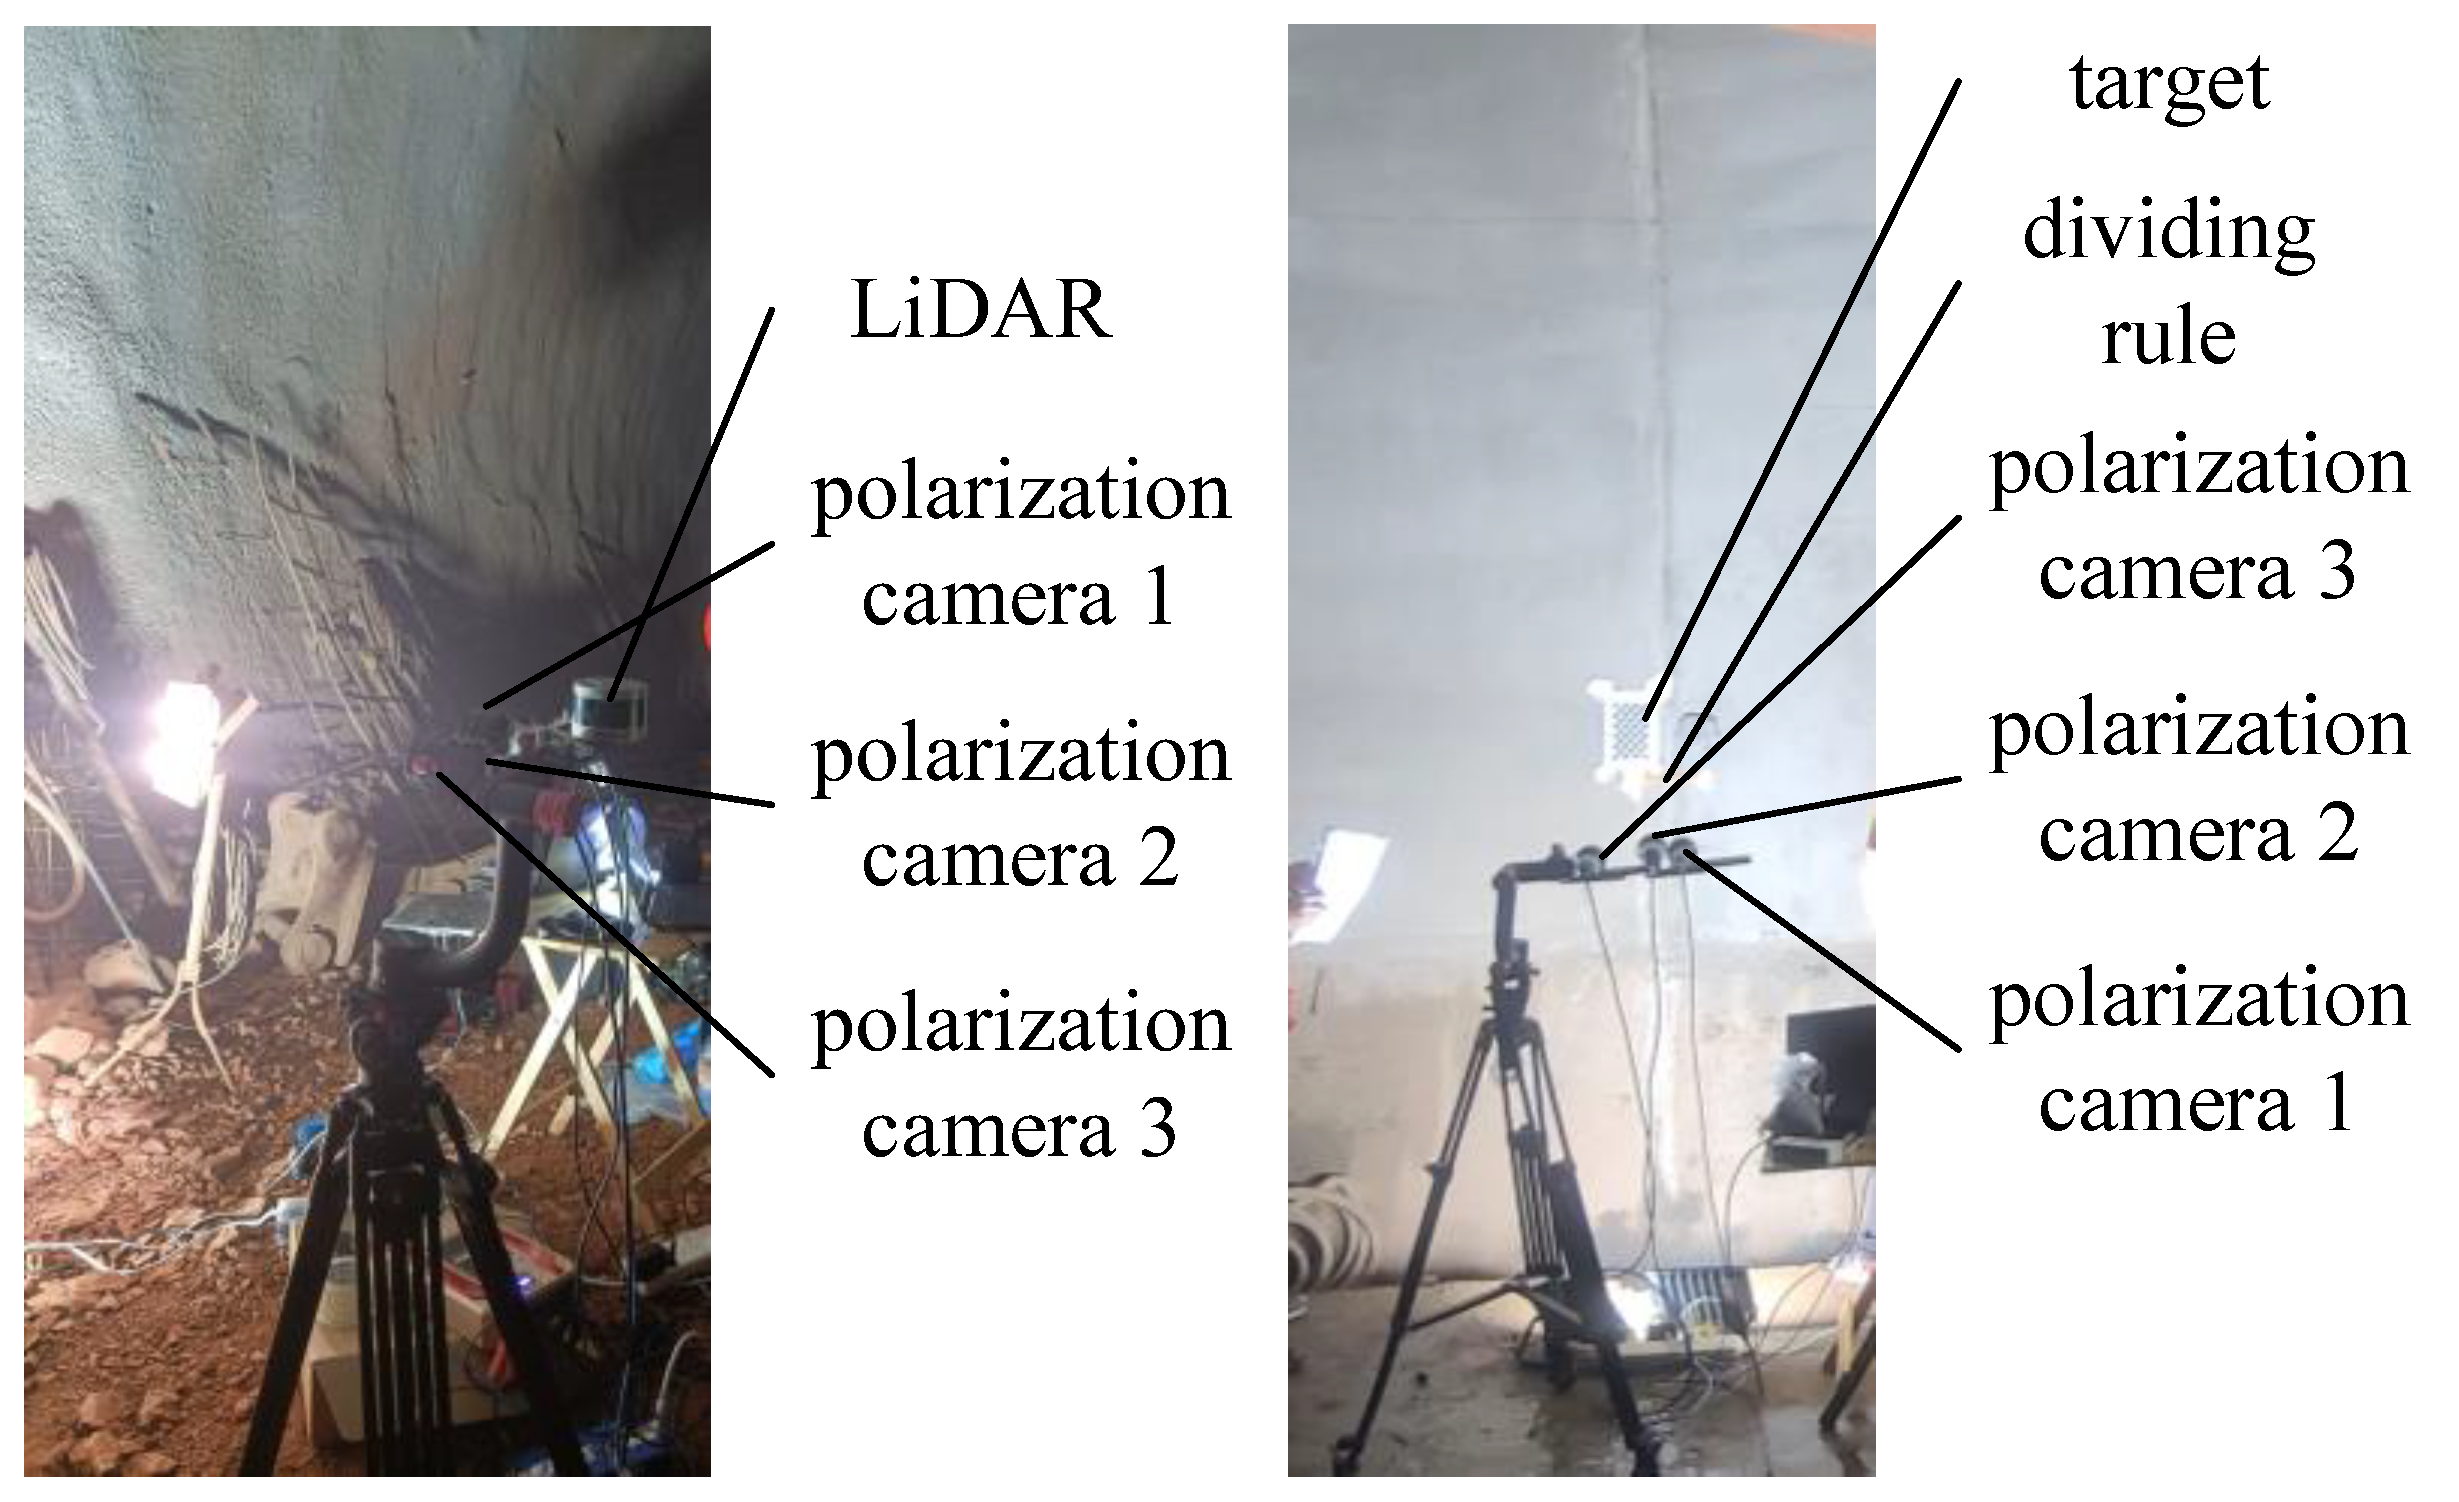
Three area-array polarization cameras are shown in Figure 4. Three area-array polarization cameras, with a pixel resolution of 2.4 K × 2 K, were arranged at a certain angle in the same horizontal plane to ensure a 5–10% overlap of the fields of view. They were used to simultaneously capture images of 50% of the tunnel section. As technology advances, a larger pixel resolution of the polarization cameras can effectively reduce the number of cameras to obtain images of the entire tunnel section. Three area-array polarization cameras were fixed on a connecting plate, which was attached to the instrument bracket. The instrument bracket can be adjusted to change the imaging angle of the cameras. The laser radar system can obtain a 3D point cloud image of the tunnel wall for the comparison with the 3D imaging results obtained by the polarization cameras. Additionally, a caliper was used to accurately measure the width of cracks in the tunnel lining at a certain position, which was used to compare with the width obtained by the polarization cameras at the same position.
The polarization camera is a focal plane polarization camera, and micro-polarized optical elements are attached directly to the focal plane array. There are four polarization directions on four adjacent pixels, 0°, 45°, 90°, and 135°. Three Stokes vectors can be obtained simultaneously, and the polarization information of incident light can be obtained in real-time.

3.3. Crack Detection Method and Process

There are many studies on crack detection based on image processing. The general method is as follows: (1) image pre-processing to enhance the contrast and clarity of the image [13,14]; (2) image enhancement [15], edge detection [16], highlighting the target area; (3) identifying cracks based on image features such as gray level, texture, and morphology [17,18]; and (4) providing feature information of the cracks. Crack recognition algorithms based on threshold segmentation, morphology, and graph search methods have been developed [19,20,21]. These methods are used to highlight crack information in two-dimensional images through processing for identification, but which cannot obtain the depth information of the cracks.
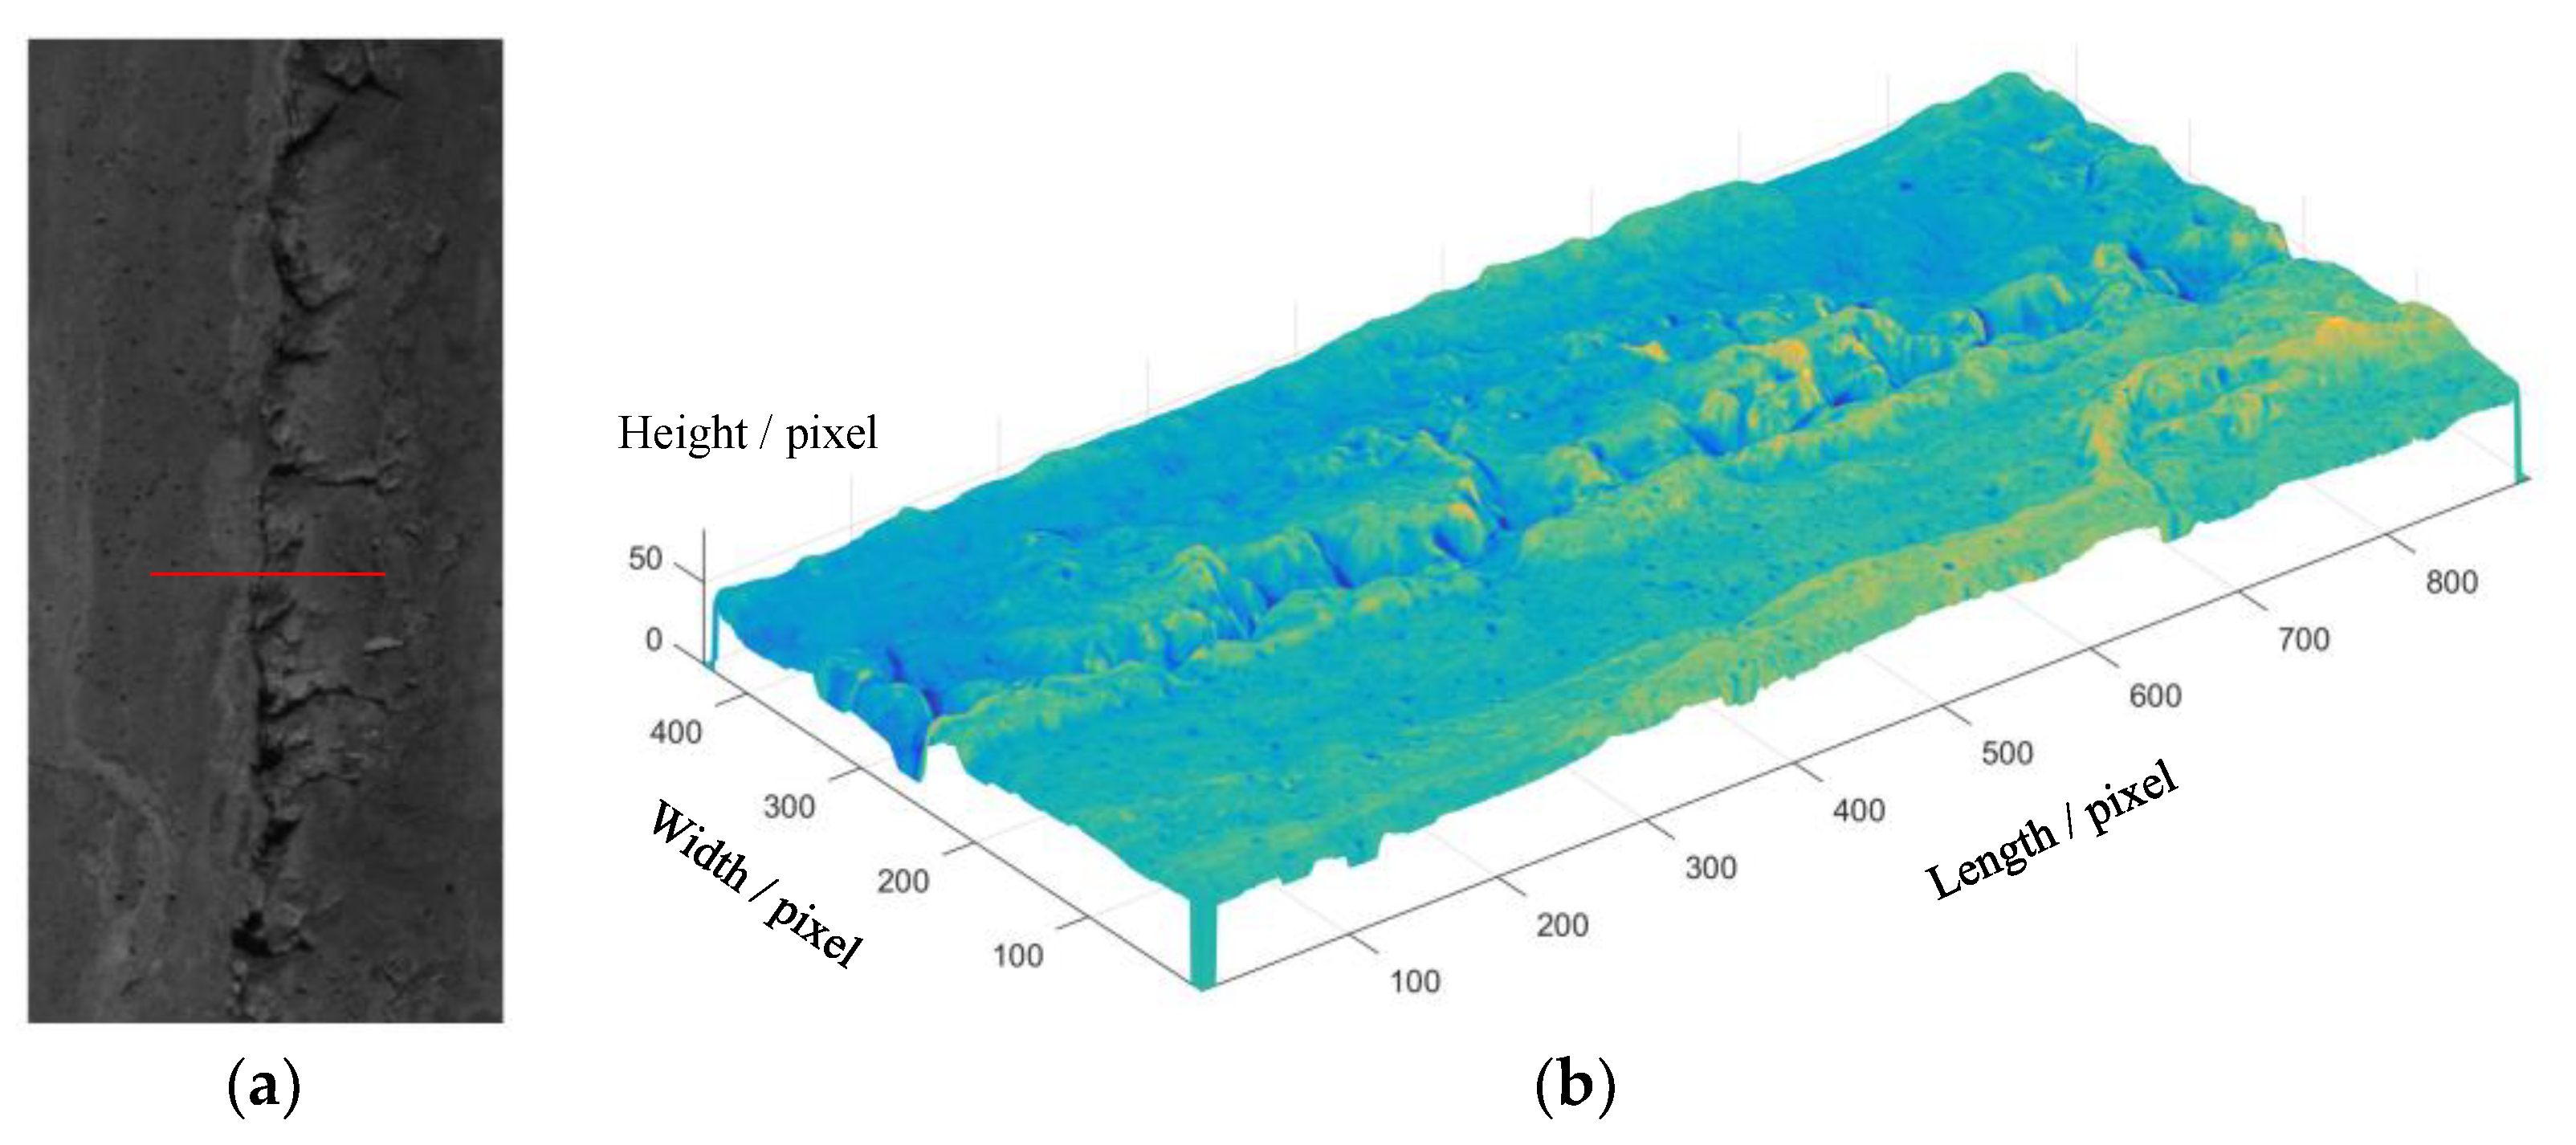
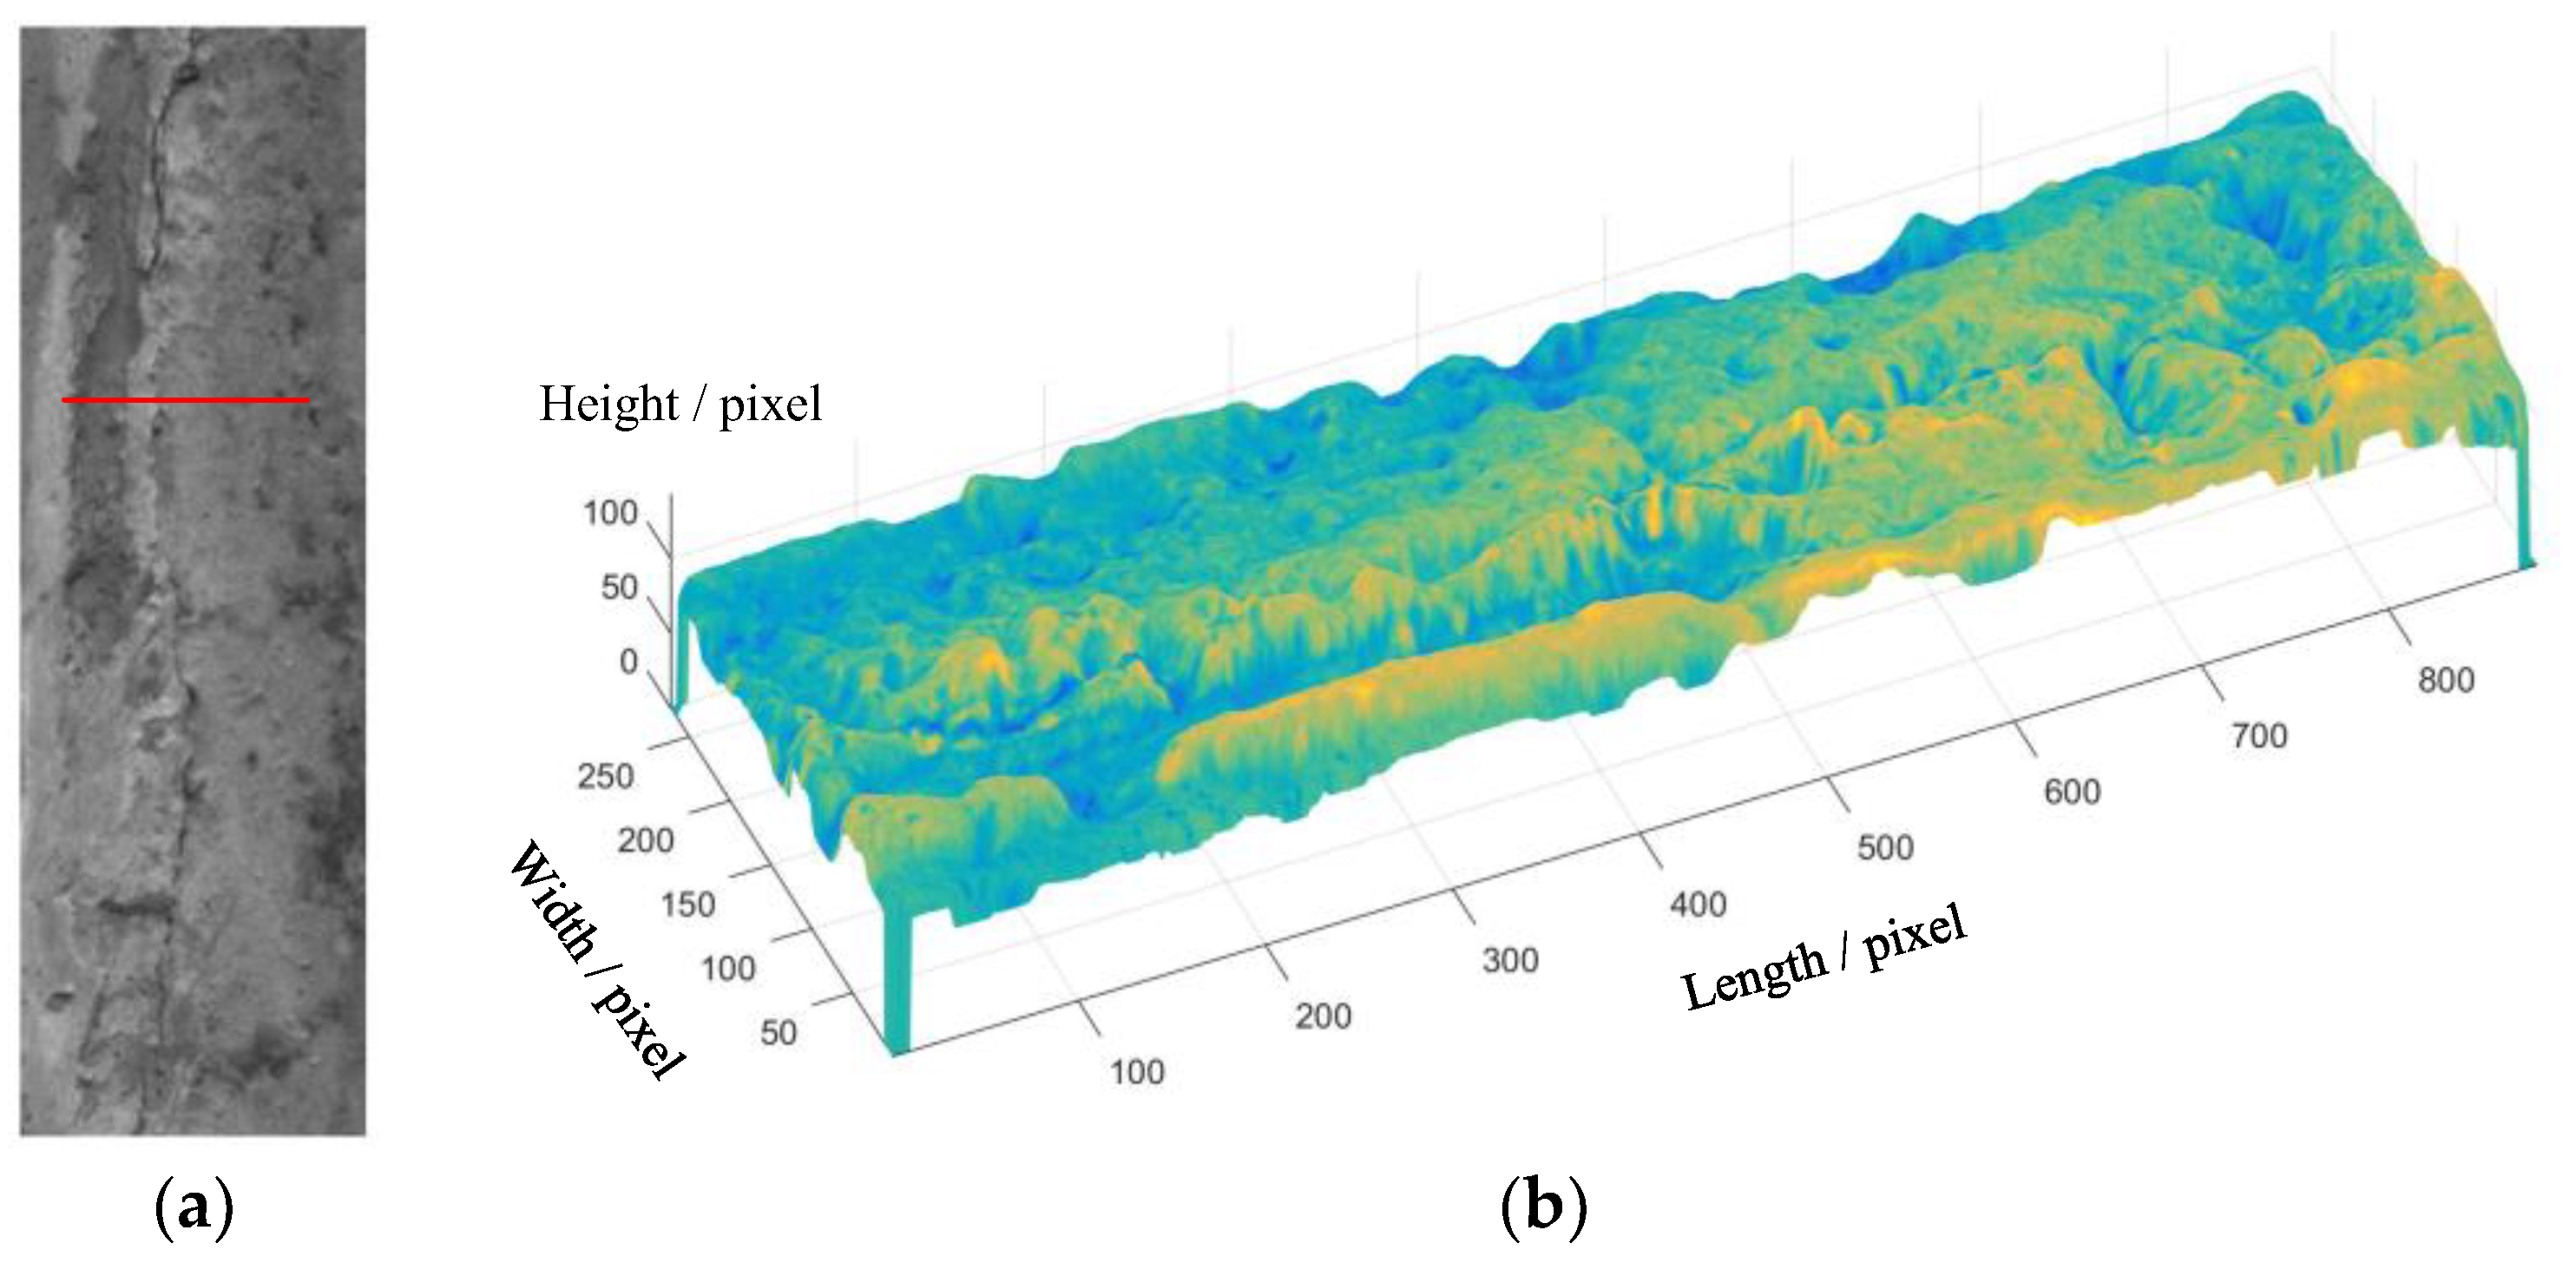
In our work, the polarization information in the tunnel lining images was used to calculate the three-dimensional information of the tunnel lining, including the depth information of the cracks. The background wall of the tunnel lining was a continuous plane, its elevation was continuous. By setting the elevation threshold, the cracks can be separated from the background wall, and the crack information can be obtained quickly and directly. The edge extraction method can be used to directly obtain feature parameters such as crack length, width, depth, position, direction, and distribution. At the same time, by using the three-dimensional image of the entire tunnel lining from multiple polarization cameras, the three-dimensional profile of the tunnel can be obtained. Compared with the design profile of the tunnel, the quantitative information of the over-excavation and under-excavation during the construction period can be obtained. This part of the work will be described in detail in subsequent papers.
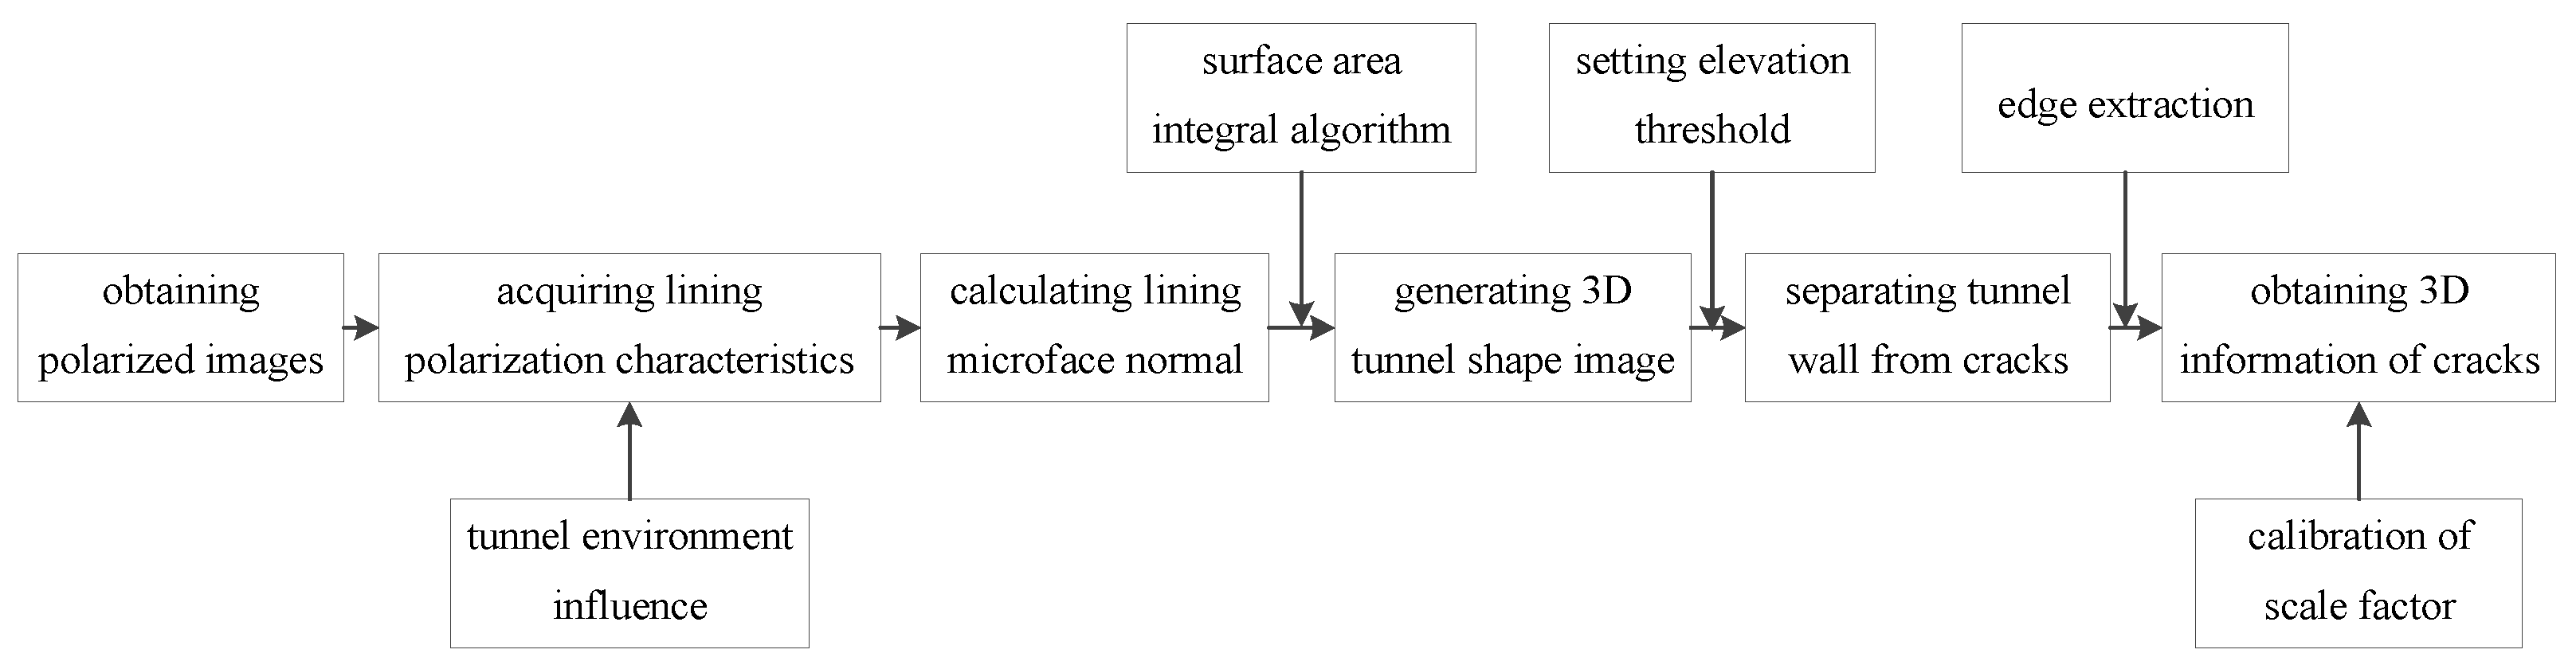
The method and process for detecting cracks in tunnel lining based on polarization 3D imaging are shown in Figure 5. Firstly, polarization cameras were used to obtain the polarization image of the tunnel lining, and the polarization characteristics of the tunnel lining were solved by the Stokes formula. Combined with the analysis results of the polarization light affecting the observed surface in the tunnel environment, the normal of the micro-surface elements was calculated using the method described in the first section. Secondly, the surface integral algorithm was used to obtain the 3D image of the tunnel lining and the 3D shape of the cracks. The elevation threshold was set to separate the background wall from the cracks, and the edge detection algorithm was used to extract the crack edges and obtain information such as crack width, depth, length, and position. By using scale factor calibration, the relative information was converted into absolute information, and the accurate 3D information of the cracks was output. The relevant details will be explained in detail in the following sections.

4. Tunnel Lining Crack Detection Scheme

4.1. Impact Analysis of Tunnel Environment on Polarization 3D Imaging

During the construction period, the tunnel environment was unfavorable, such as high humidity, dust, and poor lighting conditions. The light from the tunnel wall passed through the tunnel environment atmosphere and entered the polarization 3D cameras. The obtained polarization information was affected by the environment humidity and dust, and reduced the monitoring accuracy. Monte Carlo’s method [22,23] was used to analyze the influence of humidity and dust on polarization information to obtain the accurate polarization information of the tunnel wall and a high level of precision detection.
The polarization characteristics of the diffused reflected light from the tunnel lining are represented as S in Figure 6. The reflected light from the tunnel lining transmitted through the tunnel environment, and the polarization characteristics became S’ when the reflected light arrived at the entrance of the polarization camera. The method described below can be used to obtain the model of environmental transmission impact. At a certain location, S could be obtained through a close observation of the tunnel lining, as well as S’. S and S’ could be used to validate the environmental transmission impact model. Since the internal environment of the tunnel would not change in a short time, when observing other parts of the tunnel lining, this model could also be used to remove the influence of environmental transmission and obtain accurate polarization characteristics of the tunnel lining.
The Monte Carlo method can simulate the scattering and absorption process of each photon in atmospheric transmission, and infer their radiation intensity distribution through statistical methods. The following relationship exists throughout the scattering process:
S = R ( γ n ) M ( θ n ) R ( ϕ n ) ( γ n 1 ) M ( θ n 1 ) R ( ϕ n 1 ) R ( γ 1 ) M ( θ 1 ) R ( ϕ 1 ) S
where M is the Muller matrix, R is the rotation matrix, θ s is the scattering angle, and ϕ and ϒ are the angles from the incident Stokes vector to the scattering plane, and back to the reference plane after scattering, respectively. The rotation angle ϒ can be expressed as:
cos γ = μ z n + μ z ( n + 1 ) cos θ s n ± ( 1 cos 2 θ s n ) ( 1 μ z ( n + 1 ) 2 )
where μ z n and μ z ( n + 1 ) are the direction cosines of the photon before scattering and after scattering, respectively.
The rotation matrices R(−ϕ) and R(ϒ) can be expressed as:
R ( ϕ ) = [ 1 0 0 0 0 cos ( 2 ϕ ) sin ( 2 ϕ ) 0 0 sin ( 2 ϕ ) cos ( 2 ϕ ) 0 0 0 0 1 ]
The Mueller matrix, scattering angles θ s , and azimuth angles ϕ can be determined by the work of S. Zhang [24].
The crack detection test in a tunnel was carried out in summer, and the relative humidity in the tunnel was high. Relative humidity had a significant impact on the refractive index of aerosol particles.
Relative humidity, f, and the aerosol particle radius, r h , are related to the dry aerosol particle radius, r 0 , as shown in the following equation [24,25]:
r h = ( 1 f ) 1 / u r 0
where the u is constant, which represents the hygroscopicity of aerosol particles and varies with different types of aerosol particles.
Various particle radii also lead to change in the complex refractive index of the particles.
m r e = m r w + ( m r 0 m r w ) [ r h / r 0 ]
m i e = m i w m r w 2 + ( m i 0 m r 0 2 + 2 m i w m r w 2 ) [ r h r 0 ] 3 ( m r e 2 + 2 )
where m r e is the real part and m i e is the imaginary part of the refractive index after moisture absorption. The refractive index after moisture absorption is m e = m r e + m i e .
During the construction period, the particles in the tunnel were of the dust type, with a dry aerosol particle radius of 0.6 μm and a refractive index of m 0   = 1.53 + 0.008i. The constant u was 4.8 [24].
Based on the formula, the influence of humidity and dust on the degree of polarization and azimuth angle under different linear polarization directions was analyzed, assuming perfectly polarized light in an ideal state, as shown in Figure 7. The analysis shows that the changes in the degree of polarization and azimuth angle due to humidity in the tunnel environment were similar for different linear polarization directions. When the humidity was less than 80%, the changes were relatively small, ranging from 0.67 to 0.75 and from 0.21 to 0.25, respectively. However, when the humidity was higher than 80%, the degree of polarization and azimuth angle increased significantly, ranging from 0.75 to 0.88 and from 0.24 to 0.29, respectively. High humidity had a significant impact on the precision of polarization 3D imaging.
By imaging the tunnel wall in close, the initial Stokes vector was obtained and substituted into Equation (8) to analyze the influence of the tunnel environment on the transmission of polarized light from the tunnel wall, as shown in Figure 8. The measured humidity in the tunnel was 79%. The degree of polarization becomes 0.42 after transmission through the tunnel environment, as shown in Figure 8a. The azimuth angle became 0.22 after transmission through the tunnel environment, as shown in Figure 8b. To improve the precision of polarization 3D imaging to realize high-precision detection, the influence of the tunnel environment transmission was incorporated into the polarized characteristics of the lining obtained by the polarization cameras, and the influence of the tunnel environment transmission was removed.

4.2. Absolute Scale Factor Calibration Method

The integrated gradient information based on Equations (1) and (2) provided the relative depth in the pixel coordinate system of the tunnel lining surface [26]. Although it reflected the 3D shape of the tunnel lining surface, it could not accurately obtain the absolute depth information of the cracks. To obtain accurate absolute depth information, ultra-light clay similar in color and material to the tunnel wall was coated onto the surface of the tunnel lining, and a ping-pong ball was embedded in the clay to form a known 3D shape, with a known absolute depth and a known absolute width of a half-spherical groove, as shown in Figure 9. Then, the polarization 3D camera was used to obtain a polarization imaging of the half-spherical groove, and the 3D shape of the half-spherical groove was calculated. The calculated result was compared with the real shape of the ping-pong ball to obtain the corresponding relationship between relative depth and width, and absolute depth and width. This relationship was used to obtain accurate information with absolute depth and width.
During the operation period, cracks were observed in the tunnel, and the relative distances between the ground track, the detection system composed of polarization cameras, and the tunnel wall were constant. Therefore, a one-time absolute distance calibration was sufficient.

5. Tunnel Lining Crack Detection Results and Analysis

5.1. Field Testing for Tunnel Lining Crack Detection

The tunnel lining crack test was conducted in a tunnel during a construction period in Sichuan, as shown in Figure 10. Artificial cracks were made to simulate the detection of shallow new cracks that may exist in the tunnel during the operation period. There were relatively few cracks in the construction-period portion of the tunnel. The environment in the construction-period tunnel was poor, with high humidity, dust, and poor lighting conditions. Based on the polarization 3D imaging, the tunnel lining crack detection system could effectively detect cracks in the construction-period tunnel under poor conditions, and the effectiveness of the detection system is expected to be even better during the operation period due to better conditions.
During the tunnel lining crack detection test, test charts were used to calibrate the stitching parameters of three cameras to improve their accuracy, and a calibration scale was used to obtain the imaging resolution of the polarization 3D detection system.

5.2. Tunnel Lining Crack Test Results

5.2.1. Test Results of Wide Crack Detection in Tunnel

As shown in Figure 11a, the actual measurement of wide cracks in the tunnel was obtained. To determine the actual width value of the cracks, a scale was placed at various positions in the vertical crack direction. A caliper was also used to accurately measure the width of cracks in the tunnel lining at different locations and mark the locations, such as the red line in Figure 11a. According to the results of the scale and the caliper, the actual measured value of the crack at the position indicated by the red line was 3.8 mm.
The polarization 3D inversion result in Figure 11b showed that the width of the crack at the location of the red line was 4.0 mm, with a width error of 0.2 mm. The crack length in Figure 11a was 30.6 mm, whereas the crack length obtained by polarization 3D inversion in Figure 11b was 30.8 mm, with a length error of 0.2 mm. The polarization 3D inversion result in Figure 11b showed that the crack depth at the location of the red line was 9.2 mm. Based on the principle of polarization 3D imaging, it was known that the accuracy of the inverted crack depth was consistent with the accuracy of crack width and length. Compared to other detection methods based on camera photography, polarization 3D imaging had outstanding advantages, and it could obtain not only the width and length information of the crack, but also the depth information of the crack.

5.2.2. Test Results of Narrow Crack Detection in Tunnel

As shown in Figure 12a, the actual measurement of narrow cracks in the tunnel was obtained. To determine the actual width value of the cracks, the scale and the caliper were also placed at various positions in the vertical crack direction. According to the results of the scale and the caliper, the actual measured value of the crack at the position indicated by the red line was 1.2 mm. The polarization 3D inversion result in Figure 12b showed that the width of the crack at the location of the red line was 0.9 mm, with a width error of 0.3 mm. The crack length in Figure 12a was 25.3 mm, and the crack length obtained by polarization 3D inversion in Figure 12b was 25.1 mm, with a length error of 0.2 mm. The polarization 3D inversion result in Figure 12b showed that the crack depth at the location of the red line was 4.8 mm. If light could not reach the deepest parts of the crack, there would be no reflected light from that position, and it would be impossible to invert the depth information without reflected light. Two white light sources were used during the tunnel crack detection test, so the light can enter the crack of 0.9 mm width. But we were unable to determine whether the light reached the deepest portions of the crack or not. The 4.8 mm depth was the result obtained by polarization 3D imaging. The 4.8 mm indicates the depth that light could reach. The 4.8 mm might be or might not be the deepest position.

5.2.3. Results of Artificial Crack Detection in Tunnel

After wide crack detection and narrow crack detection, artificial crack detection was conducted to simulate the detection of new shallow cracks in the tunnel during the operation period. The actual measured image of the artificial crack in the tunnel is shown in Figure 13a. To determine the actual width value of the artificial crack, the scale and the caliper were also placed at multiple positions in the direction of the vertical crack. The actual measurement value of the artificial crack at the position indicated by the red line was 1.5 mm. The results of the polarization 3D inversion shown in Figure 13b revealed that the width of the crack at the position of the red line was 1.8 mm, with a width error of 0.3 mm. The crack length in Figure 13a was 32.7 mm, while the length obtained by polarization 3D inversion in Figure 13b was 33.0 mm, with a length error of 0.3 mm. The crack depth at the position of the red line obtained by polarization 3D inversion in Figure 13b was 0.2 mm. If light could not reach the deepest parts of the crack, there would be no reflected light from that position, and it would be impossible to invert the depth information without reflected light.

6. Conclusions

Based on the polarization 3D imaging technology for the detection of cracks in tunnel lining, passive area-array polarization cameras were used to obtain tunnel lining images, and the polarization information was used to reconstruct the 3D structure of the tunnel wall. This allowed for the quick extraction of cracks with different depths from the background structure of the tunnel, and for obtaining 3D information about the cracks. It can effectively compensate for the drawbacks of the laser scanning method, which has a high power consumption and produces discontinuous 3D point cloud images. It also effectively compensates for the drawbacks of the camera photography detection method, which has a complex crack detection process. Based on the principle of the polarization 3D detection of cracks in tunnel lining, our work designed a scheme to detect the tunnel cross-section using three array polarization cameras and developed a polarization 3D detection system. We established a crack detection method for tunnel lining based on the real environment conditions of the tunnel. A model for the influence of the tunnel environment on polarized light transmission was established to address the impact of polarization imaging in complex environments such as strong local light, high humidity, and dust during the construction period of tunnels. A quantitative analysis of the impact of a tunnel’s environment on polarization 3D imaging was conducted to obtain accurate information on tunnel lining crack detection and achieve high-precision detection. Tests were carried out in the tunnel during the construction period to detect wide cracks, narrow cracks, and artificial cracks. The crack width detection errors were 0.2 mm, 0.3 mm, and 0.3 mm, respectively. The crack length detection errors were 0.2 mm, 0.2 mm, and 0.3 mm, respectively, and the crack depth detection errors were the same as the width and length detection errors, which met the requirements of tunnel crack detection. Based on the principle of polarization 3D imaging, it can be inferred that the precision of the inverted crack depth is consistent with the precision of the crack width and length. In subsequent research, the precision of obtaining 3D data of tunnel cracks by polarization 3D imaging will be improved, and a 3D profile information on the tunnel section will be constructed.

Author Contributions

Conceptualization Y.Z. and Y.S.; methodology Y.Z. and X.Z.; software, X.L.; validation Y.Z., X.Z. and Y.S.; formal analysis Y.Z.; investigation Y.Z., X.Z. and Y.S.; resources, Y.Z.; data curation S.Z., W.R. and K.L.; writing—original draft preparation, Y.Z.; writing—review and-editing Y.Z.; visualization Y.Z.; supervision Y.Z.; project administration X.Z.; funding acquisition S.M. All authors have read and agreed to the published version of the manuscript.

Funding

This research received no external funding.

Institutional Review Board Statement

Not applicable.

Informed Consent Statement

Not applicable.

Data Availability Statement

The data that support the findings of this study are available from the corresponding author, Y.Z., upon reasonable request.

Conflicts of Interest

The authors declare no conflict of interest.

References

  1. Sheerin, S.N.; Kavitha, S.; Raghuraman, G. Review and analysis of crack detection and classification techniques based on crack types. Int. J. Appl. Eng. Res. 2021, 13, 6056–6062. [Google Scholar]
  2. Chen, X.S.; Xu, Z.H.; Bao, X.H. Overview of research on tunnel defects monitoring and detection technology. Hazard Control Tunn. Undergr. Eng. 2020, 2, 1–12. [Google Scholar]
  3. Wang, S.L.; Gao, Y.; Qi, F.L.; Ke, Z.T.; Li, H.Y.; Lei, Y.; Peng, Z. Review on inspection technology of railway operation tunnels. J. Traffic Transp. Eng. 2020, 20, 40–57. [Google Scholar]
  4. Gong, Y.F.; Xiao, M.Q.; Wang, S.F.; Tang, Z. Review and developing trend of railway tunnel detection technology. Railw. Stand. Des. 2019, 63, 93–98. [Google Scholar]
  5. Xue, C.M. Research statuf and technical analysis of tunnel intelligent detection technolgoy based on machine vision. Shanxi Sci. Technol. Commun. 2019, 6, 66–68. [Google Scholar]
  6. Liu, X.R. Tunnel Crack Imaging Acquisition and Detection Technology; Beijing Jiaotong University: Beijing, China, 2019. [Google Scholar]
  7. Yang, J.; Liu, X.; Liu, X.; Zhang, P.; Peng, F. Review of Rapid Test Vehicles for Highway Tunnel Structure. J. East China Jiaotong Univ. 2018, 4, 30–38. [Google Scholar]
  8. Atkinson, G.A.; Hancock, E.R. Recovery of surface orientation from diffuse polarization. IEEE Trans. Image Process. 2006, 15, 1653–1664. [Google Scholar] [CrossRef]
  9. Wolff, L.B. Surface orientation from polarization images. In SPIE Optics, Illumination, and Image Sensing for Machine Vision II; SPIE: Bellingham, WA, USA, 1987; Volume 850, pp. 110–121. [Google Scholar]
  10. Zhang, Y.; Zhang, X.M.; Liu, Y.; Li, X.; Zhang, S.; Yu, Y.; Jiao, J.C.; Su, Y. Calibration method of relative linear deviation angle of polarization three-dimensional imager. J. Infrared Millim. Waves 2022, 41, 1062–1071. [Google Scholar]
  11. Li, J.C.; Zhang, C.B.; Chai, X.S.; Xue, F. Reseach on crack detection system of tunnel lining based on image recognition technology. J. Zhejiang Univ. (Eng. Sci.) 2018, 58, 20–24. [Google Scholar]
  12. Song, Q.; Wu, Y.Q.; Xin, X.S.; Yang, L.; Yang, M.; Chen, H.M.; Liu, C.; Hu, M.J.; Chai, X.S.; Li, J.C. Real-time tunnel crack analysis system via deep learning. IEEE Access 2019, 7, 64186–64197. [Google Scholar] [CrossRef]
  13. Wang, J.F.; Qiu, Y.; Liu, S.Z. Tunnel lining crack detection method based on image compensation. J. Zhejiang Univ. (Eng. Sci.) 2022, 56, 1404–1415. [Google Scholar]
  14. Qiu, Y. Research on Error Compensation Technology of Tunnel Inspection Vehicle Image Inspection System; Chang’an University: Xi’an, China, 2021. [Google Scholar]
  15. Zhang, W.; Zhang, Z.; Qi, D. Automatic crack detection and classification method of subway tunnel safety monitoring. Sensors 2014, 14, 19307–19328. [Google Scholar] [CrossRef] [PubMed]
  16. Li, C.; Xu, P.; Niu, L.; Sheng, Y.; Liu, L.S.; Cun, M. Tunnel crack detection using coarse-to-fine region localization and edge detection. WIREs Data Min. Knowl. Discov. 2019, 9, e1308. [Google Scholar] [CrossRef]
  17. Zhu, L.Q.; Bai, B.; Wang, Y.D.; Yu, Z.J.; Guo, B.Q. Subway tunnel crack identification algorithm based on feature analysis. Chin. J. Sci. Instrum. 2015, 37, 64–70. [Google Scholar]
  18. Yin, G.S.; Gao, J.G.; Shi, M.H.; Jin, M.Z.; Tuo, H.L.; Li, C.; Zhang, B. Tunnel crack recognition method under image block. J. Traffic Transp. Eng. 2022, 22, 148–159. [Google Scholar]
  19. Dang, L.M.; Wang, H.X.; Li, Y.F.; Park, Y.; Oh, C.M.; Nguyen, T.N.; Moon, H. Automatic tunnel lining crack evaluation and measurement using deep learning. Tunn. Undergr. Space Technol. 2022, 124, 104472. [Google Scholar] [CrossRef]
  20. Zhou, Z.; Zhang, J.J.; Gong, C.J.; Wu, W. Automatic tunnel lining crack detection vis deep learning with generative adversarial network-based data augmentation. Undergr. Space 2021, 9, 140–154. [Google Scholar] [CrossRef]
  21. Li, G.; Ma, B.; He, S.H.; Ren, X.L.; Liu, Q.W. Automation tunnel crack detection based on U-net and a convolutional neural network with alternately updated clique. Sensors 2020, 20, 717. [Google Scholar] [CrossRef]
  22. Min, X. Electric Monte Carlo simulation of polarized light propagation in turbid media. Opt. Express 2004, 12, 6350–6539. [Google Scholar]
  23. Jessica, C.R.; Scott, A.P.; Steve, L.J. Three Monte Carlo programs of polarized light transpaort into scattering media: Part I. Opt. Express 2005, 13, 4420–4438. [Google Scholar]
  24. Zhang, S.; Fu, Q.; Duan, J.; Zhan, J.T. Research of influence of humidity on transmission characteristics of ploarized light. Infrared Laser Eng. 2016, 45, 0511001. [Google Scholar] [CrossRef]
  25. Cai, J.; Gao, J.; Fan, Z.G.; Feng, S.; Fang, J. The polarization characteristics research of aerosol particles under the humidity influence. Chin. J. Lumin. 2013, 34, 639–644. [Google Scholar]
  26. Ping, X.X.; Liu, Y.; Dong, X.M.; Zhao, Y.Q.; Zhang, Y. 3D reconstruction of textrueless and high reflective target by polarization and binocular stereo vision. J. Infrared Millim. Waves 2017, 36, 432–438. [Google Scholar]
Figure 1. Schematic diagram of normal measurement on the surface of object.
Photonics 10 01085 g001
Figure 2. Polar coordinates of the normal n on the surface of object.
Photonics 10 01085 g002
Figure 3. (a) Detection scheme of tunnel lining crack with plane array polarization cameras. (b) Placement of polarization cameras for detecting the entire tunnel section.
Photonics 10 01085 g003
Figure 4. (a) Polarization 3D imaging system used in tunnel lining crack detection. (b) Schematic of focal plane array in polarization camera.
Photonics 10 01085 g004
Figure 5. Method and process of tunnel lining cracks based on polarization 3D imaging.
Photonics 10 01085 g005
Figure 6. Schematic diagram of crack detection in a tunnel environment.
Photonics 10 01085 g006
Figure 7. The influence of relative humidity on the degree of polarization (a) and polarization azimuth angle (b) under different polarization directions.
Photonics 10 01085 g007
Figure 8. Through tunnel environment transmission, the degree of polarization entering the polarization camera (a) and azimuth angle entering the polarization camera (b).
Photonics 10 01085 g008
Figure 9. (a) A hemispherical groove formed by embedding a ping-pong ball into ultra-light clay. (b) Polarization 3D inversion result of hemispherical grooves.
Photonics 10 01085 g009
Figure 10. Tunnel lining crack detection system in tunnel.
Photonics 10 01085 g010
Figure 11. (a) Actual measurement images of a wide crack in tunnel lining. (b) Polarization 3D inversion result of wide crack.
Photonics 10 01085 g011
Figure 12. (a) Actual measurement images of a narrow crack in tunnel lining. (b) Polarization 3D inversion result of narrow crack.
Photonics 10 01085 g012
Figure 13. (a) Actual measurement images of an artificial scratch in tunnel lining. (b) Polarization 3D inversion result of artificial crack.
Photonics 10 01085 g013
Disclaimer/Publisher’s Note: The statements, opinions and data contained in all publications are solely those of the individual author(s) and contributor(s) and not of MDPI and/or the editor(s). MDPI and/or the editor(s) disclaim responsibility for any injury to people or property resulting from any ideas, methods, instructions or products referred to in the content.

