Article

TiN/Ti3C2 Heterojunction Microfiber-Enhanced Four-Wave Mixing-Based All-Optical Wavelength Converter

Institute of Translational Medicine, First Affiliated Hospital (Shenzhen Second People’s Hospital), Health Science Center, College of Electronics and Information Engineering, Shenzhen University, Shenzhen 518060, China
*
Authors to whom correspondence should be addressed.
Photonics 2023, 10(10), 1066; https://doi.org/10.3390/photonics10101066
Submission received: 25 August 2023 / Revised: 19 September 2023 / Accepted: 19 September 2023 / Published: 22 September 2023
(This article belongs to the Special Issue Novel Two-Dimensional Materials Based on Nonlinear Photonics)

Abstract

:
As a novel nanomaterial, the TiN/Ti3C2 heterojunction has been demonstrated to possess exceptional optoelectronic properties, offering significant potential for applications in fields such as communication, optical sensors, and image processing. The rapid evolution of the internet demands higher communication capacity and information processing speed. In this context, all-optical wavelength conversion, a pivotal technique in all-optical signal processing, holds paramount importance in overcoming electronic bottlenecks, enhancing wavelength utilization, resolving wavelength competition, and mitigating network congestion. Utilizing the idle light generated through the four-wave mixing (FWM) process accurately mimics the bit patterns of signal channels. This process is inherently rapid and theoretically capable of surpassing electronic bottlenecks with ease. By placing an optical filter at the fiber output end to allow idle light passage while blocking pump and signal light, the output becomes a wavelength-converted replica of the original bitstream. It has been verified that TiN/Ti3C2 heterojunction-coated microfiber (THM) exhibits outstanding third-order nonlinear coefficients. Building upon this, we achieved a THM-enhanced FWM all-optical wavelength converter, resulting in a ~4.48 dB improvement in conversion efficiency. Compared to conventional high-nonlinear fibers, this compact device significantly reduces fiber length and can be easily integrated into current high-speed optical communication networks. It demonstrates broad prospects in the realms of all-optical signal processing, robotic applications, ultra-high-speed communication, and beyond.

1. Introduction

In optical networks utilizing wavelength-division multiplexing (WDM) channels, where switching is based on their respective carrier wavelengths, there is a need for devices that can alter the carrier wavelength of a channel without affecting its bit pattern. Such devices are known as wavelength converters. All-optical wavelength conversion, a pivotal technology in all-optical signal processing, holds significant importance in overcoming electronic bottlenecks, enhancing wavelength utilization, addressing wavelength contention, and mitigating network congestion [1]. Various full-optical wavelength converters based on optical fibers and semiconductor materials have been developed, with a particular interest in wavelength converters based on four-wave mixing (FWM) [2,3,4]. This FWM-based wavelength conversion produces idler photons that accurately mimic the bit pattern of the signal channel, as the FWM only occurs during time slots allocated to “1” bits. During “0” bit periods, no idler photons are generated since the simultaneous presence of pump and signal photons is necessary for FWM to occur. Consequently, placing an optical filter at the fiber output end, which allows idler photons to pass while blocking pump and signal photons, results in a wavelength-converted copy of the original bit stream. For a considerable period, efficient FWM required meters of highly nonlinear optical fiber [5,6,7]. However, since the emergence of graphene, its linear band structure permits interband optical transitions at all photon energies, endowing graphene with substantial third-order nonlinearity [8]. By combining graphene with microfibers, the creation of short-fiber-based wavelength converters became viable. In 2014, Wu et al. demonstrated through experimentation that a 2 μm microfiber attached to a graphene membrane can achieve effective FWM and wavelength conversion [9].
The emergence of graphene has spurred the extensive exploration of new materials in the field of optoelectronics, including transition metal oxides, topological insulators, black phosphorus, and dichalcogenides [10,11,12,13,14,15,16,17,18,19]. In 2015, Song et al. achieved all-optical wavelength conversion in the communication band using a microfiber coated with a few-layer topological insulator [20]. In 2017, Zheng et al. employed black phosphorus-coated microfibers to realize an all-optical Kerr switch and an FWM-based wavelength converter with a maximum conversion efficiency of −59.15 dB [21]. In the same year, Wang et al. achieved a full-optical Kerr switch with a 20 dB extinction ratio and a wavelength converter with a conversion efficiency of −40 dB, both utilizing black phosphorus quantum dots deposited on microfibers [22]. In 2020, Zuo et al. directly grew molybdenum disulfide on fiber surfaces using chemical vapor deposition, achieving a mode-locked laser with an ultrashort pulse width [17]. These advancements have opened avenues for novel optical functionalities and signal-processing capabilities, all stemming from the development and utilization of new materials in the photonic domain.
While these materials exhibit remarkable optoelectronic characteristics, they are also accompanied by certain notable issues that cannot be overlooked. For instance, graphene has a low damage threshold and relatively weak absorption. Transition metal dichalcogenides (TMDs) possess a wide bandgap, with their optical response primarily occurring within the visible light range. Black phosphorus boasts a strong third-order nonlinear coefficient but is highly susceptible to oxidation and degradation. The carrier mobility of molybdenum disulfide is vulnerable to the influence of charged particles. All these challenges significantly constrain the application of these materials in the field of optoelectronics [23,24,25]. Hence, researchers continue to seek other suitable optoelectronic materials. Throughout the validation process of various materials, the TiN/Ti3C2 heterojunction has garnered attention due to its exceptional optoelectronic properties. In previous research, we conducted a comprehensive characterization of this material, revealing its high responsiveness within the communication band with a bandgap value of 0.87 eV. We also demonstrated its application in an all-optical Kerr switch for the first time, confirming its high third-order nonlinearity and potential for realizing all-optical wavelength converters [26]. In this study, we successfully achieved enhanced FWM through THM, leading to a 4.46 dB increase in wavelength conversion efficiency. Additionally, we accomplished all-optical wavelength conversion at 10 GHz within the communication band.

2. Materials and Methods

2.1. Materials Characterization and Preparation of TiN/Ti3C2 Heterojunction-Coated Microfiber

In our previous work, we demonstrated the preparation methods of TiN/Ti3C2 heterojunctions and conducted a series of characterizations of TiN/Ti3C2 heterojunctions [23]. Image analysis of the heterostructure material demonstrated outstanding performance in terms of uniformity, purity, and stability. The optical–thermal behavior of the heterostructure under near-infrared (1064 nm) laser irradiation was examined, revealing its efficient response to light within the communication wavelength range. Finally, UV–vis diffuse reflectance spectroscopy (DRS) tests were conducted to assess the bandgaps of these two materials, yielding bandgap values of 0.87 eV for both TiN and Ti3C2.
A microfiber with a diameter of 6.4 μm was prepared through the process of fused biconical taper. When the diameter of a microfiber is less than 6μm, it is highly susceptible to high-temperature melting due to the photothermal effect. Conversely, if the diameter of the microfiber is too large, the interaction between the laser and the material weakens, leading to a reduction in the device’s nonlinear coefficient. After extensive testing, we have found that microfiber with a diameter of 6 μm performs optimally in terms of loss, the control of optical thermal effects, nonlinear effects, and other parameters. Subsequently, TiN/Ti3C2 heterojunction micro-particles were deposited onto the surface of the microfiber using the optical deposition method. To ensure that the deposition-induced loss remained below 3 dB, constant attention was paid to the variations in the output light’s power. The composite structure’s image under a microscope is shown in Figure 1. From the microscopic images, it can be observed that the material particles are uniformly adsorbed on the surface of the semi-transparent microfiber, as indicated by the black areas in Figure 1.

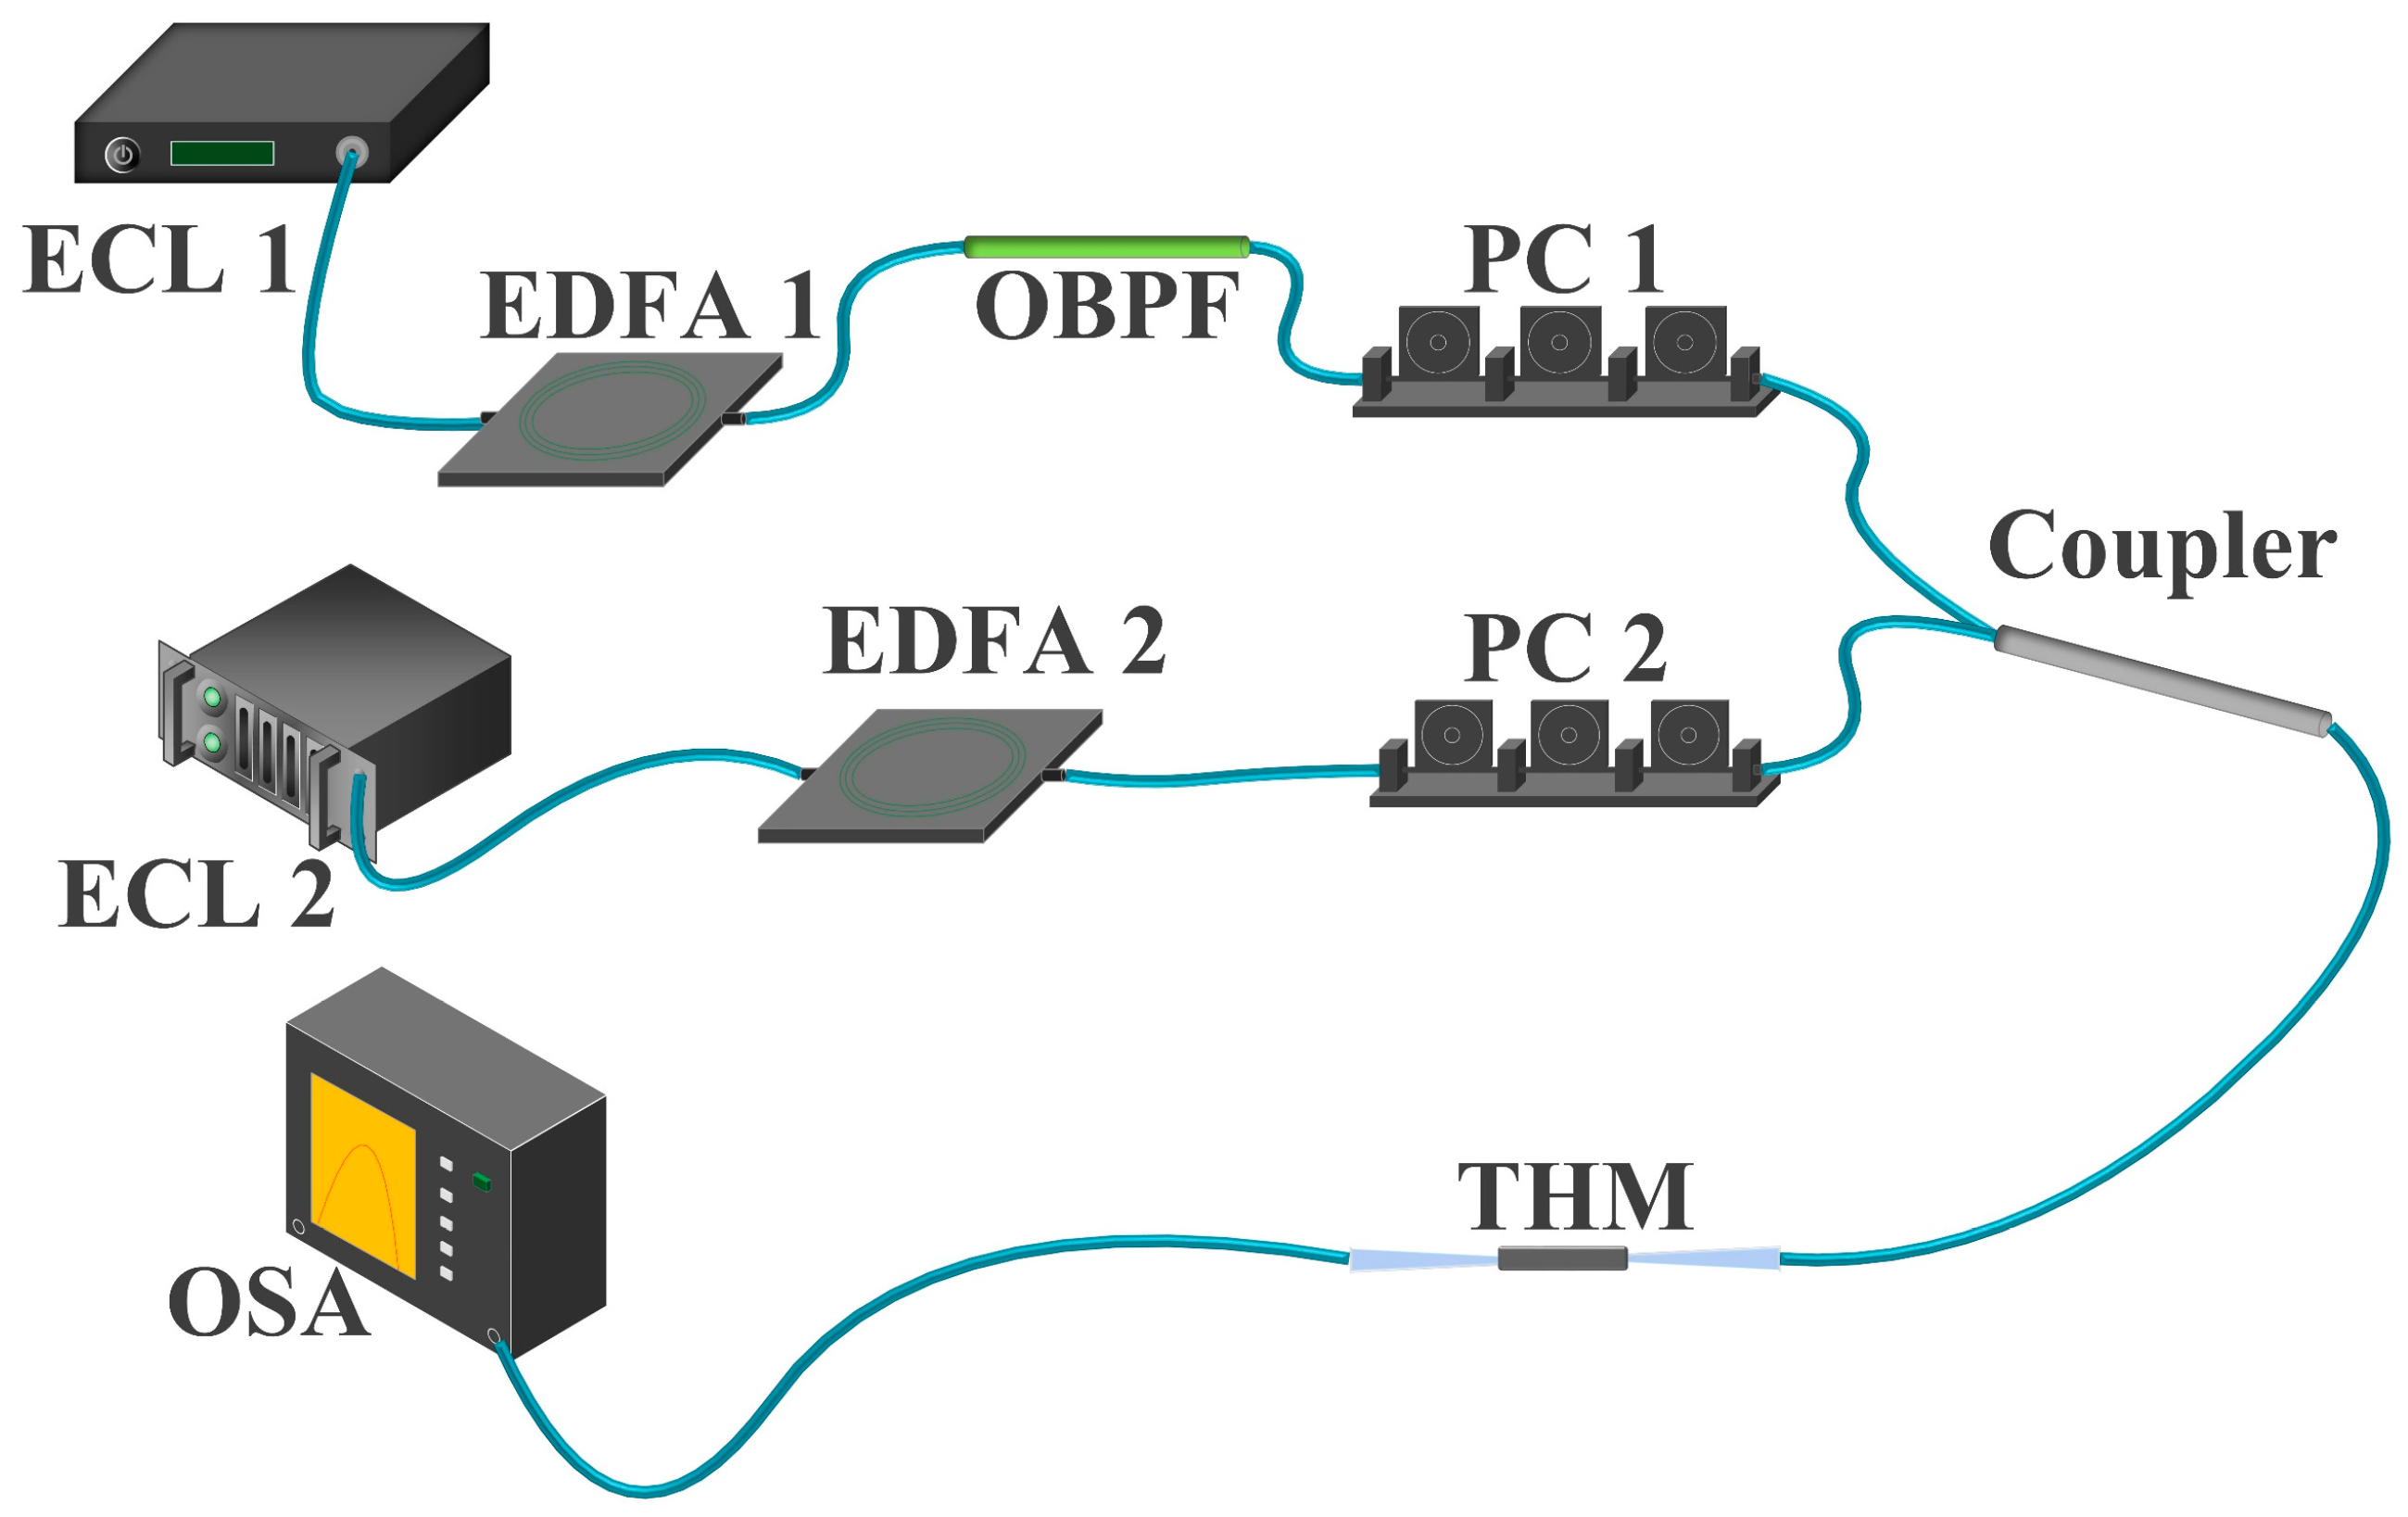
2.2. Principle of FWM All-Optical Wavelength Converter

If the bound electrons in the medium exhibit nonlinear responses to the electromagnetic field, this gives rise to the phenomenon of FWM. This nonlinear response is closely related to the non-harmonic motion of the electrons at this juncture, resulting in a nonlinear total induced polarization strength P in response to the electric field E . This is characterized by inducing dipole moments, and it conforms to the following equation.
P = ε 0 ( χ ( 1 ) · E + χ ( 2 ) : E E + χ ( 3 ) E E E + )
where ε 0 is the permittivity constant (under vacuum conditions), χ ( j ) ( j = 1 , 2 , ) represents the jth-order polarization susceptibility, and χ ( j ) is typically a tensor of order j + 1.
The primary characteristics of FWM can be understood from the third-order polarization term in the following equation.
P N L = ε 0 χ ( 3 ) E E E
where E is the electric field intensity, and P N L represents the induced nonlinear polarization strength.
FWM is polarization-dependent. Initially, let us consider a scenario where all four optical fields are polarized along a certain principal axis of birefringent optical fiber. This scenario represents a scalar case, where the polarization state can be maintained. This approach offers a comprehensive physical depiction. Considering oscillation frequencies as ω 1 , ω 2 , ω 3 , and ω 4 , and polarizing the four successive light waves along the same x-axis direction, the total electric field can be expressed as follows:
E = 1 2 x ^ j = 1 4 E j e x p [ i ( β j z ω j t ) ] + c . c .
the propagation constant is defined as β j = n j ω j / c , where n j is the modal refractive index. Substituting Equation (3) into Equation (2), expressing P N L in the same form as E , yields the following.
P N L = 1 2 x ^ j = 1 4 P j e x p [ i ( β j z ω j t ) ] + c . c .
It can be observed that P j   ( j = 1 ~ 4 ) is composed of numerous terms containing the product of three electric fields. For instance, P 4 can be represented as follows:
P 4 = 3 ε 0 4 χ χ χ χ χ ( 3 ) [ | E 4 | 2 E 4 + 2 ( | E 1 | 2 + | E 2 | 2 + | E 3 | 2 ) E 4 + 2 E 1 E 2 E 3 e x p ( i θ + ) + 2 E 1 E 2 E 3 * e x p ( i θ ) + ]
In Equation, θ_+ and θ_− are defined as follows:
θ + = ( β 1 + β 2 + β 3 β 4 ) z ( ω 1 + ω 2 + ω 3 ω 4 ) t
θ = ( β 1 + β 2 β 3 β 4 ) z ( ω 1 + ω 2 ω 3 ω 4 ) t
The phase mismatch between E 4 and P 4 , governed by θ + and θ (or similar quantities), determines the number of effective terms in the FWM process. When the phase mismatch of the aforementioned pair approaches zero, significant FWM occurs. In such cases, frequency and wavevector matching (also known as phase matching) becomes crucial. During the annihilation of one or more photon(s) from the light waves, multiple new photons are generated with distinct frequencies. As both kinetic and net energy are conserved, this engenders the onset of the FWM process.
In Equation (5), there are two categories of FWM terms. The terms containing θ + correspond to the scenario where three photons transfer energy to a new photon at a frequency of ω 4 = ω 1 + ω 2 + ω 3 . This term is responsible for the generation of third harmonics ( ω 1 = ω 2 = ω 3 ) . Typically, it is challenging to satisfy the phase-matching conditions that ensure the efficiency of these processes within an optical fiber. The terms containing θ in the equation correspond to the annihilation of two photons with frequencies ω 1 and ω 2 , concurrently generating two new photons with frequencies ω 3 and ω 4 , where:
ω 3 + ω 4 = ω 1 + ω 2
For this process, the phase-matching condition requires ∆k = 0, which is:
Δ k = β 3 + β 4 β 1 β 2 = ( n ˜ 3 ω 3 + n ˜ 4 ω 4 n ˜ 1 ω 1 n ˜ 2 ω 2 ) / c
In the equation, n ˜ j represents the effective modal refractive index at the frequency ω j .
As this paper focuses on degenerate FWM processes, the scenario where ω 1 = ω 2 is discussed. In this case, only one pump beam is required to initiate the FWM process. The strong pump light at frequency ω 1 generates two symmetric sidebands, with frequencies ω 3 and ω 4 . The frequency shift is given by:
Ω s = ω 1 ω 3 = ω 4 ω 1
In this situation, it is assumed that ω 3 < ω 4 . The provided diagram illustrates the fundamental principle of degenerate FWM. Assuming that the signal light and pump light have wavelengths corresponding to ω s and, respectively, when certain phase and frequency conditions are met, the superposition of these two beams creates a dynamic optical grating with a frequency of ωSF = ω1ω2. Under the influence of this grating, the two beams give rise to new optical frequencies: 2 ω p ω s and 2 ω s ω p . Among these, the light with a frequency of 2 ω p ω s constitutes the FWM signal, as shown in Figure 2.

3. Results

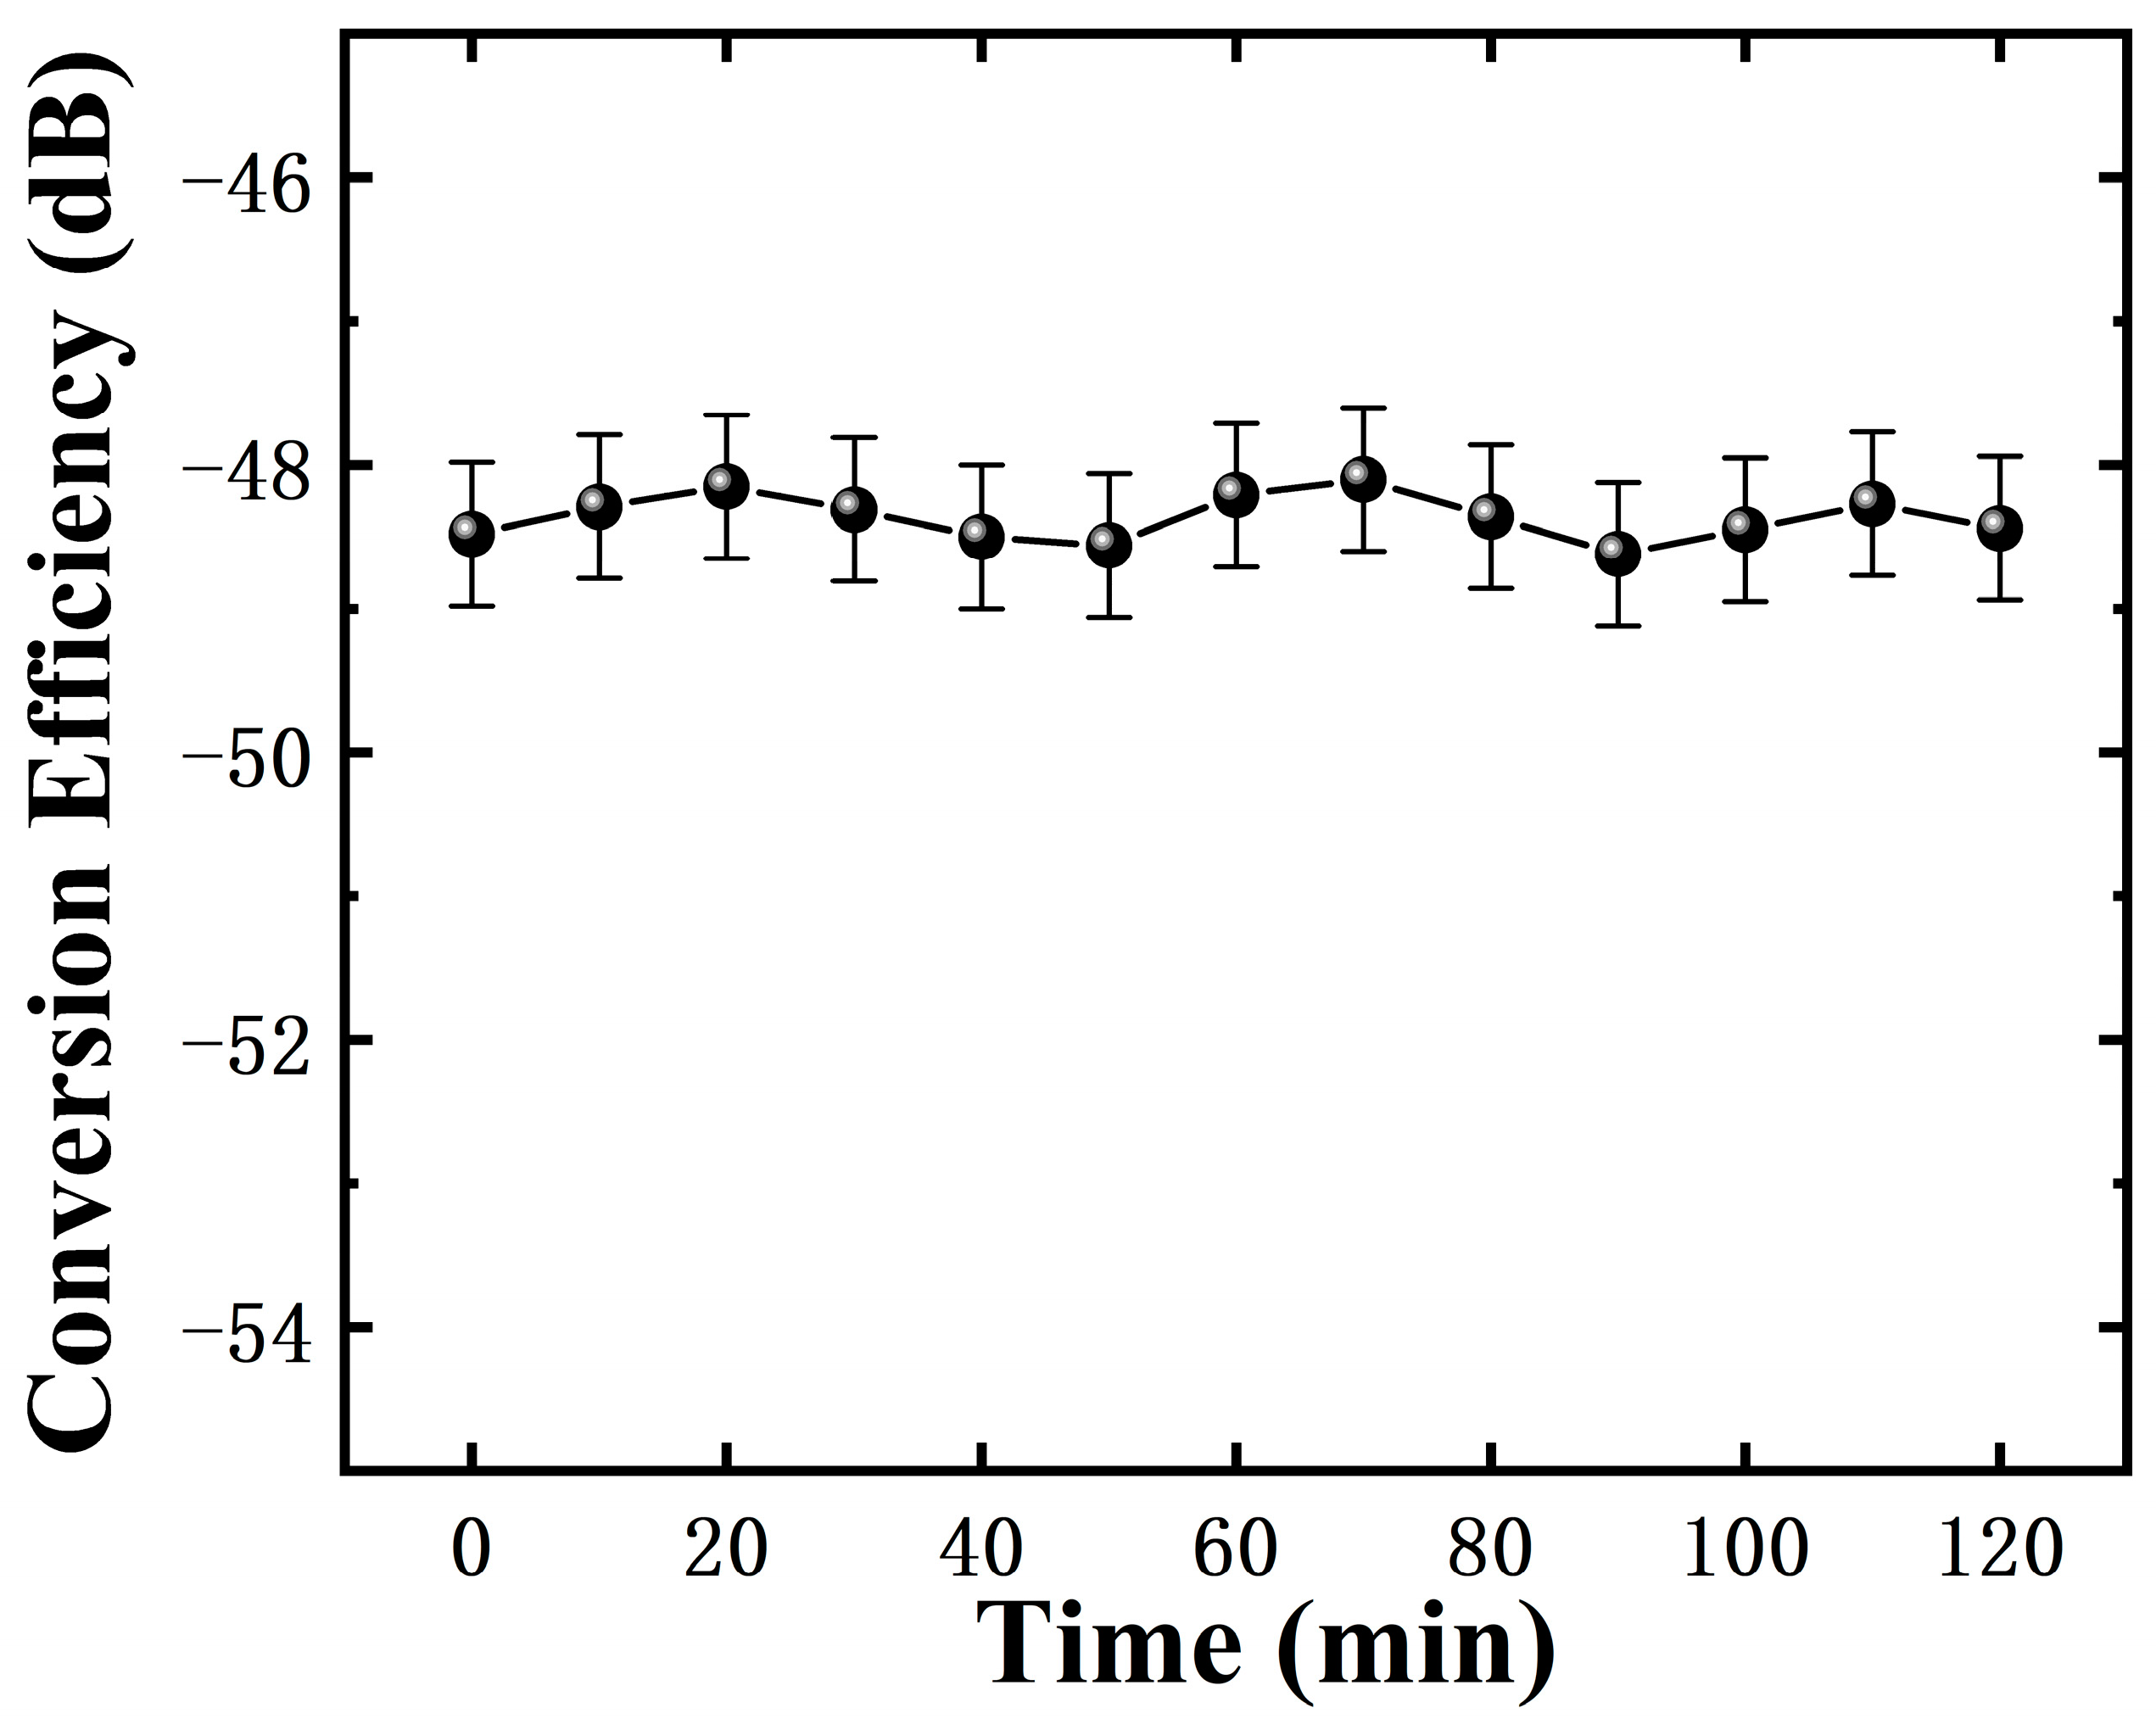
3.1. THM-Enhanced FWM

The experiment equipment of THM-enhanced FWM is shown in Figure 3; the signal light is emitted from a tunable external-cavity laser (ECL) with a fixed wavelength of 1551.32 nm. Following amplification, the output power of the signal light reached 23.5 dBm. The pump light, on the other hand, originates from another tunable ECL operating at a fixed wavelength of 1552.09 nm, and its output power after amplification measured 27.5 dBm. Given the higher output power of the pump light, it introduced a greater level of spontaneous emission noise. Therefore, it undergoes further processing through an optical bandpass filter (OBPF) to suppress this noise. The phenomenon of FWM is notably sensitive to polarization states. Consequently, the two light sources each traverse the polarization controller (PC) to finely adjust their respective polarization states. After this polarization manipulation, the two beams are guided through a 3 dB coupler before entering the THM. Ultimately, their combined output is directed to an optical spectrum analyzer (OSA), facilitating the observation and analysis of the generated optical spectra. The OSA used in the experiment has a resolution of 0.2 nm, which is the maximum achievable resolution of the OSA for obtaining accurate experimental data.
The experiment results are depicted in Figure 4, Figure 4a illustrates the output spectrum after its passage through the THM, while Figure 4b illustrates the output spectrum resulting from an equivalent length of single-mode optical fiber (SMF). In pursuit of optimal conversion efficiency, PCs were manipulated in both sets of experiments to achieve maximal intensity for the converted light. From Figure 4, it is evident that at the equivalent power of pump and signal, the wavelength conversion efficiency via the THM stands at −48.49 dB, while the wavelength conversion efficiency through the SMF reached only −52.95 dB. By way of comparison, it can be deduced that the wavelength conversion efficiency improves by 4.46 dB when the two beams undergo the THM; this observation unequivocally underscores the THM’s pronounced capability in augmenting the FWM effect.
We also investigated the relationship between conversion efficiency and wavelength detuning. As evident from Figure 5, the pump light remained fixed at a wavelength of 1552.09 nm, while the signal light’s wavelength gradually shifted from 1551.32 nm to 1546.52 nm at intervals of 0.4 nm. Notably apparent from Figure 5a is the gradual variation in the wavelength separation between the converted light and the pump light. Moreover, this wavelength separation between the converted light and the pump light consistently maintains parity with the wavelength separation between the signal light and the pump light. Additionally, as depicted in Figure 5b, there is a discernible decrease in the intensity of the converted light as the wavelength separation gradually expands.
To validate the stability of the all-optical wavelength converter, we monitored the variation curve of the wavelength conversion efficiency over a span of two hours. The wavelengths of the signal light and the pump light remain at 1551.32 nm and 1552.09 nm, respectively, with the signal light output power at 23.5 dBm and the pump light output power at 27.5 dBm. The results, as depicted in Figure 6, were obtained through recordings taken at ten-minute intervals during the course of the experiment. It is apparent that over the two hours, the wavelength conversion efficiency remained largely constant, underscoring the device’s notable stability.

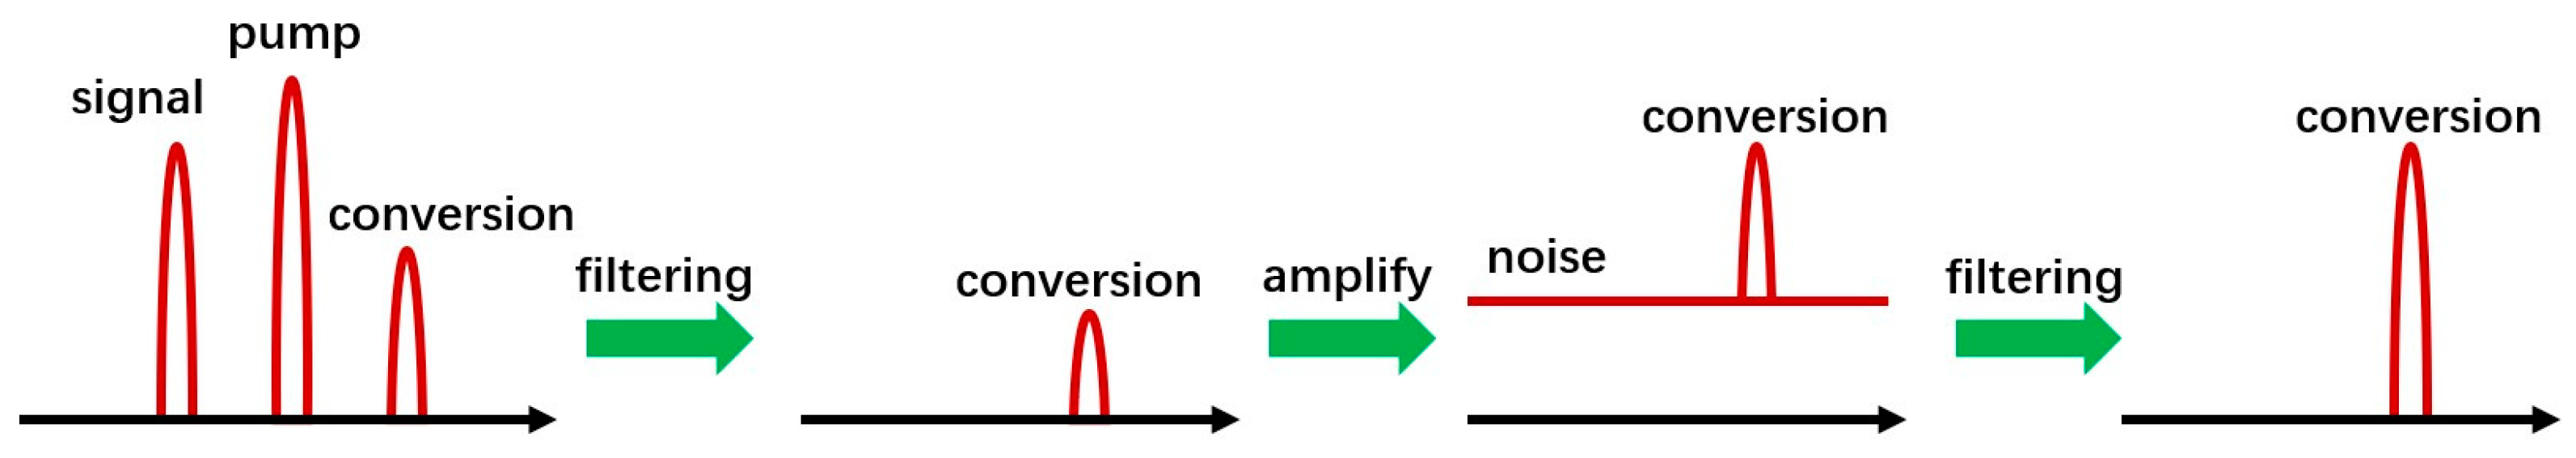
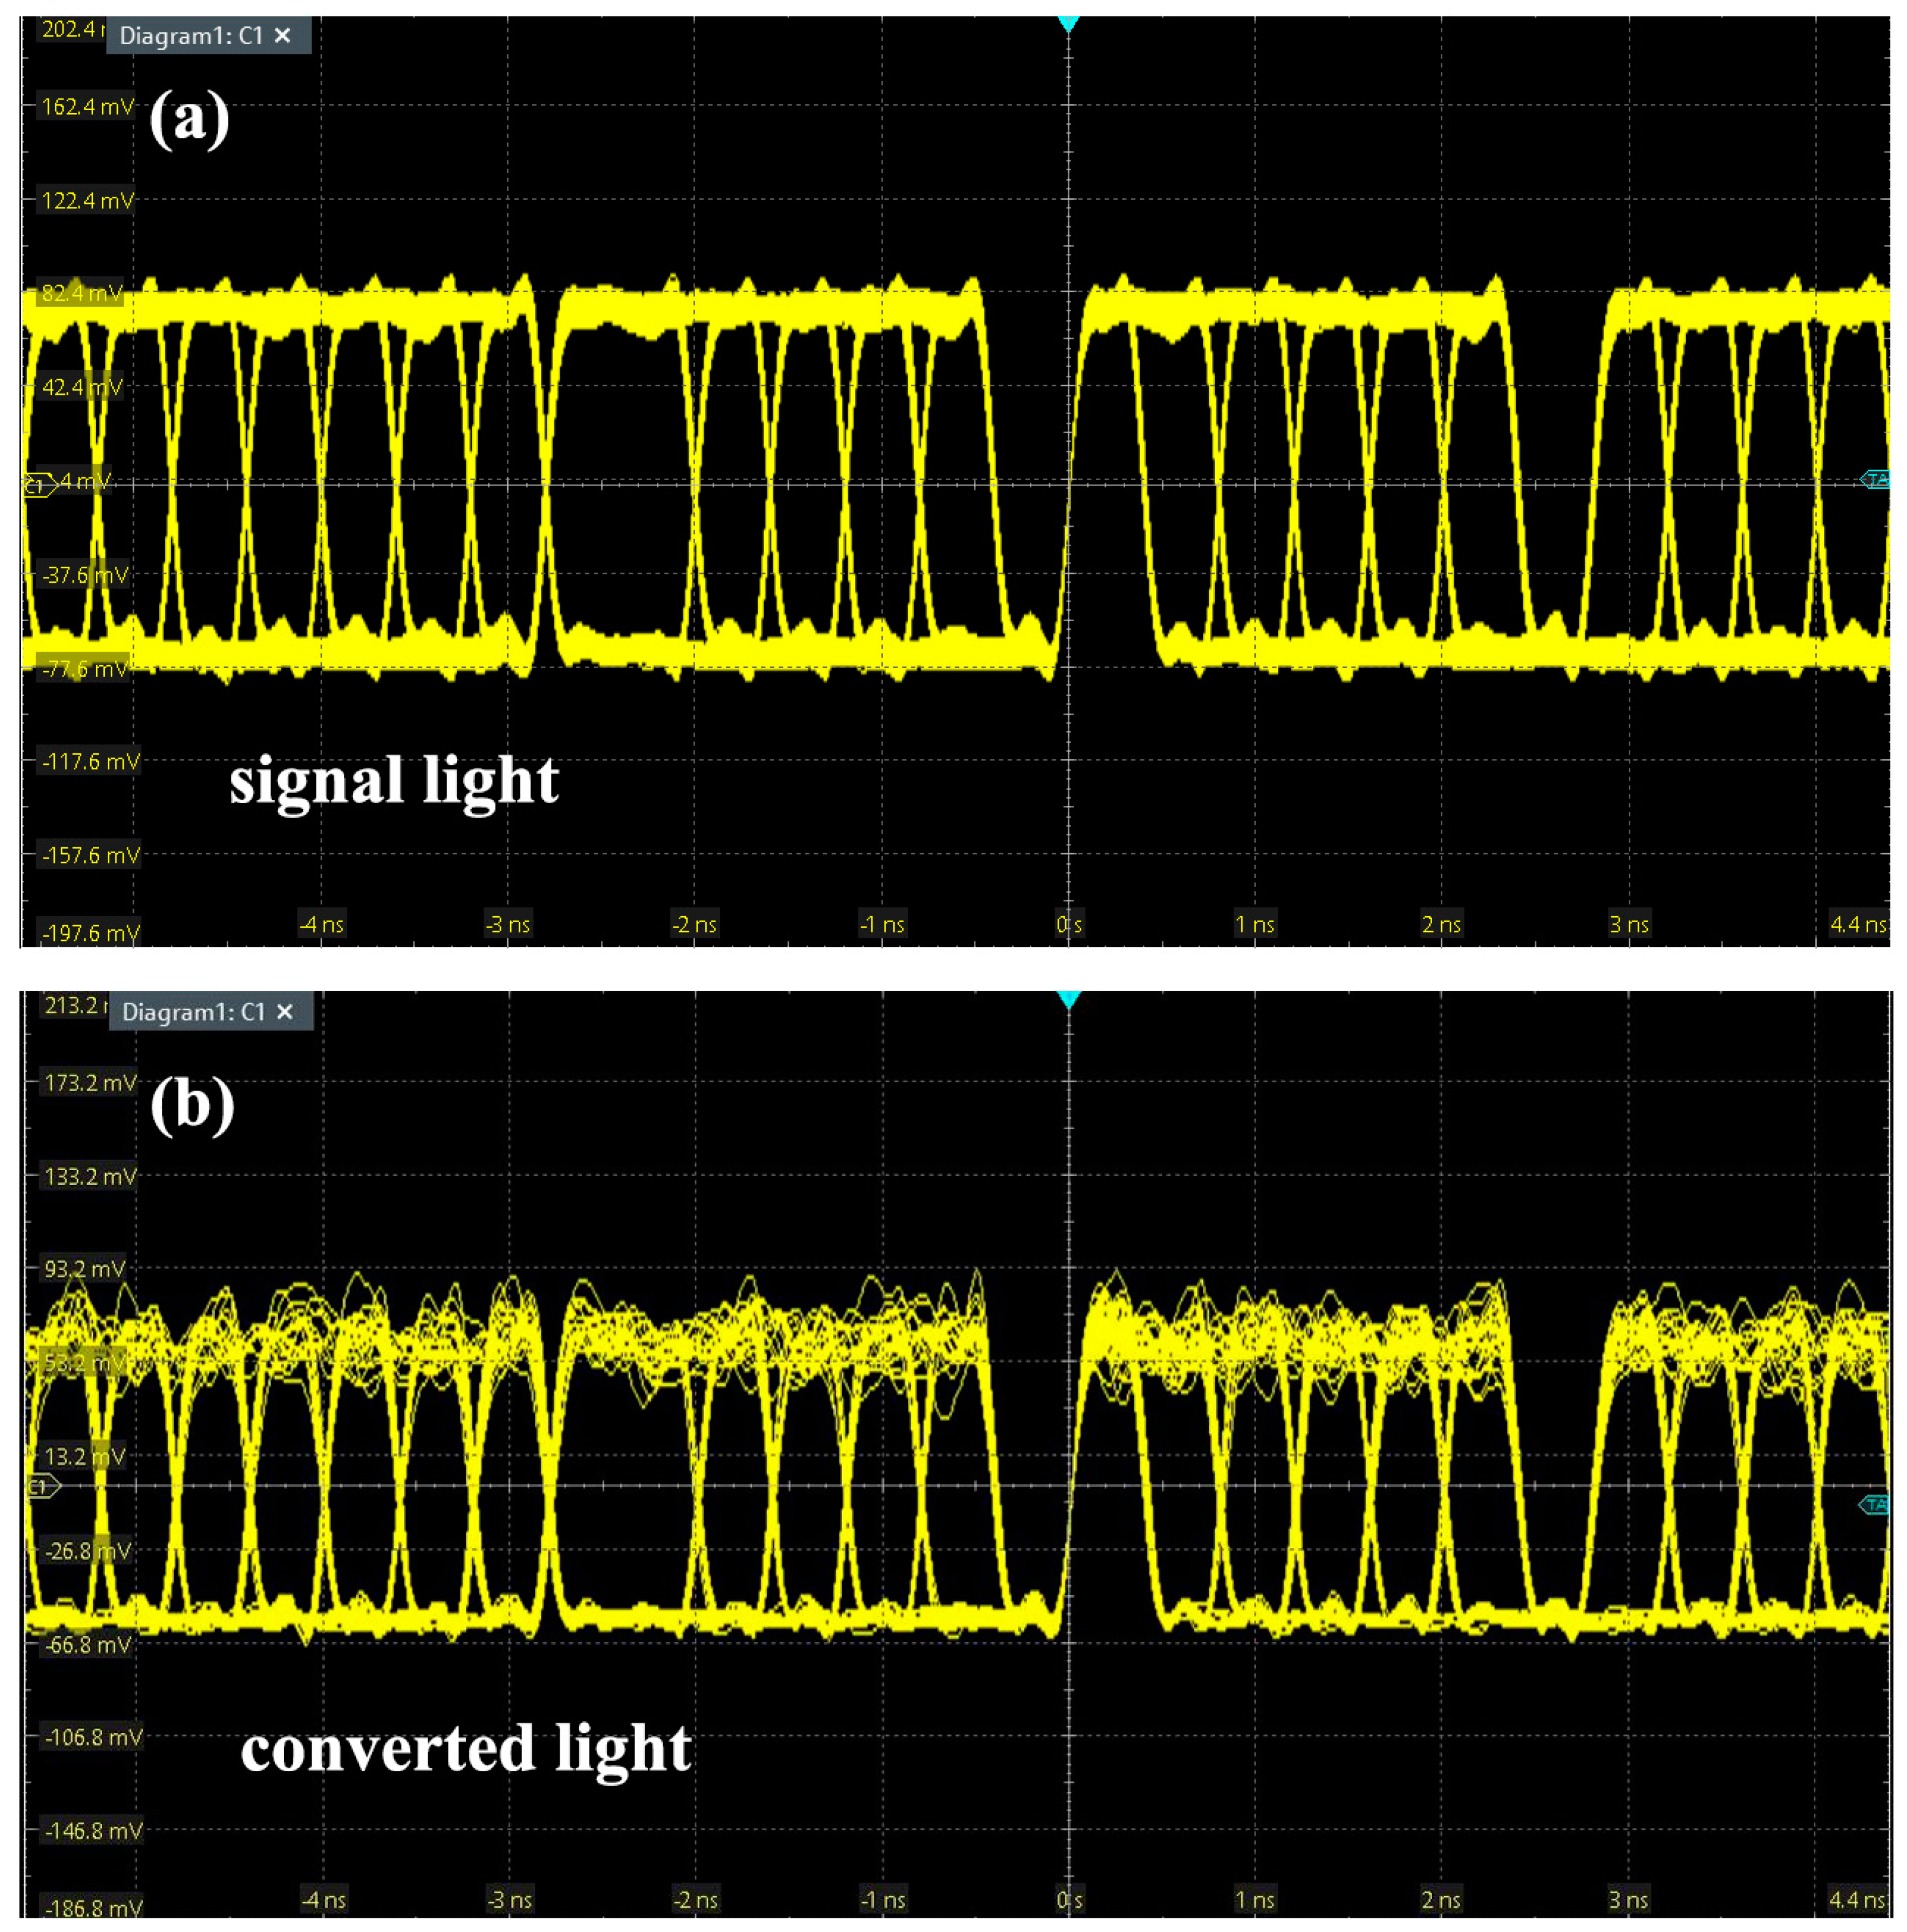
3.2. All-Optical Wavelength Converter with 10 GHz Modulation Frequency

To explore the performance of the THM-enhanced FWM wavelength converter in the context of all-optical communication, we devised a novel experiment with the experimental setup illustrated in Figure 7. The signal light, serving as the carrier, is emitted from a tunable ECL at a wavelength of 1550.91 nm. An RF signal generator is responsible for producing the RF signal, which is modulated onto the signal light using amplitude modulation within the modulator. The pump light is emitted from another tunable ECL with a wavelength of 1551.7 nm. To facilitate a more comprehensive observation of the spectral changes induced by modulation, a third amplifier is introduced at the output of the all-optical wavelength converter. Figure 8 shows the experimental results. Figure 8a depicts the output spectra of signal light with a modulation frequency of 10 GHz. From the graph, it can be observed that compared to the spectrum before modulation, the signal light’s spectrum undergoes noticeable changes after being modulated by a 10 GHz RF signal. Simultaneously, as can be observed from Figure 8b, corresponding alterations are evident in the converted light’s spectrum. This signifies the successful conversion of the signal light’s signal pattern onto the converted light. To investigate the impact of varying modulation frequencies on the spectra, we examined the spectral changes over modulation frequencies ranging from 0 to 10 GHz, as depicted in Figure 8c. It can be observed that as the modulation frequency decreases, the spectral variations induced by amplitude modulation also diminish. Figure 8e,f, respectively, illustrate the spectral variations in the signal light and the converted light concerning the modulation frequency. We further investigated the influence of modulation frequency on wavelength conversion efficiency, as depicted in Figure 8d. It is observed that as the modulation frequency progressively increases, there is no substantial alteration in the wavelength conversion efficiency.
Symbol error rate (SER) is a metric that measures the accuracy of data transmission within a specified time period. It holds a significant reference value for assessing the quality of communication. While spectral changes confirm the replication of bit data from the signal light to the converted light, the quality of the data signal needs to be reflected by the SER. To achieve this, we modified the RF signal to a pseudo-random sequence, using a non-return-to-zero (NRZ) signal with a PRBS7 code. Due to the relatively weak intensity of the converted light directly filtered at the output end, multiple stages of amplification and filtering are required, as illustrated in Figure 9. Firstly, we used an OBPF to extract the converted light. As the power of the converted light is low at this time, it is necessary to connect an EDFA to amplify the signal light. However, the amplified signal light may introduce high noise, so a second OBPF is connected to eliminate the noise caused by the EDFA. The pseudo-random sequence is modulated onto the signal light through a waveguide modulator, resulting in a modulated signal light waveform, as shown in Figure 10a, where the Baud of the signal light is 2.5 G symbols/s. The measured SER of the signal light at this point is 0, indicating that the modulator and light source are very stable and introduce virtually no errors. The modulated signal light is then input into the all-optical wavelength conversion system, with the wavelengths of the signal light and the pump light remaining at 1550.92 nm and 1551.7 nm, respectively. At this point, the wavelength of the converted light is 1552.52 nm. The waveform of the converted light is shown in Figure 10b, where it can be observed that, compared to the signal light, the converted light experiences slight distortion. This may be attributed to the introduction of noise by the multiple stages of amplification and a partial mismatch of the filters, leading to a decrease in the signal-to-noise ratio. At an output power of 16.4 mW for the converted light, we tested the SER at different bit rates, and the results are shown in Table 1. It can be observed that the SER of the converted light generally maintains at 10−4. With subsequent improvements, such as the introduction of filters that better match the input and converted light, it is expected to achieve an even lower SER.
The above results fully demonstrate the potential of THM as an all-optical wavelength converter, providing new ideas for the development of all-optical signal processing.

4. Conclusions

TiN/Ti3C2 heterojunction micro-particles were fabricated and experimentally characterized, confirming their favorable response and high stability within the communication wavelength range. Optical deposition was employed to deposit heterojunction micro-particles onto the surface of a microfiber with a diameter of 6 μm, resulting in the successful creation of an optically engineered structure with high nonlinearity. In the context of the FWM experiment based on this structure, a 4.48 dB enhancement in FWM wavelength conversion efficiency was observed compared to the use of a regular SMF. This outcome robustly substantiates the potential application of the TiN/Ti3C2 heterojunction in the domain of all-optical signal processing. Moreover, successful wavelength conversion of a 10 GHz radio frequency signal was achieved using THM. This conversion led to a notable change in the spectral profile of the converted light, effectively transferring the signal from the original signal wavelength to a new one. Simultaneously, the SER at different Baud was also tested. The results indicate that the SER of the converted light generally remains at 10−4.

Author Contributions

Conceptualization, K.W. and Q.-D.L.; data curation, Q.-D.Z., Y.-Y.Z. and B.Z.; formal analysis, Q.-D.L. and Z.-H.W.; funding acquisition, K.W., Z.-H.W. and Y.-F.S.; investigation, K.W., Q.-D.L. and Y.-F.S.; methodology, K.W., Q.-D.L., Y.-F.S., Q.-D.Z., Y.-Y.Z. and Z.-H.W.; project administration, K.W.; resources, Y.-Y.Z. and B.Z.; software, Q.-D.L.; writing—original draft, K.W. and Q.-D.L.; writing—review and editing, Z.-H.W., Y.-F.S. and B.Z. All authors have read and agreed to the published version of the manuscript.

Funding

This research was funded by the National Natural Science Foundation of China (grant no. 52203335, 62005178), Natural Science Foundation of Guangdong Province (grant no. 2023A1515010093, 2020A1515110749), and Shenzhen Funda-Mental Research Program (grant no. KCXFZ20201221173413038, JCYJ20190808112401659, JCYJ20190808143611709, JCYJ20200109105216803 and JCYJ20220809170611004).

Institutional Review Board Statement

Not applicable.

Informed Consent Statement

Not applicable.

Data Availability Statement

Not applicable.

Conflicts of Interest

The authors declare no conflict of interest.

References

  1. Valenti, A. Experimental investigation of quality of service in an IP all-optical network adopting wavelength conversion. J. Opt. Commun. Netw. 2009, 1, 170–179. [Google Scholar] [CrossRef]
  2. Yang, Y.T.; Duan, M.; Lin, J.M.; Wang, Z.H.; Wang, K.; Ji, J.H.; Song, Y.F. Graphene-enhanced polarization-insensitive all-optical wavelength conversion based on four-wave mixing. Opt. Express 2022, 30, 10168–10177. [Google Scholar] [CrossRef] [PubMed]
  3. Wang, C.; Yang, S.; Duan, M.; Wang, Z.C.; Zhou, R.L.; Song, Y.F. Two-Dimensional Nonlinear Material MXene-Enhanced All-Optical Wavelength Converter. Acta Opt. Sin. 2021, 41, 1419001. [Google Scholar]
  4. Rocha, P.; Sutili, T.; Rossi, S.M.; Gallep, C.M.; Figueiredo, R.C.; Conforti, E. 32-GBd 16QAM Optical Signals Wavelength Conversion Based on Four-Wave Mixing Phenomena in Semiconductor Optical Amplifiers. In Proceedings of the 2021 SBFoton International Optics and Photonics Conference (SBFoton IOPC), Sao Carlos, Brazil, 31 May 2021–2 June 2021; pp. 1–4. [Google Scholar]
  5. Chow, K.K.; Shu, C.; Chinlon, L.; Bjarklev, A. Polarization-insensitive widely tunable wavelength converter based on four-wave mixing in a dispersion-flattened nonlinear photonic Crystal fiber. IEEE Photonics Technol. Lett. 2005, 17, 624–626. [Google Scholar] [CrossRef]
  6. Andersen, P.A.; Tokle, T.; Geng, Y.; Peucheret, C.; Jeppesen, P. Wavelength conversion of a 40-Gb/s RZ-DPSK signal using four-wave mixing in a dispersion-flattened highly nonlinear photonic crystal fiber. IEEE Photonics Technol. Lett. 2005, 17, 1908–1910. [Google Scholar] [CrossRef]
  7. Zhang, A.; Demokan, M.S. Broadband wavelength converter based on four-wave mixing in a highly nonlinear photonic crystal fiber. Opt. Lett. 2005, 30, 2375–2377. [Google Scholar] [CrossRef]
  8. Novoselov, K.S.; Geim, A.K.; Morozov, S.V. Electric Field Effect in Atomically Thin Carbon Films. Science 2004, 306, 666–669. [Google Scholar] [CrossRef]
  9. Wu, Y.; Yao, B.; Cheng, Y. Four-Wave Mixing in a Microfiber Attached Onto a Graphene Film. IEEE Photonics Technol. Lett. 2014, 26, 249–252. [Google Scholar] [CrossRef]
  10. Xu, M.S.; Liang, T.; Shi, M.M.; Chen, H.Z. Graphene-Like Two-Dimensional Materials. Chem. Rev. 2013, 113, 3766–3798. [Google Scholar] [CrossRef]
  11. Castro Neto, A.H.; Novoselov, K. Two dimensional crystals: Beyond graphene. Mater. Express 2011, 1, 10–17. [Google Scholar] [CrossRef]
  12. Mas-Balleste, R.; Gomez-Navarro, C.; Gomez-Herrero, J.; Zamora, F. 2D materials: To graphene and beyond. Nanoscale 2011, 3, 20–30. [Google Scholar] [CrossRef]
  13. Ataca, C.; Sahin, H.; Ciraci, S. Stable, Single-Layer MX2 Transition-Metal Oxides and Dichalcogenides in a Honeycomb-Like Structure. J. Phys. Chem. C 2012, 116, 8983–8999. [Google Scholar] [CrossRef]
  14. Zhang, H.; Liu, C.; Qi, X.; Dai, X.; Fang, Z.; Zhang, S. Topological insulators in Bi2Se3, Bi2Te3 and Sb2Te3 with a single Dirac cone on the surface. Nat. Phys. 2009, 5, 438–442. [Google Scholar] [CrossRef]
  15. Mak, K.F.; Lee, C.; Hone, J.; Shan, J.; Heinz, T.F. Atomically thin MoS2: A new direct-gap semiconductor. Phys. Rev. Lett. 2010, 105, 136805. [Google Scholar] [CrossRef]
  16. Wang, Q.H.; Kalantar-Zadeh, K.; Kis, A.; Coleman, J.N.; Strano, M.S. Electronics and optoelectronics of two-dimensional transition metal dichalcogenides. Nat. Nanotechnol. 2012, 7, 699–712. [Google Scholar] [CrossRef]
  17. Zuo, Y.; Yu, W.; Liu, C. Optical fibres with embedded two-dimensional materials for ultrahigh nonlinearity. Nat. Nanotechnol. 2020, 15, 987–991. [Google Scholar] [CrossRef] [PubMed]
  18. Li, Y.; Rao, Y.; Mak, K.F. Probing symmetry properties of few-layer MoS2 and h-BN by optical second-harmonic generation. Nano Lett. 2013, 13, 3329–3333. [Google Scholar] [CrossRef] [PubMed]
  19. Liu, X.; Guo, Q.; Qiu, J. Emerging Low-Dimensional Materials for Nonlinear Optics and Ultrafast Photonics. Adv. Mater. 2017, 29, 1605886. [Google Scholar] [CrossRef]
  20. Chen, S.; Miao, L.; Chen, X.; Chen, Y.; Zhao, C.; Datta, S.; Li, Y.; Bao, Q.; Zhang, H.; Liu, Y.; et al. Few-Layer Topological Insulator for All-Optical Signal Processing Using the Nonlinear Kerr Effect. Adv. Opt. Mater. 2015, 3, 1769–1778. [Google Scholar] [CrossRef]
  21. Zheng, J.L.; Yang, Z.H.; Si, C.; Liang, Z.M.; Chen, X.; Cao, R.; Guo, Z.N.; Wang, K.; Zhang, Y.; Ji, J.H.; et al. Black Phosphorus Based All-Optical-Signal-Processing: Toward High Performances and Enhanced Stability. ACS Photonics 2017, 4, 1466–1476. [Google Scholar] [CrossRef]
  22. Wang, K.; Chen, Y.X.; Zheng, J.L.; Ge, Y.Q.; Ji, J.H.; Song, Y.F.; Zhang, H. Black phosphorus quantum dot based all-optical signal processing: Ultrafast optical switching and wavelength converting. Nanotechnology 2019, 30, 415202. [Google Scholar] [CrossRef] [PubMed]
  23. Island, J.O.; Steele, G.A.; van der Zant, H.S.J.; Castellanos-Gomez, A. Environmental instability of few-layer black phosphorus. 2D Mater. 2015, 2, 011002. [Google Scholar] [CrossRef]
  24. Shao, P.Z.; Zhao, H.M.; Cao, H.W.; Wang, X.F.; Pang, Y.; Li, Y.X.; Ren, T.L. Enhancement of carrier mobility in MoS2 field effect transistors by a SiO2 protective layer. Appl. Phys. Lett. 2016, 108, 203105. [Google Scholar] [CrossRef]
  25. Xia, F.; Farmer, D.B.; Lin, Y.M.; Avouris, P. Graphene field-effect transistors with high on/off current ratio and large transport band gap at room temperature. Nano Lett. 2010, 10, 715–718. [Google Scholar] [CrossRef]
  26. Wang, K.; Liu, Q.D.; Wang, Z.H.; Song, Y.F.; Huang, H.M.; Fan, N.; Wang, Y.J.; Zhang, B. TiN/ Ti3C2 heterojunction-based photonic device for optical Kerr switch. RSC Adv. 2023, 13, 24649. [Google Scholar] [CrossRef]
Figure 1. THM was observed under a microscope.
Photonics 10 01066 g001
Figure 2. Schematic diagram of FWM.
Photonics 10 01066 g002
Figure 3. The experiment equipment of THM-enhanced FWM. (ECL: tunable external-cavity laser; EDFA: erbium-doped fiber amplifier; OBPF: optical bandpass filter; PC: polarization controller; THM: TiN/Ti3C2 heterojunction-coated microfiber; OSA: optical spectrum analyzer).
Photonics 10 01066 g003
Figure 4. The output spectra of FWM: (a) with THM; (b) with SMF.
Photonics 10 01066 g004
Figure 5. (a) The spectra of the relationship between conversion efficiency and wavelength detuning. (b) Conversion efficiency against wavelength detuning.
Photonics 10 01066 g005
Figure 6. Change curve of wavelength conversion efficiency within two hours when the wavelength of signal light is 1550 nm and the wavelength of pump light is 1551 nm.
Photonics 10 01066 g006
Figure 7. The experiment equipment of all-optical wavelength converter with 10 GHz modulation frequency. (ECL: tunable external-cavity laser; RF: radio frequency; EDFA: erbium-doped fiber amplifier; OBPF: optical bandpass filter; PC: polarization controller; THM: TiN/Ti3C2 heterojunction-coated microfiber; OSA: optical spectrum analyzer).
Photonics 10 01066 g007
Figure 8. (a) Output spectra of signal light with 10 GHz modulation frequency. (b) Output spectra of converted light with 10 GHz modulation frequency. (c) The output spectra variation diagram for modulation frequencies ranging from 0 to 10 GHz. (d) The relationship curve between different modulation frequencies and wavelength conversions. (e) The output spectra of signal light variation diagram for modulation frequencies ranging from 0 to 10 GHz. (f) The output spectra of converted light variation diagram for modulation frequencies ranging from 0 to 10 GHz.
Photonics 10 01066 g008
Figure 9. Apply multi-stage filtering and amplification to the converted light.
Photonics 10 01066 g009
Figure 10. (a) The waveform of signal light with 2.5G Baud. (b) The waveform of converted light with 2.5G Baud.
Photonics 10 01066 g010
Table 1. When the output power of the converted light is 16.4 mW, the corresponding SER is at different Baud.
Baud1.25G2.5G5G6G8G
BER3.3 × 10−43 × 10−42.8 × 10−42.7 × 10−42.1 × 10−4
Disclaimer/Publisher’s Note: The statements, opinions and data contained in all publications are solely those of the individual author(s) and contributor(s) and not of MDPI and/or the editor(s). MDPI and/or the editor(s) disclaim responsibility for any injury to people or property resulting from any ideas, methods, instructions or products referred to in the content.

